Measuring urban growth dynamics: A study in Hue city, Vietnam
-
Nguyen Tran Tuan


Abstract
The proliferation of urban sprawl has emerged as a prevalent occurrence in response to the rapid expansion of the worldwide population. The objective of this study is to determine the level of freedom for urban expansion using Pearson’s Chi-square (χ2) index and the amount of urban spatial dispersion using the Shannon entropy (
1 Introduction
Socio-economic development in each country always requires improving the quality of life, raising per capita income, and significantly improving the quality of urbanization [1,2]. Increasing the rate of urbanization means a shift of labor from rural areas to cities [3]. Therefore, this shift helps people have the opportunity to find jobs with higher incomes [4]. This promotes production and consumption activities. Ultimately, it promotes the country’s economic growth. When a country has a high rate of urbanization, it is often a country with high-income levels, high spending levels, and developed manufacturing activities [5]. On the contrary, a country with a low urbanization rate often has lower income levels, where production and consumption activities are not developed [3].
Over the past five decades, Asia has undergone enormous demographic changes [6]. One of the most notable transformations observed in recent times is the migration of individuals from rural areas to urban centers [7]. The urbanization rate in Asia, as a proportion of the overall population, is seeing significant growth. In the year 1950, the urban population in Asia amounted to approximately 232 million individuals, constituting approximately 17% of the total population of the continent [8]. In the year 2005, the urban population of Asia experienced a significant increase, reaching a total of 1.6 billion individuals, which accounted for almost 40% of the overall population in the region [9]. There is little doubt that the Asian region will experience ongoing development, leading to a notable rise in urbanization levels. Based on projections provided by the United Nations, it is anticipated that by the year 2025, over 50% of Asia’s population will reside in urban regions, with a growth rate of 2.5% annually [10]. It is projected that by the year 2030, around 54.5% of the people in Asia will have transitioned to urban areas. By the year 2030, it is projected that Asia would be home to half of the urban population, indicating that one out of every two urban dwellers will reside in this region [10].
Because of the tremendous increase in the number of people living in the world, urban sprawl is becoming a regular phenomenon [11]. Many researchers have pointed out the impacts of urban sprawl in different directions. Sociologists believe that urban sprawl has increased inequality between urban and suburban residents [12,13]. It can refer to the impact of land use separate from public distribution and services such as schools, medical facilities, and entertainment [14]. In this context, social vulnerability can be observed in suburban areas lacking adequate social infrastructure [15]. Economists suggest that urban sprawl is responsible for decreasing agricultural land values in places where growth occurs [16,17]. Urban expansion will determine higher transportation costs due to increased daily commuting [18,19]. Land conversion related to suburban development and changes in land use also cause real estate prices to increase rapidly [20,21]. On the other hand, biologists say that urban expansion has had a negative impact on biodiversity, thereby degrading the natural habitats of some species [22,23,24]. Urban sprawl is also linked to energy, air pollution, and climate change issues [25,26]. Changes in land cover also led to reduced CO2 uptake due to vegetation removal [27,28]. Several studies have used indicators to measure urban sprawl. Landscape expansion index is an index that analyzes urban growth types, in which each new urban segment is classified into one of the recognized growth types. This index provides a deeper understanding of landscape change processes [29]. Another study by Santos et al. [30] determined the change based on two indicators: Building density and built volume density. These indicators consider changes in the number and volume of new and demolished buildings. The building density index was also used in the study by Zhu et al. [31]. Another index that has been applied by many studies is Shannon [32,33].
In Vietnam, urban development and growth are slower than in some countries in the region and are characterized by rural urbanization [34], where villages and agricultural communities were transformed into districts and wards [35]. Urban development is uneven across regions, with delta and coastal areas developing faster than mountainous and highland areas [36]. In big cities, there is a tendency to expand space from the urban core to the periphery. However, in Vietnam, there have not been many studies to measure urban growth, so the two research questions that this study will attempt to address are:
– What is the degree of freedom for urban growth in Vietnam?
– How dispersed are the urban areas in the research area?
The research has already been conducted in Hue (the ancient capital of Vietnam from 1802 to 1945). In Section 2, the study will give an overview of the data on the urban sprawl situation in some countries around the world, followed by the research method of this article Section 3. In the research direction, the author briefly introduces the geographical location of the research area and the indicators that need to be calculated in this study. They consist of the Shannon entropy (
2 Urban sprawl in some countries around the world: Literature review
Urban sprawl impacts land management and use in different countries and regions differently due to different levels of urban expansion, urbanization rates, and natural, economic, and social conditions [37,38]. From 1990 to 2014, urban land grew by 95.2%, equivalent to a growth rate of 4% per year. Europe witnessed the most vigorous urban expansion, with 51%, followed by Southeast Asia and West Africa [39]. By 2030, it is anticipated that this expansion will add 1.2 million km2 of new urban land. The worldwide urban land area, in 2000, was tripled by this increase [40]. Meanwhile, the highest urban expansion per capita rates occur in Oceania and North America. In contrast, South America observed a slight decrease in urban expansion rates [39]. In addition, the density in cities in developing countries was about three times higher than in developed industrial cities. Density in all regions is also decreasing over time. Therefore, if the average density continues to decrease at a rate of 1.7% annually, the construction area in developing countries will increase from 200,000 km2 to over 600,000 km2 after 30 years (2000–2030) [41].
Also, according to the study of Behnisch et al. [39], the growth in urban development rates was greatest in several European countries such as the Netherlands, Portugal, Luxemburg, and Germany. These countries are followed by several countries in Asia, America, and Africa, such as Japan, China, South Africa, and the United States. In particular, China and many other Asian countries are expected to face much pressure from urban land expansion after the 2050s [42]. Therefore, in the following paragraphs, the author will review the current situation of urban land expansion in some of the above countries. Furthermore, an estimated 1.8–2.4% of the world’s arable land area would be lost by 2030 due to urban land expansion, which also resulted in a loss of 3–4% of worldwide agricultural production in 2000. In particular, Asia and Africa will lose up to 80% of arable land due to urban expansion. This urban expansion will likely continue on productive cropland at a rate of 1.77 times the global average [43]. By 2050, about 50–63% of urban land is forecast to expand on current cropland [42].
China is one of the countries with relatively large urban growth in the world [39]. Since the beginning of the opening-up and reform policy in the late 1970s, China’s urbanization level has increased rapidly from 17.4 to 60.6% between 1970 and 2019. This level is forecast to grow to 72% in 2030 and over 90% in 2050 [44]. The strong wave of urban expansion in China began in the 2000s [45]. Many studies have also shown that urbanization has increased the urban construction land area nearly five times, with an average annual rate of 8.1% from 1992 to 2015 [46]. It contributed to a severe decline in arable land area, specifically arable land area decreased by 4.1 million hectares (1996–2002), corresponding to 3.6% per year [47]. Besides, the loss rate of arable land in the Eastern region of China in 1995–2000 and 2000–2008 was 7 and 29.2%, respectively [48]. However, in the first two decades of the twenty-first century, although agricultural land in China still tends to decrease, the speed gradually decreases. Specifically, in 2000–2010, it is 2.91%, and in 2010–2020, it is 0.41% [49]. To have land for urban development purposes, China also implemented mandatory land acquisition for 30% of households (with a portion of land) in 2018 [50]. 53,700 km2 is the agricultural land in China occupied for urban expansion from 1980–2020 [45]. Therefore, to limit the decline in arable land and increase labor productivity due to the impact of urban expansion, the Chinese government has introduced many policies, such as the State protecting and strictly controlling the conversion of farmland to other purposes.
The urban sprawl wave originated in the USA from migration to the suburbs in the 1950s [51]. According to Habibi and Asadi [12], land consumption in urban areas with more than one million inhabitants rose from 161 to 243 and 293 sq mi per 1,000 people over the years 1950, 1970, and 1990, respectively. The land available for urban and construction purposes increased by 34% from 1986 to 1997 [52]. It is projected that urban land in the USA will rise from 3.1 to 8.1% in 2000–2050, covering a total area of 392,400 km2. This region covers an area that is considerably greater than Montana. Additionally, it is anticipated that Massachusetts (61%), Rhode Island (70.5%), Connecticut (60.9%), and New Jersey (63.6%) will each have more than half of the total urban land. Over a broader period, between 1 and 1.4 million acres (4046.856 and 5665.599 km2) of urban land will be added per year in the United States of America between the years 1997 and 2060 [53]. Urban land expansion also reduces the area of other types of land, in which the area of forest land and cropland is often changed. Forest resources are expected to lose 26 million acres (105218.3 km2) to urban uses and development by 2030 [54]. Agricultural land was converted to urban land by 16.3 million acres (65963.76 km2) from 1992 to 2002. In the next 10 years (2002–2012), this number was nearly 15 million acres (60702.85 km2). What is alarming is that this loss includes 11 million acres (44515.42 km2) of prime land for intensive food and crop production [55]. One forecast is that from 2016 to 2040, 18.4 million acres (74462.16 km2) of agricultural land will be converted. Of these, around 6.2 million acres (25,090 km2) of agricultural land would have been transformed into urban land, including industrial parks, commercial structures, and high-density residential areas; 12.2 million acres (49371.65 km2) are devoted to low-density residential areas [56].
With approximately 78% of its population residing in urban areas, Germany, a country situated in Central Europe, has also experienced an urban expansion over the last quarter-century [57]. Within 50 years (1950–2000), urban land in the West German region nearly doubled from 7 to 13.8% [58]. Besides, agricultural land use has continuously decreased since unification, and agriculture seems to be increasingly squeezed by different land use needs, including urban expansion [59]. In 2002, Germany proposed a strategy called “Perspectives for Germany,” and one of the goals of this strategy was to reduce the rate of conversion of non-urban land use to urban land from 130 hectares to 30 hectares per day from 2000–2020 [60]. However, this goal does not seem to be effective, and it is said that there should be a clear delineation between state goals [61]. The German Farmers’ Association reports that the loss of agricultural land is still about 70 ha per day [59]. In Nürnberg (Nuremberg), within 15 years, from 2004 to 2018, 2.7% of agricultural land was converted for settlement and infrastructure development [62]. In Berlin, the population is expected to increase by 180,000 people from 2017 to 2030 and reach 3.96 million in 2040. To address the housing demand of approximately 27% in 2030, the Berlin city government intends to construct 16 new urban areas comprising nearly 52,000 residences [63].
As seen by the literature review above, land use patterns are altered by urbanization and expansion in every nation. In particular, the land area converted for infrastructure and urban development comes mainly from agricultural land. Consequently, the depletion of arable land may give rise to additional sustainability hazards and jeopardize the livelihoods of individuals; thus, effective policies are required to regulate urban expansion. In other words, gradually reducing agricultural land area is a significant challenge for food security at local, regional, and global scales. Thus, it is necessary to change how land is used to limit the conversion of land use purposes and apply effective land use methods.
3 Materials and methodology
3.1 Study area
Vietnam has a favorable geographical location, located in the center of Southeast Asia, a bridge between East and West cultures. With a long coastline and many bays and islands, Vietnam has great potential to develop the marine economy. In addition, Vietnam also has many rivers and lakes creating beautiful natural landscapes and is rich in natural resources. Vietnam’s terrain is diverse, including plains, hills, and plateaus. The Red River Delta is the largest delta in Vietnam, accounting for about 1/3 of the country’s land area. Mountains account for about ¾ of Vietnam’s land area, distributed in the north, west, and south. The plateau accounts for about 1/10 of Vietnam’s land area, concentrated in the north and south. In addition, Vietnam also has many diverse ecosystems, from tropical forests, temperate forests, deserts to swamps and deltas. This has created a rich habitat for animals and plants and is also an attraction for nature-loving tourists.
Located in the center of the country and the central critical economic region, Hue City has been identified by the Central Government as a class I urban area under Thua Thien Hue province (Figure 1). Hue is one of 19 class I urban areas directly under the province in Vietnam. It is oriented to develop into a grade I urban area directly under the central government by 2045. Therefore, this research conducted in Hue is also seen as scientific evidence for planners with orientation in development, and is an example for other large cities on the path to urban upgrading. This city is also located in the north-south axis and near the East-West corridor of the Trans-Asia route. Therefore, Hue has much potential for development in economic and trade exchange. In particular, Hue City is the last feudal capital of Vietnam, which has a long history and cultural tradition with unique values and identity. Therefore, Hue is determined to be the place to preserve, conserve, and develop the heritage, monuments, and culture of Thua Thien Hue province. Besides, the city converges terrain types such as hills, plains, rivers, and lakes. This creates an ideal natural-urban-cultural landscape space to organize various festivals and sports tourism activities. In other words, Hue is known as the festival city of Vietnam. Therefore, Hue City is in a location with rich and diverse natural conditions and ecosystems.
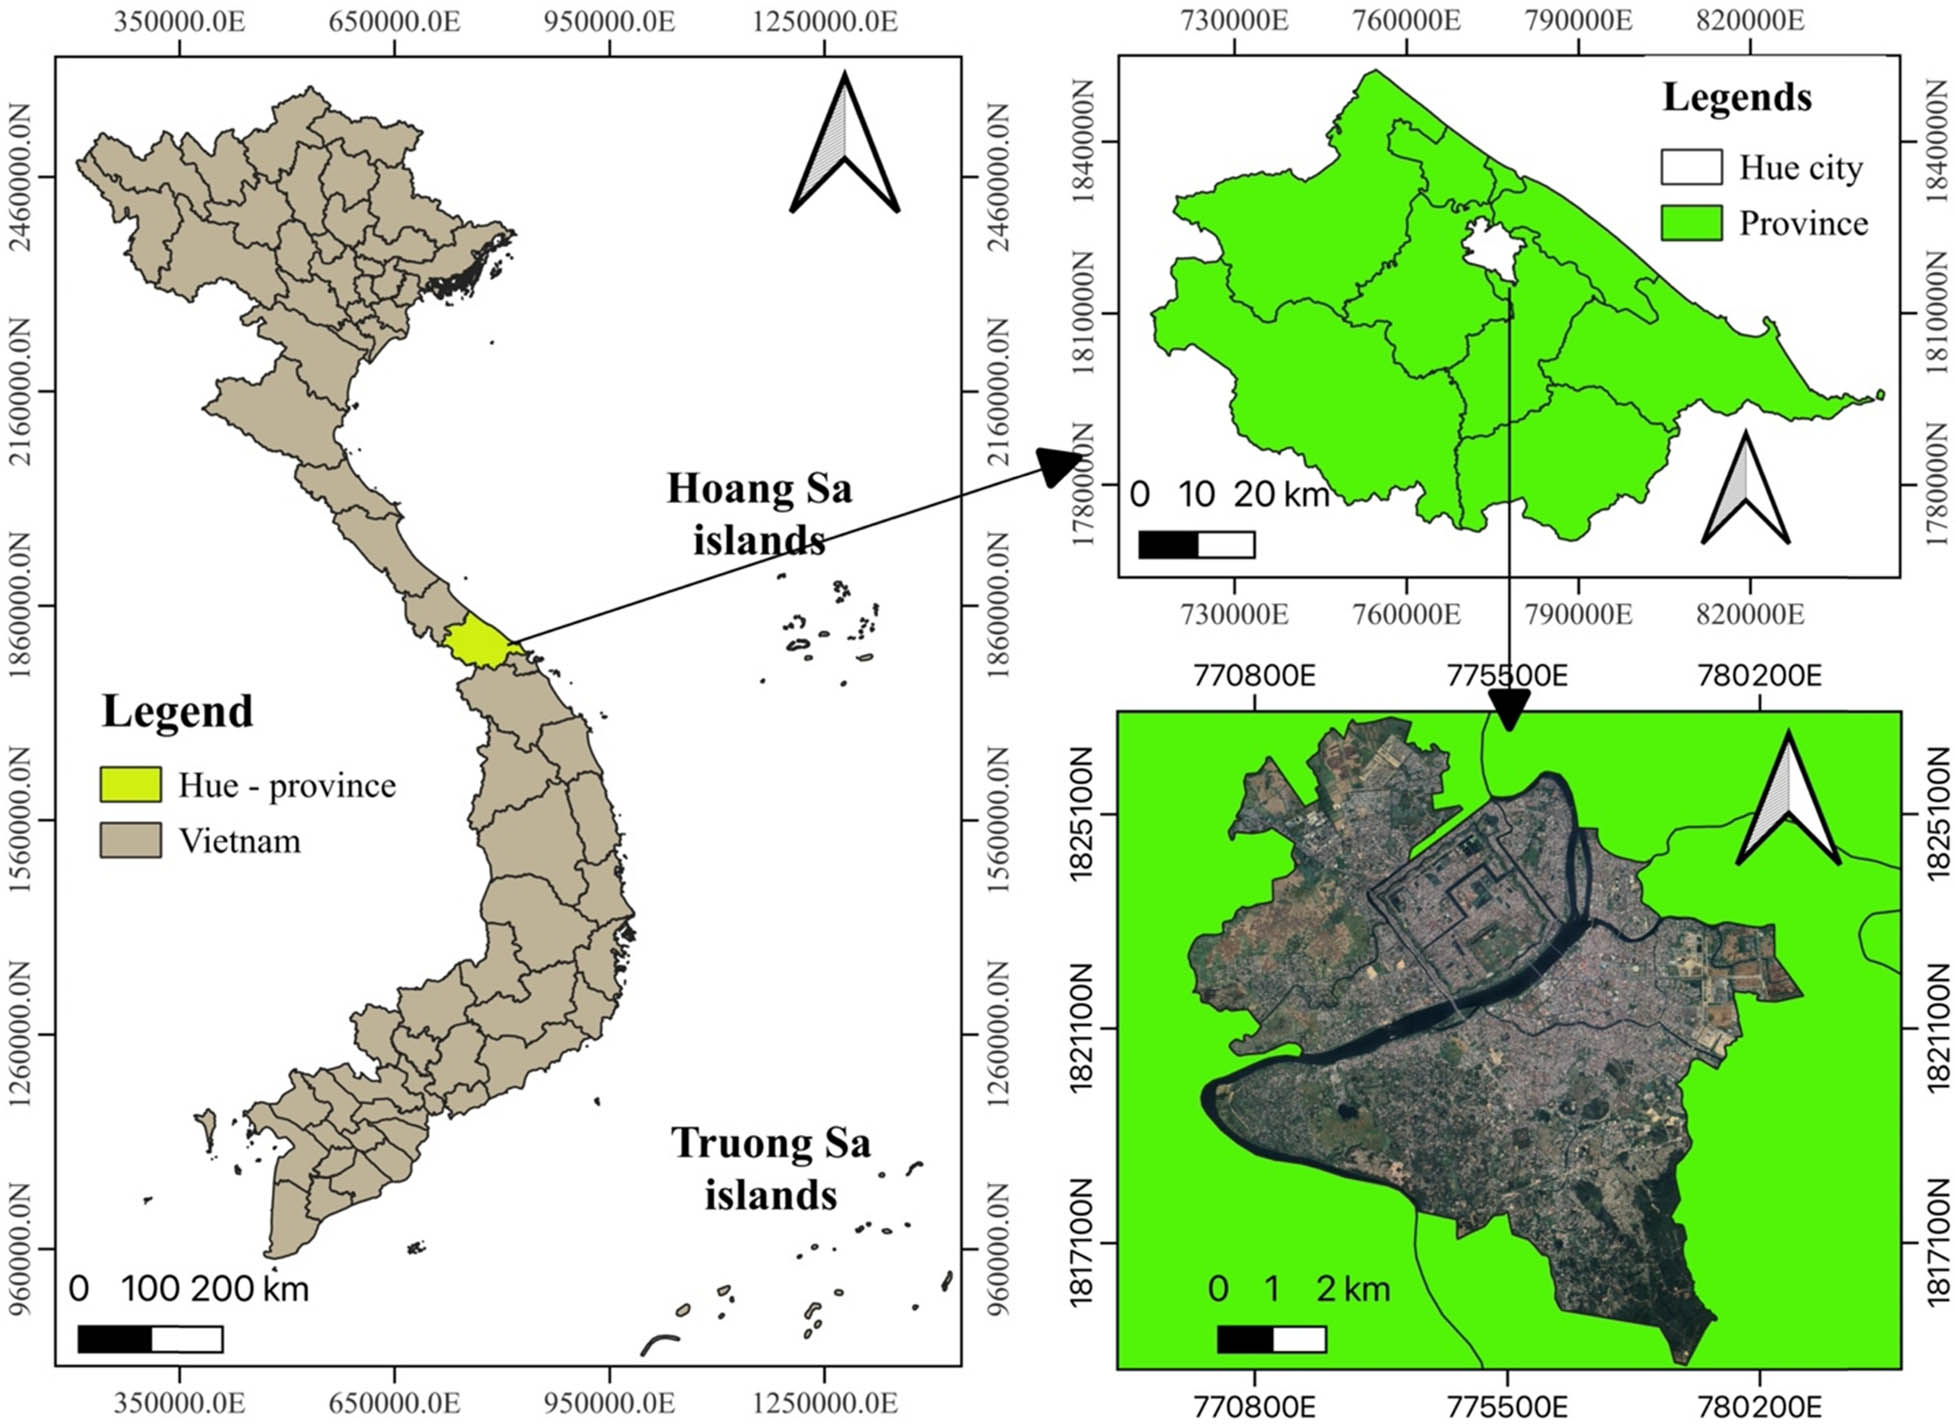
The geographical location of Hue city. Source: author’s compilation, 2023.
3.2 Data sources and image classification
The map data source is collected from the Japan Aerospace Exploration Agency or JAXA. This agency was established by merging three institutes: ISAS, NAL, and NASDA. From this merger, JAXA was designated as the agency supporting the use and development of aerospace by the Japanese government. The aim of this study is to compare changes in urban space expansion over each period, so map data were collected every 10 years (from 1990 to 2020). Field surveys and visually interpreted data independently verified these map data. These maps have a spatial resolution of 30 m, and the accuracy is 86, 87, 89, and 92% from 1990 to 2020, respectively. In particular, the closer the data are to the present, the greater the map accuracy. JAXA created the annual land use land cover (LULC) dataset in Vietnam using a random-forest-based algorithm and multiple information-rich geospatial data sources, including Landsat and Sentinel-1 and 2 imagery. Urban land area data are also collected from map data interpretation through QGIS software. The author also uses this software to divide geographical regions of Hue city through the “split with lines” function. This division is shown in Figure 2 with eight partitions. They include DBB (North-Northeast), DDB (East-Northeast), DDN (East-Southeast), DNN (South-Southeast), TNN (South-Southwest), TTN (West-Southwest), TTB (West-Northwest), and TBB (North-Northwest).

Research zoning in Hue city. Source: author’s compilation, 2023.
3.3 Some calculation formulas
In order to assess the degree of freedom for urban growth, the author makes use of the Chi-square statistical indicator developed by Pearson. The Chi-square test is a statistical test used to compare the observed and expected results between categorical variables in a population of data. The purpose of testing is to determine whether the difference between observed data and expected data is due to chance or due to the relationship between the variables under study. In this research, this measure provides further evidence that the observed urban growth is significantly higher than the projected growth. This index has been described by Almeida et al. [64] through the below formula:
where χ2 is the Pearson’s Chi-square statistical index;
where
The study also calculated an index called Shannon’s entropy. German scientist Clausius (1870) first proposed the idea of entropy in thermodynamics study as a way to quantify a system’s level of disorder. Later, entropy was used in many fields, from technology to sociology and economics. Primarily, in 1948, Shannon used this index to indicate the average information content of a message, and it was used in encoding communication signals. From then on, this index was called Shannon’s entropy. Shannon’s entropy measure was used to study the density and distribution of metropolitan areas. The ratio of land cover classes is a measure of evenness, whereas the number of classes or objects researched is a measure of richness (in this study, urban land is the object studied). This index is also widely accepted in assessing urban growth [65,66,67]. It is calculated using the below formula:
In which,
where
Henry Theil (1972) coined the term “relative entropy” to describe his version of the Shannon entropy index for measuring spatial dispersion [33]. This idea stands in for the greatest possible dispersion, in which the variable is dispersed across many different types of groups or geographic areas. If the relative entropy value equals 1, it indicates an even distribution over all regions. If that value is 0, the distribution is only concentrated in certain regions. The following formula expresses this index:
4 Research results
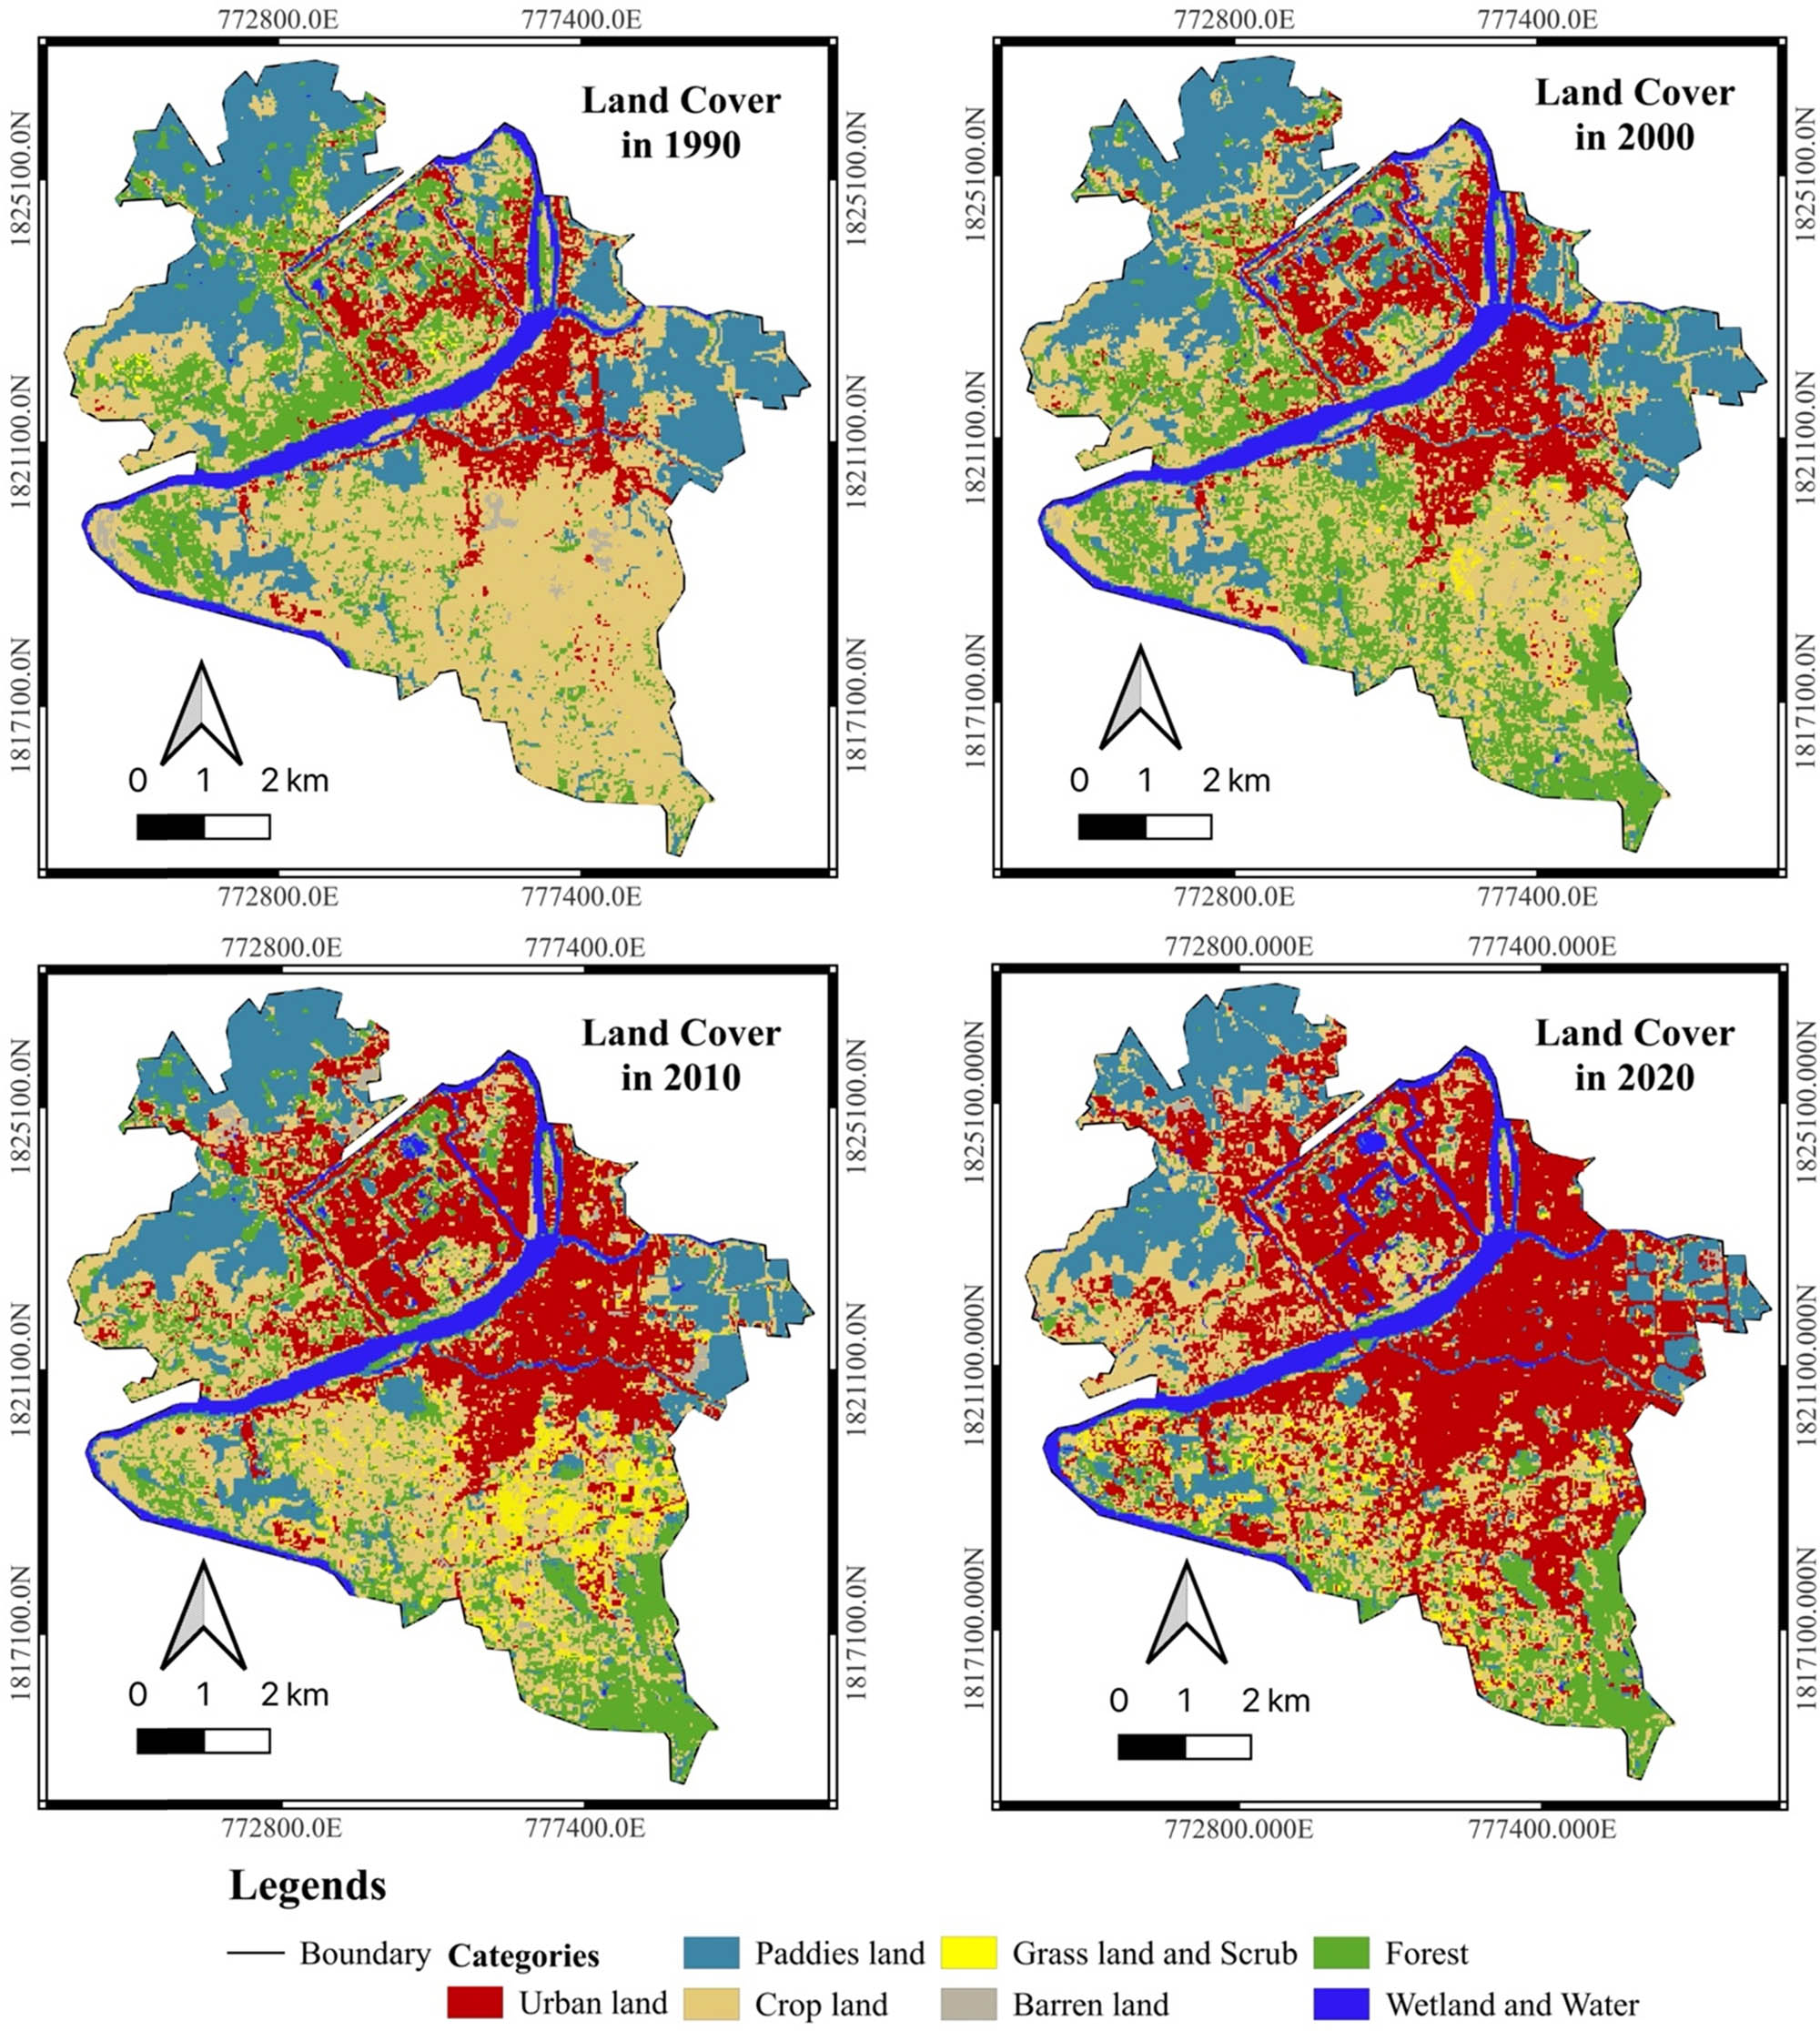
4.1 LULC in Hue city from 1990 to 2020
Table 1 shows the LULC categories in hectares in Hue City from 1990 to 2020. The classification results show that urban land area has grown enormously over each period, with an increasing solid trend in the past 10 years with over 16%. This increase is nearly three times higher than that during 1990–2000 and 1.5 times higher than that during 2000–2010. Statistical data also show that the area of agricultural land tends to decrease sharply, especially the cropland type. This type of land accounted for nearly half of Hue City’s area in 1990, but by 2020, this number is only nearly 25%. Meanwhile, the area of rice cultivation land tends to decrease slightly, with only 571.77 ha, equivalent to 7.22% after 30 years. A reduction equivalent to rice land is forest land, with 6.2%. However, the conversion trends of these two types of land are different. While rice land area appeared to have remained unchanged between 1990 and 2000, forest land area saw nearly 5% growth in the first study period. A rapidly decreasing trend followed this in both types of land.
Statistics of LULC classes in Hue city
| Categories | 1990 | 2000 | 2010 | 2020 | ||||
|---|---|---|---|---|---|---|---|---|
| Area (ha) | % | Area (ha) | % | Area (ha) | % | Area (ha) | % | |
| Urban land | 820.08 | 10.35 | 1202.49 | 15.17 | 1989.99 | 25.11 | 3273.84 | 41.31 |
| Paddies land | 1801.17 | 22.73 | 1794.15 | 22.64 | 1435.14 | 18.11 | 1229.4 | 15.51 |
| Crop land | 3653.28 | 46.10 | 2843.82 | 35.88 | 2359.89 | 29.78 | 1936.53 | 24.43 |
| Grass land and scrub | 19.71 | 0.25 | 65.25 | 0.82 | 406.53 | 5.13 | 241.29 | 3.04 |
| Barren land | 52.02 | 0.66 | 27.54 | 0.35 | 104.85 | 1.32 | 55.8 | 0.70 |
| Forest | 1193.85 | 15.06 | 1585.17 | 20.00 | 1215.36 | 15.34 | 702.18 | 8.86 |
| Water | 385.2 | 4.86 | 406.89 | 5.13 | 413.55 | 5.22 | 486.27 | 6.14 |
| Total | 7925.31 | 100 | 7925.31 | 100 | 7925.31 | 100 | 7925.31 | 100 |
Source: author’s calculation, 2023.
4.2 Degree of freedom for urban growth in Hue city
The research first illustrates changes in urban land usage in several Hue city regions before calculating the degree of freedom for urban expansion (Figure 3). The rate of change in urban use in the three periods is completely different among the eight regions, and this index has been increasing in recent times. While the highest rates of change were witnessed in the period 1990–2000 and 2000–2010 at nearly 89 and 127%, respectively, in the Central region, the level of change in the period 2010–2020 is highest in TNN with over 450%. Besides, if growth between urban areas is compared, the city’s northern area has developed more slowly than the remaining areas in the past 20 years. In contrast, 1990–2000 will be the city’s southwest area. In addition, zone DNN witnessed the most sustainable growth among the eight regions, consistently ranking second or third during that transition period. Details of the change in the urban land area can be seen more clearly in Table 2.
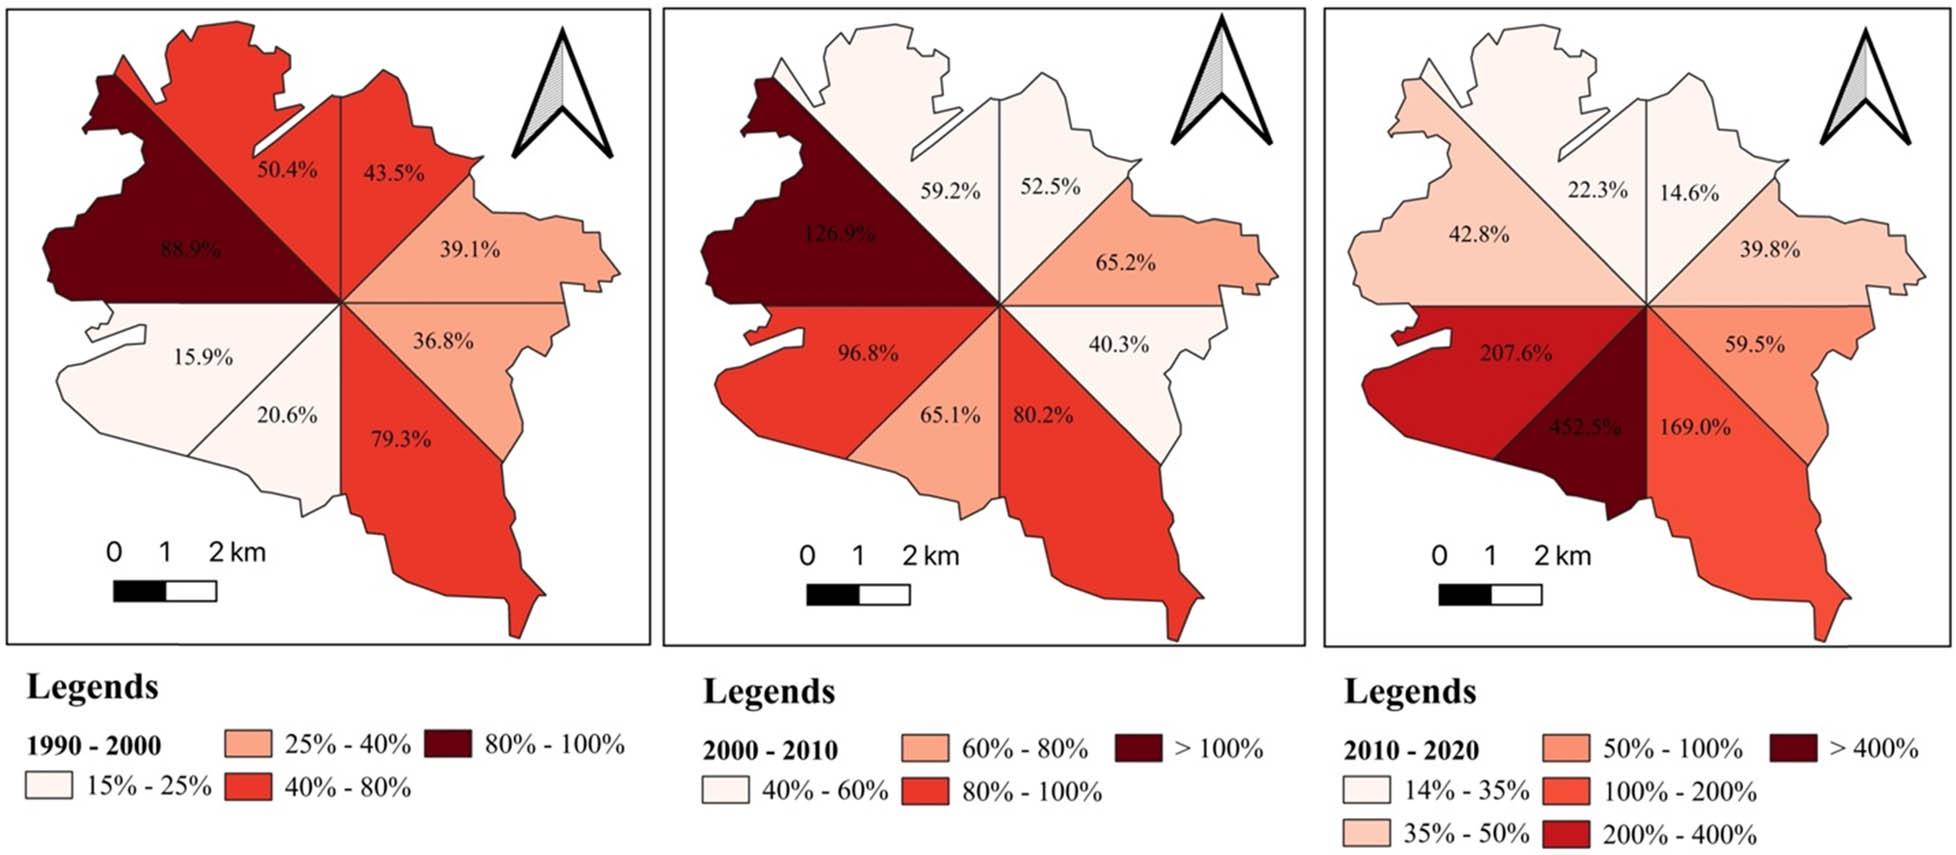
Urban land use change by the zones in Hue city. Source: author’s compilation, 2023.
Some indicators of urban land in Hue city
| Categories | Periods | Zone (Unit: ha) | Total | |||||||
|---|---|---|---|---|---|---|---|---|---|---|
| DBB | TBB | DDB | TTB | DDN | DNN | TTN | TNN | |||
| Observed urban land | 1990–2000 | 64.89 | 77.76 | 68.31 | 52.83 | 59.58 | 48.6 | 6.21 | 4.14 | 382.32 |
| 2000–2010 | 112.32 | 137.34 | 158.4 | 142.38 | 89.37 | 88.11 | 43.83 | 15.75 | 787.5 | |
| 2010–2020 | 47.52 | 82.35 | 159.75 | 108.99 | 184.95 | 334.53 | 184.95 | 180.81 | 1283.85 | |
| Total | 224.73 | 297.45 | 386.46 | 304.2 | 333.9 | 471.24 | 234.99 | 200.7 | 2453.76 | |
| Expected urban land | 1990–2000 | 35.02 | 46.36 | 60.24 | 47.41 | 52.04 | 73.44 | 36.62 | 31.28 | — |
| 2000–2010 | 72.12 | 95.46 | 124.06 | 97.63 | 107.16 | 151.24 | 75.42 | 64.41 | — | |
| 2010–2020 | 117.58 | 155.63 | 202.25 | 159.16 | 174.70 | 246.56 | 122.95 | 105.01 | — | |
| Differences | 1990–2000 | 29.87 | 31.49 | 8.07 | 5.51 | 7.54 | −24.93 | −30.32 | −27.23 | — |
| 2000–2010 | 40.29 | 41.88 | 34.34 | 44.66 | −17.79 | −63.13 | −31.68 | −48.57 | — | |
| 2010–2020 | −70.15 | −73.37 | −42.41 | −50.17 | 10.25 | 88.06 | 62.00 | 75.80 | — | |
Note: The sum column of the two categories (expected urban land and differences) does not need to be calculated. Source: author’s calculation, 2023.
In addition to showing the observed urban land change data in the three periods, Table 2 also shows the predictions of this change through formula (2). The results show that the urban land area is expected to increase gradually over each period. Additionally, contrary to what has been observed, zone DNN is the area with the most remarkable change in all three research periods, with 73.44, 151.24, and 246.56 ha, respectively. The discrepancy between actual and predicted growth is also displayed in Table 2. Positive values imply more growth than anticipated, whereas negative values suggest slower growth. In particular, 1990–2000 witnessed three areas: DNN, TTN, and TNN. In 2000–2010, there were four regions: DDN, DNN, TTN, and TNN. 2010–2020 also witnessed lower-than-expected growth in four regions: DBB, TBB, DDB, and TTB.
Table 3 calculates Chi-square statistics through formula (1), and the lower limit of the χ2 index is 0. The results of Table 3 show that the degree of freedom for urban growth differs between regions and periods. During 1990–2000, the degrees of freedom did not show much difference in zones DBB, TBB, TTN, and TNN. When an observation is made in zone TTB and χ2 = 0.64, it indicates that the observed value for this time period is fairly close to the expected value. In 2000–2010, the degree of freedom for urban expansion showed a more apparent difference than in the previous period. TNN has the highest χ2 index at 36.63, while DDN has the lowest χ2 index with only 2.95. These zones had the highest and lowest χ2 index in 2010–2020, with 54.72 and 0.60, respectively. However, a higher degree of freedom does not mean an area has a higher urban sprawl.
| Periods | Zone |
|
|||||||
|---|---|---|---|---|---|---|---|---|---|
| DBB | TBB | DDB | TTB | DDN | DNN | TTN | TNN | ||
| 1990–2000 | 25.47 | 21.40 | 1.08 | 0.64 | 1.09 | 8.46 | 25.11 | 23.70 | 106.95 |
| 2000–2010 | 22.50 | 18.37 | 9.51 | 20.43 | 2.95 | 26.35 | 13.30 | 36.63 | 150.05 |
| 2010–2020 | 41.85 | 34.59 | 8.89 | 15.82 | 0.60 | 31.45 | 31.26 | 54.72 | 219.18 |
Source: author’s calculation, 2023.
4.3 Level of urban spatial dispersion in Hue city
The variable in this study is urban land, and Shannon’s entropy is utilized to quantify the extent of spatial compression or dispersion of the variable between places. Shannon’s entropy and relative entropy are calculated using formulas (3) and (5), respectively. The
Shannon entropy and relative entropy
| Zones | Shannon entropy | Relative entropy | Change in relative entropy | ||||||||
|---|---|---|---|---|---|---|---|---|---|---|---|
| 1990 | 2000 | 2010 | 2020 | 1990 | 2000 | 2010 | 2020 | 1990–2000 | 2000–2010 | 2010–2020 | |
| DBB | 0.310 | 0.307 | 0.297 | 0.248 | 0.149 | 0.148 | 0.143 | 0.119 | −0.001 | −0.005 | −0.023 |
| TBB | 0.314 | 0.318 | 0.313 | 0.273 | 0.151 | 0.153 | 0.150 | 0.131 | 0.002 | −0.002 | −0.019 |
| DDB | 0.329 | 0.323 | 0.323 | 0.302 | 0.158 | 0.155 | 0.155 | 0.145 | −0.003 | 0.000 | −0.010 |
| TTB | 0.190 | 0.221 | 0.263 | 0.244 | 0.091 | 0.106 | 0.127 | 0.117 | 0.015 | 0.020 | −0.009 |
| DDN | 0.320 | 0.312 | 0.290 | 0.286 | 0.154 | 0.150 | 0.139 | 0.137 | −0.004 | −0.010 | −0.002 |
| DNN | 0.194 | 0.219 | 0.230 | 0.295 | 0.093 | 0.105 | 0.110 | 0.142 | 0.012 | 0.005 | 0.032 |
| TTN | 0.145 | 0.124 | 0.139 | 0.208 | 0.070 | 0.059 | 0.067 | 0.100 | −0.010 | 0.007 | 0.033 |
| TNN | 0.091 | 0.079 | 0.079 | 0.182 | 0.044 | 0.038 | 0.038 | 0.087 | −0.006 | 0.000 | 0.050 |
| Total | 1.894 | 1.902 | 1.932 | 2.038 | 0.911 | 0.915 | 0.929 | 0.980 | — | — | — |
Source: author’s calculation, 2023.
Results from Table 4 show that the value of
5 Discussion
Urban areas are always considered places that hold essential political and economic power in society and have a strong influence, greatly influencing the region’s and country’s socio-economic development. The economic contribution of urban areas is enormous. Urban areas are often centers and driving forces for the country’s and region’s economic development. Urban areas contribute to GDP, industrial service, and economic growth values. Therefore, urban expansion needs to be accompanied by sustainable urban development.
The results of this study show that land use conversion between land groups in Hue city is similar to most places in the world. Similar to the results of previous studies, the urban land area in Hue city increased with a growth rate of 30% in 30 years. The area of land planted with rice and other crops tends to decrease as in China, the United States, and Germany. Forest land in Hue City shows a decline similar to the expected decline in this type of land in the United States. These results show that the trend of changing land use purposes in Hue city, Vietnam is in the same flow as the changing land use purposes in the world.
The results of urban expansion at the research location also show that the development between regions within an urban area is not in harmony with each other. This is also the general situation of urban development in Vietnam. The pace of urbanization is fast, but the quality is not high. The general trend of urban areas in Vietnam today is to develop rapidly, expanding both in land area and population. Among them, the two main urbanization trends are (1) the inner-city area develops strongly into the peripheral areas, leading to the adjustment of urban boundaries; (2) Urban expansion is based on merging administrative units within the boundaries of a province. Most rapidly urbanizing areas have underdeveloped infrastructure systems, low educational levels, and small-scale economic forms. People here still maintain their culture and live according to rural traditions, not being able to adapt to urban life. Therefore, the research results contribute to creating a different perspective for policy makers and planners to implement planning on how to balance and harmonize regions of a locality.
Although the study has addressed the research questions raised, there are still some limitations that need to be overcome and maybe directions for future research. This is the first study in Vietnam to use two indices, Pearson’s Chi-square, and Shannon entropy, to measure the expansion of urban space. However, the research was only conducted in one locality in Vietnam, so it is difficult to show general results on this issue in Vietnam. Along with that, the new study mentions the impacts of urban expansion on land management and use but does not analyze these impacts in depth. Future studies could measure the environmental, social, and economic impacts of urban expansion as well as other issues that urban expansion brings.
6 Conclusion
The goal of this study is to use Pearson’s Chi-square index to calculate the degree of freedom for urban expansion and the Shannon entropy index to determine the degree of urban spatial dispersion in Hue City. The study’s findings indicate that Hue City’s degree of urban freedom growth has grown during the last 10 years (2010–2020) in comparison to the years 2000–2010 and 1990–2000, with matching χ2 values of 219.18, 150.05, and 106.95. Out of the eight zones in Hue City, the TNN area has experienced the greatest expansion of urban freedom over three stages. Furthermore, Hue City’s urban dispersion level has grown recently as a result of the indices
First, strictly controlling the urbanization process in urban construction planning is necessary. In order to do this, urban construction planning needs to be placed in a comprehensive coordination system with many sectors and Hue city authorities to ensure the feasibility of the planning. Hue City aims to become a centrally run Class I urban area by 2025 (Vietnam only has five centrally run Class I urban areas [68]). Therefore, the city aims to plan and develop based on cultural, historical, and tourism resources. The city is determined to promote an in-depth economic growth model based on exploiting strengths and prioritizing the development of service and tourism industries based on promoting heritage values. To achieve this, the Thua Thien Hue provincial government has planned to invest about 150,000 billion VND (equivalent to about 6.15 billion USD) in infrastructure from 2021–2030 [69]. To achieve this goal, in planning, it is necessary to express the appropriate philosophy of industrialization and urbanization in Vietnam in general and Hue city in particular. Following the planning, the approval of investment projects is the process of implementing the planning. This process must still adopt the idea of only accepting projects that integrate private interests with national interests in industrialization and urbanization.
Second, enhancing urban quality and restoring order in land and urban management is necessary. The fact that many projects in the implementation process are being adjusted has disrupted the planning. In Thua Thien Hue province, 79 projects are behind schedule, and authorities have revoked 35 projects. In particular, some areas considered “golden land” (located in the central area) are abandoned and unused [70]. Therefore, the Hue city government needs strong measures to create changes in land management issues. Along with that, it is necessary to check and monitor the planning implementation process, avoiding the existence of “hanging” and abandoned projects like today. Gradually erasing images of abandoned projects will bring the land to proper use and restore order in land management. Besides, the most sensitive area that needs attention in management is the urban fringe area. All violations regarding land use and implementation of investment projects also occur in this area. Regarding planning, there should be requirements for zoning urban areas, industrial areas, business and service areas, and the peripheries of the above-mentioned areas. In terms of law, it is necessary to assign tasks to the grassroots level to directly manage all land use activities in this peripheral area.
Appendices
Acknowledgements
To complete this research, the author sincerely thanks Dr. Bui Dang Hung, lecturer at Industrial University of Ho Chi Minh City, who guided the author in making maps using QGIS software.
-
Funding information: Author states no funding involved.
-
Author contribution: The author confirms the sole responsibility for the conception of the study, presented results and manuscript preparation.
-
Conflict of interest: Author states no conflict of interest.
-
Data availability statement: All data generated or analyzed during this study are included in this published article and its supplementary information files.
Appendix
LULC in Hue city from 1990–2020. Source: author’s compilation, 2023.
Urban land areas in eight zones in Hue city
| Unit: ha | 1990 | 2000 | 2010 | 2020 |
|---|---|---|---|---|
| DBB | 149.22 | 214.11 | 326.43 | 373.95 |
| TBB | 154.26 | 232.02 | 369.36 | 451.71 |
| DDB | 174.60 | 242.91 | 401.31 | 561.06 |
| TTB | 59.40 | 112.23 | 254.61 | 363.60 |
| DDN | 162.00 | 221.58 | 310.95 | 459.90 |
| DNN | 61.29 | 109.89 | 198.00 | 532.53 |
| TTN | 39.06 | 45.27 | 89.10 | 274.05 |
| TNN | 20.07 | 24.21 | 39.96 | 220.77 |
| Total | 819.90 | 1202.22 | 1989.72 | 3273.57 |
Source: author’s calculation, 2023.
References
[1] Chen M, Zhang H, Liu W, Zhang W. The global pattern of urbanization and economic growth: evidence from the last three decades. PLoS one. 2014;9(8):e103799. 10.1371/journal.pone.0103799.Suche in Google Scholar PubMed PubMed Central
[2] Kuddus MA, Tynan E, McBryde E. Urbanization: a problem for the rich and the poor? Public Health Rev. 2020;41(1):1–4. 10.1186/s40985-019-0116-0.Suche in Google Scholar PubMed PubMed Central
[3] Menashe‐Oren A, Bocquier P. Urbanization is no longer driven by migration in low‐and middle‐income countries (1985–2015). Popul Dev Rev. 2021;47(3):639–63. 10.1111/padr.12407.Suche in Google Scholar
[4] Tuan NT. Land tenure and land acquisition enforcement in Vietnam. SAGE Open. 2023;13(1):21582440231163102. 10.1177/21582440231163102.Suche in Google Scholar
[5] Jedwab R, Loungani P, Yezer A. Comparing cities in developed and developing countries: Population, land area, building height and crowding. Reg Sci Urban Econ. 2021;86:103609. 10.1016/j.regsciurbeco.2020.103609.Suche in Google Scholar
[6] Bloom DE, Finlay JE. Demographic change and economic growth in Asia. Asian Econ Policy Rev. 2009;4(1):45–64.10.1111/j.1748-3131.2009.01106.xSuche in Google Scholar
[7] Zhu Y. The urban transition and beyond: Facing new challenges of the mobility and settlement transitions in Asia. United Nations Expert Group Meeting on Sustainable Cities. New York: Human Mobility and International Migration; 2017. https://www.un.org/development/desa/pd/sites/www.un.org.development.desa.pd/files/unpd_egm_201709_s3_paper-zhu-final-rev1.pdf.Suche in Google Scholar
[8] UN. 2018 Revision of World Urbanization Prospects. United Nations Department of Economic and Social Affairs; 2018. United Nations. https://population.un.org/wup/publications/Files/WUP2018-Report.pdf.Suche in Google Scholar
[9] ESCAP U. Housing the poor in Asian cities, No 1: urbanization: the role the poor play in urban development; 2008. https://hdl.handle.net/20.500.12870/3153.Suche in Google Scholar
[10] Choe KA, Roberts BH. Competitive cities in the 21st century: Cluster-based local economic development. Asian Development Bank; 2011. http://hdl.handle.net/11540/118.Suche in Google Scholar
[11] Anggit N, Putri I. Identification of urban sprawl phenomenon and its implications in the City of Yogyakarta Province of Special Region of Yogyakarta. IOP Conference Series: Earth and Environmental Science; 2022.10.1088/1755-1315/1038/1/012052Suche in Google Scholar
[12] Habibi S, Asadi N. Causes, results and methods of controlling urban sprawl. Procedia Eng. 2011;21:133–41. 10.1016/j.proeng.2011.11.1996.Suche in Google Scholar
[13] Zhang Y. Urbanization, inequality, and poverty in the People’s Republic of China. ADB Institute; 2016. https://www.adb.org/sites/default/files/publication/189132/adbi-wp584.pdf.10.2139/ssrn.2838056Suche in Google Scholar
[14] Zhou M, Lu L, Guo H, Weng Q, Cao S, Zhang S, et al. Urban sprawl and changes in land-use efficiency in the Beijing–Tianjin–Hebei Region, China from 2000 to 2020: A Spatio temporal Analysis Using Earth Observation Data. Remote Sens. 2021;13:2850. 10.3390/rs13152850.Suche in Google Scholar
[15] Tuan NT. A comparative study of urban land use efficiency of the cities of Hai Phong and Can Tho, Vietnam. Environ & Socio-econ Stud. 2023;11(3):43–53. 10.2478/environ-2023-0016.Suche in Google Scholar
[16] Al Tarawneh WM. Urban sprawl on agricultural land (literature survey of causes, effects, relationship with land use planning and environment): a case study from Jordan (Shihan Municipality Areas). J Environ Earth Sci. 2014;4(20):97–124.Suche in Google Scholar
[17] Wadduwage S. Peri-urban agricultural land vulnerability due to urban sprawl–a multi-criteria spatially-explicit scenario analysis. J Land Use Sci. 2018;13(3):358–74. 10.1080/1747423X.2018.1530312.Suche in Google Scholar
[18] Lee C. Metropolitan sprawl measurement and its impacts on commuting trips and road emissions. Transp Res D Trans Environ. 2020;82:102329. 10.1016/j.trd.2020.102329.Suche in Google Scholar
[19] DiBartolomeo JA, Turnbull GK. Commuting costs and urban sprawl: which proxy measures Up? J Real Estate Fin Econ. 2023;67:375–87. 10.1007/s11146-021-09863-z.Suche in Google Scholar
[20] Pham HT, Nguyen TT, Nguyen QV, Nguyen TV. Land price regression model and land value region map to support residential land price management: a study in Nghe An Province, Vietnam. Real Estate Manag Valuat. 2022;30(1):71–83. 10.2478/remav-2022-0007.Suche in Google Scholar
[21] Hassan MO, Ling GHT, Rusli N, Mokhtar S, Wider W, Leng PC. Urban sprawl patterns, drivers, and impacts: the case of mogadishu, somalia using geo-spatial and SEM analyses. Land. 2023;12(4):783. 10.3390/land12040783.Suche in Google Scholar
[22] McDonald RI, Marcotullio PJ, Güneralp B Urbanization and global trends in biodiversity and ecosystem services. In: Elmqvist T, et al. editor. Urbanization, biodiversity and ecosystem services: challenges and opportunities: a global assessment. Dordrecht: Springer; 2013. pp. 31–52. 10.1007/978-94-007-7088-1_3.Suche in Google Scholar
[23] Simkin RD, Seto KC, McDonald RI, Jetz W. Biodiversity impacts and conservation implications of urban land expansion projected to 2050. Proc Natl Acad Sci. 2022;119(12):e2117297119. 10.1073/pnas.2117297119.Suche in Google Scholar PubMed PubMed Central
[24] Yue W, Zhou Q, Li M, van Vliet J. Relocating built-up land for biodiversity conservation in an uncertain future. J Environ Manag. 2023;345:118706. 10.1016/j.jenvman.2023.118706.Suche in Google Scholar PubMed
[25] Navamuel EL, Morollón FR, Cuartas BM. Energy consumption and urban sprawl: Evidence for the Spanish case. J Clean Prod. 2018;120:3479–86. 10.1016/j.jclepro.2017.08.110.Suche in Google Scholar
[26] Feng Q, Gauthier P. Untangling urban sprawl and climate change: a review of the literature on physical planning and transportation drivers. Atmosphere. 2021;12(5):547. 10.3390/atmos12050547.Suche in Google Scholar
[27] Hutyra LR, Yoon B, Hepinstall-Cymerman J, Alberti M. Carbon consequences of land cover change and expansion of urban lands: A case study in the Seattle metropolitan region. Landsc Urban Plan. 2011;103(1):83–93. 10.1016/j.landurbplan.2011.06.004.Suche in Google Scholar
[28] Carpio A, Ponce-Lopez R, Lozano-García DF. Urban form, land use, and cover change and their impact on carbon emissions in the Monterrey Metropolitan area, Mexico. Urban Clim. 2021;39:100947. 10.1016/j.uclim.2021.100947.Suche in Google Scholar
[29] Anees MM, Mann D, Sharma M, Banzhaf E, Joshi PK. Assessment of urban dynamics to understand spatiotemporal differentiation at various scales using remote sensing and geospatial tools. Remote Sens. 2020;12:1306. 10.3390/rs12081306.Suche in Google Scholar
[30] Santos T, Deus R, Rocha J, Tenedório JA. Assessing sustainable urban development trends in a dynamic tourist coastal area using 3D spatial indicators. Energies. 2021;14(16):5044. 10.3390/en14165044.Suche in Google Scholar
[31] Zhu Q, Zeng M, Jia P, Guo M, Liang X, Guan Q. Measuring the urban sprawl based on economic-dominated perspective: the case of 31 municipalities and provincial capitals. Geo-Spat Inf Sci. 2023;1–18. 10.1080/10095020.2023.2202201.Suche in Google Scholar
[32] Dewa DD, Buchori I, Sejati AW, Liu Y. Shannon entropy-based urban spatial fragmentation to ensure sustainable development of the urban coastal city: A case study of Semarang, Indonesia. Remote Sens Appl: Soc Environ. 2022;28:100839. 10.1016/j.rsase.2022.100839.Suche in Google Scholar
[33] Shenbagaraj N, Kumar MN, Stalin JL. Assessment of urban growth using Shannon’s entropy index: A case study of Chennai, Detroit of India. J Appl Nat Sci. 2019;11(2):281–4. 10.31018/jans.v11i2.2037.Suche in Google Scholar
[34] Vo H. Understanding urban migration in Viet Nam: Evidence from a micro-macro link; 2021. https://www.adb.org/sites/default/files/publication/689171/adbi-wp1233.pdf.Suche in Google Scholar
[35] Pham TH, Riedel J. Impact of the sectoral composition of growth on poverty reduction in Vietnam. J Econ Dev. 2019;21(2):213–22. 10.1108/JED-10-2019-0046.Suche in Google Scholar
[36] Tuan NT. Urbanization and land use change: A study in Vietnam. Environ & Socio-Econ Stud. 2022;10(2):19–29. 10.2478/environ-2022-0008.Suche in Google Scholar
[37] Egidi G, Zambon I, Tombolin I, Salvati L, Cividino S, Seifollahi-Aghmiuni S, et al. Unraveling latent aspects of urban expansion: desertification risk reveals more. Int J Environ Res Public Health. 2020;17(11):4001. 10.3390/ijerph17114001.Suche in Google Scholar PubMed PubMed Central
[38] Omasire AK, Kimondiu J, Kariuki P. Urban sprawl causes and impacts on agricultural land in Wote town area of Makueni county, Kenya. Int J Environ Agric Biotech. 2020;5(3):631–5. 10.22161/ijeab.53.15.Suche in Google Scholar
[39] Behnisch M, Krüger T, Jaeger JA. Rapid rise in urban sprawl: Global hotspots and trends since 1990. PLOS Sustain Transform. 2022;1(11):e0000034. 10.1371/journal.pstr.0000034.Suche in Google Scholar
[40] Seto KC, Güneralp B, Hutyra LR. Global forecasts of urban expansion to 2030 and direct impacts on biodiversity and carbon pools. Proc Natl Acad Sci. 2012;109(40):16083–88. 10.1073/pnas.1211658109.Suche in Google Scholar PubMed PubMed Central
[41] Angel S, Sheppard S, Civco DL, Buckley R, Chabaeva A, Gitlin L, et al. The dynamics of global urban expansion. Washington, DC: World Bank, Transport and Urban Development Department; 2005. https://documents1.worldbank.org/curated/en/138671468161635731/pdf/355630Global0urban0sept200501PUBLIC1.pdf.Suche in Google Scholar
[42] Chen G, Li X, Liu X, Chen Y, Liang X, Leng J, et al. Global projections of future urban land expansion under shared socioeconomic pathways. Nat Commun. 2020;11(1):537. 10.1038/s41467-020-14386-x.Suche in Google Scholar PubMed PubMed Central
[43] Bren d’Amour C, Reitsma F, Baiocchi G, Barthel S, Güneralp B, Erb K-H, et al. Future urban land expansion and implications for global croplands. Proc Natl Acad Sci. 2017;114(34):8939–44. 10.1073/pnas.1606036114.Suche in Google Scholar PubMed PubMed Central
[44] Duan L, Liu Z, Yu W, Chen W, Jin D, Sun S, et al. Trend of Urbanization rate in china various regions. IOP Conference Series: Earth and Environmental Science; 2021.10.1088/1755-1315/772/1/012008Suche in Google Scholar
[45] Han L, Zhang L, Zhou W, Li W, Qian Y. China’s urban-rural expansion and natural habitat loss since the 1980s: Retrospective analysis and future suggestions. Front Environ Sci. 2022;10:1065174. 10.3389/fenvs.2022.1065174.Suche in Google Scholar
[46] Xu M, He C, Liu Z, Dou Y. How did urban land expand in China between 1992 and 2015? A multi-scale landscape analysis. PLoS one. 2016;11(5):e0154839. 10.1371/journal.pone.0154839.Suche in Google Scholar PubMed PubMed Central
[47] Lu Q, Söderlund L, Wu P, Li J. Cultivated land loss arising from the rapid urbanization in China. In: Sippola J, Kamijo-Söderlund M, editors. Proceedings SUSDEV-CHINA Symposium: Sustainable Agroecosystem Management and Development of Rural-Urban Interaction in Regions and Cities of China/Leif Söderlund; 2005.Suche in Google Scholar
[48] Deng X, Huang J, Rozelle S, Zhang J, Li Z. Impact of urbanization on cultivated land changes in China. Land Use Policy. 2015;45:1–7. 10.1016/j.landusepol.2015.01.007.Suche in Google Scholar
[49] Wang X. Changes in cultivated land loss and landscape fragmentation in China from 2000 to 2020. Land. 2022;11(5):684. 10.3390/land11050684.Suche in Google Scholar
[50] Sha W. The political impacts of land expropriation in China. J Dev Econ. 2023;160:102985. 10.1016/j.jdeveco.2022.102985.Suche in Google Scholar
[51] Resnik DB. Urban sprawl, smart growth, and deliberative democracy. Am J public health. 2010;100(10):1852–6. 10.2105/AJPH.2009.182501.Suche in Google Scholar PubMed PubMed Central
[52] Alig RJ, Kline JD, Lichtenstein M. Urbanization on the US landscape: looking ahead in the 21st century. Landsc urban Plan. 2004;69(2–3):219–34. 10.1016/j.landurbplan.2003.07.004.Suche in Google Scholar
[53] Wear DN. Forecasts of county-level land uses under three future scenarios: a technical document supporting the Forest Service 2010 RPA Assessment General Technical Report-Southern Research Station. USDA Forest Service, Issue. 2011. https://www.srs.fs.usda.gov/pubs/gtr/gtr_srs141.pdf.10.2737/SRS-GTR-141Suche in Google Scholar
[54] Alig RJ, Plantinga AJ. Future forestland area: Impacts from population growth and other factors that affect land values. J Forestry. 2004;102(8):19–24.10.1093/jof/102.8.19Suche in Google Scholar
[55] Sorensen A, Freedgood J, Dempsey J, Theobald D. Farms under threat: The state of America’s farmland. Washington, DC, USA: American Farmland Trust; 2018. https://farmlandinfo.org/wp-content/uploads/sites/2/2020/05/AFT_FUT_SAF_2020final.pdf.Suche in Google Scholar
[56] Coleman J. Farms Under Threat 2040: Choosing an Abundant Future; 2022. https://farmlandinfo.org/wp-content/uploads/sites/2/2022/08/AFT_FUT_Abundant-Future-7_29_22-WEB.pdf.Suche in Google Scholar
[57] Macrotrends. Germany Urban Population 1960-2023; 2023. https://www.macrotrends.net/countries/DEU/germany/urban-population#:∼:text = Germany%20urban%20population%20for%202022,a%200.16%25%20increase%20from%202020.Suche in Google Scholar
[58] Fischer B, Jöst F, Klauer B, Schiller J (2009). Is a Sustainable Land-Use Policy in Germany Possible? https://www.wiso.uni-heidelberg.de/md/awi/forschung/dp484.pdf.Suche in Google Scholar
[59] Kirschke D, Häger A, Schmid JC. New trends and drivers for agricultural land use in Germany. In: Weith T, Barkmann T, Gaasch N, Rogga S, Strauß C, Zscheischler J, editors. Sustainable Land Management in a European Context. Human-Environment Interactions. Vol. 8. Cham: Springer; 2021. p. 39–61. 10.1007/978-3-030-50841-8_3.Suche in Google Scholar
[60] Siedentop S, Fina S. Monitoring urban sprawl in Germany: towards a GIS-based measurement and assessment approach. J Land Use Sci. 2010;5(2):73–104. 10.1080/1747423X.2010.481075.Suche in Google Scholar
[61] Kroll F, Haase D. Does demographic change affect land use patterns?: A case study from Germany. Land Use Policy. 2010;27(3):726–37. 10.1016/j.landusepol.2009.10.001.Suche in Google Scholar
[62] Meyer MA, Früh-Müller A. Patterns and drivers of recent agricultural land-use change in Southern Germany. Land Use Policy. 2020;99:104959. 10.1016/j.landusepol.2020.104959.Suche in Google Scholar
[63] Baganz GF, Baganz D. Compensating for loss of nature and landscape in a growing city – Berlin case study. Land. 2023;12(3):567. 10.3390/land12030567.Suche in Google Scholar
[64] Almeida CMD, Monteiro AMV, Câmara G, Soares‐Filho BS, Cerqueira GC, Pennachin CL, et al. GIS and remote sensing as tools for the simulation of urban land‐use change. Int J Remote Sens. 2005;26(4):759–74. 10.1080/01431160512331316865.Suche in Google Scholar
[65] Cho KH, Lee D-H, Kim T-S, Jang G-S. Measurement of 30-year urban expansion using spatial entropy in Changwon and Gimhae, Korea. Sustainability. 2021;13(2):632. 10.3390/su13020632.Suche in Google Scholar
[66] Patra PK, Behera D, Goswami S. Relative Shannon’s entropy approach for quantifying urban growth using remote sensing and GIS: A case study of Cuttack City, Odisha, India. J Indian Soc Remote Sens. 2022;50(4):747–62. 10.1007/s12524-022-01493-z.Suche in Google Scholar
[67] Zachary D, Dobson S. Urban development and complexity: Shannon entropy as a measure of diversity. Plan Pract & Res. 2021;36(2):157–73. 10.1080/02697459.2020.1852664.Suche in Google Scholar
[68] Tuan NT, Hegedűs G. Urbanization and post-acquisition livelihood in a peri-urban context in Vietnam: A geographical comparison between Hanoi, Danang, and Vinh City. Land. 2022;11(10):1787. 10.3390/land11101787.Suche in Google Scholar
[69] Loi D. Những công trình giao thông nào ở Thừa Thiên Huế sắp được triển khai? (What traffic projects in Thua Thien Hue are about to be implemented?). baogiaothong; 2022. https://www.baogiaothong.vn/nhung-cong-trinh-giao-thong-nao-o-thua-thien-hue-sap-duoc-trien-khai-192576364.htm#:∼:text = Theo%20UBND%20tỉnh%20Thừa%20Thiên,tỷ%20đồng%2C%20chiếm%2052%25.Suche in Google Scholar
[70] Khoa A. Nguy cơ nhiều khu “đất vàng” tại Cố đô tiếp tục bị bỏ hoang (There is a risk that many “golden lands” in the Ancient Capital will continue to be abandoned). congannhandanonline; 2023. https://cand.com.vn/dieu-tra-theo-don-ban-doc/nguy-co-nhieu-khu-dat-vang-tai-co-do-tiep-tuc-bi-bo-hoang-i699905/.Suche in Google Scholar
© 2024 the author(s), published by De Gruyter
This work is licensed under the Creative Commons Attribution 4.0 International License.
Artikel in diesem Heft
- Regular Articles
- Theoretical magnetotelluric response of stratiform earth consisting of alternative homogeneous and transitional layers
- The research of common drought indexes for the application to the drought monitoring in the region of Jin Sha river
- Evolutionary game analysis of government, businesses, and consumers in high-standard farmland low-carbon construction
- On the use of low-frequency passive seismic as a direct hydrocarbon indicator: A case study at Banyubang oil field, Indonesia
- Water transportation planning in connection with extreme weather conditions; case study – Port of Novi Sad, Serbia
- Zircon U–Pb ages of the Paleozoic volcaniclastic strata in the Junggar Basin, NW China
- Monitoring of mangrove forests vegetation based on optical versus microwave data: A case study western coast of Saudi Arabia
- Microfacies analysis of marine shale: A case study of the shales of the Wufeng–Longmaxi formation in the western Chongqing, Sichuan Basin, China
- Multisource remote sensing image fusion processing in plateau seismic region feature information extraction and application analysis – An example of the Menyuan Ms6.9 earthquake on January 8, 2022
- Identification of magnetic mineralogy and paleo-flow direction of the Miocene-quaternary volcanic products in the north of Lake Van, Eastern Turkey
- Impact of fully rotating steel casing bored pile on adjacent tunnels
- Adolescents’ consumption intentions toward leisure tourism in high-risk leisure environments in riverine areas
- Petrogenesis of Jurassic granitic rocks in South China Block: Implications for events related to subduction of Paleo-Pacific plate
- Differences in urban daytime and night block vitality based on mobile phone signaling data: A case study of Kunming’s urban district
- Random forest and artificial neural network-based tsunami forests classification using data fusion of Sentinel-2 and Airbus Vision-1 satellites: A case study of Garhi Chandan, Pakistan
- Integrated geophysical approach for detection and size-geometry characterization of a multiscale karst system in carbonate units, semiarid Brazil
- Spatial and temporal changes in ecosystem services value and analysis of driving factors in the Yangtze River Delta Region
- Deep fault sliding rates for Ka-Ping block of Xinjiang based on repeating earthquakes
- Improved deep learning segmentation of outdoor point clouds with different sampling strategies and using intensities
- Platform margin belt structure and sedimentation characteristics of Changxing Formation reefs on both sides of the Kaijiang-Liangping trough, eastern Sichuan Basin, China
- Enhancing attapulgite and cement-modified loess for effective landfill lining: A study on seepage prevention and Cu/Pb ion adsorption
- Flood risk assessment, a case study in an arid environment of Southeast Morocco
- Lower limits of physical properties and classification evaluation criteria of the tight reservoir in the Ahe Formation in the Dibei Area of the Kuqa depression
- Evaluation of Viaducts’ contribution to road network accessibility in the Yunnan–Guizhou area based on the node deletion method
- Permian tectonic switch of the southern Central Asian Orogenic Belt: Constraints from magmatism in the southern Alxa region, NW China
- Element geochemical differences in lower Cambrian black shales with hydrothermal sedimentation in the Yangtze block, South China
- Three-dimensional finite-memory quasi-Newton inversion of the magnetotelluric based on unstructured grids
- Obliquity-paced summer monsoon from the Shilou red clay section on the eastern Chinese Loess Plateau
- Classification and logging identification of reservoir space near the upper Ordovician pinch-out line in Tahe Oilfield
- Ultra-deep channel sand body target recognition method based on improved deep learning under UAV cluster
- New formula to determine flyrock distance on sedimentary rocks with low strength
- Assessing the ecological security of tourism in Northeast China
- Effective reservoir identification and sweet spot prediction in Chang 8 Member tight oil reservoirs in Huanjiang area, Ordos Basin
- Detecting heterogeneity of spatial accessibility to sports facilities for adolescents at fine scale: A case study in Changsha, China
- Effects of freeze–thaw cycles on soil nutrients by soft rock and sand remodeling
- Vibration prediction with a method based on the absorption property of blast-induced seismic waves: A case study
- A new look at the geodynamic development of the Ediacaran–early Cambrian forearc basalts of the Tannuola-Khamsara Island Arc (Central Asia, Russia): Conclusions from geological, geochemical, and Nd-isotope data
- Spatio-temporal analysis of the driving factors of urban land use expansion in China: A study of the Yangtze River Delta region
- Selection of Euler deconvolution solutions using the enhanced horizontal gradient and stable vertical differentiation
- Phase change of the Ordovician hydrocarbon in the Tarim Basin: A case study from the Halahatang–Shunbei area
- Using interpretative structure model and analytical network process for optimum site selection of airport locations in Delta Egypt
- Geochemistry of magnetite from Fe-skarn deposits along the central Loei Fold Belt, Thailand
- Functional typology of settlements in the Srem region, Serbia
- Hunger Games Search for the elucidation of gravity anomalies with application to geothermal energy investigations and volcanic activity studies
- Addressing incomplete tile phenomena in image tiling: Introducing the grid six-intersection model
- Evaluation and control model for resilience of water resource building system based on fuzzy comprehensive evaluation method and its application
- MIF and AHP methods for delineation of groundwater potential zones using remote sensing and GIS techniques in Tirunelveli, Tenkasi District, India
- New database for the estimation of dynamic coefficient of friction of snow
- Measuring urban growth dynamics: A study in Hue city, Vietnam
- Comparative models of support-vector machine, multilayer perceptron, and decision tree predication approaches for landslide susceptibility analysis
- Experimental study on the influence of clay content on the shear strength of silty soil and mechanism analysis
- Geosite assessment as a contribution to the sustainable development of Babušnica, Serbia
- Using fuzzy analytical hierarchy process for road transportation services management based on remote sensing and GIS technology
- Accumulation mechanism of multi-type unconventional oil and gas reservoirs in Northern China: Taking Hari Sag of the Yin’e Basin as an example
- TOC prediction of source rocks based on the convolutional neural network and logging curves – A case study of Pinghu Formation in Xihu Sag
- A method for fast detection of wind farms from remote sensing images using deep learning and geospatial analysis
- Spatial distribution and driving factors of karst rocky desertification in Southwest China based on GIS and geodetector
- Physicochemical and mineralogical composition studies of clays from Share and Tshonga areas, Northern Bida Basin, Nigeria: Implications for Geophagia
- Geochemical sedimentary records of eutrophication and environmental change in Chaohu Lake, East China
- Research progress of freeze–thaw rock using bibliometric analysis
- Mixed irrigation affects the composition and diversity of the soil bacterial community
- Examining the swelling potential of cohesive soils with high plasticity according to their index properties using GIS
- Geological genesis and identification of high-porosity and low-permeability sandstones in the Cretaceous Bashkirchik Formation, northern Tarim Basin
- Usability of PPGIS tools exemplified by geodiscussion – a tool for public participation in shaping public space
- Efficient development technology of Upper Paleozoic Lower Shihezi tight sandstone gas reservoir in northeastern Ordos Basin
- Assessment of soil resources of agricultural landscapes in Turkestan region of the Republic of Kazakhstan based on agrochemical indexes
- Evaluating the impact of DEM interpolation algorithms on relief index for soil resource management
- Petrogenetic relationship between plutonic and subvolcanic rocks in the Jurassic Shuikoushan complex, South China
- A novel workflow for shale lithology identification – A case study in the Gulong Depression, Songliao Basin, China
- Characteristics and main controlling factors of dolomite reservoirs in Fei-3 Member of Feixianguan Formation of Lower Triassic, Puguang area
- Impact of high-speed railway network on county-level accessibility and economic linkage in Jiangxi Province, China: A spatio-temporal data analysis
- Estimation model of wild fractional vegetation cover based on RGB vegetation index and its application
- Lithofacies, petrography, and geochemistry of the Lamphun oceanic plate stratigraphy: As a record of the subduction history of Paleo-Tethys in Chiang Mai-Chiang Rai Suture Zone of Thailand
- Structural features and tectonic activity of the Weihe Fault, central China
- Application of the wavelet transform and Hilbert–Huang transform in stratigraphic sequence division of Jurassic Shaximiao Formation in Southwest Sichuan Basin
- Structural detachment influences the shale gas preservation in the Wufeng-Longmaxi Formation, Northern Guizhou Province
- Distribution law of Chang 7 Member tight oil in the western Ordos Basin based on geological, logging and numerical simulation techniques
- Evaluation of alteration in the geothermal province west of Cappadocia, Türkiye: Mineralogical, petrographical, geochemical, and remote sensing data
- Numerical modeling of site response at large strains with simplified nonlinear models: Application to Lotung seismic array
- Quantitative characterization of granite failure intensity under dynamic disturbance from energy standpoint
- Characteristics of debris flow dynamics and prediction of the hazardous area in Bangou Village, Yanqing District, Beijing, China
- Rockfall mapping and susceptibility evaluation based on UAV high-resolution imagery and support vector machine method
- Statistical comparison analysis of different real-time kinematic methods for the development of photogrammetric products: CORS-RTK, CORS-RTK + PPK, RTK-DRTK2, and RTK + DRTK2 + GCP
- Hydrogeological mapping of fracture networks using earth observation data to improve rainfall–runoff modeling in arid mountains, Saudi Arabia
- Petrography and geochemistry of pegmatite and leucogranite of Ntega-Marangara area, Burundi, in relation to rare metal mineralisation
- Prediction of formation fracture pressure based on reinforcement learning and XGBoost
- Hazard zonation for potential earthquake-induced landslide in the eastern East Kunlun fault zone
- Monitoring water infiltration in multiple layers of sandstone coal mining model with cracks using ERT
- Study of the patterns of ice lake variation and the factors influencing these changes in the western Nyingchi area
- Productive conservation at the landslide prone area under the threat of rapid land cover changes
- Sedimentary processes and patterns in deposits corresponding to freshwater lake-facies of hyperpycnal flow – An experimental study based on flume depositional simulations
- Study on time-dependent injectability evaluation of mudstone considering the self-healing effect
- Detection of objects with diverse geometric shapes in GPR images using deep-learning methods
- Behavior of trace metals in sedimentary cores from marine and lacustrine environments in Algeria
- Spatiotemporal variation pattern and spatial coupling relationship between NDVI and LST in Mu Us Sandy Land
- Formation mechanism and oil-bearing properties of gravity flow sand body of Chang 63 sub-member of Yanchang Formation in Huaqing area, Ordos Basin
- Diagenesis of marine-continental transitional shale from the Upper Permian Longtan Formation in southern Sichuan Basin, China
- Vertical high-velocity structures and seismic activity in western Shandong Rise, China: Case study inspired by double-difference seismic tomography
- Spatial coupling relationship between metamorphic core complex and gold deposits: Constraints from geophysical electromagnetics
- Disparities in the geospatial allocation of public facilities from the perspective of living circles
- Research on spatial correlation structure of war heritage based on field theory. A case study of Jinzhai County, China
- Formation mechanisms of Qiaoba-Zhongdu Danxia landforms in southwestern Sichuan Province, China
- Magnetic data interpretation: Implication for structure and hydrocarbon potentiality at Delta Wadi Diit, Southeastern Egypt
- Deeply buried clastic rock diagenesis evolution mechanism of Dongdaohaizi sag in the center of Junggar fault basin, Northwest China
- Application of LS-RAPID to simulate the motion of two contrasting landslides triggered by earthquakes
- The new insight of tectonic setting in Sunda–Banda transition zone using tomography seismic. Case study: 7.1 M deep earthquake 29 August 2023
- The critical role of c and φ in ensuring stability: A study on rockfill dams
- Evidence of late quaternary activity of the Weining-Shuicheng Fault in Guizhou, China
- Extreme hydroclimatic events and response of vegetation in the eastern QTP since 10 ka
- Spatial–temporal effect of sea–land gradient on landscape pattern and ecological risk in the coastal zone: A case study of Dalian City
- Study on the influence mechanism of land use on carbon storage under multiple scenarios: A case study of Wenzhou
- A new method for identifying reservoir fluid properties based on well logging data: A case study from PL block of Bohai Bay Basin, North China
- Comparison between thermal models across the Middle Magdalena Valley, Eastern Cordillera, and Eastern Llanos basins in Colombia
- Mineralogical and elemental analysis of Kazakh coals from three mines: Preliminary insights from mode of occurrence to environmental impacts
- Chlorite-induced porosity evolution in multi-source tight sandstone reservoirs: A case study of the Shaximiao Formation in western Sichuan Basin
- Predicting stability factors for rotational failures in earth slopes and embankments using artificial intelligence techniques
- Origin of Late Cretaceous A-type granitoids in South China: Response to the rollback and retreat of the Paleo-Pacific plate
- Modification of dolomitization on reservoir spaces in reef–shoal complex: A case study of Permian Changxing Formation, Sichuan Basin, SW China
- Geological characteristics of the Daduhe gold belt, western Sichuan, China: Implications for exploration
- Rock physics model for deep coal-bed methane reservoir based on equivalent medium theory: A case study of Carboniferous-Permian in Eastern Ordos Basin
- Enhancing the total-field magnetic anomaly using the normalized source strength
- Shear wave velocity profiling of Riyadh City, Saudi Arabia, utilizing the multi-channel analysis of surface waves method
- Effect of coal facies on pore structure heterogeneity of coal measures: Quantitative characterization and comparative study
- Inversion method of organic matter content of different types of soils in black soil area based on hyperspectral indices
- Detection of seepage zones in artificial levees: A case study at the Körös River, Hungary
- Tight sandstone fluid detection technology based on multi-wave seismic data
- Characteristics and control techniques of soft rock tunnel lining cracks in high geo-stress environments: Case study of Wushaoling tunnel group
- Influence of pore structure characteristics on the Permian Shan-1 reservoir in Longdong, Southwest Ordos Basin, China
- Study on sedimentary model of Shanxi Formation – Lower Shihezi Formation in Da 17 well area of Daniudi gas field, Ordos Basin
- Multi-scenario territorial spatial simulation and dynamic changes: A case study of Jilin Province in China from 1985 to 2030
- Review Articles
- Major ascidian species with negative impacts on bivalve aquaculture: Current knowledge and future research aims
- Prediction and assessment of meteorological drought in southwest China using long short-term memory model
- Communication
- Essential questions in earth and geosciences according to large language models
- Erratum
- Erratum to “Random forest and artificial neural network-based tsunami forests classification using data fusion of Sentinel-2 and Airbus Vision-1 satellites: A case study of Garhi Chandan, Pakistan”
- Special Issue: Natural Resources and Environmental Risks: Towards a Sustainable Future - Part I
- Spatial-temporal and trend analysis of traffic accidents in AP Vojvodina (North Serbia)
- Exploring environmental awareness, knowledge, and safety: A comparative study among students in Montenegro and North Macedonia
- Determinants influencing tourists’ willingness to visit Türkiye – Impact of earthquake hazards on Serbian visitors’ preferences
- Application of remote sensing in monitoring land degradation: A case study of Stanari municipality (Bosnia and Herzegovina)
- Optimizing agricultural land use: A GIS-based assessment of suitability in the Sana River Basin, Bosnia and Herzegovina
- Assessing risk-prone areas in the Kratovska Reka catchment (North Macedonia) by integrating advanced geospatial analytics and flash flood potential index
- Analysis of the intensity of erosive processes and state of vegetation cover in the zone of influence of the Kolubara Mining Basin
- GIS-based spatial modeling of landslide susceptibility using BWM-LSI: A case study – city of Smederevo (Serbia)
- Geospatial modeling of wildfire susceptibility on a national scale in Montenegro: A comparative evaluation of F-AHP and FR methodologies
- Geosite assessment as the first step for the development of canyoning activities in North Montenegro
- Urban geoheritage and degradation risk assessment of the Sokograd fortress (Sokobanja, Eastern Serbia)
- Multi-hazard modeling of erosion and landslide susceptibility at the national scale in the example of North Macedonia
- Understanding seismic hazard resilience in Montenegro: A qualitative analysis of community preparedness and response capabilities
- Forest soil CO2 emission in Quercus robur level II monitoring site
- Characterization of glomalin proteins in soil: A potential indicator of erosion intensity
- Power of Terroir: Case study of Grašac at the Fruška Gora wine region (North Serbia)
- Special Issue: Geospatial and Environmental Dynamics - Part I
- Qualitative insights into cultural heritage protection in Serbia: Addressing legal and institutional gaps for disaster risk resilience