Monitoring water infiltration in multiple layers of sandstone coal mining model with cracks using ERT
-
 ,
,

Abstract
Many engineering disasters are related to water infiltration in cracks. Understanding the water infiltration in multi-layered sandstone cracks is crucial for monitoring and preventing water-related disasters in coal mines. In this study, we utilized the electrical resistivity tomography (ERT) technique to conduct a water infiltration monitoring experiment on the 2d-strata-model with cracks. The electrical resistivity ratio profiles with respect to the background unveiled the existence of three cracks. Model photography demonstrates two cracks of those cracks. The infiltration cracks exhibit distinct shape of a stripe or island chain electrical change ratio anomaly in the resistivity ratio profiles. Electrical resistivity change ratio is associated with the infiltration within the cracks. As the infiltration progresses, the resistivity change ratios relative to the background gradually decreases. This is evident in the reduction in ratios in the original stripe or island chain areas in the electrical resistivity ratio profiles. The diminished range expands, manifesting as an increase in the area of the original stripe or island chain. The infiltration patterns of the cracks can be categorized into three types: a stripe pattern, island chain and stripe pattern, and island chain pattern. The preferential flow paths along the crack are related to both the infiltration time and the volume of infiltration. In the early stages, there are clear preferential flow paths along cracks. However, as infiltration time and volume increase, these preferential flow paths along the cracks become less pronounced and may even disappear. The findings prove that ERT is suitable for monitoring water infiltration along the cracks in multi-layered sandstone in the early infiltration stage. Experiment results monitoring water infiltration cracks on the 2D-model show that the ERT and 2D-model are suitable for studying water infiltration along the cracks. This research can provide valuable reference for preventing engineering disaster.
1 Introduction
Over half of coal mining geological hazards are closely linked to water infiltration. Most engineering water disasters are connected to the seepage of water through cracks in the rock and soil. Understanding and monitoring water infiltration in cracks is of paramount importance.
In recent years, electrical resistivity tomography (ERT) has gained wide application in various fields such as agriculture, hydro-geology, pollution assessment, and seawater intrusion investigation [1,2,3,4]. Some scholars employ ERT to investigate and research on aquifers in the vadose and fractures zone [5,6,7,8,9].
Researchers and engineers have utilized ERT in the field or laboratory, aided by water and salt tracing, to study the flow pathways and preferential flow in limestone cracks [10,11,12] and basalt cracks [13,14,15]. In addition, the evolution of the desiccation and fissure in the clay was detected, and it has been proved that injecting the NaCl helps to detect the desiccation [12,16]. However, note the low number of studies in monitoring water or injection tracer infiltration in the sandstone with cracks.
This study employed a simulated coal mining model comprising sandstone and mud-stone roof strata. The experiment involved studying water infiltration through cracks formed after mining, and monitoring the infiltration process using ERT. Due to the predominant presence of sand in the mud-stone composition of the model, the mud-stone exhibits permeability characteristics similar to that of sandstone. The model we used in the experiment can be considered as a multi-layered sandstone model. The primary objectives of this research are as follows: (1) to ascertain the anomalous characteristics of electrical resistivity changes associated with crack infiltration; (2) to determine the infiltration patterns of water in the multiple layers of sandstone with the cracks; and (3) to assess the effectiveness of ERT for monitoring water infiltration along cracks in multiple layers sandstone.
2 Method and experiment
2.1 Coal seam mining model
The experimental model (3,000 mm in length, 1,055 mm in height, and 300 mm in width) using a scale ratio of 1:300 compared to the actual geological strata (Figure 1) was to simulate the 10-coal mining at the 10,414 working face, Huainan Coalfield. The river sand, calcium carbonate, gypsum, and animal glue were the primary materials used to make the formation of the geological layers in the experimental model. The river sand served as the aggregate material, while the calcium carbonate and gypsum served as the cementitious materials, and the animal glue acted as the retarder. The composition ratios of the different strata materials and the corresponding heights of each layer are as given in Table 1.

Schematic diagram of similar strata of 10,414 working face.
Statistics of materials model
| Stratum numbered | Stratum type | Sand (kg) | Calcium carbonate (kg) | Gypsum (kg) | Water (kg) | Animal glue (g) | Model height (cm) |
|---|---|---|---|---|---|---|---|
| 1 | Diorite | 87.1 | 8.71 | 20.32 | 16.59 | 331.79 | 8.7 |
| 2 | Mud-stone | 121.5 | 14.16 | 6.08 | 15.75 | 315 | 10.5 |
| 3 | Fine sandstone | 37.13 | 5.20 | 2.23 | 4.95 | 99 | 3.3 |
| 4 | Mud-stone | 71.74 | 8.37 | 3.59 | 9.3 | 186 | 6.2 |
| 5 | Silt-stone | 48.38 | 6.77 | 2.90 | 6.45 | 129 | 4.3 |
| 6 | Diorite | 158.96 | 15.90 | 37.09 | 30.28 | 605.6 | 15.7 |
| 7 | Mud-stone | 45.13 | 5.27 | 2.26 | 5.85 | 117 | 3.9 |
| 8 | Fine sandstone | 82.69 | 5.91 | 5.91 | 10.5 | 210 | 7.0 |
| 9 | Mud-stone | 37.03 | 4.32 | 1.85 | 4.8 | 96 | 3.2 |
| 10 | Sandstone | 38.48 | 8.98 | 3.85 | 7.33 | 146.6 | 3.8 |
| 11 | Mud-stone | 69.43 | 8.10 | 3.47 | 9 | 180 | 6.0 |
| 12 | Silt-stone | 61.88 | 8.66 | 3.71 | 8.25 | 165 | 5.5 |
| 13 | Mud-stone | 45.13 | 5.27 | 2.26 | 5.85 | 117 | 3.8 |
| 14 | Fine sandstone | 35.64 | 6.24 | 2.67 | 4.95 | 99 | 3.3 |
| 15 | 10-coal | 14.18 | 1.42 | 0.61 | 1.8 | 36 | 1.2 |
| 16 | Sandstone | 112.5 | 11.25 | 11.25 | 15 | 300 | 10 |
| 17 | Mud-stone | 105.3 | 12.29 | 5.27 | 13.65 | 273 | 9.1 |
It can be found from Table 1 that the primary material used for each stratum is mainly the sand. Therefore, the sandstone layers in the model are very similar to the actual sandstone, while other layers such as mud-stone and silt-stone maintain the permeability properties of sandstone due to their mainly sand composition.
The 30 cm coal seam was left, which was to ensure the safety during the mining on both the leftmost and rightmost sides of the model. Excavation were started from the right side to the left side of the model (Figure 1). Each excavation was done up to 5 cm of coal seam, followed by a 1 h pause. This process continued until all coal layers were completely excavated.
Several visible cracks resulting in the roof collapsed after the extraction of the 10-coal seam can be categorized into two main types: inclined and nearly horizontal layer cracks. The area with visible cracks (Figure 2) near the protective coal pillars were selected for the water infiltration experiment.

Cracks and roof strata after the 10-coal mining.
2.2 Method
ERT is to inject low-frequency electrical current into the geological body using a pair of current electrodes (A and B) and to measure the potential between two electrodes (M and N) or multiple different potential electrodes. Electrical resistivity is calculated using coefficient K, ΔU, and I. Coefficient K is related to electrode spacing, and electrode configuration. The equations for electrical resistivity and K are as follows:
where ρ is the electrical resistivity, K is the coefficient depending on the position of A, B, M, and N. ΔU is the potential difference measured between the electrodes M and N. I is the current which is injected in the geological body through the electrodes A and B. AM, BM, AN, and BN are the distances between A and M, B and M, A and N, and B and N, respectively.
Time-lapse ERT was used to make profiles of electrical resistivity changes before and during infiltration phase. The relative electrical resistivity change ratios (time-lapse) were calculated using equation (3) between the electrical resistivity collected before and after infiltration.
where
The relationship between electrical resistivity and moisture content was established to study the water infiltration in the soil using ERT. Relationships commonly used are the equations specifically applicable to both coarse-grain soils (equation (4)) [17] and fine texture soils (equation (5)) [18].
where
By incorporating equations (3)–(5), the spatiotemporal variations in electrical resistivity change ratios and their relationship with soil moisture content and infiltration could be assessed.
2.3 Experiment
In Figure 3, the water supply system consists of a water bucket, a hose, and a control valve. The bucket has a capacity of 20 L, and the control valve regulates the water supply rate. One side of the hose was in the plastic bucket, while the other side was fitted into the hole dug to supply water in the model as the water outlet. To provide water dynamics, the water bucket was placed on the peak of the model.
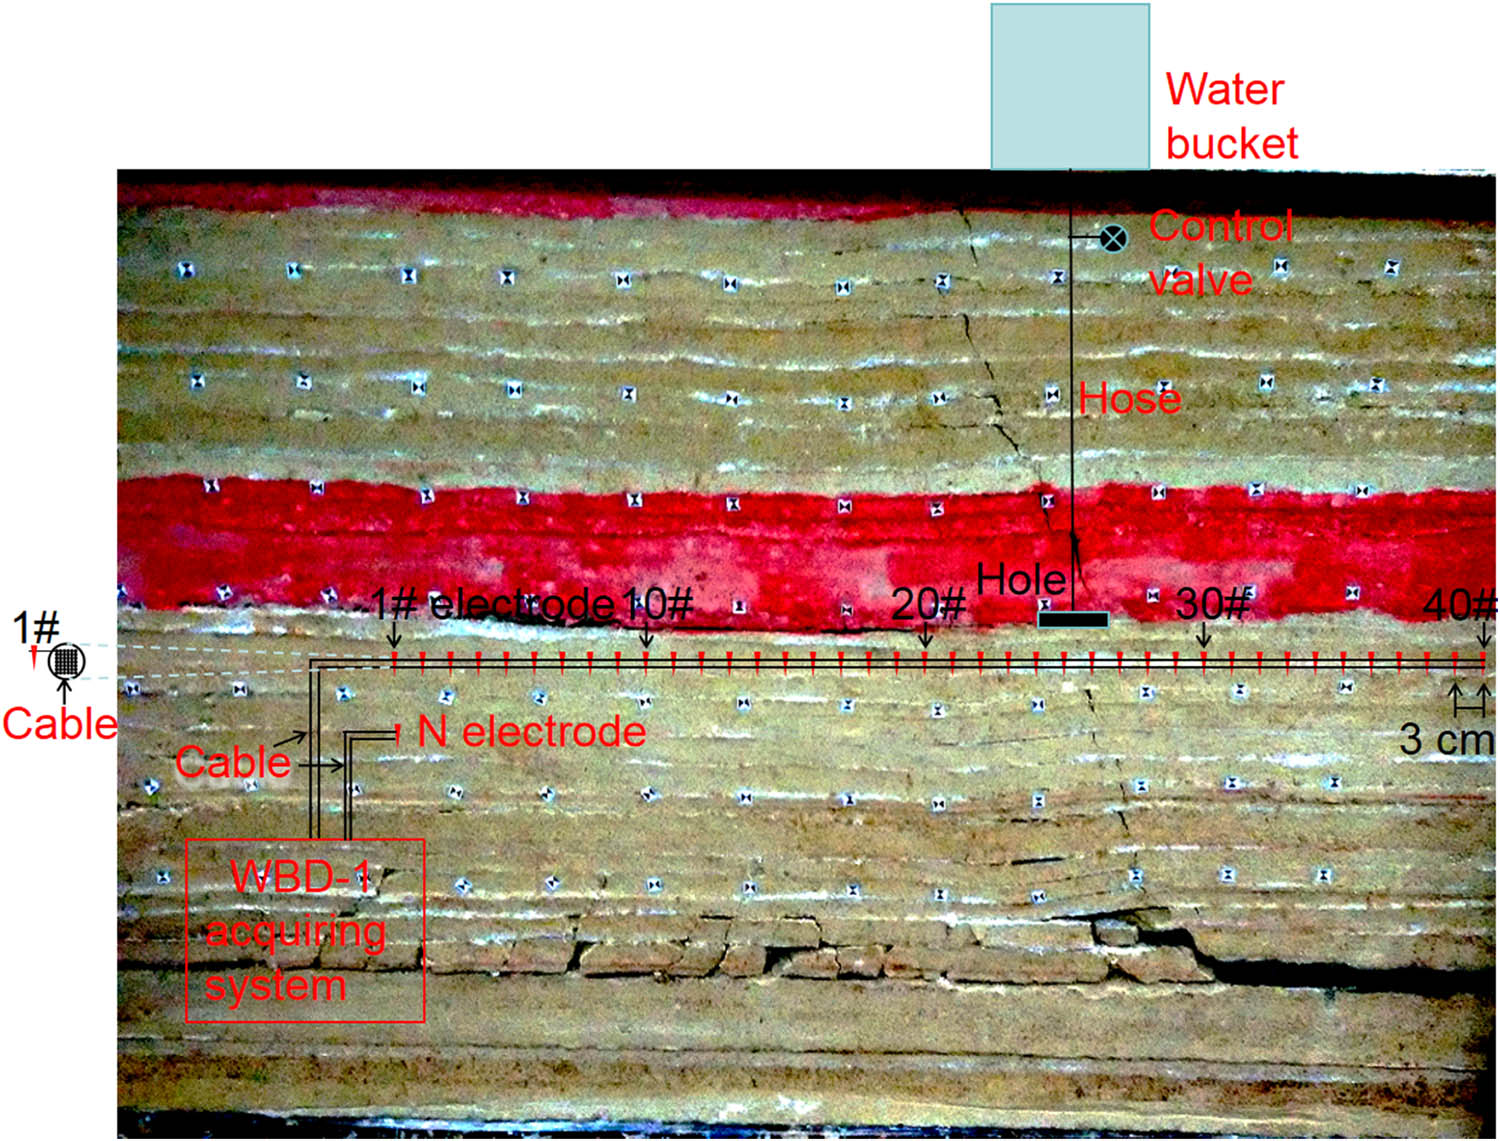
Schematic diagram supplying water and electrical resistivity acquiring system; 1#, 10#, 20#, 30#, and 40# were the 1st, 10th, 20th, 30th, and 40th electrodes, respectively.
A measurement line was horizontally positioned beneath the diorite layer of the experimental model, and 40 electrodes were set with a spacing of 3 cm between adjacent electrodes as shown in Figure 3. The reference electrode N was positioned adjacent to the first electrode. Material of the electrodes used in the experiment is copper rods with 0.1 mm in diameter and 4 cm in length. The parallel electrical resistivity network system (WBD-1), which is the multi-electrode system, was used to acquire the ERT data. WBD-1 has two acquiring data methods: AN and ABN. ABN method has two types of electrodes, the injecting current electrodes and the measuring potential electrodes. Each electrode alternately serves as a current and potential electrode. The ABN method was used in our experiment because data acquiring using that can decode to the traditional electrode array by the WBDpro.
Before the water supply, WBD-1 was utilized to acquire the background data. Subsequently, data acquisition commenced at 15 min intervals following the initiation of the water supply. This data collection process continued for 300 min, resulting in the acquisition of 20 datasets.
ERT in our experiment monitoring water infiltration in the model with crack was performed using the Wenner-alpha electrode array, which are very sensitive to vertical variations in electrical resistivity.
3 Results
3.1 Data processing and interpretation procedure
To achieve ERT monitoring of water infiltration within cracks, it is necessary to process and interpret the acquired raw data. The specific procedure is illustrated in Figure 4.

Schematic diagram procedure of data processing and interpreting.
The data collected by the WBD-1 parallel electrical method instrument is processed using specialized software known as WBDpro. Initially, the potential distribution patterns measured by other measurement electrodes are sequentially examined when each current electrode provides current. Any anomalies in the data are either removed or corrected. Then, the data are decoded using averaging methods with a selected cutoff time of 50 ms to minimize interference. Finally, based on the data from the right side of the current electrode and utilizing equation (1) and the Wenner-alpha array configuration, which has 13 levels (Figure 5), apparent resistivity calculations are done.

Levels of acquiring data.
Based on the calculated background and apparent resistivity values at time “t,” you can use equation (3) to obtain the apparent resistivity change ratios relative to the background. Subsequently, you can create resistivity change ratio profiles relative to the background using software such as Surfer 8.0. Image of the change ratios in electrical resistivity were helpful for characterizing the infiltration behavior. Compared to the resistivity image, the resistivity change ratio image relative to the background enhances the clarity of infiltration information by reducing the background’s influence.
Empirical relationships equations (4) and (5) allow us to use the resistivity change ratios (R) to interpret the soil moisture change and water infiltration in sand or sandstone.
3.2 Analysis of results
In Figure 6, electrical resistivity change ratios (R) relative to background resistivity was calculated using equation (3).


Time sequence of resistivity change ratios relative to background; 15–300 min profiles based on the data were acquired when water infiltration lasted 15–300 min. C1, C2, IC1, and IC2 are respectively the first crack, second crack, first island chain, and second island chain; the values in the color bar is resistivity change ratio R between
Our primary focus is on studying water infiltration within cracks, where the electrical resistivity change ratio decreases. Therefore, we should pay closer attention to the areas where the resistivity change ratio decreases. In the resistivity change ratio profile, we have set the color scale range to be 0–1.2 with intervals of 0.04. To highlight the areas where the resistivity change ratio decreases, we have whitened the parts with larger change ratios. After several attempts, we found that by truncating the range in the color scale to values greater than 0.52 and whitening them, we can better represent water infiltration within the cracks. Consequently, in the following profile, we have chosen the color scale to be within the range of 0–0.52, with values greater than 0.52 being whitened.
In the 15 min profile, a distinct area with significant resistivity change appears near the surface. This area resembles a suspended water droplet-shaped electrical resistivity change ratios anomaly and does not originate from the surface, indicating that it may be caused by water infiltration along the crack. In the 30 min profile, there is a combination of strip-shaped and semi-elliptical anomaly area with significant resistivity change. The stripe-shaped area (C1[depth 0 to −0.16]) is attributed to water infiltration along the crack. The semi-elliptical region is caused by water infiltration in the non-fractured zone of the sandstone. In the 45–60 min profile, the strip-shaped area of resistivity change elongates and widens, indicating water permeating along the crack and spreading around it during the seepage process. The non-semi-elliptical area also gradually expands, representing water infiltration in the non-fractured sandstone layers.
In addition to the prominently observed areas of the stripe and semi-elliptical resistivity change anomaly, there is an island chain resistivity ratios anomaly, caused by water infiltrating a newly formed crack in the 75 min profile. We designated this anomaly area as IC1 (depth −0.14 to −0.28). In the 90 min profile, the island chain area IC1 (depth −0.14 to −0.28) in the 75 min profile transitions into a stripe anomaly area C2 (depth −0.14 to −0.28), connecting with the resistivity variation area of the C1 (depth 0 to −0.24), suggesting it corresponds to the layered crack area seen in Figure 1. Additionally, a distinct isolated island-shaped area (depth 0 to −0.08) of significant resistivity change anomaly appears in the shallow portion, resulting from water infiltration at the shallow depth. Between the C1 (depth 0 to −0.24) and C2 (depth −0.14 to −0.28) cracks, as well as in the connecting area, there is a blank area where water flow along the two cracks and the layered crack occurs, indicating the absence of water infiltration in that area.
In the 105 min profile, the emergence of island chain IC2 (depth −0.12 to −0.34) resistivity ratios anomaly indicates the presence of a crack within the corresponding detection zone in the model. The diminished blank area between the first crack corresponding to C1 (depth 0 to −0.24) and second crack corresponding to C2 (depth −0.14 to −0.28) is primarily attributed to the continuous outward flow of infiltrating water along the crack pathways. From the 120–300 min profiles, the semi-elliptical areas within the entire areas progressively expand until reaching the limits of the survey, signifying the expanding range of water infiltration in the non-fractured domain. The elongation and widening of the stripe resistivity ratio anomaly area aligned with the first crack demonstrate the water flow along this crack and its dispersion into the surrounding medium. The C2 ((depth −0.14 to −0.28) in the 120 min profile to (depth −0.14 to −0.28) in the 150 min profile) stripe resistivity ratios anomaly widens until they coincide with the resistivity ratios anomaly C1 (depth 0 to −0.24) in the 150 min profile. From the 180–270 min profiles, there is no change in C2 (depth 0 to −0.30) anomaly area. Only the central areas of the stripes C2 (depth 0 to −0.30) remain the locus of the more pronounced resistivity ratios variations (color darkens). From the 285–300 min profiles, C1 (depth 0 to −0.24) and C2 (depth 0 to −0.30) are connected together, making it difficult for us to distinguish them. It indicates that the water infiltration along the crack is not obvious. The IC2 (in the 105–255 min profiles) steadily grows. The deepest island of IC2 (in the 270–300 min profiles) connect to C2.
3.3 Comparison of experiment results and photographs
In Figure 7, the 15 min profile and photograph shows that the suspended water droplet-shaped anomaly aligns with the locations of the first crack. In the 30 min profile and photograph, the C1 (depth 0 to −0.16) stripe of resistivity change anomaly corresponds directly to the positions of first crack. In the 90 min profile and photograph, the C1 (depth 0 to −0.24) stripe anomaly area aligns with the first crack location, and an additional green stripe C2 (depth −0.14 to −0.28) resistivity ratios variation appears. Although there is no visible second crack on the surface of the model, the deepest part corresponds to the gap of the crack, indicating the presence of a hidden second crack internally. The connecting area between the first and second cracks corresponds to the location with layered cracks. In the non-fractured shallow area, there is an elliptical-shaped resistivity change anomaly area, which is the result of infiltration within the multiple layers of sandstone. In the 300 min profile and photograph, the deepest parts of the first and second cracks align precisely with the positions of the sandstone crack. The IC2 (depth 0 to −0.34) islands chain resistivity change anomaly area may indicate the presence of the third crack, and there are some signs of collapse in the coal seam roof model, although they are not prominent. The non-fractured area exhibits a semi-elliptical-shaped resistivity ratios variation anomaly area. From the experimental results, it appears that visible cracks or crack traces in photographs can be used to validate ERT monitoring of water infiltration within cracks. However, it is important to note that some cracks may only be visible internally or exhibit significant differences between the surface and internal cracks, which can indeed pose limitations when verifying water infiltration within cracks through monitoring.


Comparison of measured results and photographs. (a)–(d) 15, 30, 90, and 300 min profiles based on the data were acquired when water infiltration lasted for 15, 30, 90, and 300 min.
3.4 Water infiltration pattern in the multi-layers sandstone with cracks
In Figure 8, the C1 (depth 0 to −0.16) (30 min) stripe anomaly area starts from the shallowest part, and as the infiltration continues, the C1 (45–120 min) stripe anomaly consistently becomes longer and wider, with the length increasing faster than the width. The initiation from the shallowest part indicates that water starts to infiltrate from the terminal position of the crack within the detection range. The continuous lengthening and widening of the stripe indicate sufficient moisture content. The faster lengthening rate than the width suggests that the preferential flow occurs along the crack. Thus, water infiltrates from the end of the crack within the detection range, and the moisture content is sufficient. The infiltration pattern exhibits a stripe pattern, the preferential flow of water along the crack, while water also infiltrates around the crack. C1 (150–300 min profile) is not the stripe shape. It indicates that the preferential flow of water along the crack is not obvious.

The infiltration process in the multi-layer sandstone with cracks. C1, C2, IC1, and IC2 are, respectively, the first crack, second crack, first island chain, and second island chain. 15–300 min images based on the data were acquired when water infiltration lasted for 15–300 min.
The IC1 (depth −0.14 to −0.27) anomaly starts from the middle of the detection depth. Due to insufficient moisture and varying water content in the multi-layered sandstone, it appears as a chain of islands. As infiltration progresses, the IC1 (depth −0.14 to −0.27) anomaly in the 75 min profile transforms into the C2 (depth −0.14 to −0.28) anomaly in the 90 min profile while being connected to the C1 anomaly in the 90 min profile.
The C2 (90–120 min profile) anomaly becomes longer and wider. The infiltration pattern in the crack, when not occurring at the crack ends and under conditions of low moisture content, is characterized by the preferential flow of water along the crack, with different sandstone layers around the fissure exhibiting varying degrees of water absorption, resulting in an island chain-like pattern. When the moisture content is sufficient, the island chain pattern transforms into a stripe pattern, where the preferential flow of water continues along the crack, and water also infiltrates around the crack. After 90 min of continuous infiltration, the shallow anomaly can still be considered part of the island chain IC1 (depth 0 to −0.28), but with two infiltration sources within the crack.
As the infiltration progresses, the islands within the island chain pattern in the IC2 (105–300 min profile) anomaly become longer and wider. At the 300 min profile, two islands are connected to both the C2 and C1 anomalies, indicating the presence of multiple infiltration sources within the crack where the IC2 (depth 0 to −0.34) anomaly is located. The infiltration pattern of a crack with multiple sources infiltrating is characterized by an island chain pattern, where the preferential flow of each infiltration source occurs along the crack. Additionally, there is also infiltration around the crack. Some islands are connected to the infiltration sources, and as the infiltration continues for a sufficient duration, the island chain pattern IC1 (depth −0.14 to −0.27) in the 75 min profile transforms into a stripe pattern C2 (depth −0.14 to −0.28) in the 90 min profile.
The C1 and non-crack portions undergo simultaneous infiltration, resulting in a combination anomaly of stripes (Figure 8. C1) and semi-ellipses (Figure 8. SE). As the infiltration progresses, the stripes become longer and wider, while the range of the semi-ellipses gradually expands. The infiltration pattern is characterized by the combination of a stripe and a bulb pattern, where the preferential flow of water occurs along the crack and infiltration around the crack. In the non-crack area, the infiltration pattern exhibits a bulb-shaped flow.
Water infiltration in a uniform medium typically exhibits a regular semi-elliptical pattern. However, the results of this experiment indicate that water infiltration within the model forms irregular semi-elliptical patterns. This irregularity can be attributed to the model’s composition of multiple layers of heterogeneous media, with each layer not being entirely uniform. Additionally, the presence of cracks near the vadose area further contributes to this irregular infiltration pattern.
4 Discussion
In order to understand the infiltration patterns of water in multi-layered sandstone with cracks, the second experiment was performed. First, mining experiment was conducted on a coal model to generate cracks. Subsequently, ERT was utilized on the model with cracks to monitor the water infiltration. The resistivity change ratios profiles reveal that the infiltration pattern of water in multi-layered sandstone with cracks follows island chain or a stripe and a bulb pattern. The experimental results demonstrate that ERT can effectively monitor water infiltration within cracks in the early stage.
The water infiltration pattern in non-fractured areas manifests as semi-elliptical or partially semi-elliptical shapes. This observation aligns with the numerical simulations [18,19], laboratory experiments, and fields [20–22]. The semi-elliptical anomaly primarily represents no water entering the cracks and infiltrating the sandstone. Hence, the infiltration pattern takes the form of a bulb. The partial semi-elliptical shape anomaly occurs when water infiltrates the cracks and participates in both the semi-elliptical flow and the flow within the cracks. The affected portion of the semi-elliptical anomaly becomes partially influenced, resulting in a partial bulb pattern.
The pattern of water infiltration at crack locations follows island chain or a stripe pattern, similar to the findings of Liu et al. [23]. The difference lies in using relatively low resistivity anomalies in Jing Liu’s study, where the anomalies appear as stripe low resistivity areas. Similarly, the results align with the research conducted by Geng et al. [24], who investigated water infiltration in a two-layered fine sand with embedded gravel experiments. The permeability of the gravel is higher than that of the surrounding fine sand, resembling the behavior of cracks. Thus, the results show similarities.
The preferential flow paths for monitoring crack infiltration are related to both the infiltration time and the volume of infiltration. In the early stages of water infiltration, there are clear preferential flow paths along cracks. However, as infiltration time and volume increase, these preferential flow paths along the cracks become less pronounced and may even disappear. For instance, in Figure 4, the crack corresponding to C1 exhibits distinct preferential flow paths in the profiles ranging from 15 to 120 min. However, in the profiles from 135 to 180 min, these preferential flow paths are not clearly discernible. Finally, in the profiles from 195 to 300 min, they completely disappear. Therefore, when monitoring water infiltration in cracks, early monitoring is more advantageous for detecting preferential flow paths. Similarly, in engineering applications, the earlier you detect crack defects and their locations, the more advantageous it is for crack detection, especially in relation to the timing of infiltration initiation.
The shape of infiltration anomalies is influenced by factors such as the material’s porosity, the orientation of cracks, and the connectivity of cracks. The greater the porosity of the material, the smaller the difference between water infiltration along the pores and water infiltration along the cracks. Therefore, the preferential flow paths along cracks become less distinct, and the shape of anomalies along the cracks becomes less pronounced. Conversely, the smaller the porosity of the material, the greater the difference between water infiltration along the pores and water infiltration along the cracks. This makes the preferential flow paths along the cracks more pronounced, and the shape of anomalies along the cracks more distinct, such as C1 in Figure 6(a) and C2 in Figure 6(c). Cracks have a specific orientation, and because the preferential flow path of water infiltration follow the crack, it results in the anomaly shape in the direction consistent with the crack. When the cracks are interconnected, the preferential flow paths of water infiltration also overlap, causing the anomaliesalong each crack to stack together, such as C1 and C2 in Figure 7(c) to stack together.
Geological formations are typically situated in semi-spaces, and internal cracks that form within them are often invisible. Water infiltrating through these cracks is akin to a process inside a black box. Monitoring the flow of water within these cracks can be challenging to validate. In this study, we employed a two-dimensional model that simulates the generation of cracks in a three-dimensional model. These visible cracks allow us to monitor water infiltration, providing a more reliable means of validation. Due to the verifiability of these monitoring results, they hold greater practical value. Currently, this model finds primary applications in coal mining and can potentially be extended to other engineering domains.
It is important to note some limitations in this study. The cracks used in our experiment were based on coal mining model experiments rather than actual cracks. Additionally, the study did not consider the influence of hydrological parameters such as water temperature, infiltration velocity, etc. Future research should include field experiments or practical studies to examine actual fractures and explore the impact of various hydrological factors.
5 Conclusion
The experimental results and photographic verification demonstrate that the preferential flow paths along the crack for monitoring crack infiltration are related to both the infiltration time and the volume of infiltration. In the early stages of water infiltration, there are clear preferential flow paths along cracks. However, as infiltration time and volume increase, these preferential flow paths along the cracks become less pronounced and may even disappear. ERT is suitable for monitoring water infiltration along cracks in multi-layer sandstone. It enables the determination of the spatiotemporal distribution of water infiltration, the characterization of water infiltration processes within the cracks in the infiltration early stage, and the identification of water infiltration preferential flow pathways along the crack in the infiltration early stage.
Experimental results show that ERT and the two-dimensional model are suitable to study the water infiltration along the cracks. On the one hand, visible cracks can verify water infiltration along the cracks displayed by ERT. On the other hand, ERT can demonstrate water infiltrating along invisible cracks and study the relationship between visible and invisible cracks.
The infiltration characteristics in the cracks in the electrical resistivity ratio profiles relative to the background are a stripe or island chain electrical resistivity change ratio anomaly. Electrical resistivity change ratio relative to the background is associated with the infiltration within the cracks. With the infiltration progress, the ratio of electrical resistivity change relative to the background gradually decreases. This is evident in the reduction in ratios in the original stripes or island chain areas in the electrical resistivity ratio profiles. The diminished range expands, manifesting as an increase in the area of the original stripes or island chain. That provides a reference for interpreting the determination of water infiltration in the cracks using electrical resistivity change ratio profiles.
The infiltration patterns of water in the multiple layers of sandstone with the cracks are as follows:
Water infiltrates from the terminal position of the crack within the detection range, and the moisture content is sufficient. The infiltration pattern exhibits a stripe pattern, the preferential flow of water along the crack, while water also infiltrates around the crack.
When the infiltration point is located at a non-terminal crack position and the water supply is insufficient, it exhibits an island chain infiltration pattern. The preferential flow of water is along the crack, with different sandstone layers around the crack exhibiting varying degrees of water absorption. When the moisture content is sufficient, the island chain pattern transforms into a stripe pattern, where the preferential flow of water continues along the crack, and water also infiltrates around the crack. For example, in Figure 5, the island chain area IC1 (depth −0.14 to −0.28) in the 75 min profile transitions into a stripe anomaly area C2 (depth −0.14 to −0.28) in the 90 min profile.
The infiltration pattern of a crack with multiple sources infiltrating is characterized by an island chain pattern, where the preferential flow of each infiltration source occurs along the crack. Additionally, there is also infiltration around the crack. Some islands are connected to the infiltration sources, and as the infiltration continues for a sufficient duration, the island chain pattern transforms into a stripe pattern.
The infiltration pattern of simultaneous flow in the cracks and non-crack areas combines a stripe and a bulb pattern, where the preferential flow of water occurs along the crack, and infiltration around the crack. In the non-crack area, the infiltration pattern exhibits a bulb-shaped flow.
Acknowledgements
This research was funded by national natural science foundation of China (Major Program No. 42090054, No. 52239006, and No. 91958108). The Natural Science Foundation of Hubei Province of China (Innovation Group Program: No. 2022CFA002). In addition, the first author Liang Du would also like to thank the support from the State Scholarship Fund of China Scholarship Council (No. 202108320167). We appreciate also the helpful comments of two anonymous reviewers.
-
Author contributions: Liang Du, Zhongling Zong, and Wenjin Zhu conceived and designed this study. Liang Du conducted the experiment. Zhenglei Zhu and Teng Qin created maps based on electrical resistivity data. Teng Qin and Liang Du analyzed the data and prepared the initial manuscript. Hideki Mizunaga revised the manuscript and improved the language. All three authors finalized the research article together.
-
Conflict of interest: The authors declare no conflict of interest.
References
[1] Morenno Z, Arnon-zur A, Furman A. Hydro-geophysical monitoring of orchard root zone dynamics in semi-arid region. Irrig Sci. 2015;33(4):303–18.10.1007/s00271-015-0467-3Search in Google Scholar
[2] Hermans T, Nguyen F, Caers J. Uncertainty in training image-based inversion of hydraulic head data constrained to ERT data: Workflow and case study. Water Resour Res. 2015;51(7):5332–52.10.1002/2014WR016460Search in Google Scholar
[3] Lu Y, Tao J, Cao C, Liu H, Liu Y, Ge Z. Detection of landfill leachate leakage based on ERT and OCTEM. Water. 2023;15(9):1778.1–13.10.3390/w15091778Search in Google Scholar
[4] Crestani E, Camporese M, Belluco E, Bouchedda A, Gloaguen E, Salandin P. Large-scale physical modeling of salt-water intrusion. Water. 2022;14(8):1183.10.3390/w14081183Search in Google Scholar
[5] Daily W, Ramirez A, Labrecque D, Nitao J. Electrical resistivity tomography of vadose water movement. Water Resour Res. 1992;28(5):1429–42.10.1029/91WR03087Search in Google Scholar
[6] Day‐Lewis, FD, Lane JW, Harris JM, Gorelick SM. Time-lapse imaging of saline-tracer transport in fractured rock using difference-attenuation radar tomography. Water Resour Res. 2003;39(10):10.1–14.10.1029/2002WR001722Search in Google Scholar
[7] Binley A, Winship P, West LJ, Pokar M, Middleton R. Seasonal variation of moisture content in unsaturated sandstone inferred from borehole radar and resistivity profiles. J Hydrol. 2002;267(3–4):160–72.10.1016/S0022-1694(02)00147-6Search in Google Scholar
[8] Binley A, Cassiani G, Middleton R, Winship P. Vadose zone flow model parameterisation using cross-borehole radar and resistivity imaging. J Hydrol. 2002;267(3–4):147–59.10.1016/S0022-1694(02)00146-4Search in Google Scholar
[9] Garcia-Artigas R, Himi M, Revil A, Urruela A, Lovera R, Sendrós A, et al. Geophysical characterization of hydraulic properties around a managed aquifer recharge system over the Llobregat River Alluvial Aquifer (Barcelona Metropolitan Area). Water. 2020;12(12):3455.10.3390/w12123455Search in Google Scholar
[10] Slater L, Binley AM, Daily W, Johnson R. Cross-hole electrical imaging of a controlled saline tracer injection. J App Geophy. 2000;44(2–3):85–102.10.1016/S0926-9851(00)00002-1Search in Google Scholar
[11] Slater L, Binley AM, Brown D. Electrical imaging of fractures using ground-water salinity change. Groundwater. 1997;35(3):436–42.10.1111/j.1745-6584.1997.tb00103.xSearch in Google Scholar
[12] Jones G, Sentenac P, Zielinski M. Desiccation cracking detection using 2-D and 3-D Electrical Resistivity Tomography: Validation on a flood Embankment. J App Geophy. 2014;106:196–211.10.1016/j.jappgeo.2014.04.018Search in Google Scholar
[13] Nimmer RE, Osiensky JL. Electrical resistivity imaging of conductive plume dilution in fractured rock. Hydrogeol J. 2007;15:877–90.10.1007/s10040-007-0159-zSearch in Google Scholar
[14] Nimmer RE, Osiensky JL. Using mise-a-la-masse to delineate the migration of a conductive tracer in partially saturated basalt. Env Geosci. 2002;9(2):81–7.10.1046/j.1526-0984.2002.92005.xSearch in Google Scholar
[15] Nimmer RE. Direct current and self-potential monitoring of an evolving plume in partially saturated fractured rock. J Hydrol. 2002;267(3–4):258–72.10.1016/S0022-1694(02)00155-5Search in Google Scholar
[16] Sentenac P, Zielinski M. Clay fine fissuring monitoring using miniature geo-electrical resistivity arrays. Env Earth Sci. 2009;59:205–14.10.1007/s12665-009-0017-5Search in Google Scholar
[17] Archie GE. The electrical resistivity log as an aid in determining some reservoir characteristics. Trans AIME. 1942;146:54–62.10.2118/942054-GSearch in Google Scholar
[18] Waxman MH, Smits L. Electrical conductivities in oil-bearing shaly sands. Soc Pet Eng J. 1968;8:107–22.10.2118/1863-ASearch in Google Scholar
[19] Yao WW, Ma XY, Li J, Parkes M. Simulation of point source wetting pattern of subsurface drip irrigation. Irrig Sci. 2011;29(4):331–9.10.1007/s00271-010-0236-2Search in Google Scholar
[20] Hardie M, Ridges J, Swarts N, Close D. Drip irrigation wetting patterns and nitrate distribution: comparison between electrical resistivity (ERI), dye tracer, and 2D soil–water modelling approaches. Irrigation Sci. 2018;36(2):97–110.10.1007/s00271-017-0567-3Search in Google Scholar
[21] Laloi G, Montarry J, Guibert, M, Andrivon D, Michot D, Le May C. Spatial and temporal monitoring of soil water content with an irrigated corn crop cover using surface electrical resistivity tomography. Water Resour Res. 2003;39(5):14.6–20.10.1029/2002WR001581Search in Google Scholar
[22] Al-Ogaidi AAM, Wayayok A, Rowshon MK, Abdullah AF. Wetting patterns estimation under drip irrigation systems using an enhanced empirical model. Agri Water Manag. 2016;176:203–13.10.1016/j.agwat.2016.06.002Search in Google Scholar
[23] Liu J, Liu SD, Yang SL. Experimental research on coal roof water seepage flow apparent resistivity response. Coal Geol China. 2010;22(3):50–5.Search in Google Scholar
[24] Geng JS, Sun Q, Zhang Y. Electric-field response based experimental investigation of unsaturated soil slope seepage. J App Geophy. 2017;138:154-60.10.1016/j.jappgeo.2017.01.023Search in Google Scholar
© 2024 the author(s), published by De Gruyter
This work is licensed under the Creative Commons Attribution 4.0 International License.
Articles in the same Issue
- Regular Articles
- Theoretical magnetotelluric response of stratiform earth consisting of alternative homogeneous and transitional layers
- The research of common drought indexes for the application to the drought monitoring in the region of Jin Sha river
- Evolutionary game analysis of government, businesses, and consumers in high-standard farmland low-carbon construction
- On the use of low-frequency passive seismic as a direct hydrocarbon indicator: A case study at Banyubang oil field, Indonesia
- Water transportation planning in connection with extreme weather conditions; case study – Port of Novi Sad, Serbia
- Zircon U–Pb ages of the Paleozoic volcaniclastic strata in the Junggar Basin, NW China
- Monitoring of mangrove forests vegetation based on optical versus microwave data: A case study western coast of Saudi Arabia
- Microfacies analysis of marine shale: A case study of the shales of the Wufeng–Longmaxi formation in the western Chongqing, Sichuan Basin, China
- Multisource remote sensing image fusion processing in plateau seismic region feature information extraction and application analysis – An example of the Menyuan Ms6.9 earthquake on January 8, 2022
- Identification of magnetic mineralogy and paleo-flow direction of the Miocene-quaternary volcanic products in the north of Lake Van, Eastern Turkey
- Impact of fully rotating steel casing bored pile on adjacent tunnels
- Adolescents’ consumption intentions toward leisure tourism in high-risk leisure environments in riverine areas
- Petrogenesis of Jurassic granitic rocks in South China Block: Implications for events related to subduction of Paleo-Pacific plate
- Differences in urban daytime and night block vitality based on mobile phone signaling data: A case study of Kunming’s urban district
- Random forest and artificial neural network-based tsunami forests classification using data fusion of Sentinel-2 and Airbus Vision-1 satellites: A case study of Garhi Chandan, Pakistan
- Integrated geophysical approach for detection and size-geometry characterization of a multiscale karst system in carbonate units, semiarid Brazil
- Spatial and temporal changes in ecosystem services value and analysis of driving factors in the Yangtze River Delta Region
- Deep fault sliding rates for Ka-Ping block of Xinjiang based on repeating earthquakes
- Improved deep learning segmentation of outdoor point clouds with different sampling strategies and using intensities
- Platform margin belt structure and sedimentation characteristics of Changxing Formation reefs on both sides of the Kaijiang-Liangping trough, eastern Sichuan Basin, China
- Enhancing attapulgite and cement-modified loess for effective landfill lining: A study on seepage prevention and Cu/Pb ion adsorption
- Flood risk assessment, a case study in an arid environment of Southeast Morocco
- Lower limits of physical properties and classification evaluation criteria of the tight reservoir in the Ahe Formation in the Dibei Area of the Kuqa depression
- Evaluation of Viaducts’ contribution to road network accessibility in the Yunnan–Guizhou area based on the node deletion method
- Permian tectonic switch of the southern Central Asian Orogenic Belt: Constraints from magmatism in the southern Alxa region, NW China
- Element geochemical differences in lower Cambrian black shales with hydrothermal sedimentation in the Yangtze block, South China
- Three-dimensional finite-memory quasi-Newton inversion of the magnetotelluric based on unstructured grids
- Obliquity-paced summer monsoon from the Shilou red clay section on the eastern Chinese Loess Plateau
- Classification and logging identification of reservoir space near the upper Ordovician pinch-out line in Tahe Oilfield
- Ultra-deep channel sand body target recognition method based on improved deep learning under UAV cluster
- New formula to determine flyrock distance on sedimentary rocks with low strength
- Assessing the ecological security of tourism in Northeast China
- Effective reservoir identification and sweet spot prediction in Chang 8 Member tight oil reservoirs in Huanjiang area, Ordos Basin
- Detecting heterogeneity of spatial accessibility to sports facilities for adolescents at fine scale: A case study in Changsha, China
- Effects of freeze–thaw cycles on soil nutrients by soft rock and sand remodeling
- Vibration prediction with a method based on the absorption property of blast-induced seismic waves: A case study
- A new look at the geodynamic development of the Ediacaran–early Cambrian forearc basalts of the Tannuola-Khamsara Island Arc (Central Asia, Russia): Conclusions from geological, geochemical, and Nd-isotope data
- Spatio-temporal analysis of the driving factors of urban land use expansion in China: A study of the Yangtze River Delta region
- Selection of Euler deconvolution solutions using the enhanced horizontal gradient and stable vertical differentiation
- Phase change of the Ordovician hydrocarbon in the Tarim Basin: A case study from the Halahatang–Shunbei area
- Using interpretative structure model and analytical network process for optimum site selection of airport locations in Delta Egypt
- Geochemistry of magnetite from Fe-skarn deposits along the central Loei Fold Belt, Thailand
- Functional typology of settlements in the Srem region, Serbia
- Hunger Games Search for the elucidation of gravity anomalies with application to geothermal energy investigations and volcanic activity studies
- Addressing incomplete tile phenomena in image tiling: Introducing the grid six-intersection model
- Evaluation and control model for resilience of water resource building system based on fuzzy comprehensive evaluation method and its application
- MIF and AHP methods for delineation of groundwater potential zones using remote sensing and GIS techniques in Tirunelveli, Tenkasi District, India
- New database for the estimation of dynamic coefficient of friction of snow
- Measuring urban growth dynamics: A study in Hue city, Vietnam
- Comparative models of support-vector machine, multilayer perceptron, and decision tree predication approaches for landslide susceptibility analysis
- Experimental study on the influence of clay content on the shear strength of silty soil and mechanism analysis
- Geosite assessment as a contribution to the sustainable development of Babušnica, Serbia
- Using fuzzy analytical hierarchy process for road transportation services management based on remote sensing and GIS technology
- Accumulation mechanism of multi-type unconventional oil and gas reservoirs in Northern China: Taking Hari Sag of the Yin’e Basin as an example
- TOC prediction of source rocks based on the convolutional neural network and logging curves – A case study of Pinghu Formation in Xihu Sag
- A method for fast detection of wind farms from remote sensing images using deep learning and geospatial analysis
- Spatial distribution and driving factors of karst rocky desertification in Southwest China based on GIS and geodetector
- Physicochemical and mineralogical composition studies of clays from Share and Tshonga areas, Northern Bida Basin, Nigeria: Implications for Geophagia
- Geochemical sedimentary records of eutrophication and environmental change in Chaohu Lake, East China
- Research progress of freeze–thaw rock using bibliometric analysis
- Mixed irrigation affects the composition and diversity of the soil bacterial community
- Examining the swelling potential of cohesive soils with high plasticity according to their index properties using GIS
- Geological genesis and identification of high-porosity and low-permeability sandstones in the Cretaceous Bashkirchik Formation, northern Tarim Basin
- Usability of PPGIS tools exemplified by geodiscussion – a tool for public participation in shaping public space
- Efficient development technology of Upper Paleozoic Lower Shihezi tight sandstone gas reservoir in northeastern Ordos Basin
- Assessment of soil resources of agricultural landscapes in Turkestan region of the Republic of Kazakhstan based on agrochemical indexes
- Evaluating the impact of DEM interpolation algorithms on relief index for soil resource management
- Petrogenetic relationship between plutonic and subvolcanic rocks in the Jurassic Shuikoushan complex, South China
- A novel workflow for shale lithology identification – A case study in the Gulong Depression, Songliao Basin, China
- Characteristics and main controlling factors of dolomite reservoirs in Fei-3 Member of Feixianguan Formation of Lower Triassic, Puguang area
- Impact of high-speed railway network on county-level accessibility and economic linkage in Jiangxi Province, China: A spatio-temporal data analysis
- Estimation model of wild fractional vegetation cover based on RGB vegetation index and its application
- Lithofacies, petrography, and geochemistry of the Lamphun oceanic plate stratigraphy: As a record of the subduction history of Paleo-Tethys in Chiang Mai-Chiang Rai Suture Zone of Thailand
- Structural features and tectonic activity of the Weihe Fault, central China
- Application of the wavelet transform and Hilbert–Huang transform in stratigraphic sequence division of Jurassic Shaximiao Formation in Southwest Sichuan Basin
- Structural detachment influences the shale gas preservation in the Wufeng-Longmaxi Formation, Northern Guizhou Province
- Distribution law of Chang 7 Member tight oil in the western Ordos Basin based on geological, logging and numerical simulation techniques
- Evaluation of alteration in the geothermal province west of Cappadocia, Türkiye: Mineralogical, petrographical, geochemical, and remote sensing data
- Numerical modeling of site response at large strains with simplified nonlinear models: Application to Lotung seismic array
- Quantitative characterization of granite failure intensity under dynamic disturbance from energy standpoint
- Characteristics of debris flow dynamics and prediction of the hazardous area in Bangou Village, Yanqing District, Beijing, China
- Rockfall mapping and susceptibility evaluation based on UAV high-resolution imagery and support vector machine method
- Statistical comparison analysis of different real-time kinematic methods for the development of photogrammetric products: CORS-RTK, CORS-RTK + PPK, RTK-DRTK2, and RTK + DRTK2 + GCP
- Hydrogeological mapping of fracture networks using earth observation data to improve rainfall–runoff modeling in arid mountains, Saudi Arabia
- Petrography and geochemistry of pegmatite and leucogranite of Ntega-Marangara area, Burundi, in relation to rare metal mineralisation
- Prediction of formation fracture pressure based on reinforcement learning and XGBoost
- Hazard zonation for potential earthquake-induced landslide in the eastern East Kunlun fault zone
- Monitoring water infiltration in multiple layers of sandstone coal mining model with cracks using ERT
- Study of the patterns of ice lake variation and the factors influencing these changes in the western Nyingchi area
- Productive conservation at the landslide prone area under the threat of rapid land cover changes
- Sedimentary processes and patterns in deposits corresponding to freshwater lake-facies of hyperpycnal flow – An experimental study based on flume depositional simulations
- Study on time-dependent injectability evaluation of mudstone considering the self-healing effect
- Detection of objects with diverse geometric shapes in GPR images using deep-learning methods
- Behavior of trace metals in sedimentary cores from marine and lacustrine environments in Algeria
- Spatiotemporal variation pattern and spatial coupling relationship between NDVI and LST in Mu Us Sandy Land
- Formation mechanism and oil-bearing properties of gravity flow sand body of Chang 63 sub-member of Yanchang Formation in Huaqing area, Ordos Basin
- Diagenesis of marine-continental transitional shale from the Upper Permian Longtan Formation in southern Sichuan Basin, China
- Vertical high-velocity structures and seismic activity in western Shandong Rise, China: Case study inspired by double-difference seismic tomography
- Spatial coupling relationship between metamorphic core complex and gold deposits: Constraints from geophysical electromagnetics
- Disparities in the geospatial allocation of public facilities from the perspective of living circles
- Research on spatial correlation structure of war heritage based on field theory. A case study of Jinzhai County, China
- Formation mechanisms of Qiaoba-Zhongdu Danxia landforms in southwestern Sichuan Province, China
- Magnetic data interpretation: Implication for structure and hydrocarbon potentiality at Delta Wadi Diit, Southeastern Egypt
- Deeply buried clastic rock diagenesis evolution mechanism of Dongdaohaizi sag in the center of Junggar fault basin, Northwest China
- Application of LS-RAPID to simulate the motion of two contrasting landslides triggered by earthquakes
- The new insight of tectonic setting in Sunda–Banda transition zone using tomography seismic. Case study: 7.1 M deep earthquake 29 August 2023
- The critical role of c and φ in ensuring stability: A study on rockfill dams
- Evidence of late quaternary activity of the Weining-Shuicheng Fault in Guizhou, China
- Extreme hydroclimatic events and response of vegetation in the eastern QTP since 10 ka
- Spatial–temporal effect of sea–land gradient on landscape pattern and ecological risk in the coastal zone: A case study of Dalian City
- Study on the influence mechanism of land use on carbon storage under multiple scenarios: A case study of Wenzhou
- A new method for identifying reservoir fluid properties based on well logging data: A case study from PL block of Bohai Bay Basin, North China
- Comparison between thermal models across the Middle Magdalena Valley, Eastern Cordillera, and Eastern Llanos basins in Colombia
- Mineralogical and elemental analysis of Kazakh coals from three mines: Preliminary insights from mode of occurrence to environmental impacts
- Chlorite-induced porosity evolution in multi-source tight sandstone reservoirs: A case study of the Shaximiao Formation in western Sichuan Basin
- Predicting stability factors for rotational failures in earth slopes and embankments using artificial intelligence techniques
- Origin of Late Cretaceous A-type granitoids in South China: Response to the rollback and retreat of the Paleo-Pacific plate
- Modification of dolomitization on reservoir spaces in reef–shoal complex: A case study of Permian Changxing Formation, Sichuan Basin, SW China
- Geological characteristics of the Daduhe gold belt, western Sichuan, China: Implications for exploration
- Rock physics model for deep coal-bed methane reservoir based on equivalent medium theory: A case study of Carboniferous-Permian in Eastern Ordos Basin
- Enhancing the total-field magnetic anomaly using the normalized source strength
- Shear wave velocity profiling of Riyadh City, Saudi Arabia, utilizing the multi-channel analysis of surface waves method
- Effect of coal facies on pore structure heterogeneity of coal measures: Quantitative characterization and comparative study
- Inversion method of organic matter content of different types of soils in black soil area based on hyperspectral indices
- Detection of seepage zones in artificial levees: A case study at the Körös River, Hungary
- Tight sandstone fluid detection technology based on multi-wave seismic data
- Characteristics and control techniques of soft rock tunnel lining cracks in high geo-stress environments: Case study of Wushaoling tunnel group
- Influence of pore structure characteristics on the Permian Shan-1 reservoir in Longdong, Southwest Ordos Basin, China
- Study on sedimentary model of Shanxi Formation – Lower Shihezi Formation in Da 17 well area of Daniudi gas field, Ordos Basin
- Multi-scenario territorial spatial simulation and dynamic changes: A case study of Jilin Province in China from 1985 to 2030
- Review Articles
- Major ascidian species with negative impacts on bivalve aquaculture: Current knowledge and future research aims
- Prediction and assessment of meteorological drought in southwest China using long short-term memory model
- Communication
- Essential questions in earth and geosciences according to large language models
- Erratum
- Erratum to “Random forest and artificial neural network-based tsunami forests classification using data fusion of Sentinel-2 and Airbus Vision-1 satellites: A case study of Garhi Chandan, Pakistan”
- Special Issue: Natural Resources and Environmental Risks: Towards a Sustainable Future - Part I
- Spatial-temporal and trend analysis of traffic accidents in AP Vojvodina (North Serbia)
- Exploring environmental awareness, knowledge, and safety: A comparative study among students in Montenegro and North Macedonia
- Determinants influencing tourists’ willingness to visit Türkiye – Impact of earthquake hazards on Serbian visitors’ preferences
- Application of remote sensing in monitoring land degradation: A case study of Stanari municipality (Bosnia and Herzegovina)
- Optimizing agricultural land use: A GIS-based assessment of suitability in the Sana River Basin, Bosnia and Herzegovina
- Assessing risk-prone areas in the Kratovska Reka catchment (North Macedonia) by integrating advanced geospatial analytics and flash flood potential index
- Analysis of the intensity of erosive processes and state of vegetation cover in the zone of influence of the Kolubara Mining Basin
- GIS-based spatial modeling of landslide susceptibility using BWM-LSI: A case study – city of Smederevo (Serbia)
- Geospatial modeling of wildfire susceptibility on a national scale in Montenegro: A comparative evaluation of F-AHP and FR methodologies
- Geosite assessment as the first step for the development of canyoning activities in North Montenegro
- Urban geoheritage and degradation risk assessment of the Sokograd fortress (Sokobanja, Eastern Serbia)
- Multi-hazard modeling of erosion and landslide susceptibility at the national scale in the example of North Macedonia
- Understanding seismic hazard resilience in Montenegro: A qualitative analysis of community preparedness and response capabilities
- Forest soil CO2 emission in Quercus robur level II monitoring site
- Characterization of glomalin proteins in soil: A potential indicator of erosion intensity
- Power of Terroir: Case study of Grašac at the Fruška Gora wine region (North Serbia)
- Special Issue: Geospatial and Environmental Dynamics - Part I
- Qualitative insights into cultural heritage protection in Serbia: Addressing legal and institutional gaps for disaster risk resilience