Detection of objects with diverse geometric shapes in GPR images using deep-learning methods
-
Orhan Apaydın
 und
Turgay İşseven
und
Turgay İşseven

Abstract
Buried objects with regular geometric shapes appear as hyperbolic structures in ground-penetrating radar (GPR) images. The shapes of these hyperbolic structures differ depending on the geometric shapes of the objects. In this study, current deep learning-based object detection algorithms such as Faster R-CNN, YOLOv5, and single-shot detector are used to detect hyperbolic structures in GPR images and classify the buried object according to its geometric shape. A mixed data set is produced for training the models. A GPR measurement device is designed with a vector network analyzer and Vivaldi antenna pair to be used in laboratory measurements. Objects with rectangular and cylindrical geometric shapes are placed under the table and measurements are performed. The measurement scenarios created in the laboratory are modeled in the gprMax program and synthetic GPR data are produced. Data augmentation techniques such as flipping and resizing are applied to expand the data set. As a result of the training, three models successfully detect the objects and classify them according to their geometric shapes. The Faster R-CNN model gives the most accurate detection and classification with the metrics classification loss = 5.4 × 10⁻³, localization loss = 9 × 10⁻³, regularization loss = 5.1 × 10⁻⁵, mAP@0.5 = 1, and mAP@0.5:0.95 = 1.
1 Introduction
Ground-penetrating radar (GPR) is a non-destructive geophysical exploration method used in near-surface investigations [1,2]. It is frequently used for detecting and positioning objects buried in the subsurface, such as mines, water pipes, and graves [3,4]. Object detection and classification in GPR images can be implemented using deep learning-based methods [5,6,7,8,9,10,11,12,13,14,15,16,17,18,19,20,21,22,23]. Three of these methods are Faster R-CNN, You Only Look Ones (YOLOv5), and single-shot detector (SSD). These techniques are capable of detecting multiple objects in an image and accurately presenting them within bounding boxes. Near-surface buried objects appear as hyperbola in GPR images. Rectangular and cylindrical-shaped objects create variations in the hyperbolic structures within GPR images. In this study, we investigate the detection and classification of objects with diverse geometric shapes in GPR images. The dataset includes radargrams obtained from real measurements collected by a radar system consisting of a vector network analyzer (VNA) and Vivaldi antenna pair in a laboratory environment, as well as synthetic radargrams created in the gprMax program. Rectangular-shaped aluminum box and cylindrical-shaped iron bar areplaced beneath the table, and GPR measurements are performed. The hyperbolic structures of these objects are detected in GPR images, and it is found that the object is either rectangular or cylindrical. Thus, the studies in the literature have been extended in terms of detecting different geometric-shaped structures in GPR images.
2 Methods
2.1 Faster R-CNN
Most of the object detection algorithms are based on the CNN method [24]. CNN is one of the most popular feature extraction methods according to its remarkable successful results. In a simple CNN structure, it includes a convolution layer, a pooling layer, and a flattening layer [25]. Region-based CNN (R-CNN) is introduced by Girshick et al. [26] to get better results in object detection. In the first step of R-CNN, object proposals are produced by using selective search (SS). In the second step, possible object areas within each proposal are transformed into a feature vector and then passed to a classifier and also to a regressor. Since these operations are performed for each proposal, it causes an intense computational cost [7]. To overcome this problem, SSPnet and Fast R-CNN recommend that all input images pass through CNN once. Ren et al. [27] introduced the Faster R-CNN object detection method, which is based on R-CNN. Faster R-CNN uses the region proposal network (RPN) instead of SS. RPN makes the Faster R-CNN’s performance better than models that use SS because of the most accurate results and fast algorithm speed [11]. Faster R-CNN consists of two main parts (Figure 1): (1) an RPN that extracts information about the possible locations of objects and (2) the Fast R-CNN network where the object is classified and bounding boxes are found. These two parts work as a whole by sharing their parameters. In the classification part, it will output that if the confidence score is greater than 0.7, it is an object, and if it is less than this value, it is not an object.

Network architecture of Faster R-CNN. There are two learnable stages: region proposal network and classification network.
In this study, the Faster R-CNN method is applied using TensorFlow Object detection API. Parameters used in network training are tuned as Epoch = 10,000, learning tare = 1 × 10⁻², and batch size = 3.
2.2 YOLOv5
Another network mostly used for object detection is YOLO (You Only Look Once) [28]. YOLO is a CNN-based method. YOLOv5 is the fifth version of YOLO [29]. Multiple objects in an image can be detected by using YOLOv5. This method works with faster training and inference time than other detection networks like SSD and Faster R-CNN and makes it more suitable for real-time applications [30]. However, in addition to its fast work, its accuracy rates in detecting small-size objects including handicaps when compared to other object detection methods.
The main idea of the method is to use the whole picture as input data and pass it through the network to generate bounding boxes containing five predictions: x, y, w, h, and confidence values. While the (x, y) coordinates from the estimates describe the center of the boxes according to the grid cell, the width and heightarerelative values to the whole image [28,30,31].
In the method, the image is divided into S × S grid cells and CNN is performed in each region. A confidence score is issued indicating whether the regions contain objects. Generally, it is best if the confidence score is equal to the point of IOU between the predicted box and the ground truth. Each grid cell contains B bounding boxes which have a class probability (C). All predictions are encoded as an S × S × (B × 5 × C) size tensor [28].
The YOLOv5 consists of three main blocks (Figure 2): (1) “Backbone,” part of feature extraction with CNN, (2) “Neck,” at this stage aggregation of image features is performed, and (3) "Head" section, the object detection predictions are made and the results are shown from these predictions [5].
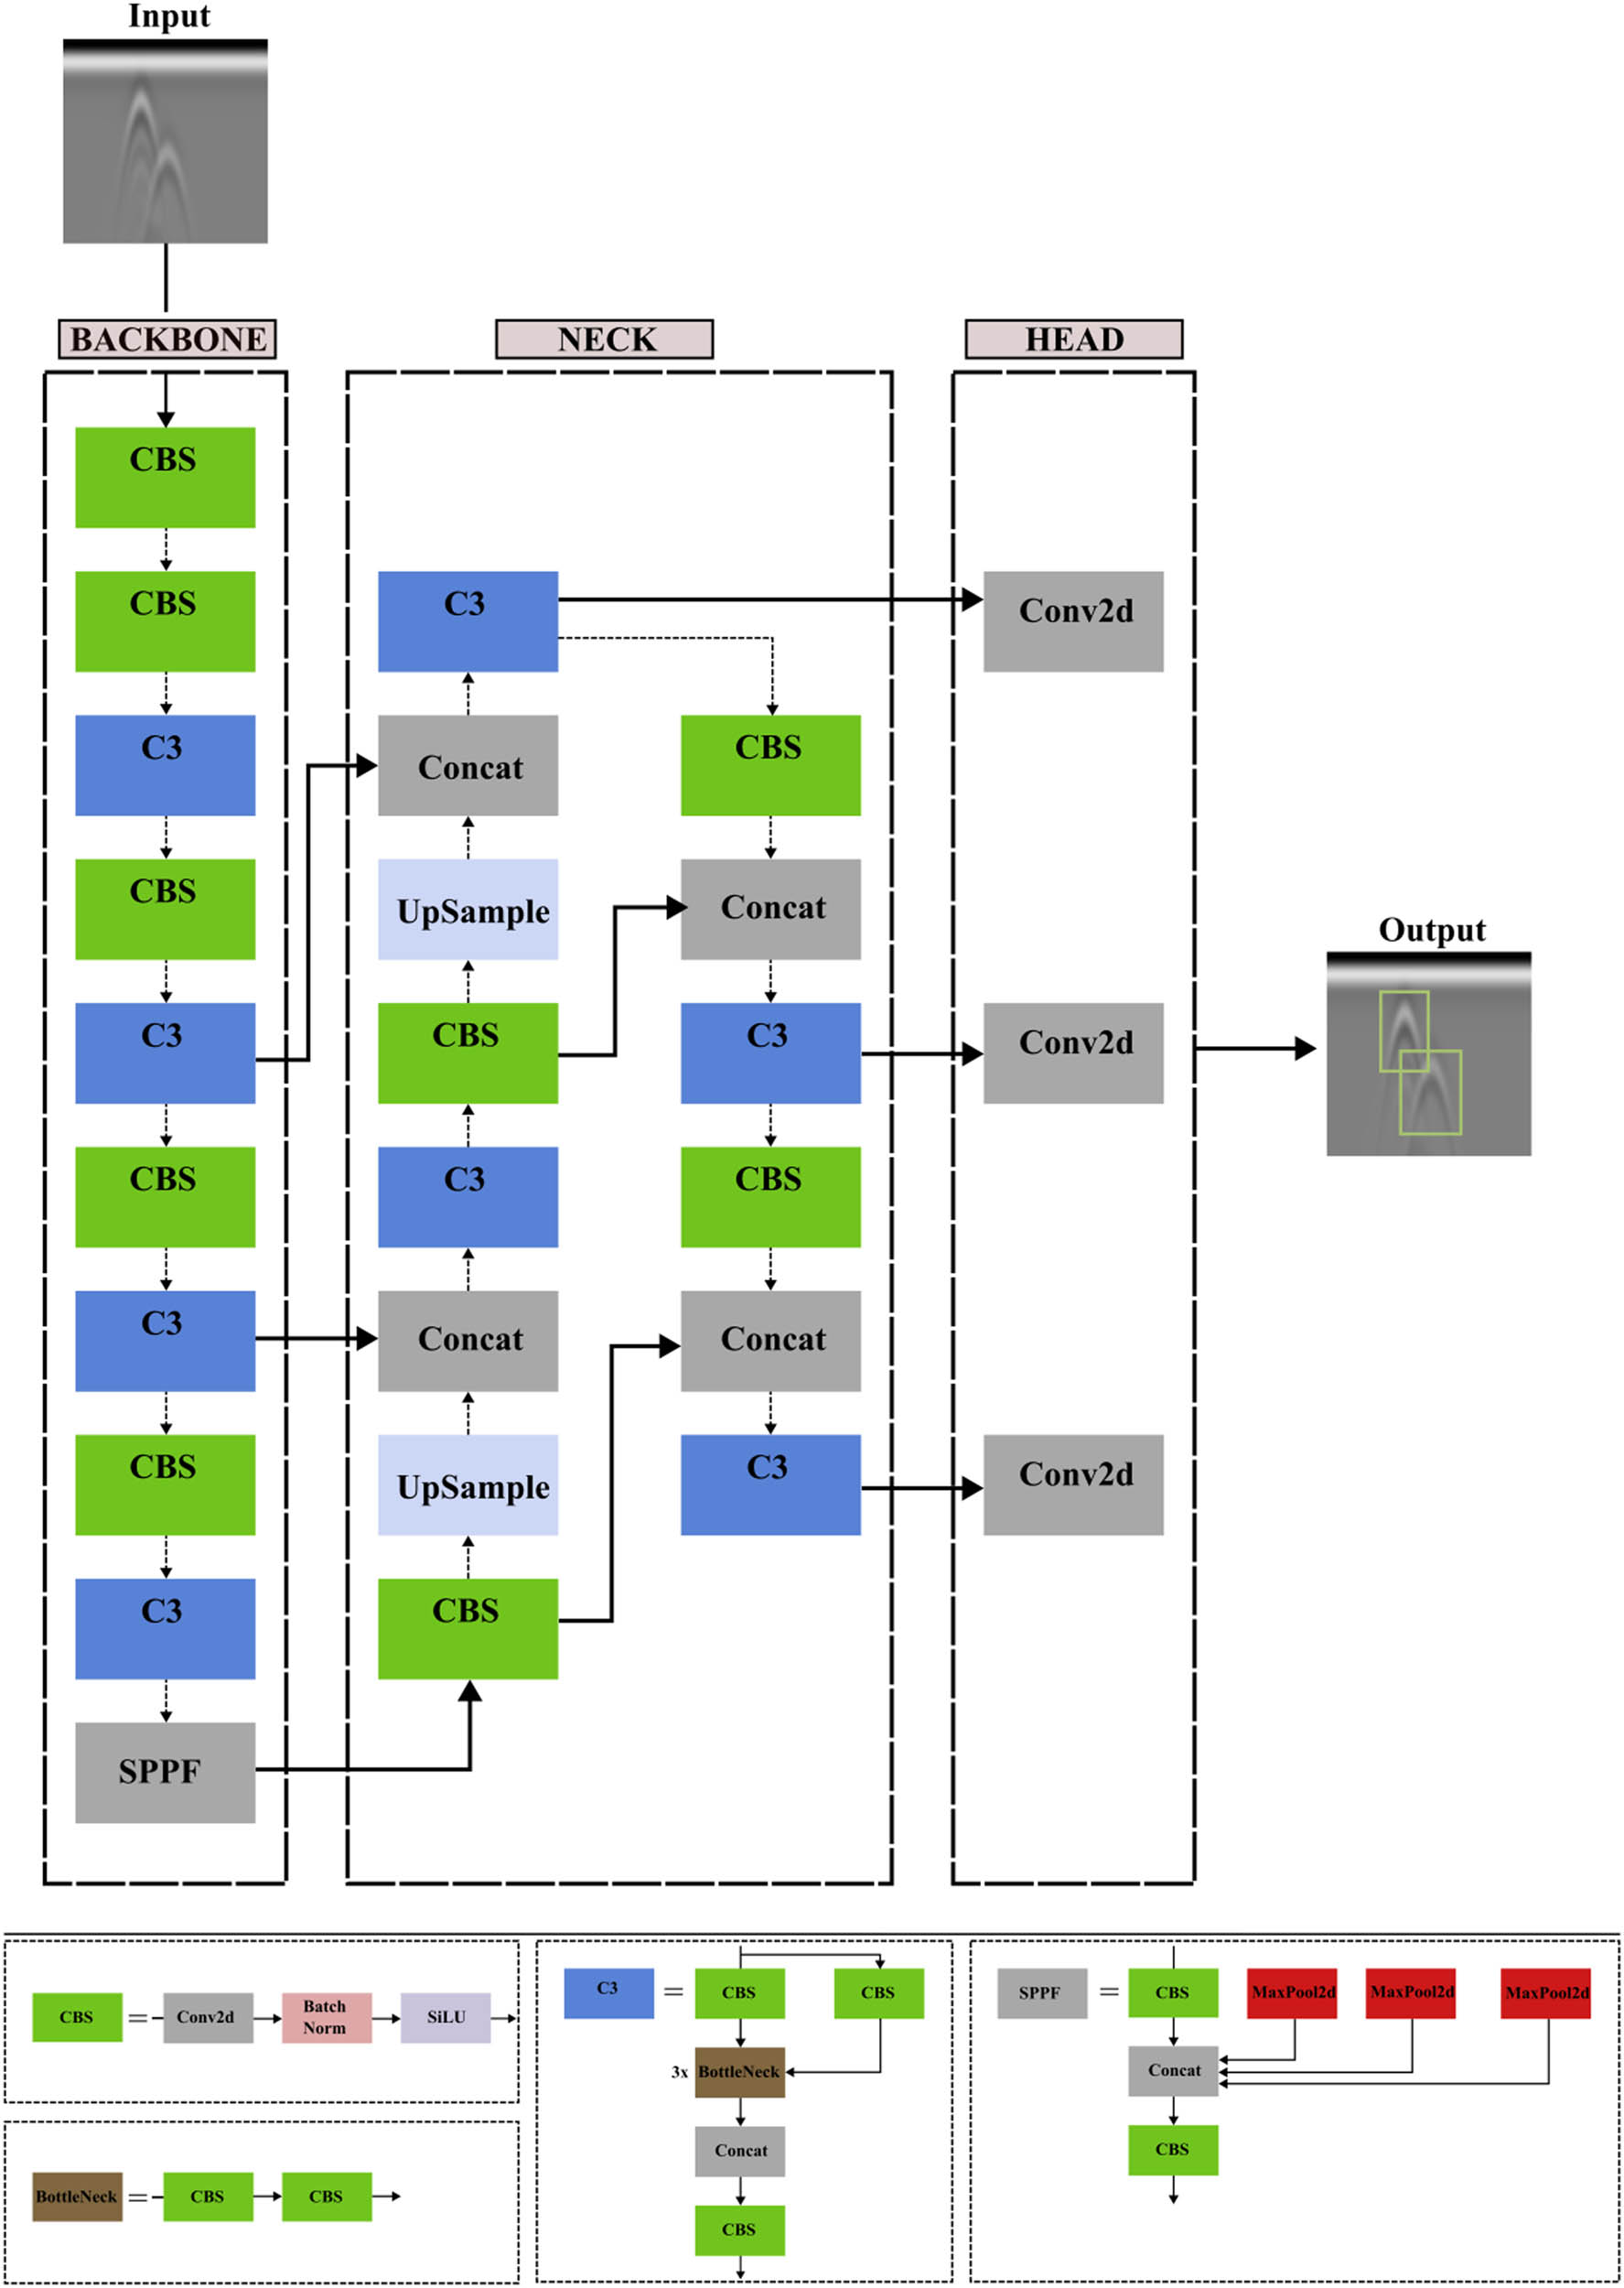
Network architecture of YOLOv5.
Hyperparameters used in YOLOv5 network training are tuned as Epoch = 210, learning rate = 1 × 10⁻², and batch size = 4.
2.3 SSD
Unlike traditional methods that require multiple passes through an image, SSD performs object detection in a single shot, thanks to its innovative architecture (Figure 3). By utilizing a combination of 1 × 1 and 3 × 3 filters, SSD generates feature maps essential for detecting objects of various sizes and shapes [32,33]. Furthermore, the SSD algorithm incorporates the MultiBox technique, which involves utilizing predefined bounding boxes placed over actual regions within an image. By segmenting the image into grids of varying sizes, SSD effectively detects both large and small objects, enhancing its versatility. Each predicted bounding box is assigned a confidence score for label prediction, with the highest-scoring box being selected.

SSD model architecture.
This process is facilitated by multi-scale feature maps, where convolutional layers of different cell sizes are employed to detect objects across various scales. To train the SSD model, the TensorFlow Object Detection API with the Resnet50 base model is utilized. The training parameters are carefully configured, with a batch size of 3, a learning rate of 1 × 10⁻⁴, and 3,000 epochs.
3 Dataset
In this section, the dataset used in object detection algorithms Faster R-CNN, YOLOv5, and SSD is explained. Dataset has a major role in object detection models. The dataset used in this study consists of measurements performed in the laboratory environment and simulated data created by using gprMax. To increase the variety of the dataset and the accuracy of the algorithms, data augmentation is performed with flipping and image resizing methods. The dataset information used in similar object detection studies in the literature is given in Table 1.
Dataset information in the literature and this study
| GPR object detection studies | Total | gprMax | Lab and field | Train | Valid. | Test |
|---|---|---|---|---|---|---|
| Lei et al. [7] | 5,866 | 5,236 | 630 | — | — | — |
| Kumlu [10] | 55 | 55 | — | 40 | 10 | 5 |
| Dewantara and Parnadi [12] | 80 | 78 | 2 | 72 | — | 8 |
| Kafedziski et al. [17] | 157 | — | — | — | — | — |
| Pham and Lefèvre [18] | 150 | 50 | 100 | — | — | — |
| Cui et al. [9] | 3,000 | — | — | 2,100 | 600 | 300 |
| Xiao et al. [11] | 4,688 | — | — | 3,281 | — | 1,407 |
| Gong and Zhang [8] | 200 | 200 | — | 160 | — | 40 |
| In this study | 357 | 300 | 57 | 249 | 72 | 36 |
3.1 Laboratory measurements
In the laboratory environment, measurements are performed with a GPR system using a Copper Mountain TR/1,300 brand and model VNA and Vivaldi antenna pair that can operate at the appropriate frequency for measurements. In measurements, cylindrical and rectangular objects are placed beneath the table at different depths (Figure 4).

Laboratory measurement setup: (a) rectangular shape and (b) cylindrical shape object.
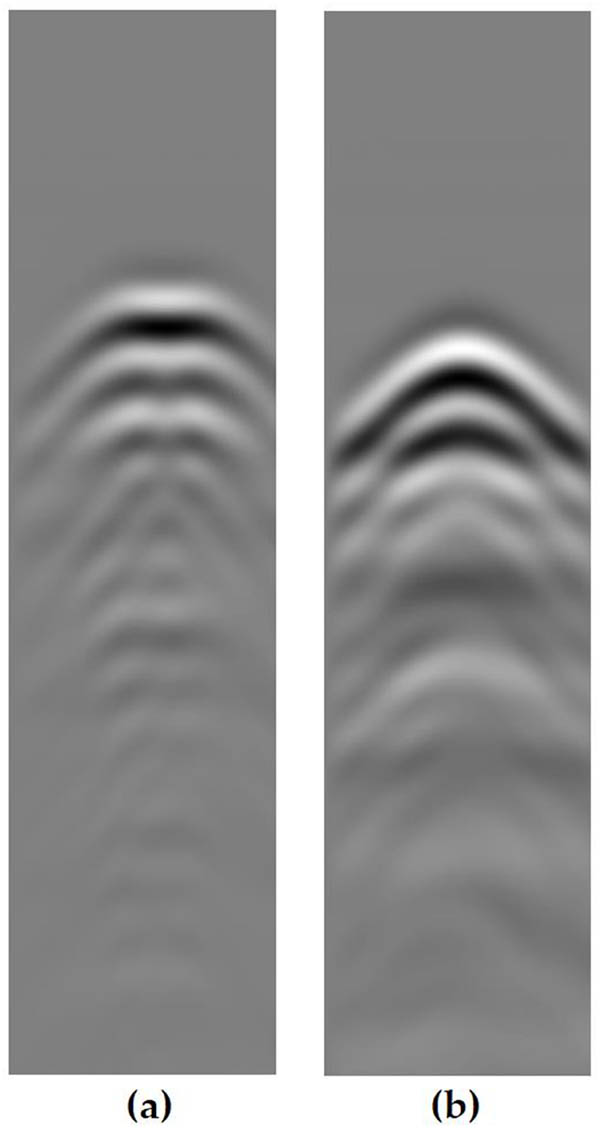
The frequency band of the VNA device used for the measurements is 600–1,300 MHz, the center frequency is 950 MHz, the number of data points in an A-scan is 1,000, the measurement intervals are 2 cm, the total measurement length is 120 cm, and the GPR data length is 20 ns. The depth of the targets from the table varies between 5 and 30 cm. A total of 19 GPR data are collected for 10 rectangular objects (boxes) and 9 cylindrical objects (iron pipes). Attention has been given to enhancing the electromagnetic reflectivity of objects by using metallic materials. To make the hyperbolas of the box more visible in GPR images, it is covered with aluminum foil with high electromagnetic reflectivity. As seen in Figure 5, the hyperbolas formed by the box and the iron bar in the GPR images exhibit distinct differences.

GPR images of (a) rectangular and (b) cylindrical objects.
Due to the flat surface on the top of the rectangular-shaped box, the apex of the hyperbola it forms is also planar. In contrast, the interaction area on the cylindrical pipe is much narrower, and as a result, this flat area is not visible at the top of its hyperbola.
3.2 Synthetic data
To expand the dataset, synthetic GPR images are generated through simulation. The gprMax program, capable of simulating electromagnetic waves by solving Maxwell’s equations using the finite difference time domain method [34,35], is used to generate synthetic data. It is essential to emphasize that the inclusion of additional simulated data can lead to more accurate and reliable detection results, marked by an increase in successful detections and a reduction in false alarms. This observation supports the scheme’s intended purpose and affirms its effectiveness [18].
The Vivaldi antennas used in the measurements are modeled in the gprMax program with the same size and material properties as the reality and used in the simulation to obtain the closest results to the data obtained in laboratory measurements. The table, aluminum-covered box, and iron bar used in laboratory measurements are modeled similarly and used in the simulation (Figure 6).
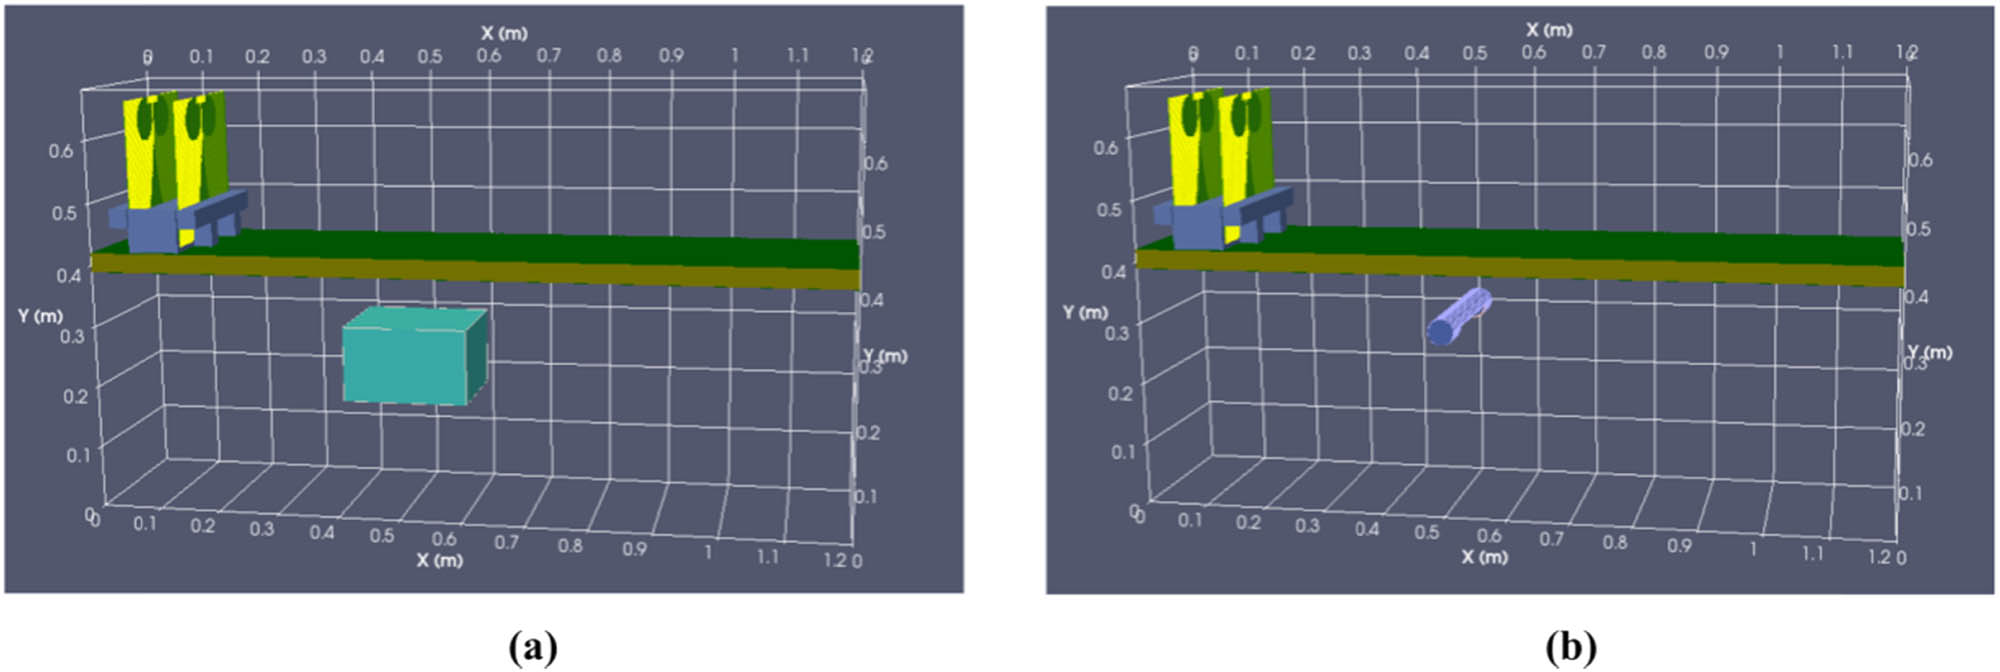
Simulation setup in gprMax: (a) rectangular shape aluminum covered box and (b) cylindrical shape iron pipe.
The center frequency (950 MHz), measurement interval (2 cm), measurement line length (120 cm), and depth values of the objects (5–30 cm) used in the simulation are the same as the values used in laboratory measurements. A total of 100 synthetic GPR images are created. The pixel values of GPR images are 250 × 1,000. An example of a simulation GPR image of the box and the cylinder is shown in Figure 7.
Synthetic GPR images of (a) rectangular and (b) cylindrical objects.
Similar to the laboratory measurements, the hyperbolic shape anomalies of the aluminum-covered box and the iron bar are obtained differently from each other. Additionally, the waveforms of hyperbolas resemble the waveforms obtained in the laboratory measurements.
3.3 Data augmentation
Data augmentation is generally applied in object detection applications to increase detection accuracy, with resizing and flipping being the most well-known and commonly used techniques. The input image of 250 × 1,000 is set to 300 × 1,000 by using resizing. Figure 8 shows a GPR image that has been flipped and resized.
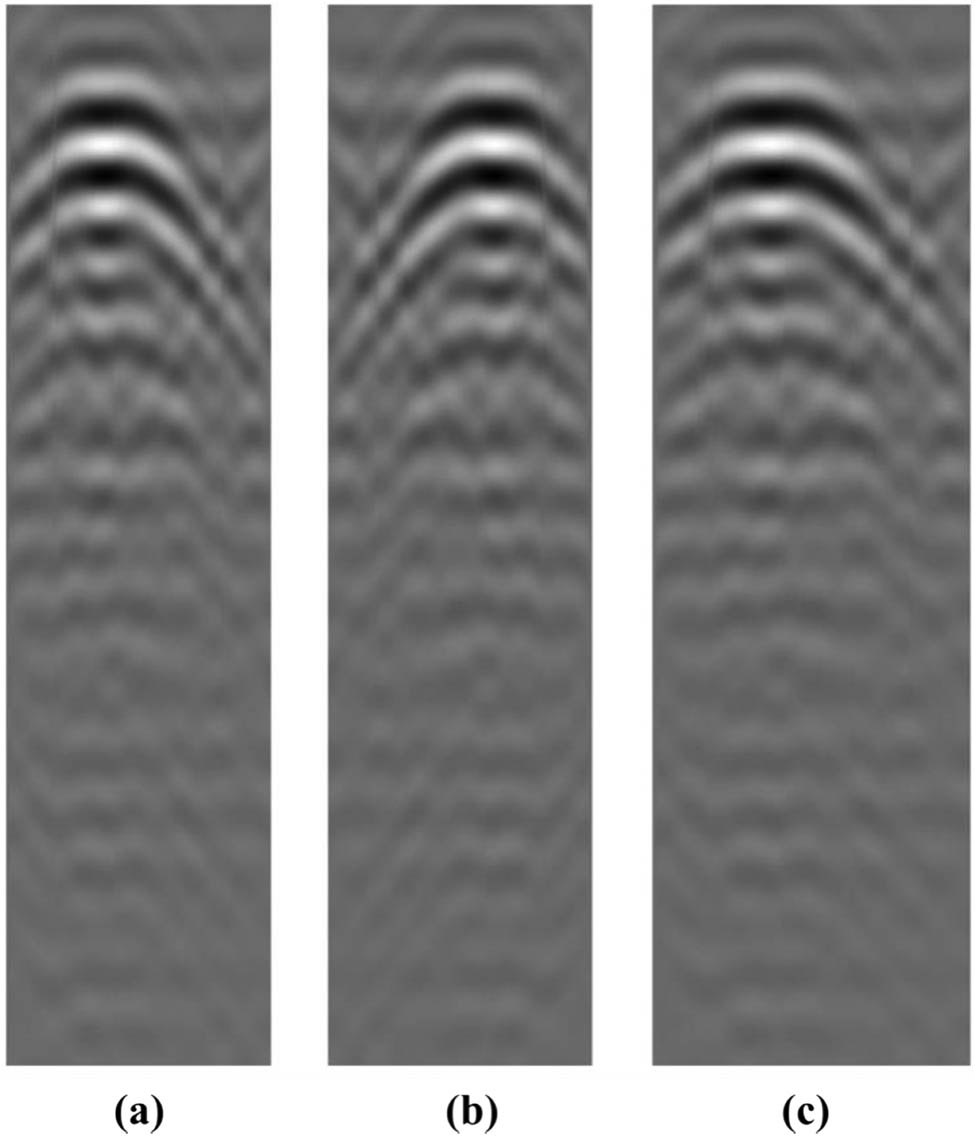
(a) Original GPR image, (b) flipped, and (c) resized GPR images.
As a result of augmentation, the total number of laboratory and simulation GPR data increased from 119 to 357 images. The dataset is distributed as 70% for training, 20% for validation, and 10% for testing. The dataset includes two classes, one of which is ‘cylindrical’ with 183 instances, and the other one is ‘rectangular’ with 174 instances.
4 Results and discussion
The Faster R-CNN application is configured with epoch = 10,000, batch size = 3, learning rate = 1 × 10⁻², and the training took 68 min. At the end of the training, the mAP@0.5 and mAP@0.75 values are obtained as 1, and the training classification loss, localization loss, and regularization loss values are obtained as 5.4 × 10⁻³, 9 × 10⁻³, and 5.1 × 10⁻⁵ respectively. We tested the trained model with confidence >0.7. As can be seen in Figure 9(a)–(c), the values giving the lowest loss values are selected in the hyperparameter test performed to select the training parameters of the Faster RCNN application.
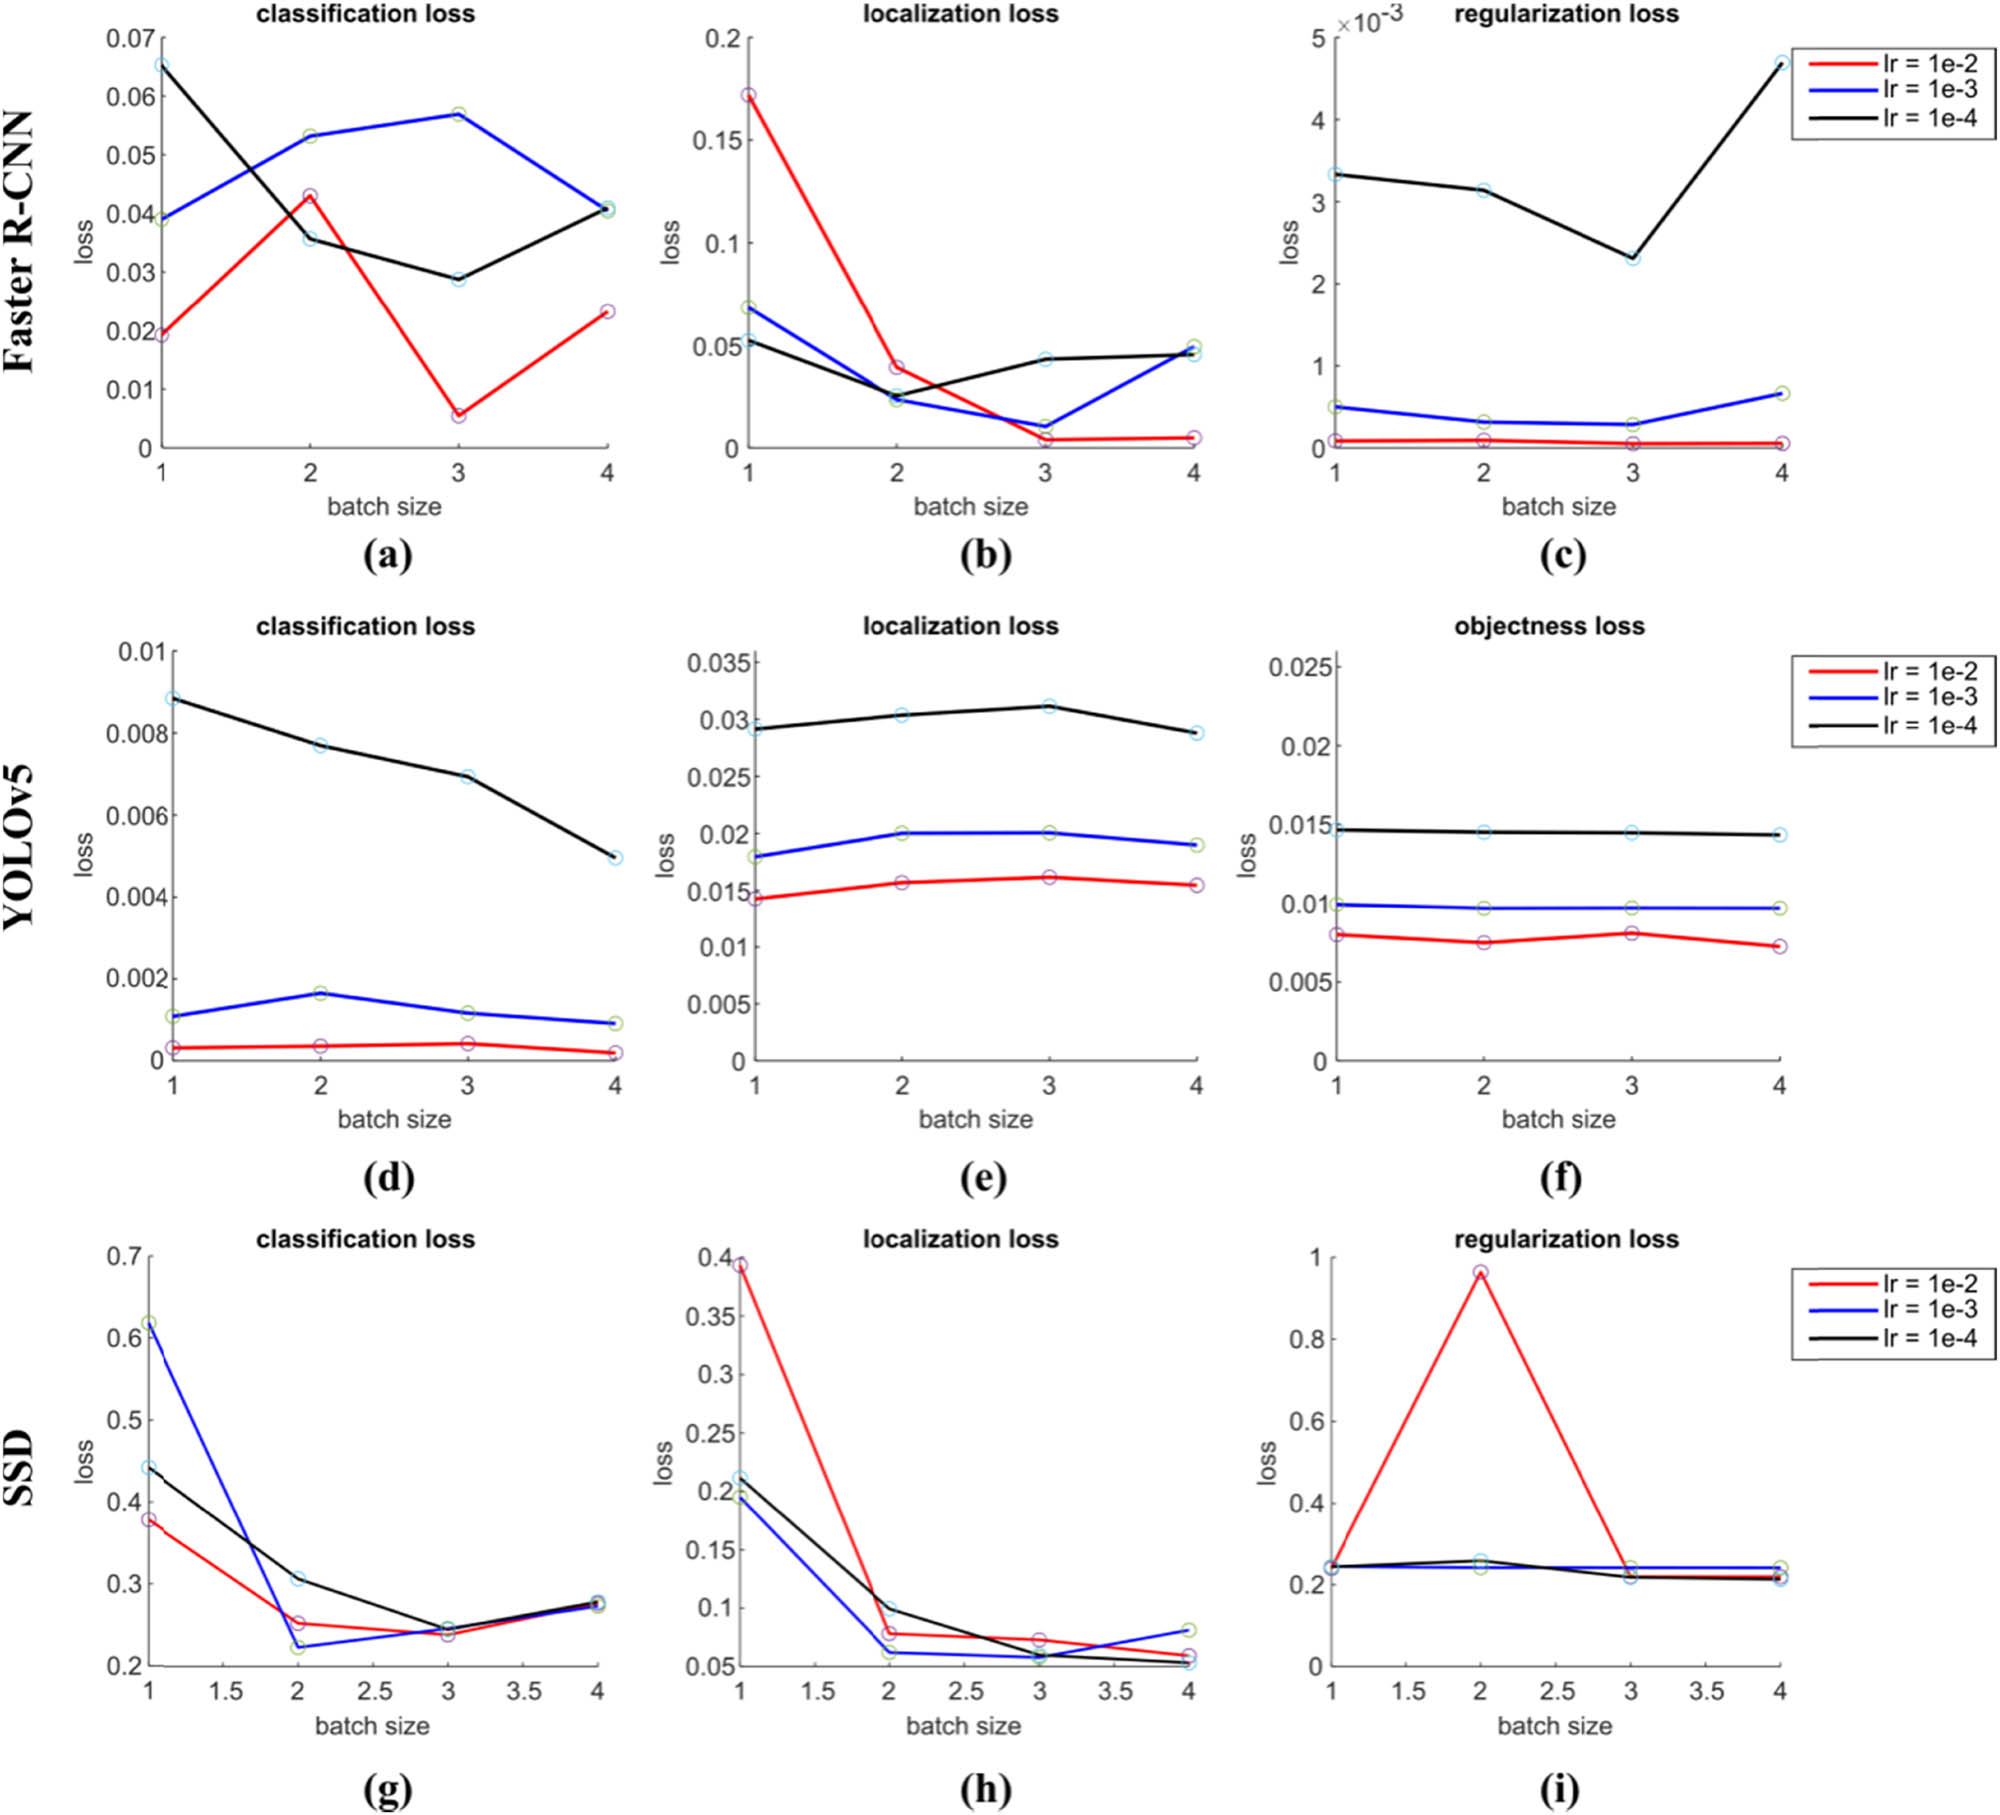
Results of the hyperparameter test to determine the parameters to be used in Faster RCNN, YOLOv5, and SSD training. The tests are carried out using four different batch sizes and three different learning rates. (a, d, and g) Classification losses, (b, e, and h) localization losses, (c and i) regularization losses, and (f) objectness loss results.”
In the YOLOv5 application, the epoch is set to 210, batch size to 4, and learning rate to 1 × 10⁻⁵. The training process took 9.84 min in total. At the end of the YOLOv5 training, the mAP@0.5 and mAP@0.5:0.95 values are obtained as 0.995 and 0.779, respectively, and the classification loss, localization loss, and objectness loss values are obtained as 1.9 × 10⁻³, 1.5 × 10⁻², and 7.2 × 10⁻³, respectively.
The third network, SSD, is trained with these tuned configuration parameters: epoch = 3,000, batch size = 3, learning rate = 1 × 10⁻⁴, and the training took 17 min. The mAP@0.5 and mAP@0.75 values are obtained as 1 and 0.79, respectively. The training classification loss, localization loss, and regularization loss values are obtained as 2.1 × 10⁻¹, 9.4 × 10⁻³, and 1.9 × 10⁻¹, respectively. The regularization loss of the SSD method (Figure 10(i)) decreased in a different trend compared to the graphs of other models due to the simple structure of the model. Although a similar pattern of regularization loss decrease was observed in the [36] study, the detection results were successful.

Train and validation loss values obtained in each epoch as a result of Faster RCNN, YOLOv5, and SSD training. (a, d, and g) Localization losses, (b, e, and h) classification losses, (c and i) regularization losses, and (f) objectness loss results.
For all three methods, the training and validation loss values decreased smoothly at each epoch throughout the training process (Figure 10). Recall, precision, and F1-score metrics and detection times are given in Table 2.
The performance metrics and detection times of Faster R-CNN, YOLOv5, and SSD
| Networks | Geometrical shape | Precision (%) | Recall (%) | F1 score (%) | Detection time (s) |
|---|---|---|---|---|---|
| Faster R-CNN | Rectangular | 100.0 | 100.0 | 100.0 | 2.2 |
| Cylindrical | 100.0 | 100.0 | 100.0 | ||
| YOLOv5 | Rectangular | 70.6 | 100.0 | 82.8 | 0.0028 |
| Cylindrical | 82.6 | 94.8 | 88.3 | ||
| SSD | Rectangular | 74.1 | 58.9 | 65.6 | 1.9 |
| Cylindrical | 62.7 | 77.1 | 69.2 |
In this study, hyperbolas are detected and classified based on the geometric shapes of the objects in GPR images with high accuracy rates. Both Faster R-CNN and YOLOv5 give successful results for detection and classification, but SSD has bad performance scores (Figure 11). YOLOv5 is more suitable for real-time detection applications with 2.8 ms detection time. Faster R-CNN, with its high accuracy detection performance, can be used to detect objects in the radargrams obtained after the GPR applications.

Some object detection and classification test results in GPR images of (a) Faster R-CNN, (b) YOLOv5, and (c) SSD models. Models output detected and classified objects with a bounding box and confidence score in percentage.
In studies [6,7,10,11,12,13,14,15,16], hyperbolas of objects in GPR images are detected and not classified by using only one of the Faster R-CNN and YOLOv5 methods [8]. It successfully detected objects with different geometric shapes, but the model used in the training is Faster R-CNN and the dataset does not consist of laboratory or field data, but only synthetic data. In this study, Faster R-CNN, YOLOv5, and SSD methods are tested separately to find out which method gave better results for detection and classification.
Acknowledgments
We would like to thank Prof. Dr. Selçuk Paker for his ideas and support in laboratory measurements and Prof. Dr. Işın Erer for providing the GPR device.
-
Funding information: Authors state no funding involved.
-
Author contributions: Orhan Apaydın: writing – original draft preparation, software visualization, data curation, formal analysis, methodology. Turgay Işseven: conceptualization, methodology, project administration, validation.
-
Conflict of interest: Authors state no conflict of interest.
-
Data availability statement: The datasets generated and/or analyzed during the current study are available from the corresponding author upon reasonable request.
References
[1] Jol HM. Ground penetrating radar theory and applications. Amsterdam, Netherlands: Elsevier; 2008.Suche in Google Scholar
[2] Daniels DJ. Ground penetrating radar. London, UK: IET; 2004.10.1049/PBRA015ESuche in Google Scholar
[3] Ho K, Collins LM, Huettel LG, Gader PD. Discrimination mode processing for EMI and GPR sensors for hand-held land mine detection. IEEE Trans Geosci Remote Sens. 2004;42:249–63.10.1109/TGRS.2003.817804Suche in Google Scholar
[4] Pettinelli E, Di Matteo A, Mattei E, Crocco L, Soldovieri F, Redman JD, et al. GPR response from buried pipes: Measurement on field site and tomographic reconstructions. IEEE Trans Geosci Remote Sens. 2009;47:2639–45.10.1109/TGRS.2009.2018301Suche in Google Scholar
[5] Qiu Z, Zhao Z, Chen S, Zeng J, Huang Y, Xiang B. Application of an improved YOLOv5 algorithm in real-time detection of foreign objects by ground penetrating radar. Remote Sens. 2022;14:1895.10.3390/rs14081895Suche in Google Scholar
[6] Zhao Y, Zhang J, Li H, Gu X, Li Z, Zhang S. Enhanced automatic root recognition and localization in GPR images through a YOLOv4-based deep learning approach. Med Biol Eng Comput. 2022;60:1–14.10.1109/TGRS.2022.3181202Suche in Google Scholar
[7] Lei W, Hou F, Xi J, Tan Q, Xu M, Jiang X, et al. Automatic hyperbola detection and fitting in GPR B-scan image. Autom Constr. 2019;106:102839.10.1016/j.autcon.2019.102839Suche in Google Scholar
[8] Gong Z, Zhang H. Research on GPR image recognition based on deep learning. MATEC Web of Conferences. EDP Sciences; 2020. p. 03027.10.1051/matecconf/202030903027Suche in Google Scholar
[9] Cui F, Ning M, Shen J, Shu X. Automatic recognition and tracking of highway layer-interface using Faster R-CNN. J Appl Geophys. 2022;196:104477.10.1016/j.jappgeo.2021.104477Suche in Google Scholar
[10] Kumlu D. GPR image recovery effect on faster R-CNN-based buried target detection. J Electromagn Eng Sci. 2022;22:591–8.10.26866/jees.2022.5.r.127Suche in Google Scholar
[11] Xiao J, Gao Q, Ling Y, Yan J, Liu B. Research on hyperbola detection and fitting in GPR B-scan image. 2021 International Conference on Communications, Information System and Computer Engineering (CISCE). IEEE; 2021. p. 266–70.10.1109/CISCE52179.2021.9445915Suche in Google Scholar
[12] Dewantara D, Parnadi WW. Automatic hyperbola detection and apex extraction using convolutional neural network on GPR data. Journal of Physics: Conference Series. IOP Publishing; 2022. p. 012027.10.1088/1742-6596/2243/1/012027Suche in Google Scholar
[13] Liu H, Yue Y, Liu C, Spencer Jr B, Cui J. Automatic recognition and localization of underground pipelines in GPR B-scans using a deep learning model. Tunn Undergr Space Technol. 2023;134:104861.10.1016/j.tust.2022.104861Suche in Google Scholar
[14] Li S, Gu X, Xu X, Xu D, Zhang T, Liu Z, et al. Detection of concealed cracks from ground penetrating radar images based on deep learning algorithm. Constr Build Mater. 2021;273:121949.10.1016/j.conbuildmat.2020.121949Suche in Google Scholar
[15] Li X, Liu H, Zhou F, Chen Z, Giannakis I, Slob E. Deep learning–based nondestructive evaluation of reinforcement bars using ground‐penetrating radar and electromagnetic induction data. Comput Civ Infrastruct Eng. 2021;37:1834–53.10.1111/mice.12798Suche in Google Scholar
[16] Li Y, Zhao Z, Luo Y, Qiu Z. Real-time pattern-recognition of GPR images with YOLO v3 implemented by tensorflow. Sensors. 2020;20:6476.10.3390/s20226476Suche in Google Scholar PubMed PubMed Central
[17] Kafedziski V, Pecov S, Tanevski D. Detection and classification of land mines from ground penetrating radar data using faster R-CNN. 2018 26th Telecommunications Forum (TELFOR). IEEE; 2018. p. 1–4.10.1109/TELFOR.2018.8612117Suche in Google Scholar
[18] Pham M-T, Lefèvre S. Buried object detection from B-scan ground penetrating radar data using Faster-RCNN. IGARSS 2018-2018 IEEE International Geoscience and Remote Sensing Symposium. IEEE; 2018. p. 6804–7.10.1109/IGARSS.2018.8517683Suche in Google Scholar
[19] Huang J, Yang X, Zhou F, Li X, Zhou B, Lu S, et al. A deep learning framework based on improved self‐ supervised learning for ground‐penetrating radar tunnel lining inspection. Comput‐Aided Civ Infrastruct Eng. 2023;39:814–33.10.1111/mice.13042Suche in Google Scholar
[20] Liu B, Zhang J, Lei M, Yang S, Wang Z. Simultaneous tunnel defects and lining thickness identification based on multi-tasks deep neural network from ground penetrating radar images. Autom Constr. 2023;145:104633.10.1016/j.autcon.2022.104633Suche in Google Scholar
[21] Qin H, Zhang D, Tang Y, Wang Y. Automatic recognition of tunnel lining elements from GPR images using deep convolutional networks with data augmentation. Autom Constr. 2021;130:103830.10.1016/j.autcon.2021.103830Suche in Google Scholar
[22] Yue Y, Liu H, Lin C, Meng X, Liu C, Zhang X, et al. Automatic recognition of defects behind railway tunnel linings in GPR images using transfer learning. Measurement. 2024;224:113903.10.1016/j.measurement.2023.113903Suche in Google Scholar
[23] Yue Y, Liu H, Meng X, Li Y, Du Y. Generation of high-precision ground penetrating radar images using improved least square generative adversarial networks. Remote Sens. 2021;13:4590.10.3390/rs13224590Suche in Google Scholar
[24] Li K, Ma W, Sajid U, Wu Y, Wang G. Object detection with convolutional neural networks. Deep learning in computer vision. Elsevier; 2020. p. 41–62.10.1201/9781351003827-2Suche in Google Scholar
[25] O'Shea K, Nash RJ. An introduction to convolutional neural networks. arXiv preprint arXiv:1511.08458; 2015.Suche in Google Scholar
[26] Girshick R, Donahue J, Darrell T, Malik J. Rich feature hierarchies for accurate object detection and semantic segmentation. Proceedings of the IEEE Conference on Computer Vision and Pattern Recognition. 2014; p. 580–7.10.1109/CVPR.2014.81Suche in Google Scholar
[27] Ren S, He K, Girshick R, Sun J. Faster r-cnn: Towards real-time object detection with region proposal networks. IEEE transactions on pattern analysis and machine intelligence. 2015;28:1137–49.10.1109/TPAMI.2016.2577031Suche in Google Scholar PubMed
[28] Redmon J, Divvala S, Girshick R, Farhadi A. You only look once: Unified, real-time object detection. Proceedings of the IEEE Conference on Computer Vision and Pattern Recognition; 2016. p. 779–88.10.1109/CVPR.2016.91Suche in Google Scholar
[29] Jocher G, Stoken A, Borovec J, Changyu L, Hogan A, Diaconu L, et al. ultralytics/yolov5: v3. 1-bug fixes and performance improvements. Zenodo; 2020.Suche in Google Scholar
[30] Yao J, Qi J, Zhang J, Shao H, Yang J, Li X. A real-time detection algorithm for Kiwifruit defects based on YOLOv5. Electronics. 2021;10:1711.10.3390/electronics10141711Suche in Google Scholar
[31] Bochkovskiy A, Wang C-Y, Liao H-Y. Yolov4: Optimal speed and accuracy of object detection. arXiv preprint arXiv:2004.10934; 2020.Suche in Google Scholar
[32] Liu W, Anguelov D, Erhan D, Szegedy C, Reed S, Fu CY, et al. Ssd: Single shot multibox detector. Computer Vision–ECCV 2016: 14th European Conference, Amsterdam, The Netherlands, October 11–14, 2016, Proceedings, Part I 14. Springer; 2016. p. 21–37.10.1007/978-3-319-46448-0_2Suche in Google Scholar
[33] Sharma A, Mishra T, Kukade J, Golwalkar A, Tomar H. Object detection using tensorflow. International Conference on ICT for Sustainable Development. Springer; 2023. p. 343–52.10.1007/978-981-99-6568-7_31Suche in Google Scholar
[34] Warren C, Giannopoulos A, Giannakis I. gprMax: Open source software to simulate electromagnetic wave propagation for Ground Penetrating Radar. Comput Phys Commun. 2016;209:163–70.10.1016/j.cpc.2016.08.020Suche in Google Scholar
[35] Giannopoulos A. Modelling ground penetrating radar by GprMax. Constr Build Mater. 2005;19:755–62.10.1016/j.conbuildmat.2005.06.007Suche in Google Scholar
[36] Umair M, Foo Y-L. Industrial safety helmet detection using single shot detectors models and transfer learning. Multimedia University Engineering Conference (MECON 2022). Atlantis Press; 2022. p. 390–400.10.2991/978-94-6463-082-4_34Suche in Google Scholar
© 2024 the author(s), published by De Gruyter
This work is licensed under the Creative Commons Attribution 4.0 International License.
Artikel in diesem Heft
- Regular Articles
- Theoretical magnetotelluric response of stratiform earth consisting of alternative homogeneous and transitional layers
- The research of common drought indexes for the application to the drought monitoring in the region of Jin Sha river
- Evolutionary game analysis of government, businesses, and consumers in high-standard farmland low-carbon construction
- On the use of low-frequency passive seismic as a direct hydrocarbon indicator: A case study at Banyubang oil field, Indonesia
- Water transportation planning in connection with extreme weather conditions; case study – Port of Novi Sad, Serbia
- Zircon U–Pb ages of the Paleozoic volcaniclastic strata in the Junggar Basin, NW China
- Monitoring of mangrove forests vegetation based on optical versus microwave data: A case study western coast of Saudi Arabia
- Microfacies analysis of marine shale: A case study of the shales of the Wufeng–Longmaxi formation in the western Chongqing, Sichuan Basin, China
- Multisource remote sensing image fusion processing in plateau seismic region feature information extraction and application analysis – An example of the Menyuan Ms6.9 earthquake on January 8, 2022
- Identification of magnetic mineralogy and paleo-flow direction of the Miocene-quaternary volcanic products in the north of Lake Van, Eastern Turkey
- Impact of fully rotating steel casing bored pile on adjacent tunnels
- Adolescents’ consumption intentions toward leisure tourism in high-risk leisure environments in riverine areas
- Petrogenesis of Jurassic granitic rocks in South China Block: Implications for events related to subduction of Paleo-Pacific plate
- Differences in urban daytime and night block vitality based on mobile phone signaling data: A case study of Kunming’s urban district
- Random forest and artificial neural network-based tsunami forests classification using data fusion of Sentinel-2 and Airbus Vision-1 satellites: A case study of Garhi Chandan, Pakistan
- Integrated geophysical approach for detection and size-geometry characterization of a multiscale karst system in carbonate units, semiarid Brazil
- Spatial and temporal changes in ecosystem services value and analysis of driving factors in the Yangtze River Delta Region
- Deep fault sliding rates for Ka-Ping block of Xinjiang based on repeating earthquakes
- Improved deep learning segmentation of outdoor point clouds with different sampling strategies and using intensities
- Platform margin belt structure and sedimentation characteristics of Changxing Formation reefs on both sides of the Kaijiang-Liangping trough, eastern Sichuan Basin, China
- Enhancing attapulgite and cement-modified loess for effective landfill lining: A study on seepage prevention and Cu/Pb ion adsorption
- Flood risk assessment, a case study in an arid environment of Southeast Morocco
- Lower limits of physical properties and classification evaluation criteria of the tight reservoir in the Ahe Formation in the Dibei Area of the Kuqa depression
- Evaluation of Viaducts’ contribution to road network accessibility in the Yunnan–Guizhou area based on the node deletion method
- Permian tectonic switch of the southern Central Asian Orogenic Belt: Constraints from magmatism in the southern Alxa region, NW China
- Element geochemical differences in lower Cambrian black shales with hydrothermal sedimentation in the Yangtze block, South China
- Three-dimensional finite-memory quasi-Newton inversion of the magnetotelluric based on unstructured grids
- Obliquity-paced summer monsoon from the Shilou red clay section on the eastern Chinese Loess Plateau
- Classification and logging identification of reservoir space near the upper Ordovician pinch-out line in Tahe Oilfield
- Ultra-deep channel sand body target recognition method based on improved deep learning under UAV cluster
- New formula to determine flyrock distance on sedimentary rocks with low strength
- Assessing the ecological security of tourism in Northeast China
- Effective reservoir identification and sweet spot prediction in Chang 8 Member tight oil reservoirs in Huanjiang area, Ordos Basin
- Detecting heterogeneity of spatial accessibility to sports facilities for adolescents at fine scale: A case study in Changsha, China
- Effects of freeze–thaw cycles on soil nutrients by soft rock and sand remodeling
- Vibration prediction with a method based on the absorption property of blast-induced seismic waves: A case study
- A new look at the geodynamic development of the Ediacaran–early Cambrian forearc basalts of the Tannuola-Khamsara Island Arc (Central Asia, Russia): Conclusions from geological, geochemical, and Nd-isotope data
- Spatio-temporal analysis of the driving factors of urban land use expansion in China: A study of the Yangtze River Delta region
- Selection of Euler deconvolution solutions using the enhanced horizontal gradient and stable vertical differentiation
- Phase change of the Ordovician hydrocarbon in the Tarim Basin: A case study from the Halahatang–Shunbei area
- Using interpretative structure model and analytical network process for optimum site selection of airport locations in Delta Egypt
- Geochemistry of magnetite from Fe-skarn deposits along the central Loei Fold Belt, Thailand
- Functional typology of settlements in the Srem region, Serbia
- Hunger Games Search for the elucidation of gravity anomalies with application to geothermal energy investigations and volcanic activity studies
- Addressing incomplete tile phenomena in image tiling: Introducing the grid six-intersection model
- Evaluation and control model for resilience of water resource building system based on fuzzy comprehensive evaluation method and its application
- MIF and AHP methods for delineation of groundwater potential zones using remote sensing and GIS techniques in Tirunelveli, Tenkasi District, India
- New database for the estimation of dynamic coefficient of friction of snow
- Measuring urban growth dynamics: A study in Hue city, Vietnam
- Comparative models of support-vector machine, multilayer perceptron, and decision tree predication approaches for landslide susceptibility analysis
- Experimental study on the influence of clay content on the shear strength of silty soil and mechanism analysis
- Geosite assessment as a contribution to the sustainable development of Babušnica, Serbia
- Using fuzzy analytical hierarchy process for road transportation services management based on remote sensing and GIS technology
- Accumulation mechanism of multi-type unconventional oil and gas reservoirs in Northern China: Taking Hari Sag of the Yin’e Basin as an example
- TOC prediction of source rocks based on the convolutional neural network and logging curves – A case study of Pinghu Formation in Xihu Sag
- A method for fast detection of wind farms from remote sensing images using deep learning and geospatial analysis
- Spatial distribution and driving factors of karst rocky desertification in Southwest China based on GIS and geodetector
- Physicochemical and mineralogical composition studies of clays from Share and Tshonga areas, Northern Bida Basin, Nigeria: Implications for Geophagia
- Geochemical sedimentary records of eutrophication and environmental change in Chaohu Lake, East China
- Research progress of freeze–thaw rock using bibliometric analysis
- Mixed irrigation affects the composition and diversity of the soil bacterial community
- Examining the swelling potential of cohesive soils with high plasticity according to their index properties using GIS
- Geological genesis and identification of high-porosity and low-permeability sandstones in the Cretaceous Bashkirchik Formation, northern Tarim Basin
- Usability of PPGIS tools exemplified by geodiscussion – a tool for public participation in shaping public space
- Efficient development technology of Upper Paleozoic Lower Shihezi tight sandstone gas reservoir in northeastern Ordos Basin
- Assessment of soil resources of agricultural landscapes in Turkestan region of the Republic of Kazakhstan based on agrochemical indexes
- Evaluating the impact of DEM interpolation algorithms on relief index for soil resource management
- Petrogenetic relationship between plutonic and subvolcanic rocks in the Jurassic Shuikoushan complex, South China
- A novel workflow for shale lithology identification – A case study in the Gulong Depression, Songliao Basin, China
- Characteristics and main controlling factors of dolomite reservoirs in Fei-3 Member of Feixianguan Formation of Lower Triassic, Puguang area
- Impact of high-speed railway network on county-level accessibility and economic linkage in Jiangxi Province, China: A spatio-temporal data analysis
- Estimation model of wild fractional vegetation cover based on RGB vegetation index and its application
- Lithofacies, petrography, and geochemistry of the Lamphun oceanic plate stratigraphy: As a record of the subduction history of Paleo-Tethys in Chiang Mai-Chiang Rai Suture Zone of Thailand
- Structural features and tectonic activity of the Weihe Fault, central China
- Application of the wavelet transform and Hilbert–Huang transform in stratigraphic sequence division of Jurassic Shaximiao Formation in Southwest Sichuan Basin
- Structural detachment influences the shale gas preservation in the Wufeng-Longmaxi Formation, Northern Guizhou Province
- Distribution law of Chang 7 Member tight oil in the western Ordos Basin based on geological, logging and numerical simulation techniques
- Evaluation of alteration in the geothermal province west of Cappadocia, Türkiye: Mineralogical, petrographical, geochemical, and remote sensing data
- Numerical modeling of site response at large strains with simplified nonlinear models: Application to Lotung seismic array
- Quantitative characterization of granite failure intensity under dynamic disturbance from energy standpoint
- Characteristics of debris flow dynamics and prediction of the hazardous area in Bangou Village, Yanqing District, Beijing, China
- Rockfall mapping and susceptibility evaluation based on UAV high-resolution imagery and support vector machine method
- Statistical comparison analysis of different real-time kinematic methods for the development of photogrammetric products: CORS-RTK, CORS-RTK + PPK, RTK-DRTK2, and RTK + DRTK2 + GCP
- Hydrogeological mapping of fracture networks using earth observation data to improve rainfall–runoff modeling in arid mountains, Saudi Arabia
- Petrography and geochemistry of pegmatite and leucogranite of Ntega-Marangara area, Burundi, in relation to rare metal mineralisation
- Prediction of formation fracture pressure based on reinforcement learning and XGBoost
- Hazard zonation for potential earthquake-induced landslide in the eastern East Kunlun fault zone
- Monitoring water infiltration in multiple layers of sandstone coal mining model with cracks using ERT
- Study of the patterns of ice lake variation and the factors influencing these changes in the western Nyingchi area
- Productive conservation at the landslide prone area under the threat of rapid land cover changes
- Sedimentary processes and patterns in deposits corresponding to freshwater lake-facies of hyperpycnal flow – An experimental study based on flume depositional simulations
- Study on time-dependent injectability evaluation of mudstone considering the self-healing effect
- Detection of objects with diverse geometric shapes in GPR images using deep-learning methods
- Behavior of trace metals in sedimentary cores from marine and lacustrine environments in Algeria
- Spatiotemporal variation pattern and spatial coupling relationship between NDVI and LST in Mu Us Sandy Land
- Formation mechanism and oil-bearing properties of gravity flow sand body of Chang 63 sub-member of Yanchang Formation in Huaqing area, Ordos Basin
- Diagenesis of marine-continental transitional shale from the Upper Permian Longtan Formation in southern Sichuan Basin, China
- Vertical high-velocity structures and seismic activity in western Shandong Rise, China: Case study inspired by double-difference seismic tomography
- Spatial coupling relationship between metamorphic core complex and gold deposits: Constraints from geophysical electromagnetics
- Disparities in the geospatial allocation of public facilities from the perspective of living circles
- Research on spatial correlation structure of war heritage based on field theory. A case study of Jinzhai County, China
- Formation mechanisms of Qiaoba-Zhongdu Danxia landforms in southwestern Sichuan Province, China
- Magnetic data interpretation: Implication for structure and hydrocarbon potentiality at Delta Wadi Diit, Southeastern Egypt
- Deeply buried clastic rock diagenesis evolution mechanism of Dongdaohaizi sag in the center of Junggar fault basin, Northwest China
- Application of LS-RAPID to simulate the motion of two contrasting landslides triggered by earthquakes
- The new insight of tectonic setting in Sunda–Banda transition zone using tomography seismic. Case study: 7.1 M deep earthquake 29 August 2023
- The critical role of c and φ in ensuring stability: A study on rockfill dams
- Evidence of late quaternary activity of the Weining-Shuicheng Fault in Guizhou, China
- Extreme hydroclimatic events and response of vegetation in the eastern QTP since 10 ka
- Spatial–temporal effect of sea–land gradient on landscape pattern and ecological risk in the coastal zone: A case study of Dalian City
- Study on the influence mechanism of land use on carbon storage under multiple scenarios: A case study of Wenzhou
- A new method for identifying reservoir fluid properties based on well logging data: A case study from PL block of Bohai Bay Basin, North China
- Comparison between thermal models across the Middle Magdalena Valley, Eastern Cordillera, and Eastern Llanos basins in Colombia
- Mineralogical and elemental analysis of Kazakh coals from three mines: Preliminary insights from mode of occurrence to environmental impacts
- Chlorite-induced porosity evolution in multi-source tight sandstone reservoirs: A case study of the Shaximiao Formation in western Sichuan Basin
- Predicting stability factors for rotational failures in earth slopes and embankments using artificial intelligence techniques
- Origin of Late Cretaceous A-type granitoids in South China: Response to the rollback and retreat of the Paleo-Pacific plate
- Modification of dolomitization on reservoir spaces in reef–shoal complex: A case study of Permian Changxing Formation, Sichuan Basin, SW China
- Geological characteristics of the Daduhe gold belt, western Sichuan, China: Implications for exploration
- Rock physics model for deep coal-bed methane reservoir based on equivalent medium theory: A case study of Carboniferous-Permian in Eastern Ordos Basin
- Enhancing the total-field magnetic anomaly using the normalized source strength
- Shear wave velocity profiling of Riyadh City, Saudi Arabia, utilizing the multi-channel analysis of surface waves method
- Effect of coal facies on pore structure heterogeneity of coal measures: Quantitative characterization and comparative study
- Inversion method of organic matter content of different types of soils in black soil area based on hyperspectral indices
- Detection of seepage zones in artificial levees: A case study at the Körös River, Hungary
- Tight sandstone fluid detection technology based on multi-wave seismic data
- Characteristics and control techniques of soft rock tunnel lining cracks in high geo-stress environments: Case study of Wushaoling tunnel group
- Influence of pore structure characteristics on the Permian Shan-1 reservoir in Longdong, Southwest Ordos Basin, China
- Study on sedimentary model of Shanxi Formation – Lower Shihezi Formation in Da 17 well area of Daniudi gas field, Ordos Basin
- Multi-scenario territorial spatial simulation and dynamic changes: A case study of Jilin Province in China from 1985 to 2030
- Review Articles
- Major ascidian species with negative impacts on bivalve aquaculture: Current knowledge and future research aims
- Prediction and assessment of meteorological drought in southwest China using long short-term memory model
- Communication
- Essential questions in earth and geosciences according to large language models
- Erratum
- Erratum to “Random forest and artificial neural network-based tsunami forests classification using data fusion of Sentinel-2 and Airbus Vision-1 satellites: A case study of Garhi Chandan, Pakistan”
- Special Issue: Natural Resources and Environmental Risks: Towards a Sustainable Future - Part I
- Spatial-temporal and trend analysis of traffic accidents in AP Vojvodina (North Serbia)
- Exploring environmental awareness, knowledge, and safety: A comparative study among students in Montenegro and North Macedonia
- Determinants influencing tourists’ willingness to visit Türkiye – Impact of earthquake hazards on Serbian visitors’ preferences
- Application of remote sensing in monitoring land degradation: A case study of Stanari municipality (Bosnia and Herzegovina)
- Optimizing agricultural land use: A GIS-based assessment of suitability in the Sana River Basin, Bosnia and Herzegovina
- Assessing risk-prone areas in the Kratovska Reka catchment (North Macedonia) by integrating advanced geospatial analytics and flash flood potential index
- Analysis of the intensity of erosive processes and state of vegetation cover in the zone of influence of the Kolubara Mining Basin
- GIS-based spatial modeling of landslide susceptibility using BWM-LSI: A case study – city of Smederevo (Serbia)
- Geospatial modeling of wildfire susceptibility on a national scale in Montenegro: A comparative evaluation of F-AHP and FR methodologies
- Geosite assessment as the first step for the development of canyoning activities in North Montenegro
- Urban geoheritage and degradation risk assessment of the Sokograd fortress (Sokobanja, Eastern Serbia)
- Multi-hazard modeling of erosion and landslide susceptibility at the national scale in the example of North Macedonia
- Understanding seismic hazard resilience in Montenegro: A qualitative analysis of community preparedness and response capabilities
- Forest soil CO2 emission in Quercus robur level II monitoring site
- Characterization of glomalin proteins in soil: A potential indicator of erosion intensity
- Power of Terroir: Case study of Grašac at the Fruška Gora wine region (North Serbia)
- Special Issue: Geospatial and Environmental Dynamics - Part I
- Qualitative insights into cultural heritage protection in Serbia: Addressing legal and institutional gaps for disaster risk resilience