Experimental study on the influence of clay content on the shear strength of silty soil and mechanism analysis
-
Haibiao Xu

 ,
Pengpeng Liu
,
Pengpeng Liu

Abstract
Shear strengths of silty soil were determined for shallow destruction of the soil sites frequently occurring in the Central Plains area. Specimens were prepared with five different clay contents (5, 10, 15, 20, and 25%) prior to compaction at dry densities of 1.60, 1.70, and 1.80 g/cm3. Soil specimens were saturated and then the consolidated undrained shear test was conducted with eight confined pressures ranging from 1 to 400 kPa. Results indicate that the shear strength increases significantly as the clay content increases from 5 to 25%, and the cohesion c shows bilinear function with the inflection point at the clay content of 10%. The difference of cohesion in the high and low stress sections decreases gradually to almost the same value until 25% of the clay content, while the internal friction angle φ decreases with the increase in clay content. Within the range of dry density and clay content tested, the shear strength of silty soil in the low stress range obtained is higher than the measured value. Therefore, for the shallow damage of soil site, the shear strength parameters should consider the low stress test conditions. The bilinear growth of cohesion c with clay content can be attributed to the changes from “sand-like soil” to “clay-like soil” with the skeleton of soil specimen transitioning from sand particles to “clay grid” when the clay content exceeds approximately 10% combined with the results of scanning electron microscopy.
1 Introduction
With social progress and economic development, the concept of cultural relics protection is increasingly enhanced, and a large number of earth sites are restored. After the ecological protection and high-quality development of the Yellow River Basin have become a national strategy, it is necessary to carry out the Yellow River Cultural Heritage System protection project. Located in the middle and lower reaches of the Yellow River Henan Province is the birthplace of Chinese civilization. There are more than 320 earth sites, most of which are rammed by silt or silty sand. Due to long-term exposure to the natural environment, the site is very easy to deteriorate, the shear resistance is poor, and it is easy to produce cracks, erosion, collapse, and other types of failure [1]. The method of adding clay particles conforms to the principles of “using ancient materials” and “repairing the old as the old” in the protection of soil sites [2,3,4]. And it is widely used in the preventive protection of soil sites. However, unlike pure sand or clay, the existence of fine particles, especially clay particles, makes the shear behavior of fine-grained sand (such as silty sand, etc.) very complex [5], and the mechanism of clay action is still unclear. Therefore, it is necessary to study the influence of clay content on the mechanical properties of soil sites in the Central Plains.
Scientists at home and abroad have studied the mechanical properties and formation mechanisms of soil samples with different clay contents. For example, Papadopoulou and Tika [6] conducted monotonic and cyclic triaxial tests on sand with fine grains, and studied the influence of the plasticity of fine grains on the strength characteristics of sand. The results showed that the undrained shear strength of sand with fine grains increased with the increase in plasticity index of fine grains. The research by Thevanayagam et al. [7,8,9] shows that the fine-grained content has a great influence on the stress–strain relationship of sand. Kim et al. [10] conducted undrained triaxial tests on clay sand with different mixing ratios. The results showed that the shear strength of low-density samples increased with the increase in fine-grained content, while that of high-density samples decreased. Lai et al. [11] conducted the influence of dry density and shear rate on the shear strength of saturated remolded loess. The results showed that with the increase in dry density, the cohesive force and internal friction angle of reshaped saturated loess samples increase. Dafalla [12] conducted direct shear tests on clayey sand and loess and found that the cohesion of the samples increased gradually with the increase in the clay content. It can be found that the effect of clay content on the mechanical properties of soil is more complex, and the academic community has not reached a consensus at present. Therefore, it is of great theoretical and practical significance to systematically study the influence of clay content on the silty soil behavior in the Central Plains for the protection and restoration of soil sites.
The resistance of soil sites to destruction is closely related to their strength and deformation parameters. Cohesion value can indirectly reflect the tensile strength of soil, and it is the main index reflecting the ability of soil sites to resist destruction [13]. The cracks, undercutting, collapse, and other deterioration of the earth sites in the Central Plains mainly occur in the shallow part of the earth sites, with the depth range generally not exceeding 3 m [1], as shown in Figure 1. And the stress on the sliding surface is less than the normal stress in the shear strength test (50–400 kPa) [14]. Therefore, the shear strength of soil under low-stress conditions can be used to characterize its real strength [15,16].

Characteristics of shallow types of failure: (a) collapse and (b) undercutting (photo taken in Yuanling ancient city).
On the other hand, for soil materials, the difference in physical and mechanical properties is mainly caused by the difference in its microstructure. For instance, Farulla et al. [17,18,19] investigated the impact of the change in particle arrangement characteristics of silty sand and clay on its macro mechanical properties through scanning electron microscopy (SEM) analyses. Consequently, an analysis of the mechanical properties of the site soil with various clay contents should be complemented by a description of its corresponding microscopic characteristics.
This study takes the silt of typical sites in the Central Plains as the research object, and uses a triaxial apparatus to carry out consolidated undrained shear tests of silt with different clay contents (5–25%), stress conditions (1–400 kPa), and dry density (1.6, 1.7, and 1.8 g/cm3). Through SEM test, the microstructure of some samples is analyzed to explore the influence of clay content on the shear strength parameters of site soil under both low-stress and high-stress conditions. This research provides valuable insights for the preventive protection of soil sites.
2 Materials and methods
2.1 Materials
Located in Zhengzhou city, Henan Province, Yuanling ancient city is the seventh batch of national key cultural relics protection units, which has a high research and reference value for the study of politics, economy, and military affairs in the Central Plains. According to the specifications of investigation for preservation engineering of earthen sites (WW/T 0040-2012) [20], the destruction of earth sites should be avoided as much as possible in the process of soil sampling based on the principle of “minimum intervention” in the protection of earth sites. Therefore, the soil samples used in the test are silty sand from the scattered soil of Yuanling’s old city wall. The soil index properties are shown in Table 1 according to the Chinese Standard for geotechnical testing method (GB/T 50123-1999, GB 1999) [21].
Basic properties of soil sample
| Liquid limit w L (%) | Plastic limit w P (%) | Plasticity index I P | Optimum moisture content w pt (%) | Maximum dry density ρ dmax (g/cm3) |
|---|---|---|---|---|
| 19.20 | 8.22 | 10.98 | 9.30 | 1.96 |
The clay particle is 6,000 mesh kaolin with a particle size of less than 0.005 mm. The particle size was measured by laser diffraction technique. The results showed that the proportion of clay was 81.15%. To reduce experimental errors, the sandy soil and kaolin clay particles were dried to constant weight in a 105°C oven before the experiment. Then, different contents (5, 10, 15, 20, and 25%) of kaolin clay are set to prepare soil samples. Figure 2 shows the particle grading curves of soil samples with different clay contents.

The grain size distribution curve of silty soil with different clay contents.
2.2 Liquid limit and plastic limit
Clay content is an important factor affecting the liquid limit of soil specimens. There is a positive linear relationship between the liquid limit and the clay content, and the correlation between the liquid limit and the clay content are significantly higher than the plastic limit (Figure 3). This is consistent with the conclusions of Jong et al. and Constantinescu and Constantinescu [22,23]. The main reason is that the particles size of clay particles is much smaller than that of powder and sand particles, and there are a lot of adsorbed water film on the surface, while the pores between clay particles are very small. Therefore, the water film adsorbed by clay particles may fill these tiny pores, and the adsorbed water film may also be protected under the action of capillary force. Holding a certain amount of water affects the liquid limit of the silty sand.

Relationship between liquid/plastic limit and clay content.
The plasticity index indicates the plasticity degree of soil, which is the water content of the difference between the liquid limit and the plastic limit. It indicates that the range from semi-solid to liquid state of soil can absorb water is closely related to the particle size distribution and clay content of the soil. There is a significant linear relationship between plasticity index and clay content, as shown in Figure 4.
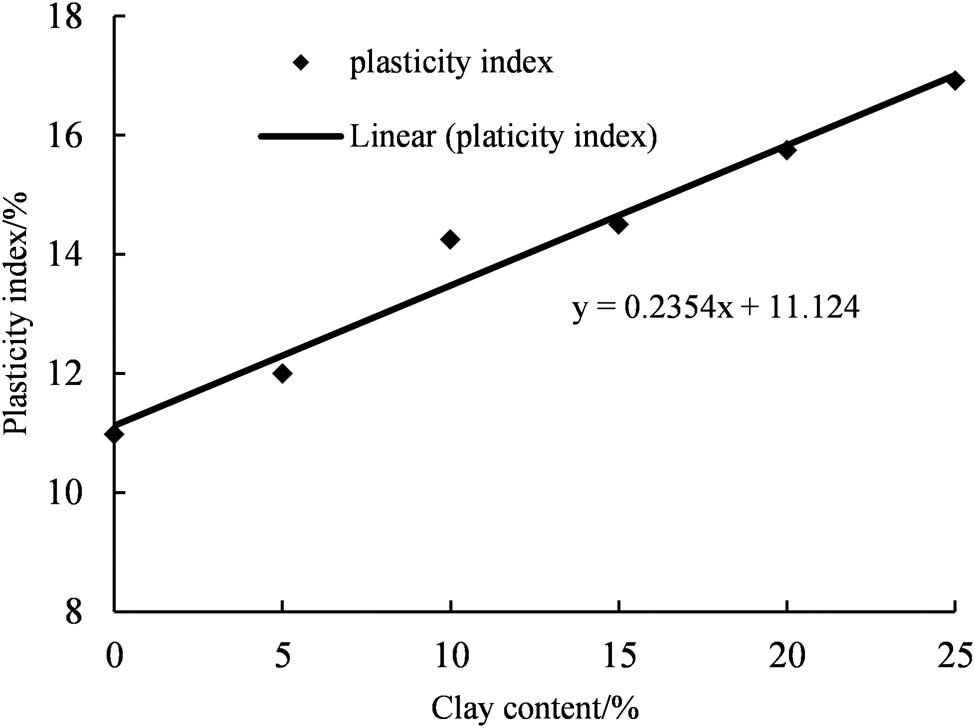
Relationship between plasticity index and clay content.
2.3 Methods
The static compaction method is adopted to produce cylindrical soil specimens with a diameter of 50 mm and a height of 100 mm by jack and sampling setup. After the sample is vacuumed and saturated, the triaxial consolidated undrained shear test shall be carried out according to specification for geotechnical testing (sl237-1997) [24]. During the experiment, the samples are sequentially subjected to steps such as soil sample installation, back pressure saturation, saturation check, sample consolidation, and shearing. Among them, when the sample is saturated, the back pressure is 100 kPa and the confining pressure is 105 kPa. After saturation for a period of time, check the saturation state of the sample. Only when the saturation is greater than 0.95, the test will continue downwards. Otherwise, continue to saturate, which can effectively ensure the reliability of the test results. During the shearing process, the shear rate is 0.1 mm/min and the test is completed when the axial strain reaches 15%. The standard stress path triaxial test system (Figure 5) was used in this test. In this work, the low-stress refers to four levels of load, i.e., 1, 5, 10, and 25 kPa and the high-stress is 50, 100, 200, and 400 kPa. The specific experimental design parameters are shown in Table 2.
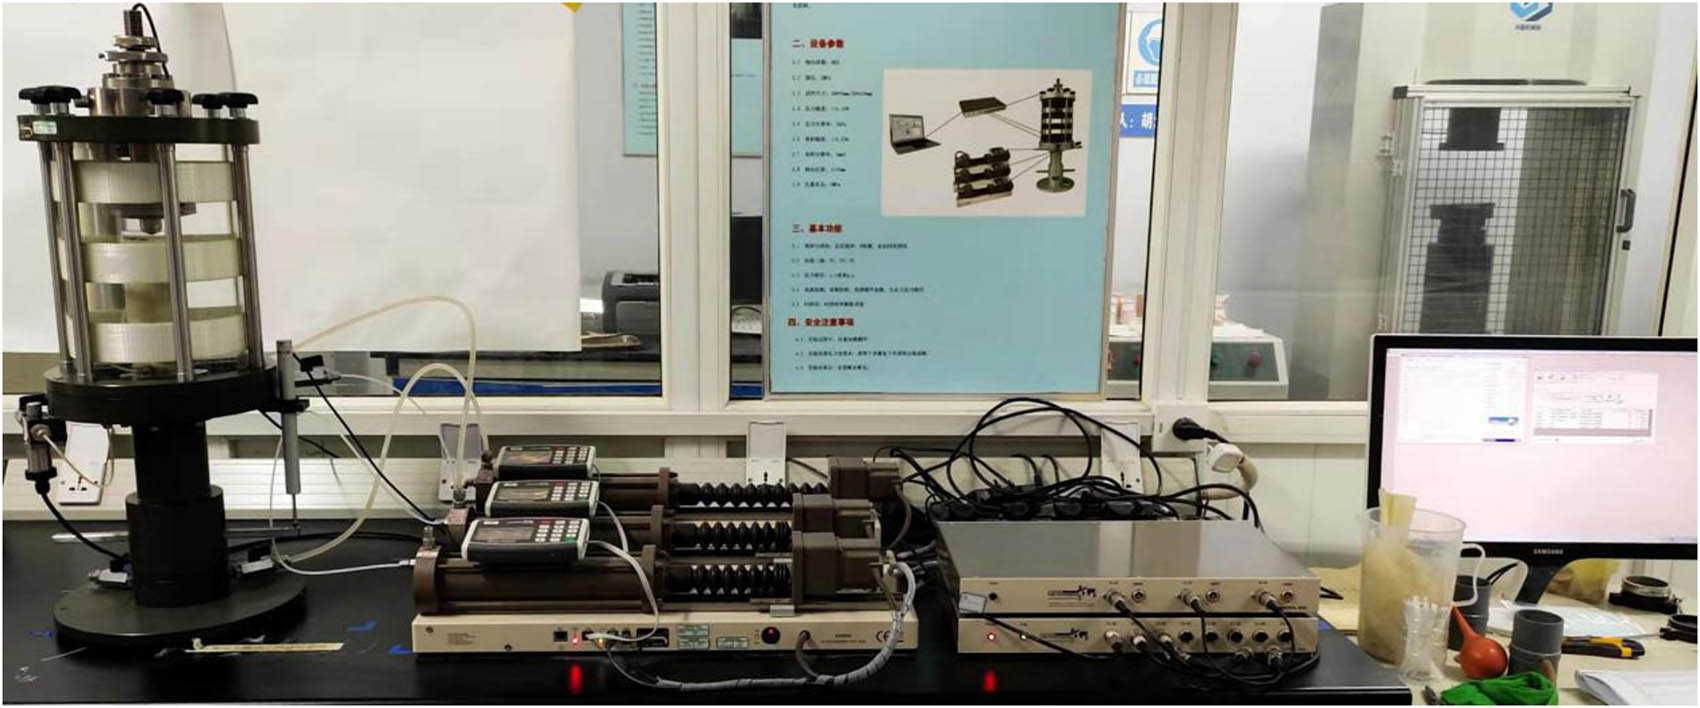
Experimental system.
Triaxial test scheme
| Dry density (g/cm3) | Clay content (%) | Confining pressure (kPa) | Stress conditions |
|---|---|---|---|
| 1 | |||
| 5 | Low stress | ||
| 5 | 10 | ||
| 1.60 | 10 | 25 | |
| 1.70 | 15 | 50 | |
| 1.80 | 20 | 100 | High stress |
| 25 | 200 | ||
| 400 |
3 Results and discussions
3.1 Deviator stress–strain curve
The soil samples were prepared with varying clay content and subjected to triaxial shear tests. Considering the similarity in deviatoric stress–strain curves between high and low stress sections with varying clay content, only the deviatoric stress–strain curves of dry densities 1.60, 1.70, and 1.80 g/cm3 were selected for further analysis at a low stress level of 25 kPa and a high stress level of 200 kPa (as shown in Figures 6 and 7). When there is peak stress, the peak stress is taken as shear strength; when there is no peak, the stress value corresponding to 15% of strain is taken as shear strength, and the test results are listed in Table 3.

Deviator stress–strain curve under low-stress at confining stress of 25 kPa: (a) Dry density of 1.60 g/cm3, (b) dry density of 1.70 g/cm3, and (c) dry density of 1.80 g/cm3.

Deviator stress–strain curve under high-stress at confining stress of 200 kPa: (a) Dry density of 1.60 g/cm3, (b) dry density of 1.70 g/cm3, and (c) dry density of 1.80 g/cm3.
Results of shear strength tests
| Clay content (%) | Dry density (g/cm3) | Shear strength (kPa) | |||||||
|---|---|---|---|---|---|---|---|---|---|
| 1 | 5 | 10 | 25 | 50 | 100 | 200 | 400 | ||
| 5 | 1.60 | 16.32 | 27.03 | 28.86 | 38.31 | 52.44 | 80.06 | 115.23 | 232.48 |
| 1.70 | 16.82 | 33.63 | 45.06 | 48.20 | 81.56 | 91.68 | 157.30 | 292.96 | |
| 1.80 | 29.53 | 50.15 | 60.49 | 67.23 | 83.79 | 131.61 | 265.43 | 430.27 | |
| 10 | 1.60 | 18.39 | 34.53 | 43.58 | 47.33 | 71.25 | 86.05 | 117.81 | 236.75 |
| 1.70 | 32.28 | 43.58 | 58.23 | 61.90 | 99.91 | 105.10 | 171.79 | 300.21 | |
| 1.80 | 35.53 | 49.42 | 63.44 | 75.84 | 101.71 | 134.77 | 298.48 | 431.28 | |
| 15 | 1.60 | 31.53 | 45.73 | 56.73 | 57.78 | 84.73 | 105.79 | 137.13 | 260.14 |
| 1.70 | 44.75 | 54.43 | 81.65 | 71.29 | 113.97 | 125.55 | 230.45 | 373.25 | |
| 1.80 | 52.03 | 65.23 | 89.03 | 106.57 | 129.48 | 208.48 | 340.57 | 483.27 | |
| 20 | 1.60 | 40.65 | 50.56 | 64.44 | 68.63 | 97.18 | 115.14 | 163.09 | 297.07 |
| 1.70 | 55.82 | 65.73 | 80.69 | 86.19 | 115.68 | 152.13 | 261.59 | 418.72 | |
| 1.80 | 65.20 | 76.98 | 104.48 | 126.28 | 178.47 | 244.32 | 364.57 | 517.39 | |
| 25 | 1.60 | 47.87 | 56.05 | 67.88 | 69.53 | 103.08 | 133.54 | 175.27 | 316.99 |
| 1.70 | 73.38 | 83.64 | 100.80 | 104.55 | 142.09 | 167.12 | 284.53 | 441.99 | |
| 1.80 | 103.64 | 111.79 | 127.98 | 148.03 | 220.79 | 291.90 | 419.08 | 546.29 | |
As can be seen in the Figures 6 and 7, under different clay contents and dry densities, the deviator stress–strain curves of soil are different, which are strain softening type or strain hardening type. Under the same dry density, the deviator stress–strain curve was similar when the content of clay was 5 and 10%, but the deviator stress value increased significantly when the content of clay increased to 15%.
Under high and low stresses, when the dry density is 1.60 g/cm3, the deviator stress–strain curve of 5–20% clay content has an obvious peak value, which is the strain softening type. When the clay content continues to increase to 25%, the softening is weakened, and the curve begins to change to strain hardening type. When the dry density increases to 1.80 g/cm3, the pores between the soil particles are compressed, the particles are closely combined, and the peak value of the deviator stress is significantly increased. The stress–strain curves shift to hardening type.
At the same dry density, as the consolidation stress of the sample increases, some pores between soil particles have been adjusted or closed at this stage, and the stress–strain relationship curve gradually changes to hardening type. Moreover, with the increase in clay content, the stress–strain curve hardening becomes more significant.
3.2 Influence of consolidation stress and clay content on shear strength
Based on the experimental study of shear strength of expansive soil under low stress conditions by Yang et al. [25], the Mohr circles were first drawn for the measurement points of four high stresses according to the standard method to obtain the straight-line formula of shear strength, and the corresponding shear stresses of four low stress points were calculated accordingly. Meanwhile, the measured shear stresses of each low stress point were listed for comparison. The results are shown in Table 4 when the confining pressure is 1, 5, 10, and 25 kPa, the calculated value obtained by the standard method is 1.91, 1.50, 1.21, and 1.37 times of the measured value for the samples of 10% clay content and 1.70 g/cm3 dry density. And when the clay content is 20% and the dry density is 1.60 g/cm3, the calculated value is 1.84, 1.51, 1.22, and 1.24 times of the measured value. The shear strength under the low-stress obtained by the fitting formula of the standard method is far greater than the measured value. Therefore, it is not safe enough to use the calculated strength by conventional stress (or high-stress) to analyze the shallow stability of earth sites.
Measured value and corresponding calculated value of shear stress under low-stress
| Clay content (%) | Dry density (g/cm3) | Measured value (kPa) | Calculated value (kPa) | ||||||
|---|---|---|---|---|---|---|---|---|---|
| 1 | 5 | 10 | 25 | 1 | 5 | 10 | 25 | ||
| 5 | 1.60 | 16.32 | 27.03 | 28.86 | 38.31 | 36.69 | 38.26 | 40.22 | 46.09 |
| 1.70 | 16.82 | 33.63 | 45.06 | 48.20 | 40.49 | 44.49 | 49.49 | 64.49 | |
| 1.80 | 29.53 | 50.15 | 60.49 | 67.23 | 53.87 | 55.80 | 58.22 | 65.47 | |
| 10 | 1.60 | 18.39 | 34.53 | 43.58 | 47.33 | 50.46 | 51.93 | 53.76 | 59.26 |
| 1.70 | 32.28 | 43.58 | 58.23 | 61.90 | 61.69 | 65.53 | 70.32 | 84.69 | |
| 1.80 | 35.53 | 49.42 | 63.44 | 75.84 | 72.73 | 74.53 | 76.78 | 83.53 | |
| 15 | 1.60 | 31.53 | 45.73 | 56.73 | 57.78 | 66.38 | 67.88 | 69.76 | 75.38 |
| 1.70 | 44.75 | 54.43 | 81.65 | 71.29 | 85.44 | 87.81 | 90.77 | 99.64 | |
| 1.80 | 52.03 | 65.23 | 89.03 | 106.57 | 109.81 | 113.61 | 118.36 | 132.61 | |
| 20 | 1.60 | 40.65 | 50.56 | 64.44 | 68.63 | 74.77 | 76.50 | 78.67 | 85.17 |
| 1.70 | 55.82 | 65.73 | 80.69 | 86.19 | 94.51 | 97.18 | 100.51 | 110.51 | |
| 1.80 | 65.20 | 76.98 | 104.48 | 126.28 | 136.94 | 140.78 | 145.57 | 159.94 | |
| 25 | 1.60 | 47.87 | 56.05 | 67.88 | 69.53 | 84.62 | 86.42 | 88.67 | 95.42 |
| 1.70 | 73.38 | 83.64 | 100.80 | 104.55 | 116.76 | 119.43 | 122.76 | 132.76 | |
| 1.80 | 103.64 | 111.79 | 127.98 | 148.03 | 205.86 | 209.26 | 213.51 | 217.93 | |
According to the specification for geotechnical testing (sl237-1997), the effective stress Mohr circles of the triaxial test shear strengths under four high stresses and four low stresses were drawn, respectively, and the nonlinear characteristics of strength under high stress and low stress were compared and analyzed. Given the similarity in nonlinear characteristics observed in the test, only the broken line representing sectional strength for samples with 10 and 20% clay content and a dry density of 1.80 g/cm3 is presented (Figure 8). From Figure 8(a), it can be seen that the fitting formula of the low-stress section is y = 0.95x + 13.8, and that of the high-stress section is y = 0.58x + 25.4. From Figure 8(b), it can be seen that the fitting formula of the low-stress section is y = 0.85x + 36, and that of the high-stress section is y = 0.57x + 41.79. The slope and intercept of the fitting formula of the high and low stress sections are different significantly.

Shear stress curve for samples with dry density of 1.80 g/cm3: (a) Clay content of 10% and (b) clay content of 20%.
3.3 Relationship between clay content and shear strength index
The cohesion and internal friction angle exhibited similar changes with the clay content under three dry density conditions. Therefore, only the relationship curves between the strength parameters of high and low stress ranges and the clay content were plotted for a dry density of 1.70 g/cm3 (refer to Figure 9). The cohesion value of soil samples increased significantly with the corresponding rise in clay content, while the internal friction angle value decreased gradually, which was consistent with the conclusions of Dafalla [12].
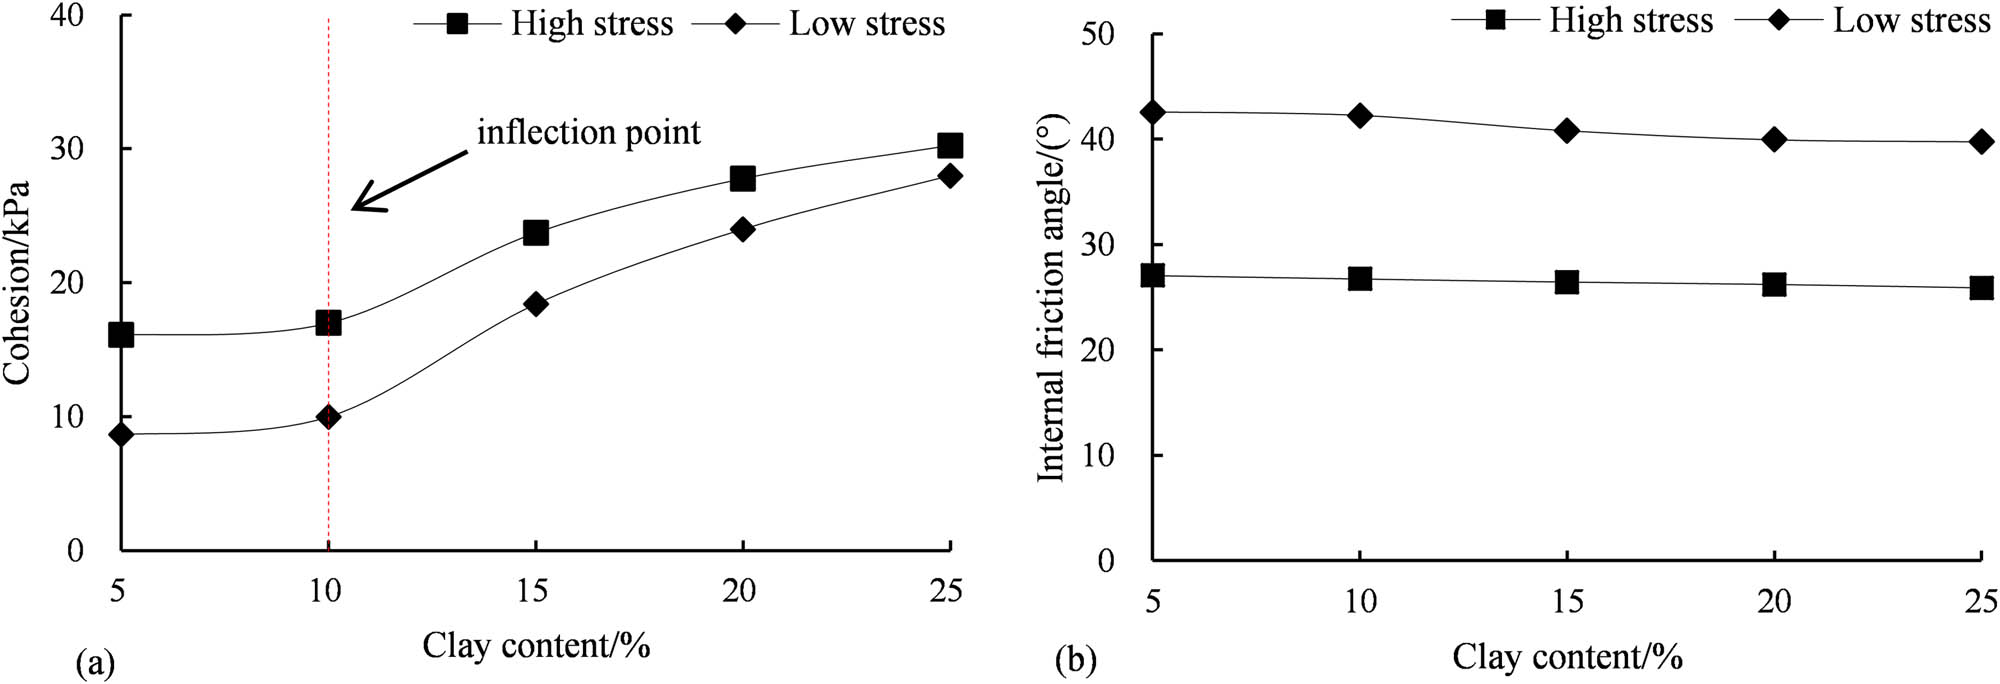
Relationship between strength parameters cohesion and friction angle with clay content: (a) Relationship between cohesion and clay content and (b) relationship between internal friction angle and clay content.
The cohesion increases with the increase in clay content in bilinear, regardless of the state of high-stress or low-stress consolidation. The inflection point occurs at 10% clay content, and the curve slope of the high and low stress section on the right side of the inflection point is significantly larger than that on the left side. In addition, with the increase in clay content from 5 to 25%, the cohesion value of low-stress section increased more significantly, from 8.7 to 28 kPa.
Several scientists [26] have emphasized the crucial role played by the cohesion c value in determining whether shallow collapse occurs on soil slopes. The cohesion c value of silty sand with clay content below 10% exhibits significant variations under high and low stresses. As the clay content increases, the disparity between cohesion c values in high and low stress sections gradually diminishes, becoming essentially equal at a clay content of 25%. Given that soil sites in the Central Plains predominantly consist of silty soil or silty sand (with clay content <10%), and that soil site deterioration are concentrated in shallow areas, it is imperative to investigate comparative analysis between low stress and high stress conditions during soil site protection efforts. This will enable obtaining reasonable strength parameters based on actual protection conditions.
In the earth site restoration project, the sampling work to obtain the strength parameters contradicts the principle of “minimum intervention” and other cultural relics protection principles. However, some soil sites in Henan province have silty sand with varying clay content. Therefore, the strength parameters obtained from the test can serve as a reference for determining the mechanical parameters of the site.
3.4 Relationship between dry density and shear strength index
Considering the consistent variation patterns between shear strength indexes and dry density observed in multiple test groups, only the relationship curves depicting the strength parameters of high- and low-stress segments with respect to dry density at 25% clay content were plotted (refer to Figure 10).
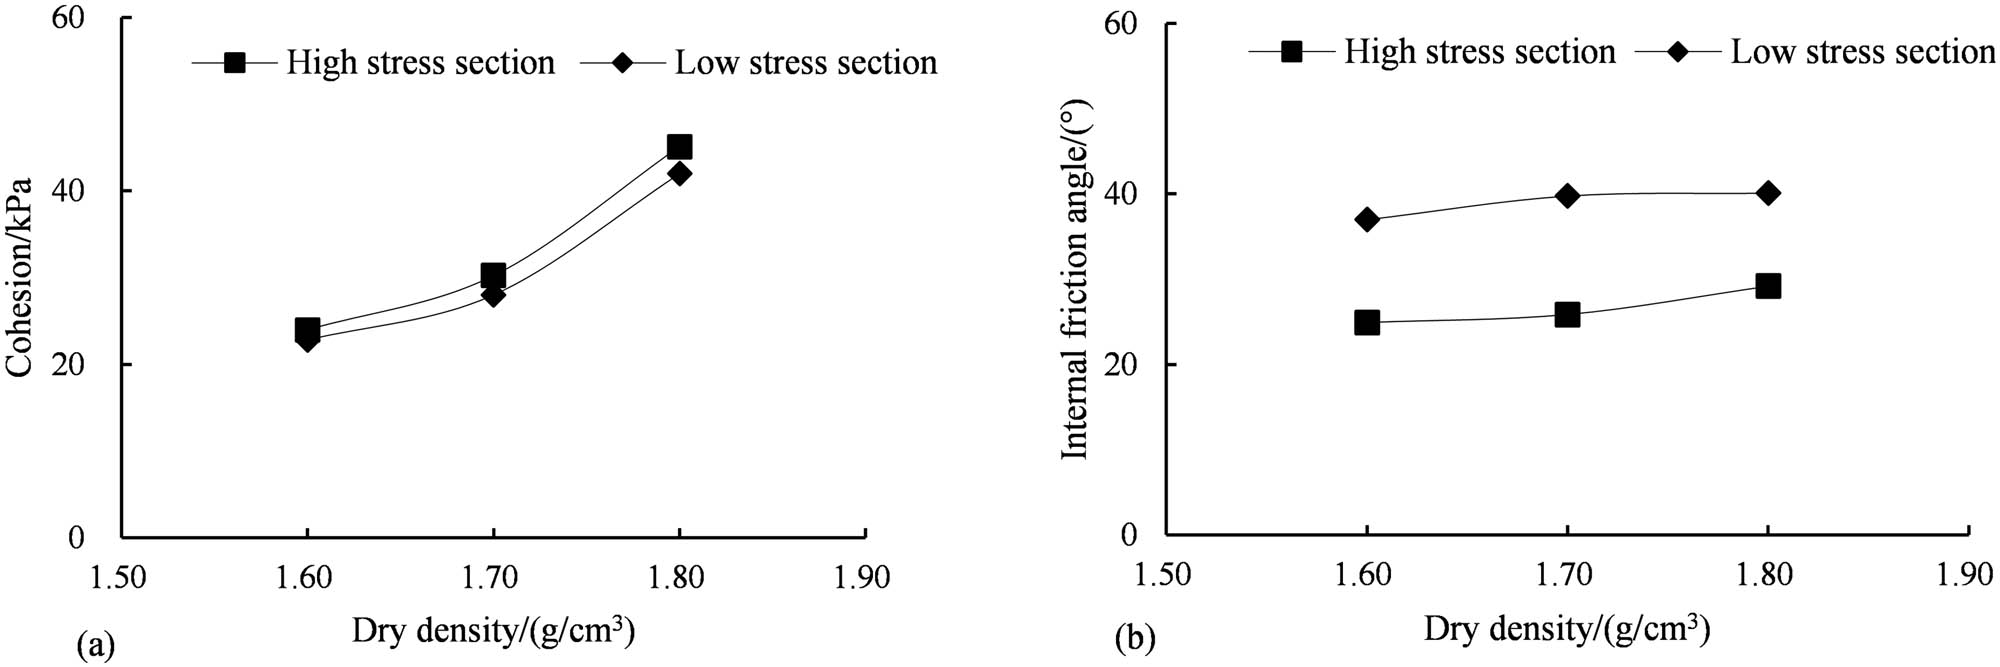
Relationship between strength parameters and dry density: (a) Relationship between cohesion and dry density and (b) relationship between internal friction angle and dry density.
The cohesion and internal friction angle of the sample increase with the increase in dry density. The reason is that with the increase in dry density, the sample becomes denser and the friction between aggregates increases gradually. The force required to overcome the friction between aggregates by external force will increase rapidly, so the shear strength parameters will increase rapidly.
With the increase in dry density from 1.60 to 1.80 g/cm3, the cohesion and internal friction angle of low-stress section increased by 84.2 and 18.4%, respectively, while those of high-stress section showed an increase of 88% for c and 17.1% for φ. This indicates that the effect of dry density on cohesion was more significant than that of internal friction angle, while the effect of dry density on cohesion and internal friction angle was similar across the low-stress and high-stress sections.
3.5 Absolute growth rate of shear strength
To quantitatively analyze the change rule of strength (the increased range of shear strength τ i) under different dry densities and different clay contents, the definition of absolute increase rate of strength Δ i,j is given (equation (1)):
where i is the clay content, j is the vertical stress of the sample, τ 0 and τ i are the shear strengths when the clay content of the sample is 0 and i, respectively.
Considering the consistent variation patterns in the absolute growth rates of shear strength under different dry densities, Figure 11 only presents the absolute growth rates for various clay contents and vertical stresses at a dry density of 1.70 g/cm3; while Figure 12 focuses on the absolute growth rates for different clay contents and dry densities within a low-stress interval of 5 kPa and a high-stress interval of 100 kPa. Under the same consolidation pressure, the absolute growth rate of shear strength increases with the increase in clay content. However, the absolute growth rate of shear strength varies with different levels of clay content, showing higher rates at lower stress sections and lower rates at higher stress sections. The strength of the soil site can be improved by adding clay content.

Strength growth rate with different clay contents at dry density equal to 1.70 g/cm3.

Strength growth rate with different dry densities: (a) Absolute growth rate of shear strength of soil sample at 5 kPa and (b) absolute growth rate of shear strength of soil sample at 100 kPa.
Under the same clay content, the absolute growth rate of shear strength increases with the increase in dry density in the low-stress section and decreases with the increase in dry density in the high-stress section. For the samples at 15% clay content, the absolute growth increases from 44 to 94%, while it decreases from 50 to 30%. Under the same increase in dry density, the shear strength increases more efficiently under low stress in comparison.
4 Mechanism analysis
The mechanical properties of silty sand with clay particles are different from those of pure sand and typical clay [6]. Gao GR [27] found in the study of soil spatial structure systems that silty soil or silt is a granular structure system, while cohesive soil is a sheet structure system. With the increase in clay content, silt with clay undergoes the transition process from “sand-like” to “clay-like,” and finally tends to clay [28,29], that is to say, its particle skeleton evolves from granular structure system to sheet structure system. With the process of clay increasing, the stress skeleton of silt with clay first depends on the sand particles in the soil sample, and then the effect of clay begins to appear and gradually increases.
Figure 13 shows the adjustment process of silt particles under the action of clay. With the increase in clay content, the adjustment process of particles in silty sand is mainly divided into two stages.

Adjustment of soil particles under the action of clay. (a) Sand like stage and (b) clay like stage.
The first stage is the “sand-like” stage, which belongs to the granular structure system. Some scientists have pointed out that sand with a clay content of less than 10% does not have the properties of cohesive soil. Currently, the “lubrication” between the sand particles plays a leading role, so that the silty sand with clay particles has a lower cohesion, which is consistent with the test results in Figure 9. According to Donald Wood Taylor [25], the shear strength of sand is composed of the shear resistance (friction component) provided by the sliding and rolling friction of particles and the shear resistance (shear expansion component) caused by the occlusion between particles. Under the action of low-stress, the sand presents the phenomenon of shear expansion, and under the action of high-stress, it presents the phenomenon of shear shrinkage (as shown in Figure 14). Under the action of horizontal shear with low vertical stress, the occlusal structure between particles is destroyed, and the particles on the shear plane cross the adjacent particles; under the action of high vertical stress, the sand is dense under the lower stress, and under the action of horizontal shear stress, the particles are staggered with each other, thus consuming more energy, which is shown as relatively large cohesion, which is similar to 5–10% clay in Figure 9. The results of large difference of cohesive force in high-and low-stress section under low amount of “sand-like” soil are consistent. To verify the rationality of the above analysis, the soil samples with different clay contents were tested by SEM, as shown in Figure 15. Under the clay content of 0–10%, the distribution form of clay is mainly filled with sand pores, and a small amount of clay adheres to the particle surface.

Pore water pressure–strain curve (a) under low-stress and (b) under high-stress.
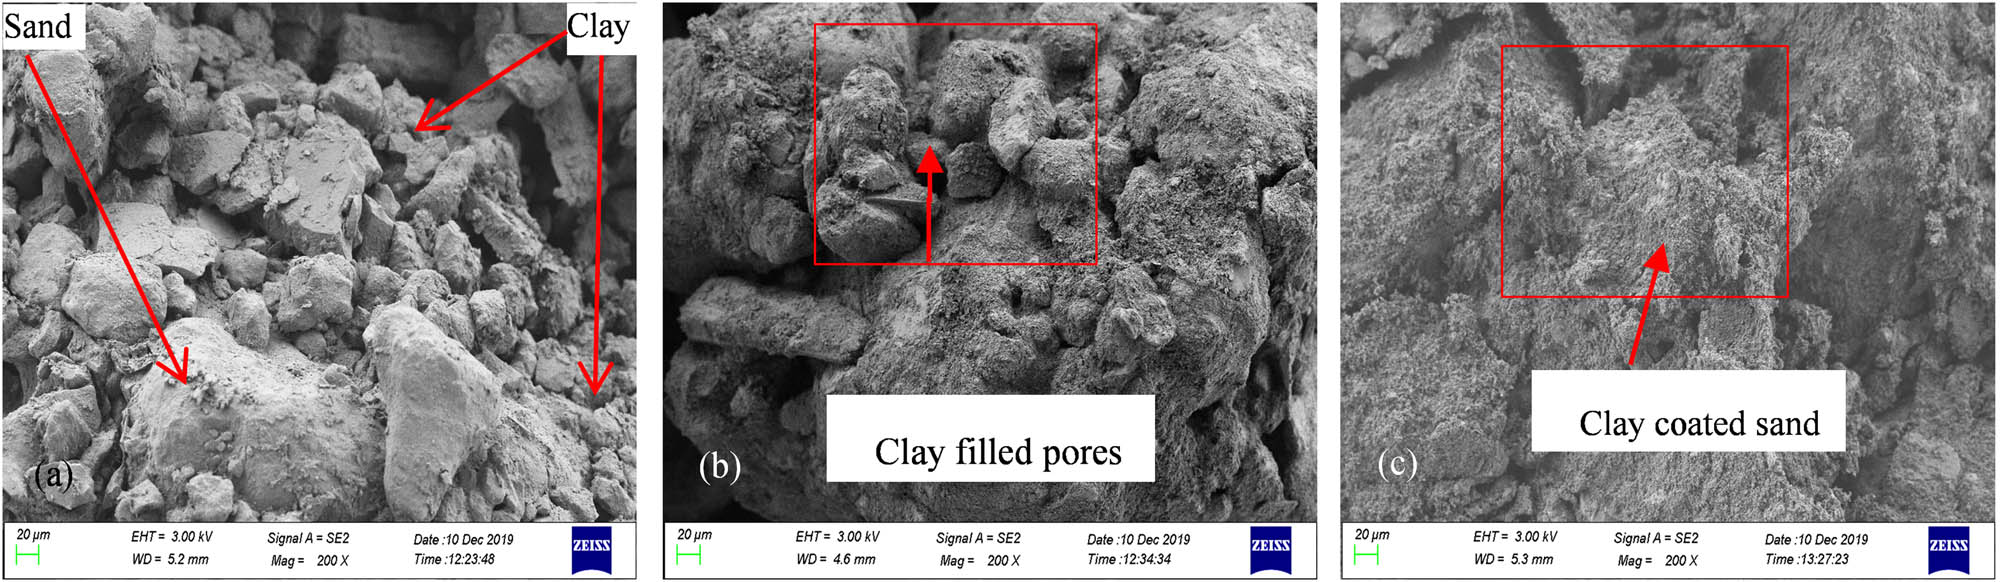
Microstructure of soil under the action of clay: (a) Clay content 0%, (b) clay content 10%, and (c) clay content 25%.
The second stage is the “clay-like” stage, which belongs to the flaky structure system for higher clay content. Lamb [27] divided the shear strength of cohesive soil into three basic components from the submicroscopic scale, i.e., cohesion component, dilatancy component, and friction component, in which cohesion component is provided by the shear resistance caused by adhesion or cementation between clay particles. With the increase in clay content, the clay particle begins to wrap the sand and act as a part of the stress skeleton of the soil. The soil properties transition from “sand-like” to “clay-like,” so the cohesive force gradually increases, which is consistent with the rule that when the clay content in Figure 8 is greater than 10%, the cohesive force value increases significantly. When the clay content is more than 10%, although “clay-like” also has the phenomenon of shear expansion and shear shrinkage (as shown in Figure 14), its shear action mechanism is different from “sand-like.” At this time, the clay wrapped on the surface of the sand plays a leading role in the shear process. Under the action of shear stress, the magnitude of shear expansion and shear contraction is smaller than that of “sand-like.” In addition, the cohesion of the soil sample is mainly caused by the short-range connection fracture of the solid clay. After the clay content is greater than 10%, with the increase in the clay content, the clay on the surface of the sand in the soil sample is distributed from scattered to scattered uniform distribution and development until the formation of “clay grid,” resulting in a small difference of cohesion c in the high- and low- stress sections when the clay content is 10–25% (“clay-like”) (Figure 9). Therefore, it can be inferred that when the clay fully covers the sand, the increase in the clay content will not cause the change in cohesion. For example, Yang et al. [25] found that the difference value of cohesion c between high- and low-stress sections was only 1.9 kPa in the shear strength test of expansive soil with 43.56% clay content, which also indirectly proved the above speculation. It can also be seen from Figure 14 that when the clay content is 25%, the clay adheres to the sand surface and wraps the sand, which is mutually verified with the adjustment process of soil particles in Figure 13.
5 Conclusion
Under the same consolidation stress condition, with the increase in clay content or dry density, the stress–strain curve shows a trend from strain softening type to hardening type.
According to the standard method, the shear strength of the low-stress section is not consistent with the actual results, so the low-stress condition must be included in the soil at the site strength test to obtain the true strength parameter values especially when the site soil is in a shallow failure state.
The increase in the strength of specimens is mainly due to the increase in cohesion and internal friction angle. With the increase in clay content, the cohesion increases in a bilinear (the inflection point is at 10% of the clay content). And the difference of cohesion in the high- and low-stress sections decreases gradually to almost the same value until 25% of the clay content.
When the dry density is the same, with the increase in clay content, the absolute growth rate of shear strength in the low-stress range is higher than that in the high-stress section.
When the content of clay particles is greater than 10%, the silty soil at the site experiences a transformation from “sand-like soil” to “clay-like soil,” and the skeleton under the force is transformed from sand particles, and surface clay particles to “clay-like grid,” with a significant increase in cohesion and shear strength.
Acknowledgements
This work was supported by the Open Research Fund of State Key Laboratory of Geomechanics and Geotechnical Engineering, Institute of Rock and Soil Mechanics, Chinese Academy of Sciences (No. SKLGME022027), the Basic Research Project of Henan Provincial Key Scientific Research Project (20ZX009), the Postgraduate Education Reform and Quality Improvement Project of Henan Province (YJS2022SZ16), the Scientific and Technological Project of Henan Province (222102320060) and National Natural Science Foundation of China (51509274).
-
Funding information: This work was supported by the Open Research Fund of State Key Laboratory of Geomechanics and Geotechnical Engineering, Institute of Rock and Soil Mechanics, Chinese Academy of Sciences (No. SKLGME022027), the Basic Research Project of Henan Provincial Key Scientific Research Project (20ZX009), the Postgraduate Education Reform and Quality Improvement Project of Henan Province (YJS2022SZ16), the Scientific and Technological Project of Henan Province (222102320060) and National Natural Science Foundation of China (51509274), the Henan Outstanding Youth Science Foundation (242300421153).
-
Author contributions: All authors contributed to the study conception and design. The first draft of the manuscript was written by Haibiao Xu, Xinming Li, Pengpeng Liu, Yin Song, Kebin Ren, and Yuzhou Sun. All authors read and approved the final manuscript.
-
Conflict of interest: The authors declare that they have no known competing financial interests or personal relationships that could have appeared to influence the work reported in this paper.
-
Data availability statement: All data, models, or codes generated or used during the study are available from the corresponding author by request. All data shown in the figures and tables can be provided on request.
References
[1] Ren KB, Wang B, Li XM, Yin S. Effect of dry-wet cycles on the mechanical properties of earthen archaeological site under low stresses. J Rock Mech. 2019;38(2):376–85.Suche in Google Scholar
[2] Zhang RX, Yuan Y, Li L, Dai QZ. Selection of soil parameters in embankment and its consolidation works in the lower yellow river. Yellow River. 2016;38(05):45–7 +67.Suche in Google Scholar
[3] Zhao LM, Yuan YQ, Li W. Experimental study on static character of the silty soil in the Yellow river flooded area. Sci Technol Eng. 2014;14(15):254–8.Suche in Google Scholar
[4] Vu QH, Pereira JM, Tang JM. Effect of clay content on the thermal conductivity of unfrozen and frozen sandy soils. Int J Heat Mass Transf. 2023;206:123923.10.1016/j.ijheatmasstransfer.2023.123923Suche in Google Scholar
[5] Heng CY, He MC, Qiu YH. Experimental study of liquefaction resistant characteristics of clayey sand. J Eng Geol. 2001;9(4):339–44.Suche in Google Scholar
[6] Papadopoulou AI, Tika TM. The effect of fines plasticity on monotonic undrained shear strength and liquefaction resistance of sands. Soil Dyn. 2016;88(9):191–206.10.1016/j.soildyn.2016.04.015Suche in Google Scholar
[7] Thevanayagam S, Mohan S. Intergranular state variables and stress-strain behaviour of silty sands. Geotechnique. 2000;50(1):1–23.10.1680/geot.2000.50.1.1Suche in Google Scholar
[8] Noorzad R, Shakeri M. Effect of silt on post-cyclic shear strength of sand. Soil Dyn. 2017;97(10):133–42.10.1016/j.soildyn.2017.03.013Suche in Google Scholar
[9] Xu LF, Wong KK, Fabbri A, Champire F, Branque D. Loading-unloading shear behavior of rammed earth upon varying clay content and relative humidity conditions. Soils Found. 2018;58(4):1001–15.10.1016/j.sandf.2018.05.005Suche in Google Scholar
[10] Kim U, Kim D, Zhuang L. Influence of fines content on the undrained cyclic shear strength of sand-clay mixtures. Soil Dyn. 2016;83(4):124–34.10.1016/j.soildyn.2016.01.015Suche in Google Scholar
[11] Lai J, Liu Y, Xiang YZ, Wang W, Xu JB, Cao B, et al. Experimental study on shear strength of saturated remolded loess. PLoS One. 2022;17(7):e0271266.10.1371/journal.pone.0271266Suche in Google Scholar PubMed PubMed Central
[12] Dafalla MA. Effects of clay and moisture content on direct shear tests for clay-sand mixtures. Adv Mater. 2012;2013:8.10.1155/2013/562726Suche in Google Scholar
[13] Iravanian A, Bilsel H. Tensile strength properties of sand-bentonite mixtures enhanced with cement. Procedia Eng. 2016;143(12):111–8.10.1016/j.proeng.2016.06.015Suche in Google Scholar
[14] Xiao J, Yang HP, Li HF, Tang XY. Shear strength test of Nanning expansive soil with different densities under low stress conditions. J Chin J Highw. 2013;26(6):15–21.Suche in Google Scholar
[15] Perry JA. Technique for defining non-linear shear strength envelopes and their incorporation in a slope stability method of analysis. Q J Eng Geo. 1994;27(3):231–41.10.1144/GSL.QJEGH.1994.027.P3.04Suche in Google Scholar
[16] Lade PV. The mechanics of surficial failure in soil slopes. Eng Geol. 2010;114(1/2):57–64.10.1016/j.enggeo.2010.04.003Suche in Google Scholar
[17] Farulla CA, Rosone M. Microstructure characteristics of unsaturated compacted scaly clay. In: Unsaturated Soils: Research and Applications. Berlin, Heidelberg: Springer; 2012. p. 123–30.10.1007/978-3-642-31116-1_16Suche in Google Scholar
[18] Yamamuro JA, Wood FM. Effect of depositional method on the undrained behavior and microstructure of sand with silt. Soil Dyn. 2004;24(9/10):751–60.10.1016/j.soildyn.2004.06.004Suche in Google Scholar
[19] Ahmed A. Compressive strength and microstructure of soft clay soil stabilized with recycled bassanite. Appl Clay Sci. 2015;104(104):27–35.10.1016/j.clay.2014.11.031Suche in Google Scholar
[20] National Cultural Heritage administration of the People’s Republic of China. Specifications of investigation for preservation engineering of earthen sites: WW/T 0040-2012. Beijing: Cultural Relics Publishing House.Suche in Google Scholar
[21] National Standard of the People’s Republic of China. Standard for soil test methods. GB/T 50123-1999.Suche in Google Scholar
[22] Jong ED, Acton DF, Stonehouse HB. Estimating the Atterberg limits of southern Saskatchewan soils from texture and carbon contents. Can J Soil Sci. 1990;70(4):543–54.10.4141/cjss90-057Suche in Google Scholar
[23] Constantinescu J, Constantinescu D. Particularity of plasticity characteristics of fine glacial materials (North Chicago Area). Geo-Eco-Marina. 2011;17:59–66.Suche in Google Scholar
[24] Ministry of Water Resources of the People’s Republic of China. Specification for geotechnical testing: SL237-1999. Beijing: China Water Conservancy and Hydropower Press.Suche in Google Scholar
[25] Yang HP, Wang XZ, Xiao J. Influence of wetting-drying cycles on strength characteristics of Nanning expansive soils. Chin J Geotech Eng. 2014;36(05):949–5.Suche in Google Scholar
[26] Gao GR. Neoteric soil geotechnology. Beijing: Science Press; 2013.Suche in Google Scholar
[27] Wang SY, Luna R, Zhao HH. Cyclic and post-cyclic shear behavior of low-plasticity silt with varying clay contents. Soil Dyn. 2015;75(8):112–20.10.1016/j.soildyn.2015.03.015Suche in Google Scholar
[28] Chang WJ, Hong ML. Effects of clay content on liquefaction characteristics of gap-graded clayey sands. Soils Found. 2008;48(1):101–14.10.3208/sandf.48.101Suche in Google Scholar
© 2024 the author(s), published by De Gruyter
This work is licensed under the Creative Commons Attribution 4.0 International License.
Artikel in diesem Heft
- Regular Articles
- Theoretical magnetotelluric response of stratiform earth consisting of alternative homogeneous and transitional layers
- The research of common drought indexes for the application to the drought monitoring in the region of Jin Sha river
- Evolutionary game analysis of government, businesses, and consumers in high-standard farmland low-carbon construction
- On the use of low-frequency passive seismic as a direct hydrocarbon indicator: A case study at Banyubang oil field, Indonesia
- Water transportation planning in connection with extreme weather conditions; case study – Port of Novi Sad, Serbia
- Zircon U–Pb ages of the Paleozoic volcaniclastic strata in the Junggar Basin, NW China
- Monitoring of mangrove forests vegetation based on optical versus microwave data: A case study western coast of Saudi Arabia
- Microfacies analysis of marine shale: A case study of the shales of the Wufeng–Longmaxi formation in the western Chongqing, Sichuan Basin, China
- Multisource remote sensing image fusion processing in plateau seismic region feature information extraction and application analysis – An example of the Menyuan Ms6.9 earthquake on January 8, 2022
- Identification of magnetic mineralogy and paleo-flow direction of the Miocene-quaternary volcanic products in the north of Lake Van, Eastern Turkey
- Impact of fully rotating steel casing bored pile on adjacent tunnels
- Adolescents’ consumption intentions toward leisure tourism in high-risk leisure environments in riverine areas
- Petrogenesis of Jurassic granitic rocks in South China Block: Implications for events related to subduction of Paleo-Pacific plate
- Differences in urban daytime and night block vitality based on mobile phone signaling data: A case study of Kunming’s urban district
- Random forest and artificial neural network-based tsunami forests classification using data fusion of Sentinel-2 and Airbus Vision-1 satellites: A case study of Garhi Chandan, Pakistan
- Integrated geophysical approach for detection and size-geometry characterization of a multiscale karst system in carbonate units, semiarid Brazil
- Spatial and temporal changes in ecosystem services value and analysis of driving factors in the Yangtze River Delta Region
- Deep fault sliding rates for Ka-Ping block of Xinjiang based on repeating earthquakes
- Improved deep learning segmentation of outdoor point clouds with different sampling strategies and using intensities
- Platform margin belt structure and sedimentation characteristics of Changxing Formation reefs on both sides of the Kaijiang-Liangping trough, eastern Sichuan Basin, China
- Enhancing attapulgite and cement-modified loess for effective landfill lining: A study on seepage prevention and Cu/Pb ion adsorption
- Flood risk assessment, a case study in an arid environment of Southeast Morocco
- Lower limits of physical properties and classification evaluation criteria of the tight reservoir in the Ahe Formation in the Dibei Area of the Kuqa depression
- Evaluation of Viaducts’ contribution to road network accessibility in the Yunnan–Guizhou area based on the node deletion method
- Permian tectonic switch of the southern Central Asian Orogenic Belt: Constraints from magmatism in the southern Alxa region, NW China
- Element geochemical differences in lower Cambrian black shales with hydrothermal sedimentation in the Yangtze block, South China
- Three-dimensional finite-memory quasi-Newton inversion of the magnetotelluric based on unstructured grids
- Obliquity-paced summer monsoon from the Shilou red clay section on the eastern Chinese Loess Plateau
- Classification and logging identification of reservoir space near the upper Ordovician pinch-out line in Tahe Oilfield
- Ultra-deep channel sand body target recognition method based on improved deep learning under UAV cluster
- New formula to determine flyrock distance on sedimentary rocks with low strength
- Assessing the ecological security of tourism in Northeast China
- Effective reservoir identification and sweet spot prediction in Chang 8 Member tight oil reservoirs in Huanjiang area, Ordos Basin
- Detecting heterogeneity of spatial accessibility to sports facilities for adolescents at fine scale: A case study in Changsha, China
- Effects of freeze–thaw cycles on soil nutrients by soft rock and sand remodeling
- Vibration prediction with a method based on the absorption property of blast-induced seismic waves: A case study
- A new look at the geodynamic development of the Ediacaran–early Cambrian forearc basalts of the Tannuola-Khamsara Island Arc (Central Asia, Russia): Conclusions from geological, geochemical, and Nd-isotope data
- Spatio-temporal analysis of the driving factors of urban land use expansion in China: A study of the Yangtze River Delta region
- Selection of Euler deconvolution solutions using the enhanced horizontal gradient and stable vertical differentiation
- Phase change of the Ordovician hydrocarbon in the Tarim Basin: A case study from the Halahatang–Shunbei area
- Using interpretative structure model and analytical network process for optimum site selection of airport locations in Delta Egypt
- Geochemistry of magnetite from Fe-skarn deposits along the central Loei Fold Belt, Thailand
- Functional typology of settlements in the Srem region, Serbia
- Hunger Games Search for the elucidation of gravity anomalies with application to geothermal energy investigations and volcanic activity studies
- Addressing incomplete tile phenomena in image tiling: Introducing the grid six-intersection model
- Evaluation and control model for resilience of water resource building system based on fuzzy comprehensive evaluation method and its application
- MIF and AHP methods for delineation of groundwater potential zones using remote sensing and GIS techniques in Tirunelveli, Tenkasi District, India
- New database for the estimation of dynamic coefficient of friction of snow
- Measuring urban growth dynamics: A study in Hue city, Vietnam
- Comparative models of support-vector machine, multilayer perceptron, and decision tree predication approaches for landslide susceptibility analysis
- Experimental study on the influence of clay content on the shear strength of silty soil and mechanism analysis
- Geosite assessment as a contribution to the sustainable development of Babušnica, Serbia
- Using fuzzy analytical hierarchy process for road transportation services management based on remote sensing and GIS technology
- Accumulation mechanism of multi-type unconventional oil and gas reservoirs in Northern China: Taking Hari Sag of the Yin’e Basin as an example
- TOC prediction of source rocks based on the convolutional neural network and logging curves – A case study of Pinghu Formation in Xihu Sag
- A method for fast detection of wind farms from remote sensing images using deep learning and geospatial analysis
- Spatial distribution and driving factors of karst rocky desertification in Southwest China based on GIS and geodetector
- Physicochemical and mineralogical composition studies of clays from Share and Tshonga areas, Northern Bida Basin, Nigeria: Implications for Geophagia
- Geochemical sedimentary records of eutrophication and environmental change in Chaohu Lake, East China
- Research progress of freeze–thaw rock using bibliometric analysis
- Mixed irrigation affects the composition and diversity of the soil bacterial community
- Examining the swelling potential of cohesive soils with high plasticity according to their index properties using GIS
- Geological genesis and identification of high-porosity and low-permeability sandstones in the Cretaceous Bashkirchik Formation, northern Tarim Basin
- Usability of PPGIS tools exemplified by geodiscussion – a tool for public participation in shaping public space
- Efficient development technology of Upper Paleozoic Lower Shihezi tight sandstone gas reservoir in northeastern Ordos Basin
- Assessment of soil resources of agricultural landscapes in Turkestan region of the Republic of Kazakhstan based on agrochemical indexes
- Evaluating the impact of DEM interpolation algorithms on relief index for soil resource management
- Petrogenetic relationship between plutonic and subvolcanic rocks in the Jurassic Shuikoushan complex, South China
- A novel workflow for shale lithology identification – A case study in the Gulong Depression, Songliao Basin, China
- Characteristics and main controlling factors of dolomite reservoirs in Fei-3 Member of Feixianguan Formation of Lower Triassic, Puguang area
- Impact of high-speed railway network on county-level accessibility and economic linkage in Jiangxi Province, China: A spatio-temporal data analysis
- Estimation model of wild fractional vegetation cover based on RGB vegetation index and its application
- Lithofacies, petrography, and geochemistry of the Lamphun oceanic plate stratigraphy: As a record of the subduction history of Paleo-Tethys in Chiang Mai-Chiang Rai Suture Zone of Thailand
- Structural features and tectonic activity of the Weihe Fault, central China
- Application of the wavelet transform and Hilbert–Huang transform in stratigraphic sequence division of Jurassic Shaximiao Formation in Southwest Sichuan Basin
- Structural detachment influences the shale gas preservation in the Wufeng-Longmaxi Formation, Northern Guizhou Province
- Distribution law of Chang 7 Member tight oil in the western Ordos Basin based on geological, logging and numerical simulation techniques
- Evaluation of alteration in the geothermal province west of Cappadocia, Türkiye: Mineralogical, petrographical, geochemical, and remote sensing data
- Numerical modeling of site response at large strains with simplified nonlinear models: Application to Lotung seismic array
- Quantitative characterization of granite failure intensity under dynamic disturbance from energy standpoint
- Characteristics of debris flow dynamics and prediction of the hazardous area in Bangou Village, Yanqing District, Beijing, China
- Rockfall mapping and susceptibility evaluation based on UAV high-resolution imagery and support vector machine method
- Statistical comparison analysis of different real-time kinematic methods for the development of photogrammetric products: CORS-RTK, CORS-RTK + PPK, RTK-DRTK2, and RTK + DRTK2 + GCP
- Hydrogeological mapping of fracture networks using earth observation data to improve rainfall–runoff modeling in arid mountains, Saudi Arabia
- Petrography and geochemistry of pegmatite and leucogranite of Ntega-Marangara area, Burundi, in relation to rare metal mineralisation
- Prediction of formation fracture pressure based on reinforcement learning and XGBoost
- Hazard zonation for potential earthquake-induced landslide in the eastern East Kunlun fault zone
- Monitoring water infiltration in multiple layers of sandstone coal mining model with cracks using ERT
- Study of the patterns of ice lake variation and the factors influencing these changes in the western Nyingchi area
- Productive conservation at the landslide prone area under the threat of rapid land cover changes
- Sedimentary processes and patterns in deposits corresponding to freshwater lake-facies of hyperpycnal flow – An experimental study based on flume depositional simulations
- Study on time-dependent injectability evaluation of mudstone considering the self-healing effect
- Detection of objects with diverse geometric shapes in GPR images using deep-learning methods
- Behavior of trace metals in sedimentary cores from marine and lacustrine environments in Algeria
- Spatiotemporal variation pattern and spatial coupling relationship between NDVI and LST in Mu Us Sandy Land
- Formation mechanism and oil-bearing properties of gravity flow sand body of Chang 63 sub-member of Yanchang Formation in Huaqing area, Ordos Basin
- Diagenesis of marine-continental transitional shale from the Upper Permian Longtan Formation in southern Sichuan Basin, China
- Vertical high-velocity structures and seismic activity in western Shandong Rise, China: Case study inspired by double-difference seismic tomography
- Spatial coupling relationship between metamorphic core complex and gold deposits: Constraints from geophysical electromagnetics
- Disparities in the geospatial allocation of public facilities from the perspective of living circles
- Research on spatial correlation structure of war heritage based on field theory. A case study of Jinzhai County, China
- Formation mechanisms of Qiaoba-Zhongdu Danxia landforms in southwestern Sichuan Province, China
- Magnetic data interpretation: Implication for structure and hydrocarbon potentiality at Delta Wadi Diit, Southeastern Egypt
- Deeply buried clastic rock diagenesis evolution mechanism of Dongdaohaizi sag in the center of Junggar fault basin, Northwest China
- Application of LS-RAPID to simulate the motion of two contrasting landslides triggered by earthquakes
- The new insight of tectonic setting in Sunda–Banda transition zone using tomography seismic. Case study: 7.1 M deep earthquake 29 August 2023
- The critical role of c and φ in ensuring stability: A study on rockfill dams
- Evidence of late quaternary activity of the Weining-Shuicheng Fault in Guizhou, China
- Extreme hydroclimatic events and response of vegetation in the eastern QTP since 10 ka
- Spatial–temporal effect of sea–land gradient on landscape pattern and ecological risk in the coastal zone: A case study of Dalian City
- Study on the influence mechanism of land use on carbon storage under multiple scenarios: A case study of Wenzhou
- A new method for identifying reservoir fluid properties based on well logging data: A case study from PL block of Bohai Bay Basin, North China
- Comparison between thermal models across the Middle Magdalena Valley, Eastern Cordillera, and Eastern Llanos basins in Colombia
- Mineralogical and elemental analysis of Kazakh coals from three mines: Preliminary insights from mode of occurrence to environmental impacts
- Chlorite-induced porosity evolution in multi-source tight sandstone reservoirs: A case study of the Shaximiao Formation in western Sichuan Basin
- Predicting stability factors for rotational failures in earth slopes and embankments using artificial intelligence techniques
- Origin of Late Cretaceous A-type granitoids in South China: Response to the rollback and retreat of the Paleo-Pacific plate
- Modification of dolomitization on reservoir spaces in reef–shoal complex: A case study of Permian Changxing Formation, Sichuan Basin, SW China
- Geological characteristics of the Daduhe gold belt, western Sichuan, China: Implications for exploration
- Rock physics model for deep coal-bed methane reservoir based on equivalent medium theory: A case study of Carboniferous-Permian in Eastern Ordos Basin
- Enhancing the total-field magnetic anomaly using the normalized source strength
- Shear wave velocity profiling of Riyadh City, Saudi Arabia, utilizing the multi-channel analysis of surface waves method
- Effect of coal facies on pore structure heterogeneity of coal measures: Quantitative characterization and comparative study
- Inversion method of organic matter content of different types of soils in black soil area based on hyperspectral indices
- Detection of seepage zones in artificial levees: A case study at the Körös River, Hungary
- Tight sandstone fluid detection technology based on multi-wave seismic data
- Characteristics and control techniques of soft rock tunnel lining cracks in high geo-stress environments: Case study of Wushaoling tunnel group
- Influence of pore structure characteristics on the Permian Shan-1 reservoir in Longdong, Southwest Ordos Basin, China
- Study on sedimentary model of Shanxi Formation – Lower Shihezi Formation in Da 17 well area of Daniudi gas field, Ordos Basin
- Multi-scenario territorial spatial simulation and dynamic changes: A case study of Jilin Province in China from 1985 to 2030
- Review Articles
- Major ascidian species with negative impacts on bivalve aquaculture: Current knowledge and future research aims
- Prediction and assessment of meteorological drought in southwest China using long short-term memory model
- Communication
- Essential questions in earth and geosciences according to large language models
- Erratum
- Erratum to “Random forest and artificial neural network-based tsunami forests classification using data fusion of Sentinel-2 and Airbus Vision-1 satellites: A case study of Garhi Chandan, Pakistan”
- Special Issue: Natural Resources and Environmental Risks: Towards a Sustainable Future - Part I
- Spatial-temporal and trend analysis of traffic accidents in AP Vojvodina (North Serbia)
- Exploring environmental awareness, knowledge, and safety: A comparative study among students in Montenegro and North Macedonia
- Determinants influencing tourists’ willingness to visit Türkiye – Impact of earthquake hazards on Serbian visitors’ preferences
- Application of remote sensing in monitoring land degradation: A case study of Stanari municipality (Bosnia and Herzegovina)
- Optimizing agricultural land use: A GIS-based assessment of suitability in the Sana River Basin, Bosnia and Herzegovina
- Assessing risk-prone areas in the Kratovska Reka catchment (North Macedonia) by integrating advanced geospatial analytics and flash flood potential index
- Analysis of the intensity of erosive processes and state of vegetation cover in the zone of influence of the Kolubara Mining Basin
- GIS-based spatial modeling of landslide susceptibility using BWM-LSI: A case study – city of Smederevo (Serbia)
- Geospatial modeling of wildfire susceptibility on a national scale in Montenegro: A comparative evaluation of F-AHP and FR methodologies
- Geosite assessment as the first step for the development of canyoning activities in North Montenegro
- Urban geoheritage and degradation risk assessment of the Sokograd fortress (Sokobanja, Eastern Serbia)
- Multi-hazard modeling of erosion and landslide susceptibility at the national scale in the example of North Macedonia
- Understanding seismic hazard resilience in Montenegro: A qualitative analysis of community preparedness and response capabilities
- Forest soil CO2 emission in Quercus robur level II monitoring site
- Characterization of glomalin proteins in soil: A potential indicator of erosion intensity
- Power of Terroir: Case study of Grašac at the Fruška Gora wine region (North Serbia)
- Special Issue: Geospatial and Environmental Dynamics - Part I
- Qualitative insights into cultural heritage protection in Serbia: Addressing legal and institutional gaps for disaster risk resilience