Obliquity-paced summer monsoon from the Shilou red clay section on the eastern Chinese Loess Plateau
-
Silu Xu


Abstract
The red clay of the Chinese Loess Plateau (CLP) is an important geological archive for understanding the variability in the late Neogene East Asian monsoon. The periodicity of the summer monsoon of the red clay on the eastern CLP is dominated by eccentricity cycles within the constraints of the palaeomagnetic chronological framework, whereas global climate change characteristics represented by the deep-sea oxygen isotope record at that time show a dominating obliquity cycle. Here, we analyzed the East Asian summer monsoon proxies from the Shilou red clay section with the cyclostratigraphy method. The results show that the summer monsoon variation was dominated by obliquity, the optimum deposition rate was 4.451 cm/kyr, and the floating age of the Shilou red clay section was ca. 1.7 Ma. The late Neogene East Asian summer monsoon inferred from the eastern CLP was thus paced by the obliquity cycle, which is consistent with global change.
1 Introduction
The Quaternary loess-paleosol and the late Neogene red clay across the Chinese Loess Plateau (CLP) are crucial geological archives for understanding monsoon variability in East Asia and aridification processes in the Asian inland [1,2,3,4]. Lu et al. [5] summarized studies on Chinese loess and late Neogene red clays, which have significantly enhanced our comprehension of alterations in Asian climate and their driving mechanisms. Precise dating of loess and red clay is essential for discussing these geological processes. Due to the inadequacy of radiometric dating material, magnetostratigraphy has become the principal technique for establishing age models of loess and red clay [2,3,6,7]. Magnetic stratigraphic dating studies rely on comparing the palaeomagnetic polarity zones of sediments with standard magnetic polarity scales. However, this method is often prone to bias as it is not always a one-to-one correspondence. Three distinct interpretations of the chronology of magnetic stratigraphy in the Shilou red clay section on the eastern CLP have been identified as follows: (1) relying purely on a comparison between the palaeomagnetic polarity zones of the profile and the standard magnetic polarity scale, Xu et al. [8] demonstrated that the bottom age of the profile can be dated up to 11 Ma, with an average deposition rate for red clay of ∼0.8 cm/kyr. (2) Anwar et al. [9] identified a series of abnormal polarity intervals with the data from Xu et al. [8]. Subsequently, Anwar et al. [9] investigated the age of the Shilou profile using paleomagnetic data with cyclostratigraphic analysis and provided an age of 5.2 Ma for the Shilou profile, with an average deposition rate for red clay of ∼2.5 cm/kyr. (3) The magnetostratigraphy of a newly discovered red clay section in this area (∼1 km from the section in Xu et al. [8]) suggests a bottom age of 8 Ma, with an average deposition rate for red clay of ∼2.5 cm/kyr [10,11]. The interpretation of the paleomagnetic signals of the Shilou red clay section displays a broad range of possibilities in contrast to the standard magnetic polarity scale, which led to a deviation in the sedimentation rates of the profile. These significant changes in chrono-stratigraphic interpretations can affect interpretations of climate change mechanisms.
Deep-sea oxygen isotope records indicate that obliquity cycles dominated the global climate record before the mid-Pleistocene climate transition [12]. Ao et al. [11] established the age of the Shilou red clay section through magnetostratigraphy and analyzed the summer monsoon proxies (Rb/Sr, Al/Na, and lightness). They revealed that the dominant cycle in the red clay was the eccentricity cycle. Anwar et al. [9] established the age of the Shilou red clay section through magnetostratigraphy and cyclostratigraphy. They analyzed the summer monsoon proxies (magnetic susceptibility) and the winter monsoon proxies (grain size), showing that the red clay exhibited a pronounced eccentricity cycle and a high amplitude 200 kyr period, which was considered to be a harmonic at 95 and 125 kyr. Laskar et al. [13] reported a modulation period of 173 kyr for the obliquity cycle; therefore, the period of 200 kyr could be the obliquity cycle. If this is the case, the climate change cycle of the late Neogene red clay record of the CLP may be consistent with that of the deep-sea oxygen isotopes record, which is worthy of further study.
Cyclostratigraphy is a methodology that modulates cyclic variations in the stratigraphic record with the periodicity of Earth’s orbit. Moreover, it is capable of establishing a continuous and high-precision astronomical time scale using the rhythms recorded in strata. The time scale optimization (TimeOpt) inversion method, which has been recently developed, can be utilized for the construction of a dependable test of astronomical hypotheses by merging multiple attributes of the astronomical signal [14,15,16,17,18]. TimeOpt is capable of assessing the dominant cycle and optimal deposition rate in the stratigraphic record through eccentricity and obliquity driving, respectively [16]. Combined with astronomical tuning, the floating age of geological events or processes can be further estimated.
Due to debate surrounding the interpretation of the magnetostratigraphic age of the Shilou red clay and variations between the dominant climatic cycle based on a palaeomagnetic framework and the deep-sea oxygen isotope records, the TimeOpt method can effectively address both of these issues. Therefore, we applied this method to analyze the climate records of the Shilou red clay section, aiming to determine the dominant climatic cycle and create a floating astronomical time scale. This study examines the floating age and climatic cycle of the red clay with cyclostratigraphy from an independent viewpoint.
2 Geological setting and materials
The Shilou red clay section is located ∼15 km northwest of Shilou County, Shanxi Province, and it is on the eastern boundary of the CLP, bounded by the Lüliang Mountains to the east and the Yellow River to the west [9] (Figure 1a). The reddish-red clay is accompanied by calcareous nodules, which are more weathered than the Quaternary loess. The red clay grain size shows a tri-peak or multi-peak distribution, with peaks at 1–2, 10, and 100 μm, respectively. The lithological distinction between the upper and lower sections of the Shilou profile is clearly expressed. The lower red clay is over 40 m thick and displays alternating light red and brown paleosols, which are rich in carbonate binding. They show 5R 3/4 and 10R 5/4 Munsell colors, respectively. The upper section is more than 20 m thick and contains developed ferromanganese colluvium and clay-grain colluvium, 5R 2/2 Munsell color, darker in color than the lower red clay, and has only a few thin (0.2–0.4 m) carbonate nodule layers (Figure 1b). For a more detailed description of the profiles, refer to Ao et al. [11].
![Figure 1
Geographic location of the Shilou profile, lithological histograms, and climate proxy data for red clay from the (CLP). (a) Overview map of the study area. Dashed contour shows the extent of the Loess Plateau in China. Red pentagram shows the geographic location of the Shilou profile; (b) stratigraphic feature; (c) Rb/S, (d) Al/Na, and (e) lightness from the article by Ao et al. [11].](/document/doi/10.1515/geo-2022-0616/asset/graphic/j_geo-2022-0616_fig_001.jpg)
Geographic location of the Shilou profile, lithological histograms, and climate proxy data for red clay from the (CLP). (a) Overview map of the study area. Dashed contour shows the extent of the Loess Plateau in China. Red pentagram shows the geographic location of the Shilou profile; (b) stratigraphic feature; (c) Rb/S, (d) Al/Na, and (e) lightness from the article by Ao et al. [11].
Ao et al. [11] collected 3,527 fresh samples at 2-cm intervals. Many studies have used Al/Na, Rb/Sr, and lightness as proxies for summer monsoon precipitation in Quaternary loess and underlying Neogene red clay on the CLP [19,20,21,22,23,24]. Increased precipitation enhances weathering on the Loess Plateau, resulting in a significant decrease in soluble Na and Sr but an increase in insoluble Al and Rb, which contribute to heightened Al/Na and Rb/Sr ratios [19,20,24]. Increased precipitation induces the enrichment of darker minerals (fine-grained magnetite, clay minerals, and organic matter) and the leaching of lighter-colored carbonates, which leads to more saturated red soil coloration and a lower lightness [21,23]. Buggle et al. [25] summarized the evaluation of geochemical weathering indicators in loess-paleosol research. However, the Neogene was warm and humid, resulting in more intense pedogenesis and darker soil coloring compared to the overlying Quaternary loess-paleosol sequence. Therefore, Al/Na, Rb/Sr, and lightness variations predominantly reflect post-depositional pedogenesis, with only minor pre-depositional pedogenic effects affected by dust sources. The Neogene red clays reflect dust transport similar to that of the Quaternary loess. This is mainly due to the northwesterly migration of the winter monsoon from the arid area to the west and north. Dust accumulation rate changes have unlikely had an impact on the substantial changes in CLP wind-formed deposition. The S1, S2, S3, and S4 CLP paleosoils exhibited varying rates of accumulation, but they all displayed a similar increase in pedogenic magnetic material. This indicates that they have had relatively consistent monsoon precipitation [22,26]. Thus, the Al/Na, Rb/Sr, and lightness of the Neogene red clay and the Quaternary loess-paleosol sequences are often employed as proxies for summer monsoon precipitation. The strong correlation between these proxies and precipitation has been extensively documented in various studies [21,22,23]. Ao et al. [11] provide high-resolution Al/Na, Rb/Sr, and lightness data for the Shilou red clay section (Figure 1c and d).
3 Methods
Previous research has indicated that the Shilou red clay section possesses distinctive and unparalleled stratigraphic cycles, developing distinct strong (red or dark red) and weak (light red) paleosol cycles, which can be easily observed in the field and are reportedly regulated by cyclical variations in Earth’s orbit [9,11]. The stratigraphic cycles of the Shilou red clay section are therefore highly appropriate for cyclostratigraphic analyses.
3.1 TimeOpt
TimeOpt initially computed deposition rates and dominant periods by analyzing the amplitude of the precession, eccentricity, and frequency modulation. The reliability of the orbital forcing and dominant period were tested against the null hypothesis. However, recent extensions have enabled TimeOpt analyses utilizing the amplitude and frequency of obliquity and its modulation periods [16]. TimeOpt analysis involves three primary stages. Foremost, the amplitude modulation (amplitude envelope) and spectral power are evaluated separately. Second, these outcomes are combined. Finally, the Monte Carlo simulation establishes the statistical significance of the best-fit results. Previous research has reported that the Shilou profile exhibits distinguishable sedimentary cycles [9,11]. In this study, TimeOpt was used to assess the dominating cycle and optimal deposition rate in the stratigraphic record through eccentricity and obliquity driving, respectively [16]. Laskar et al. [13] reported that the dominant period of the obliquity is 41 kyr, containing 54, 39, 29, and 28 kyr. The modulation periods of obliquity are mainly dictated by 172.4, 150.2, and 98 kyr. The precession period spans 23.6, 22.3, 19, and 18.9 kyr. The eccentricity period, also known as the modulation period of the precession, is 405.6, 130.7, 123.8, 98.8, and 94.8 kyr.
TimeOpt analysis was implemented using the “timeopt” and “timeOptSim” functions in the “astrochron” package of R. For TimeOpt analyses dominated by the obliquity period, the filter range was set to 1/70–1/25 cycles/kyr. For TimeOpt analyses dominated by the eccentricity and precession period, the filter range was set to 0.035–0.065 cycles/kyr. The deposition rate range was set as 0.5–5 cm/kyr, encompassing the range of sedimentation rates from previous studies on the Shilou red clay section. Here, 100 evenly spaced deposition rates were designated, and 2,000 Monte Carlo simulations were performed.
3.2 Spectral analysis in the depth domain
Spectral analysis of stratigraphic data sequences constitutes a pivotal stage in cyclostratigraphic research. Spectral analysis is based on the principle of transforming signals in a sequence from either the depth or time domain into frequency domain signals [27]. The relationship between the ratio of the sedimentary cyclic signals identified in the depth domain and the ratio of the period of Earth’s orbital parameter can be used to obtain a preliminary judgment on whether Milankovitch signals are recorded in the study profile [28,29]. The evolutive harmonic analysis (EHA) method evaluates the variation in the depositional rates for dominant cycles in the time or depth domain of stratigraphic data [30]. The technique performs spectral analysis on a moving window of data to obtain a dynamic spectral structure that varies with time or depth. This study utilized the “noLow” for detrending raw data, “trim” for removing extreme values, and the “mtm” and “eha” functions for conducting multi-taper method (MTM) spectral analysis and EHA analysis within the “astrochron” package of R. The depth-domain MTM analysis of the data series was configured with a confidence level of 90%.
3.3 Filtering and tuning
Stratigraphic deposition sequences frequently feature multiple superpositions of cyclic signals and contain environmental noise. However, studies usually need to extract the frequency signal of a single track; therefore, filtering methods are used to separate the signal from noise. Using the frequency range obtained from the previous spectral analysis, the cyclic signal was extracted from the original depth domain signal through filtering. Astronomical tuning was then used to establish the correlation between the separated cyclic signals and astronomical signals. First, the cyclic signal was extracted through Gaussian band-pass filtering. Second, depth domain periodic signals were assigned to theoretical orbital periodic signals. Finally, the depth domain was converted to the time domain to achieve astronomical tuning. Both filtering and tuning were implemented in MATLAB using the Acycle software [14].
4 Results
4.1 TimeOpt of Al/Na, Rb/Sr, and lightness of the Shilou red clay section
Distinguishable sedimentary cycles are observed in the Shilou section, which have been linked to Milankovitch cycles in previous studies [9,11], with specific cycles of 405, 100, and 41 kyr. Both 405 and 100 kyr are eccentricity cycles. However, if the profile cycle is mainly influenced by the obliquity cycle (i.e., the 405 kyr cycle analyzed in previous studies corresponds to a 173 kyr obliquity cycle), then the specific cycles would be 173, 41, and 17 kyr based on the prior ratios between cycles. Here, 173 and 41 kyr are obliquity cycles, and 17 kyr is close to the precession cycles. TimeOpt analyses and null hypothesis testing were carried out in this study to examine climate change across all indicators. Table 1 lists the results of the TimeOpt calculations and null hypothesis testing for different climate indicators and different climate-driven cycles.
TimeOpt analysis for different dominant periods of Al/Na, Rb/Sr and lightness
| Dominant periods | ρ value | Optimal deposition rates (cm/kyr) | ||||
|---|---|---|---|---|---|---|
| Al/Na | Rb/Sr | Lightness | Al/Na | Rb/Sr | Lightness | |
| Obliquity | 0.998 | 0.022 | 0.536 | 4.556 | 4.451 | 4.556 |
| Precession and eccentricity | 0.992 | 0.862 | 0.986 | 3.068 | 3.527 | 3.214 |
The ρ value means probability of running 2,000 Monte Carlo simulations with no astronomical assumptions; optimal deposition rate is calculated by TimeOpt analysis; dominant periods including obliquity, precession, and eccentricity.
In the obliquity period dominant mode, the TimeOpt analyses for Al/Na, Rb/Sr, and lightness were used in 2,000 Monte Carlo simulations with ρ values 0.998, 0.022, and 0.536, respectively. Although the optimal sedimentation rates were all in the range of 4.4–4.5 cm/kyr and the associated floating astronomical ages were between 1.68 and 1.72 Ma, only the ρ value for Rb/Sr was lower than 0.05. This indicates that the null hypothesis was rejected at a confidence level exceeding 95%. The summer monsoon variation reflected in Rb/Sr was driven by the obliquity cycle. In the model dominated by precession and eccentricity, the optimal deposition rates were all in the range of 3.0–3.5 cm/kyr, corresponding to floating astronomical ages of 2.17–2.5 Ma, but the ρ values were generally higher than 0.86, which failed the null hypothesis testing.
4.2 Dominating obliquity cycle of the Rb/Sr data in the Shilou red clay section
Figure 2 illustrates the specific results of the TimeOpt calculations for the Rb/Sr variation in the Shilou red clay section in the obliquity-driven mode. Figure 2a shows the Rb/Sr variation in the depth domain. Figure 2b depicts the obliquity signals and obliquity amplitude envelopes extracted from the Rb/Sr data for the Shilou red clay section through obliquity filtering and the Hilbert transform. The amplitude envelope fit (
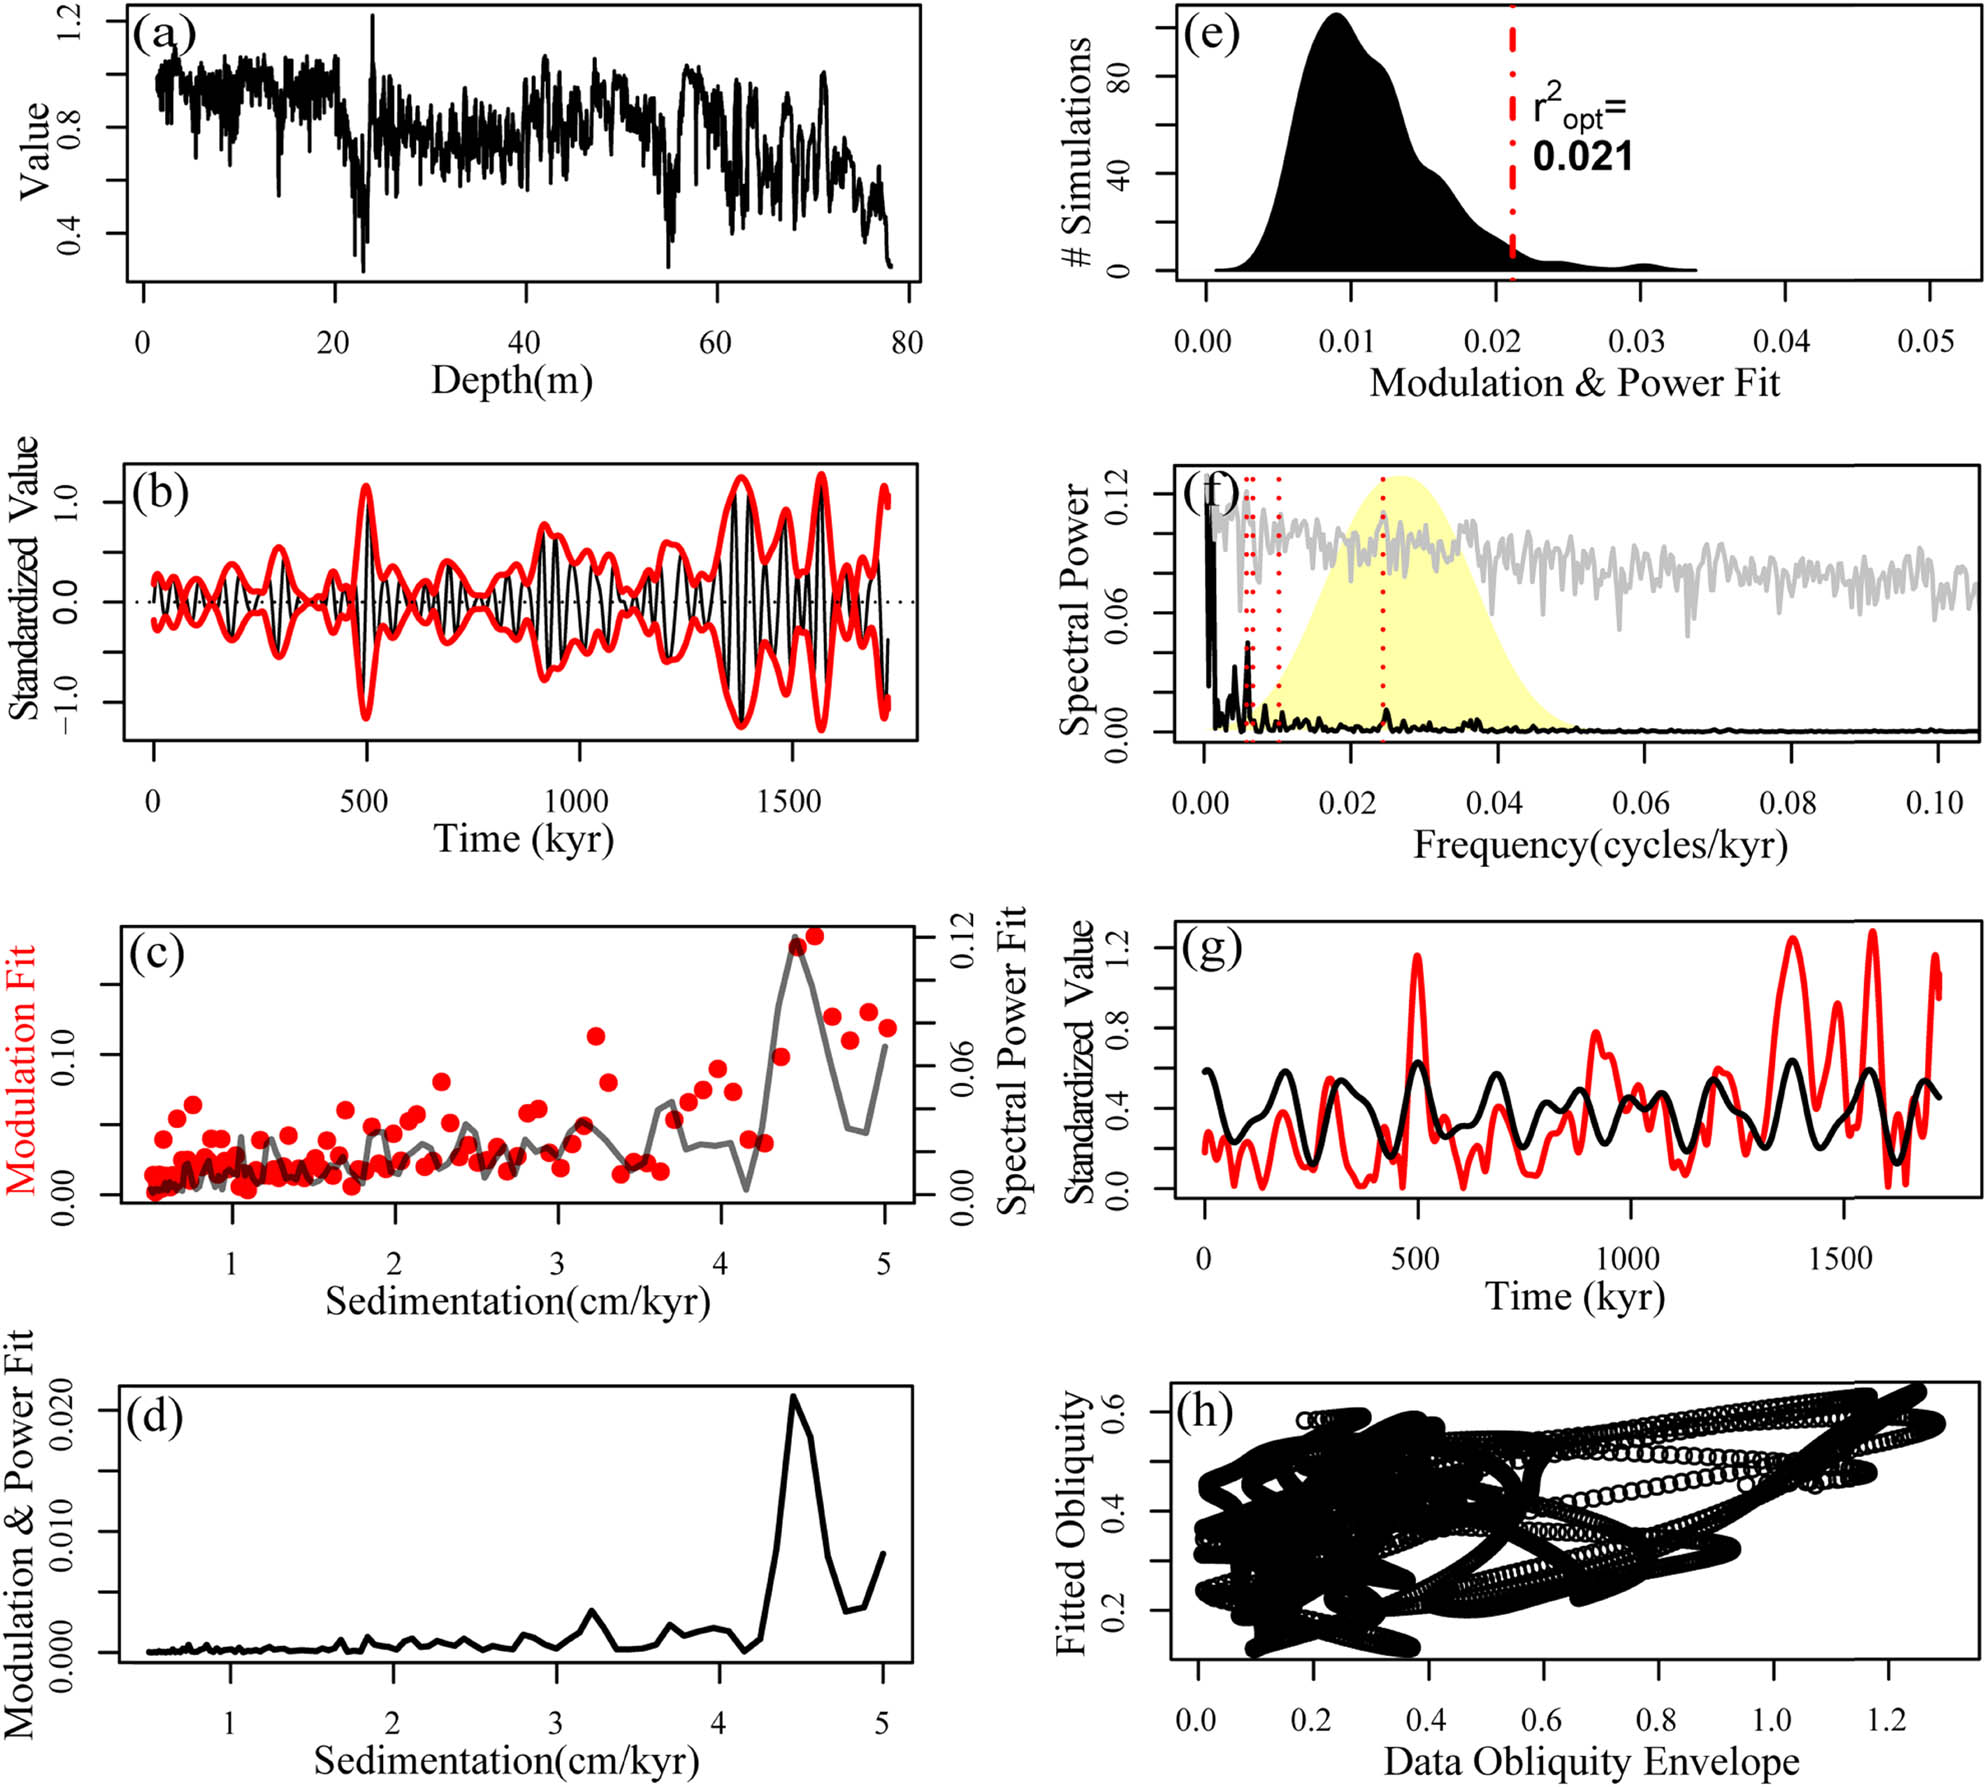
TimeOpt analysis of the Rb/Sr data of the Shilou red clay section. (a) Rb/Sr data; (b) the precession signal (black line) and its amplitude envelope (red line) vary with time; (c) correlation between
In conclusion, TimeOpt analyses of the Rb/Sr data from the Shilou red clay section indicate that the optimum sedimentation rate for the section is 4.451 cm/kyr and the stratigraphic cycle is dominated by the obliquity cycle.
4.3 Astronomical tuning of Rb/Sr in the Shilou red clay section
The spectral analysis in the depth domain on the Rb/Sr data from the Shilou red clay section revealed that the stratigraphy had five significant cyclic signals, confidently exceeding 90% (Figure 3a). These signals corresponded to 7.67, 4.26, 1.81, 1.66, and 1.21 m, respectively. TimeOpt analysis indicated an optimal sedimentation rate of 4.451 cm/kyr for the profile. This finding revealed that the cyclic signal of 7.67 m corresponds to 173 kyr. The ratio of the above sedimentary cyclic signals is 173:96:41:37:27, where the cyclic signals represented by 173 (7.67 m), 96 (4.26 m), 41 (1.81 m), 37 (1.66 m), and 27 (1.21 m) were closer to the cyclic signals of the 172.4, 98, 41, 39, and 28 kyr obliquity. For the signal represented by 96 (4.26 m) and 27 (1.21 m), an alternative interpretation is that they are in closer proximity to a short eccentricity cycle and precession cycle, respectively. According to the depth domain spectral analysis, a perfect match could be found between the ratio of stratigraphic cycles and that of obliquity and its modulation cycles. Therefore, the variation in the summer monsoon represented by the Rb/Sr of the Shilou red clay section was driven by the obliquity cycle.

Cyclostratigraphy of Rb/Sr data of the Shilou red clay section. (a) MTM power spectrum from 0 cycles/m to 1 cycles/m; (b) EHA amplitude results using five 3π tapers and a 15 m moving window; (c) the detrended Rb/Sr data; (d) 173 kyr filtering results for Rb/Sr depth domain sequences; (e) sedimentation rate; and (f) duration of the profile after tuning.
EHA analysis indicated that the stratigraphic cycles of the 7.67 m depth domain Rb/Sr data for the Shilou red clay section, which corresponds to the 173 kyr obliquity, remained stable across the section (Figure 3b). Figure 3c shows the detrended Rb/Sr data. The 7.67-m cycle signals were extracted by a Gaussian band-pass filter at 0.13 ± 0.0125 cycles/m. The filtering results showed that a total of 10 complete 173 kyr obliquity cycles were recorded based on the Rb/Sr data from the Shilou red clay section (Figure 3d). The ca. 173 kyr obliquity cycle is present in numerous records from the Mesozoic and Cenozoic eras; thus, the ca. 173 kyr cycle could serve as a “Geological Timekeeper” [31,32,33]. By assigning a time scale of 173 kyr to each sedimentary cycle, the sedimentation rate of the Shilou red clay section ranged from 4.41 to 4.54 cm/kyr, with an average sedimentation rate of 4.447 cm/kyr (Figure 3e). The floating age of the Shilou red clay section was ∼1.7 Ma (Figure 3f), which is consistent with the results calculated by the TimeOpt analysis.
5 Discussion
Huang et al. [34] compiled a high-resolution dataset of total organic carbon and stable carbon isotopes in mid-to-high latitude regions, finding a robust periodicity of 173 kyr. This phenomenon could potentially be caused by the amplification of the forcing signal associated with the ca. 173 kyr obliquity modulation. This is further influenced by the internal climate feedback of the carbon cycle under varying geographical and climatic conditions, which controls a multitude of sensitive climate processes. In the northwestern Loess Plateau, with a relatively arid climate, three distinct paleosol horizons are well preserved within the fossil pedo-complex S1 of the loess. The development of these paleosol horizons is associated with the precession cycle.
However, in the humid central and southern regions of the Loess Plateau, the interlayer between the three paleosol horizons became indistinct due to the subsequent leaching and sedimentation of the well-developed soil, resulting in the three paleosol horizons fusing into a single horizon. In a humid climate with strong pedogenesis, S1 is the result of multiple soil horizon formation events, with paleosol intervening in the underlying older loess. This condition is likely to have been more severe during the formation of the well-developed red clay. Consequently, the 41 kyr modulation cycle would have had greater significance, showing a robust 173 kyr cycle.
Anwar et al. [9] observed a high-amplitude (170–200 kyr) cycle between the 405 kyr long eccentricity and the 100 kyr short eccentricity in the magnetic susceptibility record of the Shilou red clay section. They suggest that this cycle may be a harmonic of the 95 and 125 kyr cycles. Our results suggest that this could be the 173-kyr obliquity cycle.
During the relatively arid Quaternary, evidence from pollen assemblages and loess-paleosols suggests that the northern boundary of summer monsoon precipitation in the Loess Plateau may have retreated to the southernmost part of the CLP during periods of dry and cold climates. During the warmer climate, the northern boundary of summer monsoon precipitation extended well beyond the CLP [4]. Oscillatory changes in the intensity of the summer monsoon described by the loess-paleosol alternation essentially reflect changes in the movement of monsoon precipitation fronts to higher and lower latitudes. Davis and Brewer [35] showed that the summer solar radiation difference at 60–30°N exhibits a significant 41 kyr cycle. Thus, the migration of the monsoon precipitation zone due to changes in the solar radiation difference between high and low latitudes may be the main reason for the obliquity cycle of Rb/Sr. Stronger soil development may have allowed multiple soil horizons to leach and deposit into a single horizon, which made the 41-kyr modulation cycle more significant, showing a robust 173-kyr cycle.
The results of Ao et al. [11] indicate that the climate of the Shilou red clay section exhibits a distinct eccentricity cycle with a time span of 4.7 Myr. The ratio of the 405 kyr eccentricity cycle to the 173 kyr obliquity cycle is 2.34. If converted according to this ratio, the time span of 4.7 Myr corresponds to (4.7/2.34≈) 2 Myr, which is relatively close to 1.7 Ma in this study. Combining the sedimentary age of 3.4 Ma at the top of the Shilou profile from Ao et al. [11], the lower boundary age of the Shilou red clay section can be calculated as 5.1 Ma, which is relatively consistent with the profile age from Anwar et al. [9]. and Zhang et al. [36] provide a detailed explanation of the paleomagnetism of the Shilou red clay section; therefore, it will not be significantly discussed here.
The TimeOpt analysis of Rb/Sr indicates that the climatic cycles in the Shilou red clay section are driven by obliquity and have passed the null hypothesis testing. Other indicators, dominated by obliquity and eccentricity cycles, did not pass the null hypothesis testing in the TimeOpt calculation. The failure to pass the null hypothesis testing may be due to issues with the indicators themselves, or it could be that the cyclic modulation relationship has not been preserved or has been disrupted, which requires further research. The obliquity-driven Rb/Sr provides at least a new possibility and perspective for the study of climatic cycles and chronology in the Shilou red clay section.
6 Conclusions
According to the TimeOpt method, the Al/Na, Rb/Sr, and lightness of the Shilou red clay section were examined using the eccentricity cycle mode and obliquity cycle mode. Only the cyclostratigraphic study of Rb/Sr obliquity passed the null hypothesis testing. The obliquity cycle was identified as the dominant cycle following the Rb/Sr cycle analysis of the Shilou red clay section.
Based on obliquity as the dominant cycle, the floating astronomical time scale of the Shilou red clay section, representing the changes in the East Asian summer monsoon, was established through cyclostratigraphy methods as ca. 1.7 Ma, with an average sedimentation rate of 4.451 cm/kyr.
Acknowledgements
This work was supported by the National Science Foundation of China (grant 42130507, 41602190), the Special Project of Fujian Public Welfare Research Institute (2019R1002-5), and Project of Innovation Team of Fujian Normal University (IRTL1705). We would like to thank Editage (www.editage.cn) for English language editing.
-
Author contributions: Silu Xu: performed the data analysis and wrote the manuscript. Jiasheng Chen: contributed to the conception of the study and revision of the manuscript.
-
Conflict of interest: Authors state no conflict of interest.
-
Data availability statement: Data openly available in a public repository, we use public data from the article by Ao et al. [11].
References
[1] An ZS. The history and variability of the East Asian paleomonsoon climate. Quat Sci Rev. 2000;19(1–5):171–87.10.1016/S0277-3791(99)00060-8Suche in Google Scholar
[2] Ding ZL, Xiong SF, Sun JM, Yang SL, Gu ZY, Liu TS. Pedostratigraphy and paleomagnetism of a 7.0 Ma eolian loess–red clay sequence at Lingtai, Loess Plateau, north-central China and the implications for paleomonsoon evolution. Palaeogeogr Palaeoclimatol Palaeoecol. 1999;152(1–2):49–66.10.1016/S0031-0182(99)00034-6Suche in Google Scholar
[3] Guo ZT, Ruddiman WF, Hao QZ, Wu HB, Qiao YS, Zhu RX, et al. Onset of Asian desertification by 22 Myr ago inferred from loess deposits in China. Nature. 2002;416(6877):159–63.10.1038/416159aSuche in Google Scholar PubMed
[4] Liu TS, Ding ZL. Chinese loess and the paleomonsoon. Annu Rev Earth Planet Sci. 1998;26(1):111–45.10.1146/annurev.earth.26.1.111Suche in Google Scholar
[5] Lu HY, Wang XY, Wang Y, Zhang XJ, Yi SW, Wang XY, et al. Chinese loess and the Asian monsoon: What we know and what remains unknown[J]. Quat Int. 2022;620:85–97.10.1016/j.quaint.2021.04.027Suche in Google Scholar
[6] Heller F, Liu TS. Magnetostratigraphical dating of loess deposits in China. Nature. 1982;300(5891):431–3.10.1038/300431a0Suche in Google Scholar
[7] Sun YB, An ZS, Clemens SC, Bloemendal J, Vandenberghe J. Seven million years of wind and precipitation variability on the Chinese Loess Plateau. Earth Planet Sci Lett. 2010;297(3–4):525–35.10.1016/j.epsl.2010.07.004Suche in Google Scholar
[8] Xu Y, Yue LP, Li JX, Sun L, Sun B, Zhang JY, et al. Red clay deposits on the Chinese Loess Plateau during 11.0–2.6 Ma and its implications for long-term evolution of East Asian monsoon. Palaeogeogr Palaeoclimatol Palaeoecol. 2009;284(3–4):383–91.Suche in Google Scholar
[9] Anwar T, Kravchinsky VA, Zhang R. Magneto- and cyclostratigraphy in the red clay sequence: New age model and paleoclimatic implication for the eastern Chinese Loess Plateau. Geophys Res Solid Earth. 2015;120(10):6758–70.10.1002/2015JB012132Suche in Google Scholar
[10] Ao H, Roberts AP, Dekkers MJ, Liu XD, Rohing EJ, Shi ZG, et al. Late Miocene–Pliocene Asian monsoon intensification linked to Antarctic ice-sheet growth. Earth Planet Sci Lett. 2016;444:75–87.10.1016/j.epsl.2016.03.028Suche in Google Scholar
[11] Ao H, Rohling EJ, Zhang R, Roberts AP, Holbourn AE, Ladant JB, et al. Global warming-induced Asian hydrological climate transition across the Miocene–Pliocene boundary. Nat Commun. 2021;12(1):6935.10.1038/s41467-021-27054-5Suche in Google Scholar PubMed PubMed Central
[12] Zachos J, Pagani M, Sloan L, Thomas E, Billups K. Trends, Rhythms, and Aberrations in Global Climate 65 Ma to Present. Science. 2001;292(5517):686–93.10.1126/science.1059412Suche in Google Scholar PubMed
[13] Laskar J, Robutel P, Joutel F, Gastineau M, Correia ACM, Levrard B. A long-term numerical solution for the insolation quantities of the Earth. Astron Astrophys. 2004;428(1):261–85.10.1051/0004-6361:20041335Suche in Google Scholar
[14] Li MS, Hinnov L, Kump L. Acycle Time-series analysis software for paleoclimate research and education. Comput Geosci. 2019;127:12–22.10.1016/j.cageo.2019.02.011Suche in Google Scholar
[15] Meyers SR. The evaluation of eccentricity-related amplitude modulation and bundling in paleoclimate data: An inverse approach for astrochronologic testing and time scale optimization. Paleoceanography. 2015;30(12):1625–40.10.1002/2015PA002850Suche in Google Scholar
[16] Meyers SR. Cyclostratigraphy and the problem of astrochronologic testing. Earth-Sci Rev. 2019;190:190–223.10.1016/j.earscirev.2018.11.015Suche in Google Scholar
[17] Weedon GP. Problems with the current practice of spectral analysis in cyclostratigraphy: Avoiding false detection of regular cyclicity. Earth-Sci Rev. 2022;235:104261.10.1016/j.earscirev.2022.104261Suche in Google Scholar
[18] Zeeden C, Meyers SR, Hilgen FJ, Lourens LJ, Laskar J. Time scale evaluation and the quantification of obliquity forcing. Quat Sci Rev. 2019;209:100–13.10.1016/j.quascirev.2019.01.018Suche in Google Scholar
[19] An ZS, Kutzbach JE, Prell WL, Porter SC. Evolution of Asian monsoons and phased uplift of the Himalayan Tibetan plateau since Late Miocene times. Nature. 2001;411(6833):62–6.10.1038/35075035Suche in Google Scholar PubMed
[20] Chen J, An ZS, Head J. Variation of Rb/Sr ratios in the loess-paleosol sequences of central China during the last 130,000 years and their implications for monsoon paleoclimatology. Quat Res. 1999;52(2):269.10.1006/qres.1999.2038Suche in Google Scholar
[21] Chen J, Ji JF, Balsam W, Chen Y, Liu LW, An ZS. Characterization of the Chinese loess-paleosol stratigraphy by whiteness measurement. Palaeogeogr Palaeoclimatol Palaeoecol. 2002;183(3–4):287–97.10.1016/S0031-0182(02)00246-8Suche in Google Scholar
[22] He T, Chen Y, Balsam W, Qiang XK, Liu LW, Chen J, et al. Carbonate leaching processes in the Red Clay Formation, Chinese Loess Plateau: Fingerprinting East Asian summer monsoon variability during the late Miocene and Pliocene. Geophys Res Lett. 2013;40(1):194–8.10.1029/2012GL053786Suche in Google Scholar
[23] Sun YB, He L, Liang LJ, An ZS. Changing color of Chinese loess: Geochemical constraint and paleoclimatic significance. J Asian Earth Sci. 2011;40(6, SI):1131–8.10.1016/j.jseaes.2010.08.006Suche in Google Scholar
[24] Yang SL, Ding F, Ding ZL. Pleistocene chemical weathering history of Asian arid and semi-arid regions recorded in loess deposits of China and Tajikistan. Geochim Cosmochim Acta. 2006;70(7):1695–709.10.1016/j.gca.2005.12.012Suche in Google Scholar
[25] Buggle B, Glaser B, Hambach U, Gerasimenko N, Marković S. An evaluation of geochemical weathering indices in loess–paleosol studies[J]. Quat Int. 2011;240(1–2):12–21.10.1016/j.quaint.2010.07.019Suche in Google Scholar
[26] Ao H, Rohling EJ, Stringer C, Roberts AP, Dekkers MJ, Dupont-Nivet G, et al. Two-stage mid-Brunhes climate transition and mid-Pleistocene human diversification. Earth-Sci Rev. 2020;210:103354.10.1016/j.earscirev.2020.103354Suche in Google Scholar
[27] Thomson DJ. Spectrum estimation and harmonic analysis. Proc IEEE. 1982;70(9):1055–96.10.1109/PROC.1982.12433Suche in Google Scholar
[28] Hinnov LA. New perspectives on orbitally forced stratigraphy. Annu Rev Earth Planet Sci. 2000;28(1):419–75.10.1146/annurev.earth.28.1.419Suche in Google Scholar
[29] Weedon GP, Coe AL, Gallois RW. Cyclostratigraphy, orbital tuning and inferred productivity for the type Kimmeridge Clay (Late Jurassic), Southern England. J Geol Soc. 2004;161(4):655–66.10.1144/0016-764903-073Suche in Google Scholar
[30] Meyers SR, Sageman BB, Hinnov LA. Integrated quantitative stratigraphy of the Cenomanian-Turonian Bridge Creek Limestone Member using evolutive harmonic analysis and stratigraphic modeling. J Sediment Res. 2001;71(4):628–44.10.1306/012401710628Suche in Google Scholar
[31] Boulila S, Vahlenkamp M, De Vleeschouwer D, Laskar J, Yamamoto Y, Pälike H, et al. Towards a robust and consistent middle Eocene astronomical timescale. Earth Planet Sci Lett. 2018;486:94–107.10.1016/j.epsl.2018.01.003Suche in Google Scholar
[32] Charbonnier G, Boulila S, Spangenberg JE, Adatte T, Föllmi KB, Laskar J. Obliquity pacing of the hydrological cycle during the Oceanic Anoxic Event 2. Earth Planet Sci Lett. 2018;499:266–77.10.1016/j.epsl.2018.07.029Suche in Google Scholar
[33] Laskar J. Astrochronology. In Gradstein FM, Ogg JG, Schmitz MD, Ogg GM, editors. The Geologic Time Scale 2020. Amsterdam: Elsevier; 2020. p. 139–58.10.1016/B978-0-12-824360-2.00004-8Suche in Google Scholar
[34] Huang H, Gao Y, Ma C, Jones MM, Zeeden C, Ibarra DE, et al. Organic carbon burial is paced by a ∼173-ka obliquity cycle in the middle to high latitudes. Sci Adv. 2021;7(28):eabf9489.10.1126/sciadv.abf9489Suche in Google Scholar PubMed PubMed Central
[35] Davis BAS, Brewer S. Orbital forcing and role of the latitudinal i nsolation/temperature gradient. Clim Dyn. 2009;32(2–3):143–65.10.1007/s00382-008-0480-9Suche in Google Scholar
[36] Zhang R, Kravchinsky VA, Anwar T, Yue LP, Li JX, Jiao J. Comment on “Late Miocene-Pliocene Asian monsoon intensification linked to Antarctic ice-sheet growth”. 2016;444:75–87. Earth Planet Sci Lett. 2018;503:248–51.10.1016/j.epsl.2018.08.033Suche in Google Scholar
© 2024 the author(s), published by De Gruyter
This work is licensed under the Creative Commons Attribution 4.0 International License.
Artikel in diesem Heft
- Regular Articles
- Theoretical magnetotelluric response of stratiform earth consisting of alternative homogeneous and transitional layers
- The research of common drought indexes for the application to the drought monitoring in the region of Jin Sha river
- Evolutionary game analysis of government, businesses, and consumers in high-standard farmland low-carbon construction
- On the use of low-frequency passive seismic as a direct hydrocarbon indicator: A case study at Banyubang oil field, Indonesia
- Water transportation planning in connection with extreme weather conditions; case study – Port of Novi Sad, Serbia
- Zircon U–Pb ages of the Paleozoic volcaniclastic strata in the Junggar Basin, NW China
- Monitoring of mangrove forests vegetation based on optical versus microwave data: A case study western coast of Saudi Arabia
- Microfacies analysis of marine shale: A case study of the shales of the Wufeng–Longmaxi formation in the western Chongqing, Sichuan Basin, China
- Multisource remote sensing image fusion processing in plateau seismic region feature information extraction and application analysis – An example of the Menyuan Ms6.9 earthquake on January 8, 2022
- Identification of magnetic mineralogy and paleo-flow direction of the Miocene-quaternary volcanic products in the north of Lake Van, Eastern Turkey
- Impact of fully rotating steel casing bored pile on adjacent tunnels
- Adolescents’ consumption intentions toward leisure tourism in high-risk leisure environments in riverine areas
- Petrogenesis of Jurassic granitic rocks in South China Block: Implications for events related to subduction of Paleo-Pacific plate
- Differences in urban daytime and night block vitality based on mobile phone signaling data: A case study of Kunming’s urban district
- Random forest and artificial neural network-based tsunami forests classification using data fusion of Sentinel-2 and Airbus Vision-1 satellites: A case study of Garhi Chandan, Pakistan
- Integrated geophysical approach for detection and size-geometry characterization of a multiscale karst system in carbonate units, semiarid Brazil
- Spatial and temporal changes in ecosystem services value and analysis of driving factors in the Yangtze River Delta Region
- Deep fault sliding rates for Ka-Ping block of Xinjiang based on repeating earthquakes
- Improved deep learning segmentation of outdoor point clouds with different sampling strategies and using intensities
- Platform margin belt structure and sedimentation characteristics of Changxing Formation reefs on both sides of the Kaijiang-Liangping trough, eastern Sichuan Basin, China
- Enhancing attapulgite and cement-modified loess for effective landfill lining: A study on seepage prevention and Cu/Pb ion adsorption
- Flood risk assessment, a case study in an arid environment of Southeast Morocco
- Lower limits of physical properties and classification evaluation criteria of the tight reservoir in the Ahe Formation in the Dibei Area of the Kuqa depression
- Evaluation of Viaducts’ contribution to road network accessibility in the Yunnan–Guizhou area based on the node deletion method
- Permian tectonic switch of the southern Central Asian Orogenic Belt: Constraints from magmatism in the southern Alxa region, NW China
- Element geochemical differences in lower Cambrian black shales with hydrothermal sedimentation in the Yangtze block, South China
- Three-dimensional finite-memory quasi-Newton inversion of the magnetotelluric based on unstructured grids
- Obliquity-paced summer monsoon from the Shilou red clay section on the eastern Chinese Loess Plateau
- Classification and logging identification of reservoir space near the upper Ordovician pinch-out line in Tahe Oilfield
- Ultra-deep channel sand body target recognition method based on improved deep learning under UAV cluster
- New formula to determine flyrock distance on sedimentary rocks with low strength
- Assessing the ecological security of tourism in Northeast China
- Effective reservoir identification and sweet spot prediction in Chang 8 Member tight oil reservoirs in Huanjiang area, Ordos Basin
- Detecting heterogeneity of spatial accessibility to sports facilities for adolescents at fine scale: A case study in Changsha, China
- Effects of freeze–thaw cycles on soil nutrients by soft rock and sand remodeling
- Vibration prediction with a method based on the absorption property of blast-induced seismic waves: A case study
- A new look at the geodynamic development of the Ediacaran–early Cambrian forearc basalts of the Tannuola-Khamsara Island Arc (Central Asia, Russia): Conclusions from geological, geochemical, and Nd-isotope data
- Spatio-temporal analysis of the driving factors of urban land use expansion in China: A study of the Yangtze River Delta region
- Selection of Euler deconvolution solutions using the enhanced horizontal gradient and stable vertical differentiation
- Phase change of the Ordovician hydrocarbon in the Tarim Basin: A case study from the Halahatang–Shunbei area
- Using interpretative structure model and analytical network process for optimum site selection of airport locations in Delta Egypt
- Geochemistry of magnetite from Fe-skarn deposits along the central Loei Fold Belt, Thailand
- Functional typology of settlements in the Srem region, Serbia
- Hunger Games Search for the elucidation of gravity anomalies with application to geothermal energy investigations and volcanic activity studies
- Addressing incomplete tile phenomena in image tiling: Introducing the grid six-intersection model
- Evaluation and control model for resilience of water resource building system based on fuzzy comprehensive evaluation method and its application
- MIF and AHP methods for delineation of groundwater potential zones using remote sensing and GIS techniques in Tirunelveli, Tenkasi District, India
- New database for the estimation of dynamic coefficient of friction of snow
- Measuring urban growth dynamics: A study in Hue city, Vietnam
- Comparative models of support-vector machine, multilayer perceptron, and decision tree predication approaches for landslide susceptibility analysis
- Experimental study on the influence of clay content on the shear strength of silty soil and mechanism analysis
- Geosite assessment as a contribution to the sustainable development of Babušnica, Serbia
- Using fuzzy analytical hierarchy process for road transportation services management based on remote sensing and GIS technology
- Accumulation mechanism of multi-type unconventional oil and gas reservoirs in Northern China: Taking Hari Sag of the Yin’e Basin as an example
- TOC prediction of source rocks based on the convolutional neural network and logging curves – A case study of Pinghu Formation in Xihu Sag
- A method for fast detection of wind farms from remote sensing images using deep learning and geospatial analysis
- Spatial distribution and driving factors of karst rocky desertification in Southwest China based on GIS and geodetector
- Physicochemical and mineralogical composition studies of clays from Share and Tshonga areas, Northern Bida Basin, Nigeria: Implications for Geophagia
- Geochemical sedimentary records of eutrophication and environmental change in Chaohu Lake, East China
- Research progress of freeze–thaw rock using bibliometric analysis
- Mixed irrigation affects the composition and diversity of the soil bacterial community
- Examining the swelling potential of cohesive soils with high plasticity according to their index properties using GIS
- Geological genesis and identification of high-porosity and low-permeability sandstones in the Cretaceous Bashkirchik Formation, northern Tarim Basin
- Usability of PPGIS tools exemplified by geodiscussion – a tool for public participation in shaping public space
- Efficient development technology of Upper Paleozoic Lower Shihezi tight sandstone gas reservoir in northeastern Ordos Basin
- Assessment of soil resources of agricultural landscapes in Turkestan region of the Republic of Kazakhstan based on agrochemical indexes
- Evaluating the impact of DEM interpolation algorithms on relief index for soil resource management
- Petrogenetic relationship between plutonic and subvolcanic rocks in the Jurassic Shuikoushan complex, South China
- A novel workflow for shale lithology identification – A case study in the Gulong Depression, Songliao Basin, China
- Characteristics and main controlling factors of dolomite reservoirs in Fei-3 Member of Feixianguan Formation of Lower Triassic, Puguang area
- Impact of high-speed railway network on county-level accessibility and economic linkage in Jiangxi Province, China: A spatio-temporal data analysis
- Estimation model of wild fractional vegetation cover based on RGB vegetation index and its application
- Lithofacies, petrography, and geochemistry of the Lamphun oceanic plate stratigraphy: As a record of the subduction history of Paleo-Tethys in Chiang Mai-Chiang Rai Suture Zone of Thailand
- Structural features and tectonic activity of the Weihe Fault, central China
- Application of the wavelet transform and Hilbert–Huang transform in stratigraphic sequence division of Jurassic Shaximiao Formation in Southwest Sichuan Basin
- Structural detachment influences the shale gas preservation in the Wufeng-Longmaxi Formation, Northern Guizhou Province
- Distribution law of Chang 7 Member tight oil in the western Ordos Basin based on geological, logging and numerical simulation techniques
- Evaluation of alteration in the geothermal province west of Cappadocia, Türkiye: Mineralogical, petrographical, geochemical, and remote sensing data
- Numerical modeling of site response at large strains with simplified nonlinear models: Application to Lotung seismic array
- Quantitative characterization of granite failure intensity under dynamic disturbance from energy standpoint
- Characteristics of debris flow dynamics and prediction of the hazardous area in Bangou Village, Yanqing District, Beijing, China
- Rockfall mapping and susceptibility evaluation based on UAV high-resolution imagery and support vector machine method
- Statistical comparison analysis of different real-time kinematic methods for the development of photogrammetric products: CORS-RTK, CORS-RTK + PPK, RTK-DRTK2, and RTK + DRTK2 + GCP
- Hydrogeological mapping of fracture networks using earth observation data to improve rainfall–runoff modeling in arid mountains, Saudi Arabia
- Petrography and geochemistry of pegmatite and leucogranite of Ntega-Marangara area, Burundi, in relation to rare metal mineralisation
- Prediction of formation fracture pressure based on reinforcement learning and XGBoost
- Hazard zonation for potential earthquake-induced landslide in the eastern East Kunlun fault zone
- Monitoring water infiltration in multiple layers of sandstone coal mining model with cracks using ERT
- Study of the patterns of ice lake variation and the factors influencing these changes in the western Nyingchi area
- Productive conservation at the landslide prone area under the threat of rapid land cover changes
- Sedimentary processes and patterns in deposits corresponding to freshwater lake-facies of hyperpycnal flow – An experimental study based on flume depositional simulations
- Study on time-dependent injectability evaluation of mudstone considering the self-healing effect
- Detection of objects with diverse geometric shapes in GPR images using deep-learning methods
- Behavior of trace metals in sedimentary cores from marine and lacustrine environments in Algeria
- Spatiotemporal variation pattern and spatial coupling relationship between NDVI and LST in Mu Us Sandy Land
- Formation mechanism and oil-bearing properties of gravity flow sand body of Chang 63 sub-member of Yanchang Formation in Huaqing area, Ordos Basin
- Diagenesis of marine-continental transitional shale from the Upper Permian Longtan Formation in southern Sichuan Basin, China
- Vertical high-velocity structures and seismic activity in western Shandong Rise, China: Case study inspired by double-difference seismic tomography
- Spatial coupling relationship between metamorphic core complex and gold deposits: Constraints from geophysical electromagnetics
- Disparities in the geospatial allocation of public facilities from the perspective of living circles
- Research on spatial correlation structure of war heritage based on field theory. A case study of Jinzhai County, China
- Formation mechanisms of Qiaoba-Zhongdu Danxia landforms in southwestern Sichuan Province, China
- Magnetic data interpretation: Implication for structure and hydrocarbon potentiality at Delta Wadi Diit, Southeastern Egypt
- Deeply buried clastic rock diagenesis evolution mechanism of Dongdaohaizi sag in the center of Junggar fault basin, Northwest China
- Application of LS-RAPID to simulate the motion of two contrasting landslides triggered by earthquakes
- The new insight of tectonic setting in Sunda–Banda transition zone using tomography seismic. Case study: 7.1 M deep earthquake 29 August 2023
- The critical role of c and φ in ensuring stability: A study on rockfill dams
- Evidence of late quaternary activity of the Weining-Shuicheng Fault in Guizhou, China
- Extreme hydroclimatic events and response of vegetation in the eastern QTP since 10 ka
- Spatial–temporal effect of sea–land gradient on landscape pattern and ecological risk in the coastal zone: A case study of Dalian City
- Study on the influence mechanism of land use on carbon storage under multiple scenarios: A case study of Wenzhou
- A new method for identifying reservoir fluid properties based on well logging data: A case study from PL block of Bohai Bay Basin, North China
- Comparison between thermal models across the Middle Magdalena Valley, Eastern Cordillera, and Eastern Llanos basins in Colombia
- Mineralogical and elemental analysis of Kazakh coals from three mines: Preliminary insights from mode of occurrence to environmental impacts
- Chlorite-induced porosity evolution in multi-source tight sandstone reservoirs: A case study of the Shaximiao Formation in western Sichuan Basin
- Predicting stability factors for rotational failures in earth slopes and embankments using artificial intelligence techniques
- Origin of Late Cretaceous A-type granitoids in South China: Response to the rollback and retreat of the Paleo-Pacific plate
- Modification of dolomitization on reservoir spaces in reef–shoal complex: A case study of Permian Changxing Formation, Sichuan Basin, SW China
- Geological characteristics of the Daduhe gold belt, western Sichuan, China: Implications for exploration
- Rock physics model for deep coal-bed methane reservoir based on equivalent medium theory: A case study of Carboniferous-Permian in Eastern Ordos Basin
- Enhancing the total-field magnetic anomaly using the normalized source strength
- Shear wave velocity profiling of Riyadh City, Saudi Arabia, utilizing the multi-channel analysis of surface waves method
- Effect of coal facies on pore structure heterogeneity of coal measures: Quantitative characterization and comparative study
- Inversion method of organic matter content of different types of soils in black soil area based on hyperspectral indices
- Detection of seepage zones in artificial levees: A case study at the Körös River, Hungary
- Tight sandstone fluid detection technology based on multi-wave seismic data
- Characteristics and control techniques of soft rock tunnel lining cracks in high geo-stress environments: Case study of Wushaoling tunnel group
- Influence of pore structure characteristics on the Permian Shan-1 reservoir in Longdong, Southwest Ordos Basin, China
- Study on sedimentary model of Shanxi Formation – Lower Shihezi Formation in Da 17 well area of Daniudi gas field, Ordos Basin
- Multi-scenario territorial spatial simulation and dynamic changes: A case study of Jilin Province in China from 1985 to 2030
- Review Articles
- Major ascidian species with negative impacts on bivalve aquaculture: Current knowledge and future research aims
- Prediction and assessment of meteorological drought in southwest China using long short-term memory model
- Communication
- Essential questions in earth and geosciences according to large language models
- Erratum
- Erratum to “Random forest and artificial neural network-based tsunami forests classification using data fusion of Sentinel-2 and Airbus Vision-1 satellites: A case study of Garhi Chandan, Pakistan”
- Special Issue: Natural Resources and Environmental Risks: Towards a Sustainable Future - Part I
- Spatial-temporal and trend analysis of traffic accidents in AP Vojvodina (North Serbia)
- Exploring environmental awareness, knowledge, and safety: A comparative study among students in Montenegro and North Macedonia
- Determinants influencing tourists’ willingness to visit Türkiye – Impact of earthquake hazards on Serbian visitors’ preferences
- Application of remote sensing in monitoring land degradation: A case study of Stanari municipality (Bosnia and Herzegovina)
- Optimizing agricultural land use: A GIS-based assessment of suitability in the Sana River Basin, Bosnia and Herzegovina
- Assessing risk-prone areas in the Kratovska Reka catchment (North Macedonia) by integrating advanced geospatial analytics and flash flood potential index
- Analysis of the intensity of erosive processes and state of vegetation cover in the zone of influence of the Kolubara Mining Basin
- GIS-based spatial modeling of landslide susceptibility using BWM-LSI: A case study – city of Smederevo (Serbia)
- Geospatial modeling of wildfire susceptibility on a national scale in Montenegro: A comparative evaluation of F-AHP and FR methodologies
- Geosite assessment as the first step for the development of canyoning activities in North Montenegro
- Urban geoheritage and degradation risk assessment of the Sokograd fortress (Sokobanja, Eastern Serbia)
- Multi-hazard modeling of erosion and landslide susceptibility at the national scale in the example of North Macedonia
- Understanding seismic hazard resilience in Montenegro: A qualitative analysis of community preparedness and response capabilities
- Forest soil CO2 emission in Quercus robur level II monitoring site
- Characterization of glomalin proteins in soil: A potential indicator of erosion intensity
- Power of Terroir: Case study of Grašac at the Fruška Gora wine region (North Serbia)
- Special Issue: Geospatial and Environmental Dynamics - Part I
- Qualitative insights into cultural heritage protection in Serbia: Addressing legal and institutional gaps for disaster risk resilience