Big data-based optimized model of building design in the context of rural revitalization
-
Lei Wang


Abstract
Rural revitalization policy is an important strategic measure of the country, and optimizing the design of public buildings is an important step in achieving rural revitalization. The research innovatively focuses on energy consumption in public buildings and introduces a novel multi-objective particle swarm optimization algorithm (BBMOPSO-A [backbone multi-objective particle swarm optimization algorithm]), which is designed to address the characteristics of building energy consumption (BEC, the total amount of energy consumed in the operation of a building). The new method enhanced the search capability of the algorithm by introducing new local and individual extreme points to address the multi-objective nature of the BEC problem. In addition, to reduce the computational cost, the study also innovatively employed an agent-assisted model to effectively replace the original model, ensuring that performance was not sacrificed while cost was reduced. These experiments confirmed that this new method model could effectively reduce algorithm costs. The accuracy of this method was 5.02% higher than multi-objective genetic algorithm, 3.72% higher than the multi-objective artificial ant colony algorithm, and 2.67% higher than the multi-objective particle swarm algorithm. Therefore, the backbone multi-objective particle swarm optimization algorithm has better performance and is more suitable for optimizing building energy consumption.
1 Introduction
Rural revitalization is an important measure implemented by the country to achieve national rejuvenation [1]. Building energy consumption (BEC) is an important research topic for optimizing the design of public buildings, and it is also an open challenge to reduce building costs and achieve rural revitalization [2]. Particle swarm optimization (PSO, an algorithm that simulates the social behavior of flocks of birds or schools of fish to find an optimal solution) is a commonly used method for solving multi-objective problems [3]. BEC is classified as a multi-objective optimization (MO, which refers to the process of considering multiple objective functions simultaneously in the optimization process and achieving a balanced optimal solution) problem due to its complex parameter variations. Therefore, PSO is a common way to solve BEC [4]. However, traditional PSO suffers from insufficient accuracy and high cost. Based on this, a new backbone multi-objective PSO algorithm (BBMOPSO-A) was constructed in this study. Moreover, to reduce the computational cost, a proxy-assisted model concept was used to replace this model. This study consists of four parts. First, a summary of the research results at home and abroad was conducted. Second, the construction process of this model was elaborated. The third part is a multi-indicator analysis of this model. Finally, a summary of the entire article was provided. The study uses the BBMOPSO-A to optimize the energy consumption of the building through design variables such as the thermal performance of the building envelope, energy consumption of equipment, human activities, and building operating parameters [5]. The optimization parameters are input through the building energy simulation software to calculate the energy consumption under different operating conditions, and an energy analysis report is generated to evaluate the effectiveness of the optimization [6,7]. In addition, the study introduces a machine learning-based agent model to replace the traditional energy calculation model, which significantly improves the optimization efficiency.
The contribution of the research is to develop the BBMOPSO-A building energy optimization algorithm, which improves the search capability and effectively solves the MO problem by introducing new local extremum points and single extremum points. Meanwhile, the agent-based modeling technology is adopted to reduce the computational cost and improve the efficiency of the algorithm. In terms of applicability, BBMOPSO-A is not only applicable to the optimal design of public buildings in the context of rural revitalization to reduce energy consumption and improve comfort but can also be extended to building types such as schools, hospitals, government offices, etc., to support green building goals. In addition, the algorithm can be applied to the field of building energy management, providing scientific tools for fine management and control of BEC.
1.1 Related works
In recent years, with the deepening of public BEC optimization, more experts and scholars have obtained many research results, thereby improving the optimization of public BEC. Li et al. found that traditional transfer learning methods posed a risk of privacy leakage to users. Therefore, a new method of joint learning was proposed based on traditional experimental methods. The new method could train data information and incorporate new aggregation algorithms during the training process to protect information from leakage. These experiments demonstrated that the new algorithm had higher accuracy and better information protection compared to traditional algorithms [8]. Mu found that air conditioning was an important energy consumption system in BEC. How to reduce energy consumption and improve usage efficiency of air-conditioning systems has become the focus of energy conservation and emission reduction. Therefore, they proposed a new BEC application technology based on traditional energy consumption prediction. New technology could reduce BEC and improve the efficiency of air conditioning. These experiments confirmed that the new method had a higher efficiency in reducing BEC compared to traditional algorithms [6]. Zhang found that traditional buildings had some inherent BEC during use, as well as unnecessary equipment energy consumption [9]. Therefore, to improve the energy consumption of traditional buildings, BEC parameters were optimized based on the genetic algorithm (GA, a search heuristic algorithm that mimics natural selection and genetics), and a new BEC optimization design model was obtained. These experiments demonstrated that this new model could reduce BEC and optimize BEC parameters [10]. Liu et al. believed that traditional optimization of public building design mainly focused on BEC, while BEC mainly focused on building data time series [11]. Therefore, a data processing algorithm based on artificial intelligence was proposed, which could provide a new database for mining BEC data. These experiments demonstrated that the new algorithm model could achieve analysis of energy data, improve energy utilization, and have better stability than traditional algorithms.
Zhao believed that there was a significant experimental error in traditional BEC prediction. Therefore, this study proposed a short-term energy consumption prediction method based on a regression tree on the basis of traditional energy consumption prediction [12]. The new method could use computer software to construct the BEC structure, obtain important BEC parameters, and use GA to extract BEC features. These experiments confirmed that the relative error of the new method was smaller, and the prediction of BEC was more accurate. Wenninger et al. believed that data-driven methods could accurately predict BEC data, but most studies did not study the prediction performance. Therefore, a new method based on artificial learning algorithms was proposed on this basis, which could predict and analyze energy consumption data. These experiments confirmed that the new algorithm could replace the traditional BEC prediction method [13]. Rongfang believed that the traditional BEC method was no longer able to meet the current BEC. Therefore, this study proposed a new BEC method based on traditional energy consumption. The new method could achieve monitoring of BEC by calculating the actual and theoretical support of energy. Simultaneously utilizing hot air circulation technology could achieve control and reduction of energy costs. These experiments confirmed that the new method could effectively predict the true value of BEC while controlling the use of energy [14]. Sun et al. believed that BEC was important in energy and resource utilization planning, but there was an imbalance between parameter optimization and accuracy changes in traditional BEC prediction planning [15]. Therefore, a light superposition-increasing framework was proposed. The new framework could fuse parameters to improve the predictive ability of the model. These experiments confirmed that the prediction accuracy of the new model was significantly better than that of traditional models [15]. In the study by Shen et al., the optimization of the ecological performance of a building using a superposition model and an MO model significantly improved the optimization of the building, with a 39% increase in the solar gain index, but the reduction in building costs still needs to be improved [16]. Markarian et al. (2024), conversely, used a machine learning-based BPS agent approach to significantly improve the energy prediction capability and thermal comfort of the building, with a 34% improvement in thermal comfort and 1,266 times faster computation than the conventional method [17]. However, further exploration was still needed in terms of cost reduction and performance optimization [17].
In summary, the optimization of public building models in rural revitalization mainly involves optimizing the energy consumption of buildings. Although many current studies have optimized BEC, there are still problems with insufficient precision and predictive ability. Therefore, this study proposes a new algorithm model to address the precision and accuracy. Moreover, proxy replacement is carried out on the model while controlling costs to achieve optimal design of public buildings.
2 Optimization design and model of public buildings under big data algorithms
This chapter mainly optimizes the design of public buildings based on big data algorithms in rural revitalization and builds a BBMOPSO-A model based on big data algorithms. Moreover, to reduce costs, proxy models are constructed and replaced for the algorithm models.
2.1 BEC optimization design and model construction
Big data algorithm is a collective term for various data processing algorithms, and the whole algorithm model may include multiple algorithms. In public building design, it is hoped that buildings can be designed with low cost, high safety, and high comfort. However, many of the characteristics of buildings are contradictory, and this problem of multiple contradictory relationships is called MOP. In practical applications, MO can only achieve one optimal solution, so in the optimization design of public buildings, the optimal solution can only be achieved for as many objectives as possible. An optimal solution is a set of solutions that balances all objective functions in an MO problem. In the study, the velocity and position updates of the particles are influenced by adjusting the parameters to guide the particles to search the solution space to find the optimal solution. BBMOPSO-A is an upgraded algorithm used in PSO to solve multi-objective optimal solutions [18]. This algorithm achieves the optimal solution of the population by iterating on the demand particle population. Eqs. (1) and (2) is the conventional formula for particle speed update and its position:
In Eqs. (1) and (2),
These formulas are used to initialize the velocity and position of the particles and then find the optimal solution through an iterative process. Figure 1 shows the conventional PSO calculation.
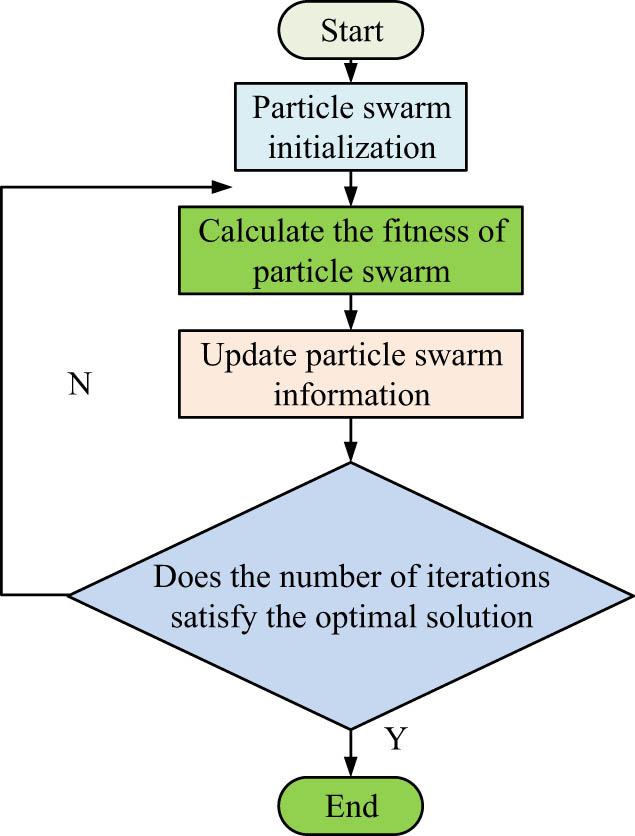
PSO process.
In Figure 1, when inputting the numerical values of PSO, the input data is first initialized. Then, its optimal fitness is found by calculating the fitness of data. Then, it determines the particle speed and position and finally determines whether the optimal solution is met. When calculating the optimal solution for weight values, if the update speed is too high, the global optimal solution may be missed. If the speed is too low, the global optimal solution may not be obtained. The inertia weight represents the search efficiency of PSO. When the inertia weight is large, it is helpful for the algorithm’s global search, and when the inertia weight is small, it is helpful for the algorithm’s local search ability. Therefore, setting an appropriate speed update can make the optimal solution of this algorithm faster [19].
The introduction of radial basis function neural networks (RBFNNs) is a neural network algorithm to solve the linear and nonlinear problems of input and output functions in PSO. The basic algorithm process is that the radial basis function connects neurons through input functions, and its calculation can be expressed as [20]
In Eq. (3),
In Eq. (4),
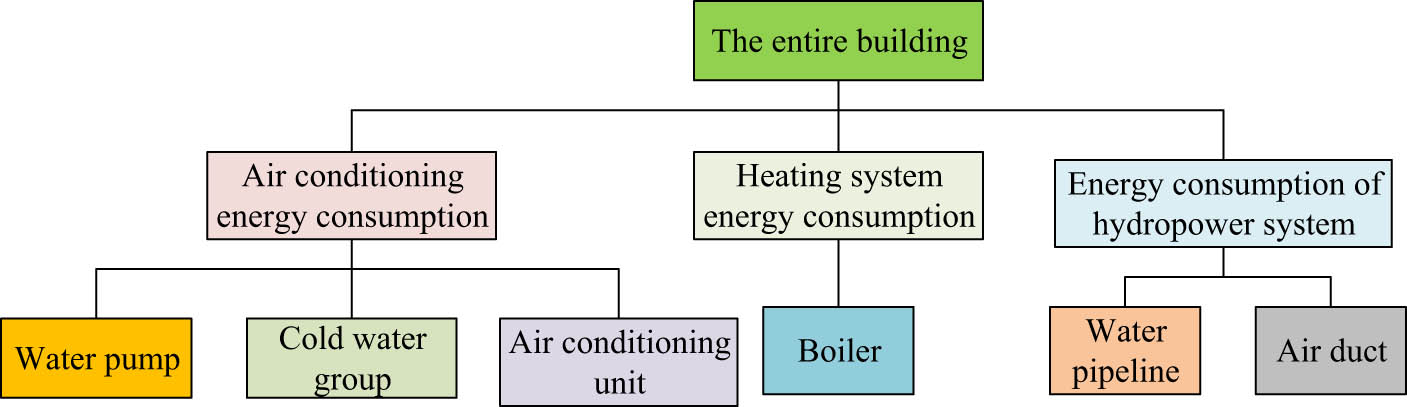
Energy consumption composition of public buildings.
In Figure 2, the conventional BEC includes air conditioning energy consumption, heating energy consumption, and water, electricity, and wind energy consumption. The energy consumption of air conditioning includes water pumps, cold water units, and air conditioning. Heating energy consumption includes boiler energy consumption. Water and electricity consumption also includes water and air pipelines. BBMOPSO-A is an algorithm used early on to change the optimization coefficients of parameter changes and control parameters. The optimization of BEC mainly solves the optimal solution of building parameters. The particle update speed and update trend of the algorithm affect the parameter changes of BEC [22] in the following equation:
where
Eq. (6) removes and reduces the weights and learning factors of the source function based on the original Eq. (5). Eq. (6) is designed to improve the performance of the algorithm by adjusting the velocity update rule for the particles, either by introducing new parameters or by adjusting the existing ones to improve the algorithm’s exploration and exploitation capabilities. When using this new formula to solve multi-objective problems, it is necessary to update the algorithm’s position in the following equation:
In Eq. (7),
In Eqs. (8)–(10),
Therefore, improving the algorithm requires the following steps. First, the population size and iteration times of the algorithm are calculated. Moreover, the particle positions and extreme points are updated within the given Gaussian function interval. The required BEC parameter values are set. The calculated function parameter values are used to solve for the optimal value of the objective function through data parameter software. The dataset information of the algorithm is updated. The dataset signal is saved in an external function. Based on the allocation situation in the reserve dataset, particle selection is carried out for each dataset. Moreover, the extreme values of particles are determined through dominance relationships. Figure 3 shows the flowchart of this algorithm.
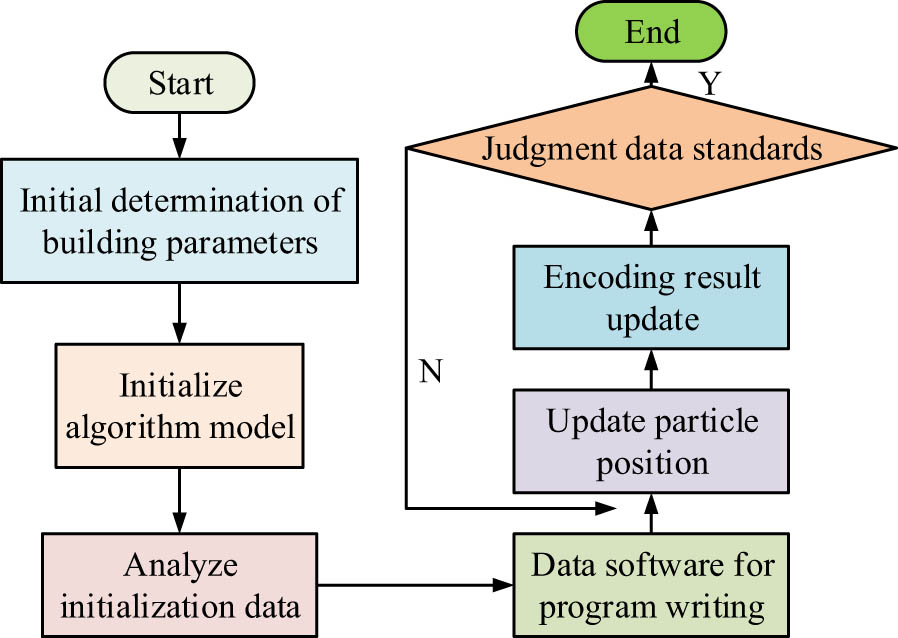
Algorithm model flowchart.
In Figure 3, the model parameters of the required building are first determined. Then, the model parameters are inputted into the algorithm and initialized. The initialized data is analyzed. The results are programmed using data software. Then, the written program is used to update the position of particles. The numerical values are imported by the written program. The software program is used to analyze the encoding results. Finally, the data standard is determined to terminate the algorithm. To optimize the computation time of the algorithm, this study adopts the strategy of introducing an agent-based model. The inertia weights, individual learning factor, and social learning factor in the PSO algorithm are adjusted. The RBFNN is used to deal with the nonlinear problem. The particle velocity and position update rules are improved. Parallel computation and early termination conditions are also used to reduce unnecessary iterations.
2.2 Design of proxy model for BBMOPSO-A
The ideal auxiliary model mainly replaces the model of the algorithm, replacing high-cost algorithms to achieve, because the ideal model can replace higher cost functions to calculate the target. Although the computational complexity and workload of the ideal auxiliary model far exceed the real objective function, the cost of the ideal auxiliary model is lower. For traditional objective optimization algorithm-assisted models, there are currently assisted social learning PSO, automatic learning PSO, and domain development-assisted evolutionary algorithms. Although traditional auxiliary proxy algorithms can calculate model accuracy and computational costs, they cannot solve the MO problem of the objective function. Data collection is an important component of proxy-assisted models. Figure 4 shows the proxy model data collection [25].
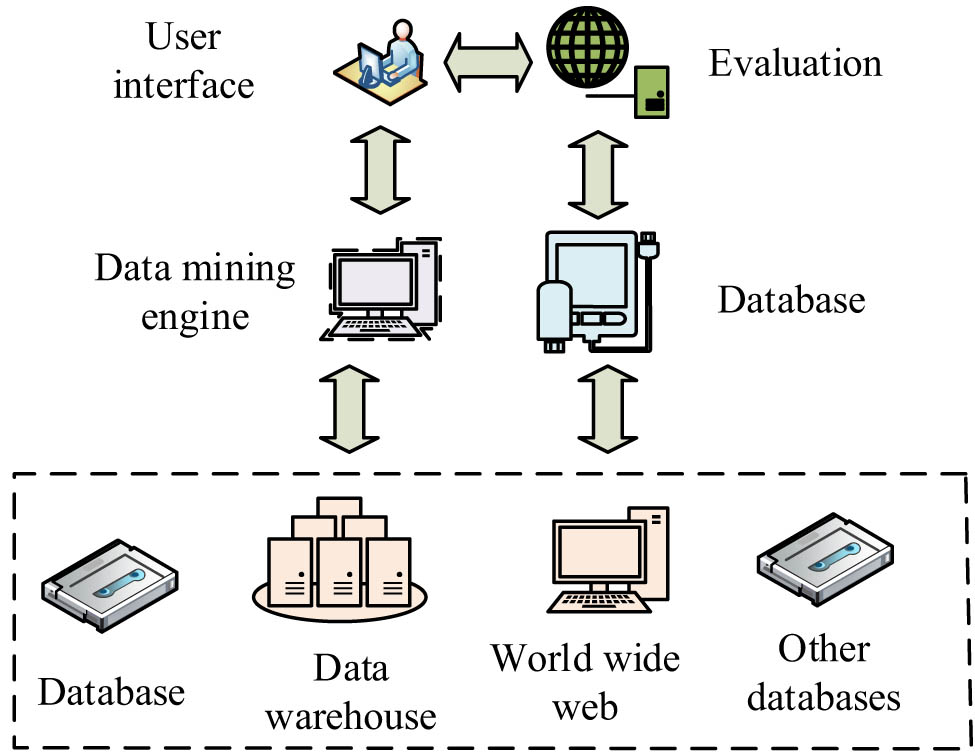
Data collection structure.
In Figure 4, the data collection structure consists of data collection, user interface, and data evaluation system. The components of each data collection structure can exchange data with each other, thus achieving high data utilization. It is important for proxy auxiliary model data collection models. When optimizing the proxy auxiliary model of MOPSO, it is necessary to provide an auxiliary model optimization method for building energy-saving designs based on traditional MOPSO. Then, different reserve sets are used to help the changing proxy auxiliary model optimize management decisions. The model management decisions and prediction accuracy are balanced, and the model management decisions are integrated into the system to obtain a new proxy-assisted MOPSO.
For the proxy auxiliary optimization model of MOPSO, it is necessary to first build the basic framework of the model and improve the algorithm model proposed in the previous section while ensuring the particle swarm position and management content of the auxiliary model. Figure 5 shows the improved model.
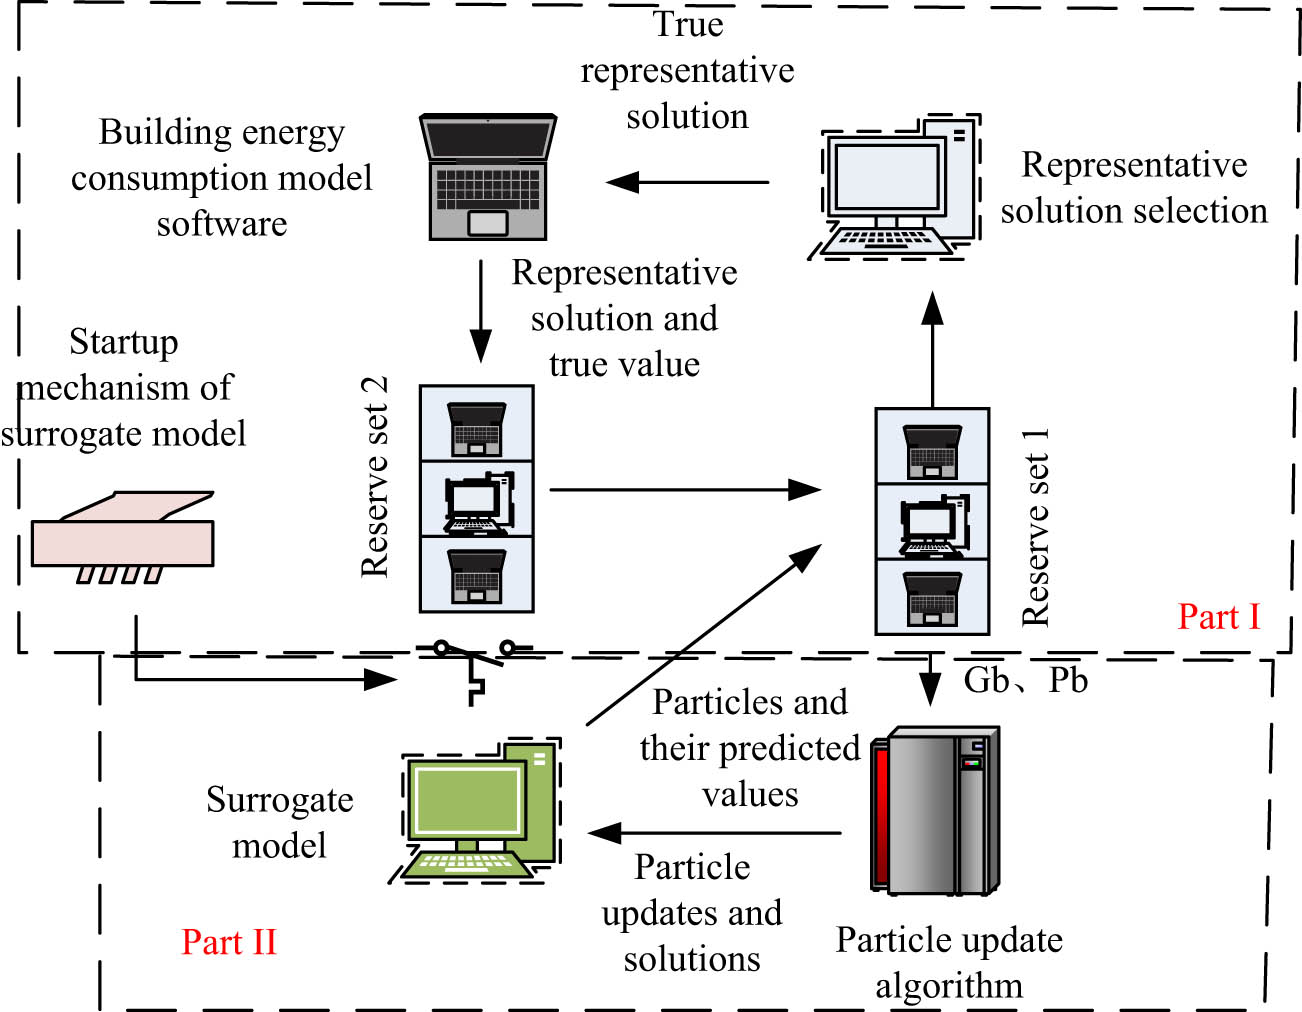
Proxy-assisted model.
In Figure 5, the proxy-assisted model first updates the particle positions of MOPSO, saves the iterative optimal solution, and calculates the target value generated by the particles by using the proxy model instead of the real function. The external storage set iteratively updates the generated target values and then introduces local guidance and individual guidance. The second part is mainly responsible for improving and controlling the data functions. The representative solution selection mechanism has been added, and the real target values are selected from the new reserve set by updating and evaluating the real values using BEC simulation software. The proxy model can initiate system mechanisms through algorithm updates. After building the proxy model, system data sampling is conducted. Eq. (11) represents the specific sampling settings
In Eq. (11),
In Eq. (12),
In Eq. (13),
In Eq. (14),
Eq. (15) shows the inverse function distance formula from
In Eq. (16),
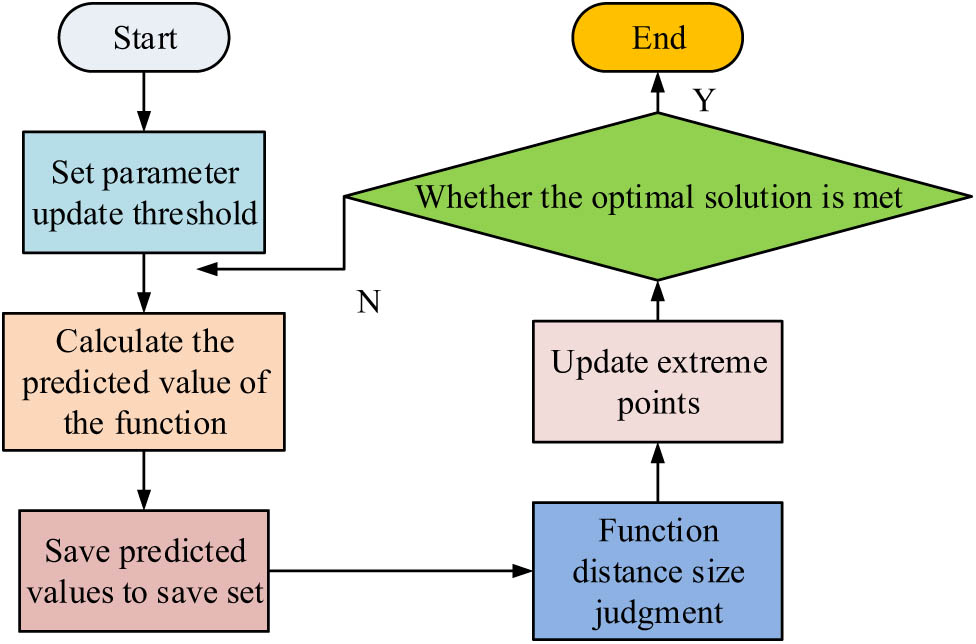
Algorithm calculation flowchart.
In Figure 6, the initialization of data sample points is first carried out, and the threshold of the sample parameter update algorithm is set. After calculation, the predicted value of the particle’s objective function is obtained, and the predicted value of the function is stored in the reserve set for updating. By calculating the distance from the dataset, it is determined whether to update or train the proxy model. If the distance is small, the updated model is calculated, and if the distance is large, the updated model is not recalculated. The updated model is updated by individual and global extreme points. Then, the distance between the updated points is calculated to determine if the optimal solution conditions are met. If they are met, the process ends. If not, the parameters and bounds are updated again.
The parallel part of this research includes the development and application of the BBMOPSO-A, agent model design, performance evaluation, and application to building energy optimization problems, with the goal of optimizing the design of public buildings in the context of rural revitalization and reducing BEC using big data algorithms.
Meanwhile, the study also includes the application of hybrid difference techniques to achieve higher order convergence approximation through adaptive Shishkin grids and error analysis for nonlinear singularly perturbed problems to ensure uniform second-order convergence [27]. In addition, adaptive mesh analysis based on monitor functions provides highly accurate spatio-temporal convergence for parabolic systems, while a reaction matrix-based triangular partitioning method is validated through numerical experiments to reduce computational costs and ensure convergence of the algorithm [28,29]. The study also proposes a higher order numerical method for solving polynomial time partitioned partial integral differential equations with initial layer singularities with stability and convergence analysis [30,31]. Finally, the solvability of nonlinear models involving the p-Laplacian operator is studied, the existence of a unique solution is proved, and the stability of the fractional order boundary problem is verified by numerical experiments [32,33].
3 BEC result analysis of BBMOPSO-A based on big data algorithm
The experiment evaluates the BEC algorithm model by comparing Pareto optimization. Figure 7 compares four algorithm models, multi-objective GA (NSGA-II, a widely used multi-objective genetic algorithm), multi-objective artistic bee colony (MOABC, a multi-objective optimization algorithm that simulates the foraging behavior of bees), MOPSO (an application of particle swarm optimization algorithms to multi-objective optimization problems), and BBMOPSO-A.
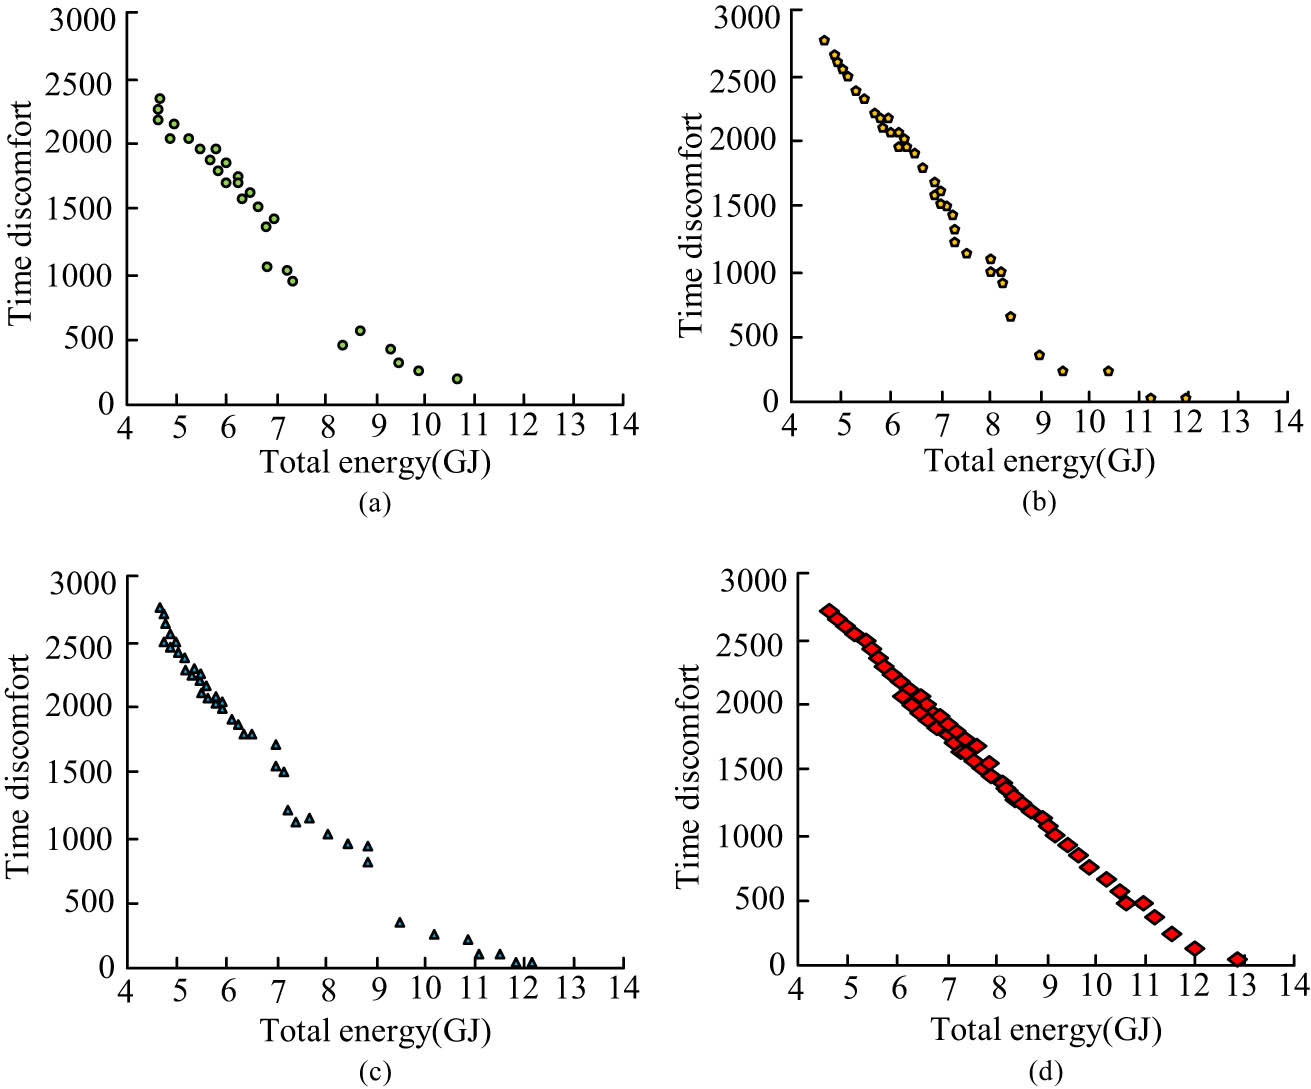
Comparison of Pareto values of three algorithms: (a) NSGA-II, (b) MOABC, (c) MOPSO, and (d) BBMOPSO-A.
In Figure 7, the Pareto of three algorithms shows a scattered downward trend with an overall curve. When the total energy increases, except for BBMOPSO-A, the values of the three algorithms show a complete linear variation curve in the early stage of the total energy increase. After increasing the total energy, the changes began to show irregular scattered changes. When the total time discomfort reaches 0, only BBMOPSO-A has a maximum total energy of 13 GJ among the three algorithms. NSGA-II did not reach the minimum time discomfort level, with a total energy of 10.9 GJ, which is 2.1 GJ lower than BBMOPSO-A. Therefore, the convergence of BBMOPSO-A is superior to the other three algorithms, indicating that it has more advantages in processing BEC. This may be due to the model using too many objective methods to optimize the energy of the building. To compare the performance, HV (hypervolume, a measure of the quality of the solution set used in multi-objective optimization) values are tested in Table 1.
Comparison of HV values of algorithms
| Algorithm | HV (best) | HV (worst) | HV (average) | HV (Std) | T-test | Time (h) |
|---|---|---|---|---|---|---|
| NSGA-II | 29,645 | 15,116 | 21,546 | 6,284 | R+ | 1.7 |
| MOABC | 29,102 | 28,360 | 27,869 | 1,009 | R+ | 2.2 |
| MOPSO | 29,940 | 23,084 | 27,154 | 3,508 | R+ | 1.9 |
| BBMOPSO-A | 31,145 | 28,086 | 29,451 | 1,697 | — | 1.3 |
In Table 1, the optimal solutions for the HV values of the four algorithms exhibit the highest performance of 31,145 in BBMOPSO-A and the lowest value is 29,102 in MOABC. The difference in optimal solutions between the two is 2043. The lowest value of HV at NSGA-II is 15116, and the highest value at BBMOPSO-A is 28086, with a difference of 12970 between them. The average value of HV is 29451 at BBMOPSO-A, and 21546 at NSGA-II, with a difference of 7905 between them. The standard deviation of the HV value is relatively large. The minimum standard deviation at MOABC is 1009, and the value at BBMOPSO-A is 1697. The difference between them is 688. In summary, the feasibility of BEC is compared through HV. BBMOPSO-A has the largest HV in each data, and the standard deviation value is relatively small. Therefore, BBMOPSO-A has more advantages in BEC. Figure 8 shows the accuracy of traditional SMOPSO/D and BBMOPSO-A proxy models.
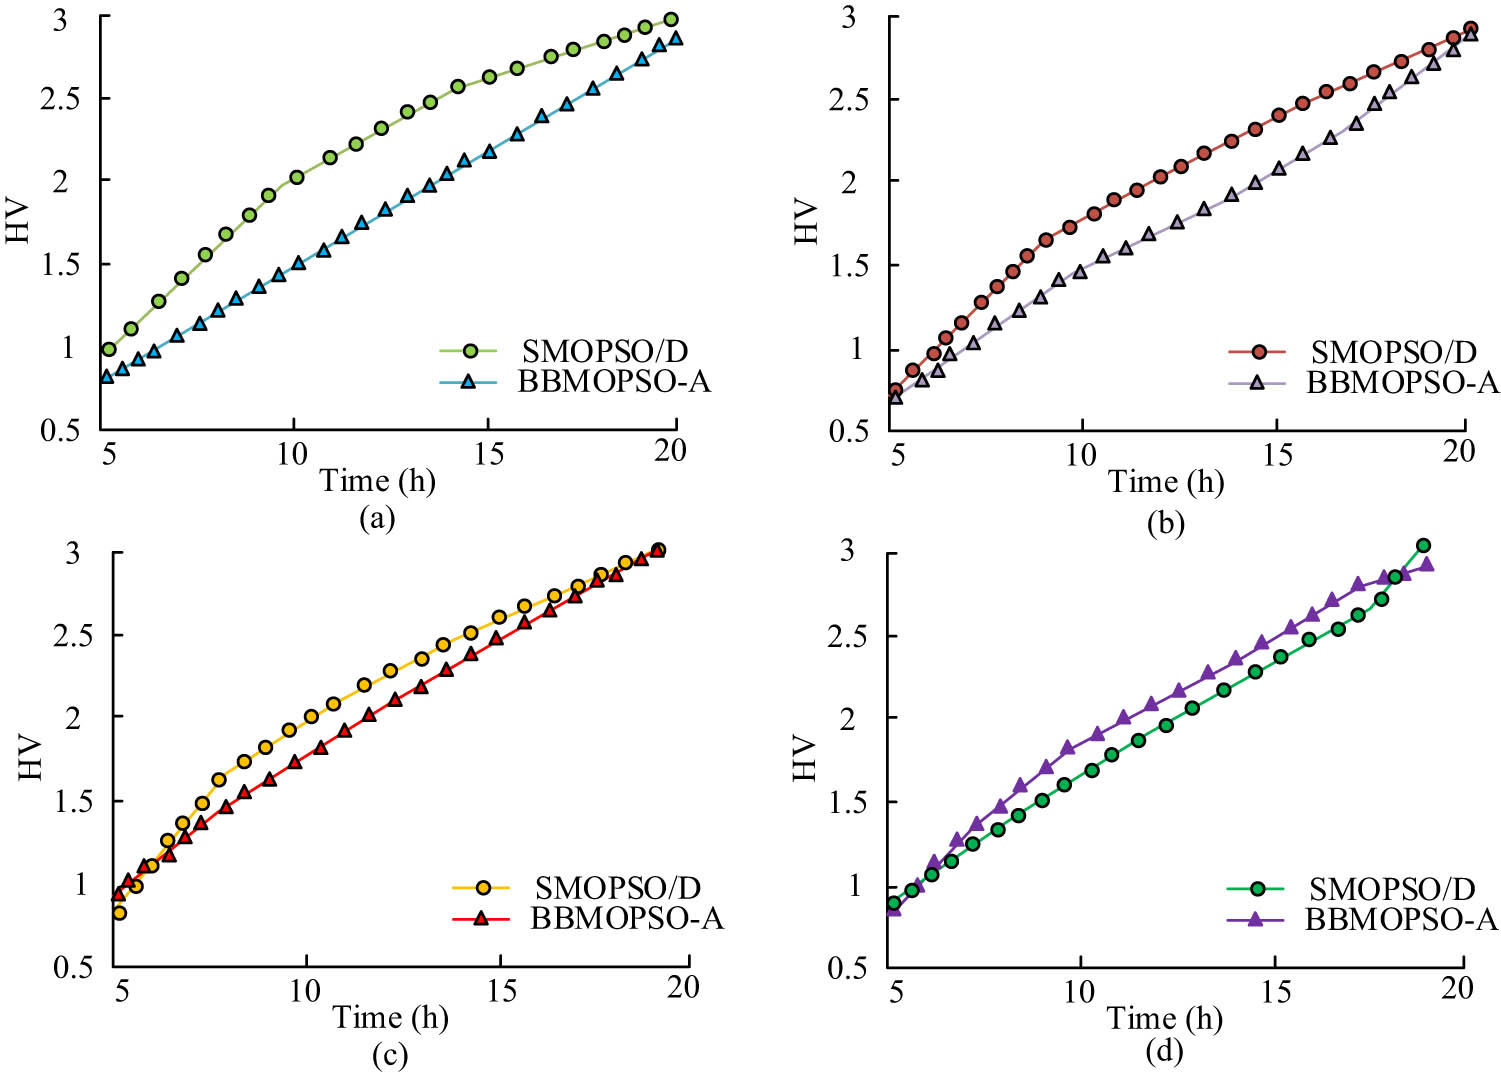
HV of four different building samples: (a) building sample 1, (b) building sample 2, (c) building sample 3, and (d) building sample 4.
In Figure 8, among four types of building HV values, the curves are parabolic, with HV continuously increasing over time. The proxy model HV variation curve of BBMOPSO-A is higher among four different buildings. In building Model 4, the HV of the SMOPSO/D model exceeded that of BBMOPSO-A at time 17.5 H, indicating that the HV of the BBMOPSO-A proxy model is higher when compared with different BECs. The HV value of the BBMOPSO-A model is lower, which may be due to the inclusion of decision management prediction methods in the model. Figure 9 compares the accuracy of four algorithms.
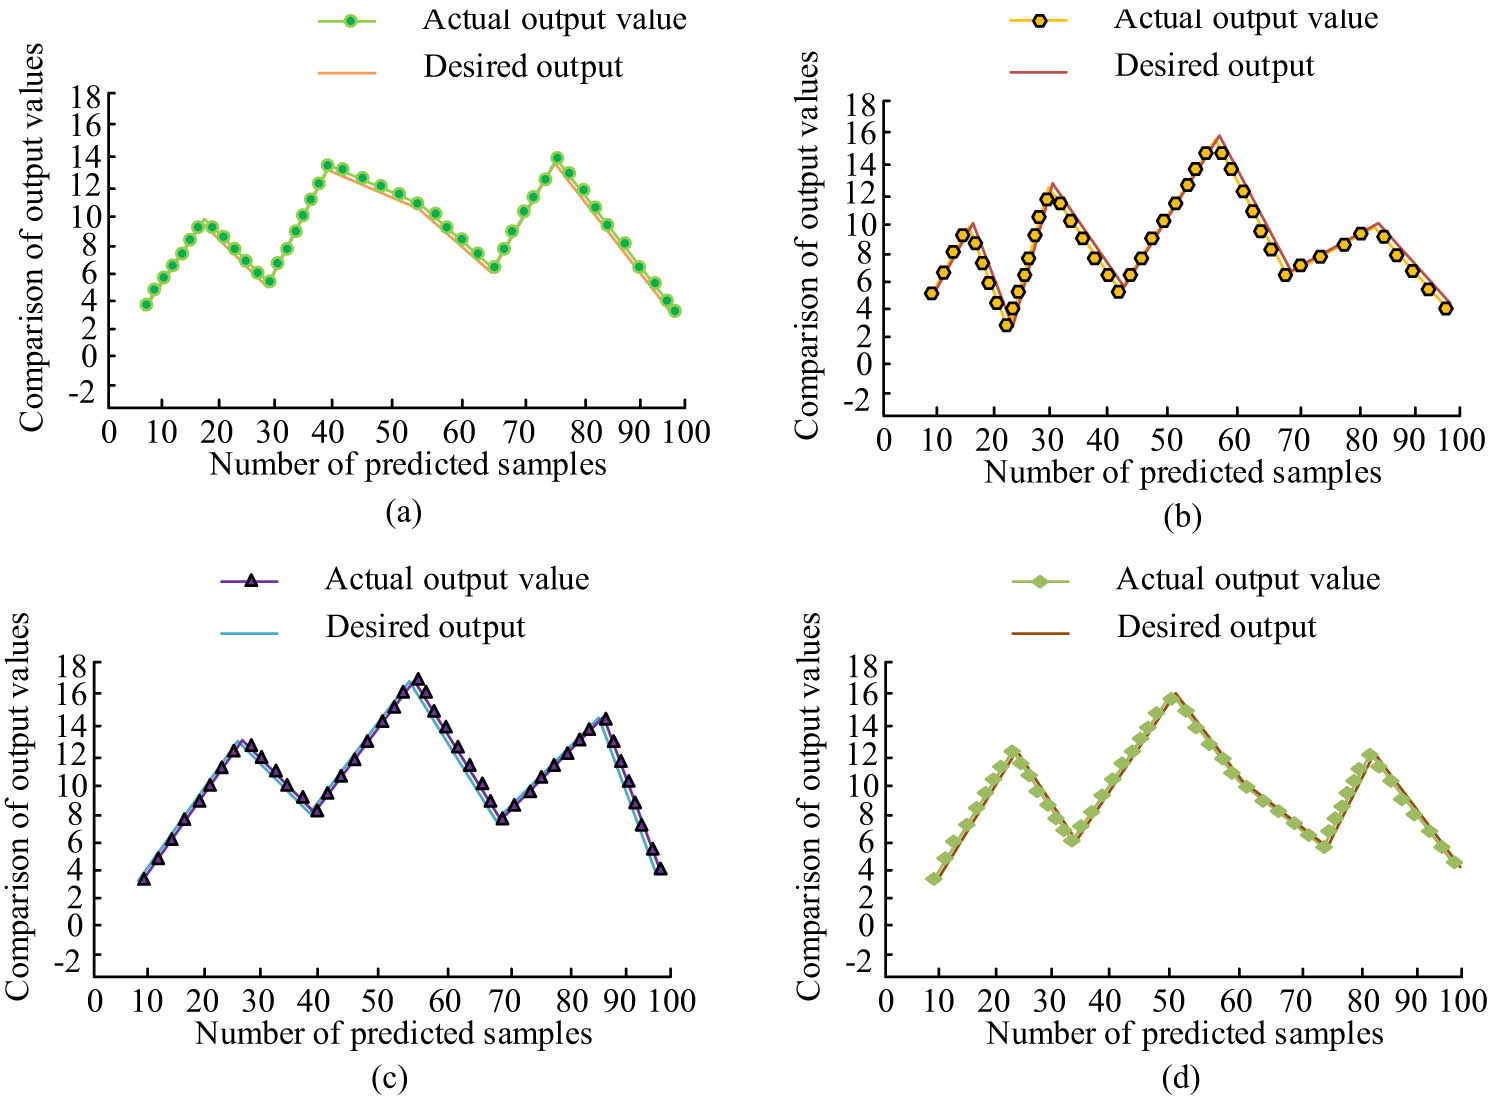
Comparison of the precision of four algorithms: (a) NSGA-II neural network test sample output value, (b) MOABC neural network test sample output value, (c) MOPSO neural network test sample output value, and (d) BBMOPSO-A neural network test sample output value.
In Figure 9, as samples increase, the true and predicted values of these algorithms show a fluctuating trend. For accuracy, NSGA-II is 91.23%, MOABC is 92.53%, MOPSO is 93.58%, and BBMOPSO-A is 96.25%. BBMOPSO-A is 5.02% higher than NSGA-II, 3.72% higher than MOABC, and 2.67% higher than MOPSO. The accuracy of BBMOPSO-A and the other three algorithms in different BEC sample data is compared. Compared to other algorithms, the performance is better, which may be due to the addition of radial functions in the model to improve its performance. BBMOPSO-A has the highest accuracy, reaching 96.25%, which is 5.02, 3.72, and 2.67% higher than NSGA-II, MOABC, and MOPSO, respectively. The higher the accuracy of the BBMOPSA algorithm, the smaller the difference between the algorithm result and the true optimal solution, i.e., the smaller the convergence error. Therefore, it can be concluded that BBMOPSO-A, due to its high accuracy, can have the smallest convergence error during the optimization process and be closer to the global optimal solution, while other algorithms have relatively higher convergence errors [34]. Figure 10 shows the comparison of energy consumption accuracy of algorithm building samples.
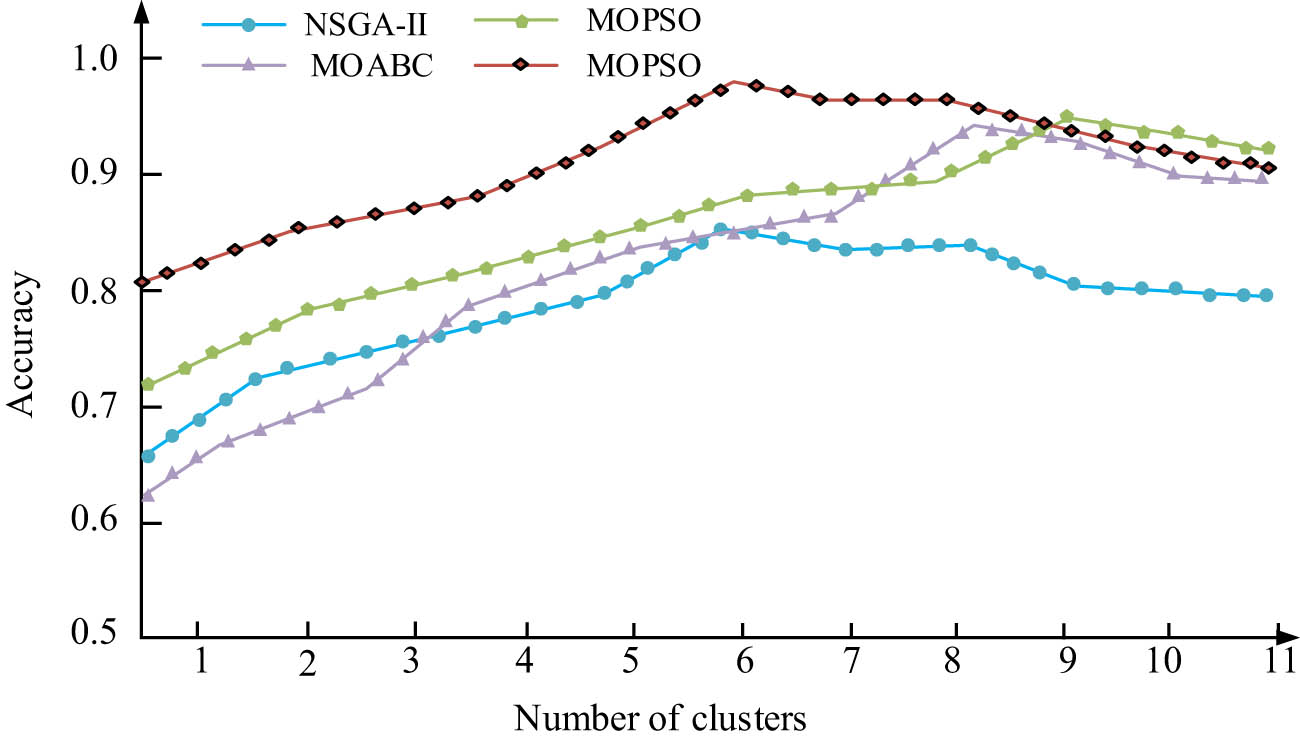
Comparison of accuracy of four algorithms.
In Figure 10, the trend of the four algorithms is that their accuracy increases with samples increasing. When the samples of NSGA-II increase to 6, its overall accuracy changes to a maximum value of 0.86. The accuracy of MOABC is slightly higher than that of NSGA-II, reaching the highest accuracy of 0.91 when the sample size is 8. The accuracy of MOPSO reached its highest value of 0.92 when the sample size is 9. BBMOPSO-A reaches its highest value of 0.95 when the sample is 6. The accuracy of BBMOPSO-A is the highest among the four algorithms, 0.09 higher than NSGA-II, 0.04 higher than MOABC0.04, and 0.3 higher than MOPSO0.3. This may be due to the addition of multiple different modules in BBMOPSO-A, which improves the overall performance of the algorithm. The iteration and loss functions of the four algorithms are compared in Figure 11.
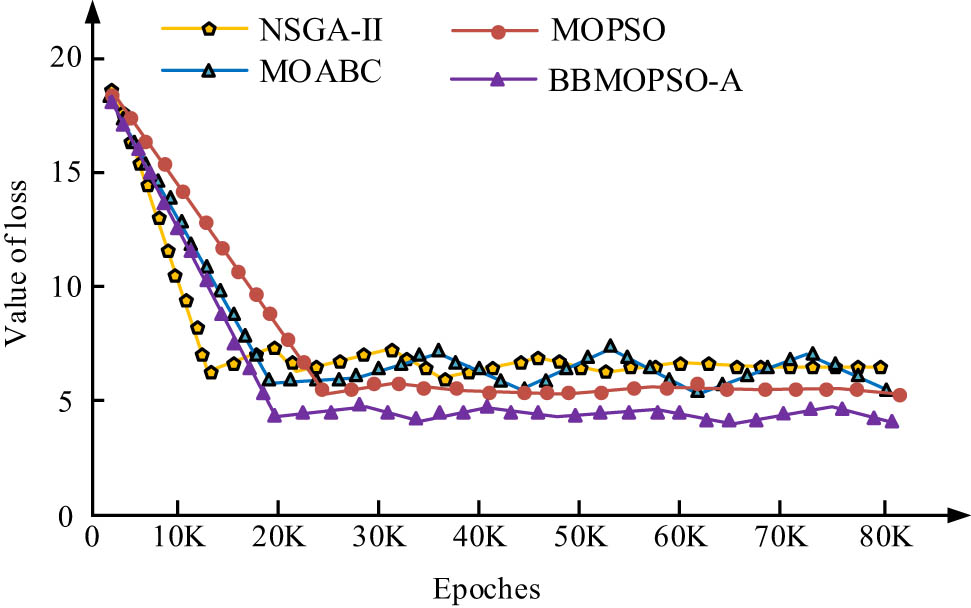
Comparison of loss function of four algorithms.
In Figure 11, as the iteration increases, the loss functions of four algorithms first show a decreasing trend. When the iteration reaches a certain value, the loss function no longer shows a sudden downward trend. The loss function of NSGA-II decreases to the lowest range at an iteration of 15k. At this time, its loss function changes around 6. When the iteration of MOABC reaches 20k, the loss function no longer shows a downward trend, and its value changes at 5.8. When the iteration of MOPSO reaches 25k, the loss function no longer shows a sudden downward trend, and its value is 5.5. When the iteration of BBMOPSO-A is 20k, the loss function no longer shows a sudden downward trend, and its value at this time is 4. Therefore, the loss function value of BBMOPSO-A is the smallest, and the algorithm is more stable. Moreover, this algorithm is 2 lower than NSGA-II, 1.8 lower than MOABC, and 1.5 lower than MOPSO. After about 20k iterations, the loss function value of BBMOPSO-A tends to stabilize at a minimum of 4, indicating that its convergence error is the smallest and the optimization result is closest to the objective. In contrast, the loss function values of NSGA-II, MOABC, and MOPSO are 6, 5.8, and 5.5, respectively, with larger convergence errors. This indicates that BBMOPSO-A has higher stability and optimization accuracy in optimizing BEC problems.
4 Conclusion
This study mainly focused on the optimization design of public building models in rural revitalization, mainly through BEC. Through the study of big data algorithms, a new BBMOPSO-A model was constructed, and the constructed model was replaced by proxy models to reduce the cost. Finally, the feasibility of the algorithm and the precision and accuracy of this algorithm model were demonstrated through experiments. The BBMOPSO-A introduced innovative strategies to address the multi-objectivity of BEC by incorporating new local and individual extreme points, thus enhancing the exploration capabilities of the PSO framework. By integrating agent-assisted agent models, the original computationally intensive models were effectively replaced without compromising the quality of performance, thus significantly reducing the computational cost. The accuracy of BBMOPSO-A was 5.02% higher than NSGA-II, 3.72% higher than MOABC, and 2.67% higher than MOPSO. Meanwhile, the algorithm model was 0.09 higher than NSGA-II, 0.04 higher than MOABC, and 0.3 higher than MOPSO. The loss function of BBMOPSO-A was 2% lower than NSGA-II, 1.8 lower than MOABC, and 1.5 lower than MOPSO. Therefore, the BBMOPSO-A model was more stable, accurate, and suitable for optimizing the design of BEC. The BBMOPSO-A was validated in several building types to optimize energy consumption for energy efficiency improvement in rural development projects. The study provides data-driven decision support for BEC through big data. However, future testing of the dataset needs to be expanded, while testing should cover more building types and environmental conditions. Moreover, its integration with technologies such as artificial intelligence and the Internet of Things should be explored in order to expand the potential for the application of smart building management.
-
Funding information: The author states no funding is involved.
-
Author contribution: Lei Wang completed the data collection and organization and wrote the manuscript. Author has accepted responsibility for the entire content of this manuscript and approved its submission.
-
Conflict of interest: The author states no conflict of interest.
-
Data availability statement: All data generated or analyzed during this study are included in this published article.
References
[1] Lei L, Chen W, Wu B, Chen C, Liu W. A building energy consumption prediction model based on rough set theory and deep learning algorithms. Energy Build. 2021;24(1):2–20.10.1016/j.enbuild.2021.110886Search in Google Scholar
[2] Fan B, Xing X. Intelligent prediction method of building energy consumption based on deep learning. Sci Program. 2021;2021(Pt.14):10–9.10.1155/2021/3323316Search in Google Scholar
[3] Chen L, Zheng X, Yang J, Yoon JH. Impact of BIPV windows on building energy consumption in street canyons: Model development and validation. Energy Build. 2021;249(4):11–27.10.1016/j.enbuild.2021.111207Search in Google Scholar
[4] Oh M, Jang KM, Kim Y. Empirical analysis of building energy consumption and urban form in a large city: A case of Seoul, South Korea. Energy Build. 2021;245:111046.10.1016/j.enbuild.2021.111046Search in Google Scholar
[5] Parida SP, Jena PC, Swain M, Shadangi KP. Fabrication of geopolymer composites using egg-shell and fly-ash: Comparison between the strength and stability, physio-chemical and mechanical properties. Process Saf Environ Prot. 2024;187(1):1140–9.10.1016/j.psep.2024.05.020Search in Google Scholar
[6] Parida SP, Mishra D, Padhy RL, Jena PC, Das SR, Basem AA, et al. Effect of alkali treatment on mechanical and buckling behaviour of natural fiber reinforced composite cylinder. ES Mater Manuf. 2024;1161(24):1–11.10.30919/esmm1161Search in Google Scholar
[7] Sahoo S, Parida SP, Jena PC. Dynamic response of a laminated hybrid composite cantilever beam with multiple cracks & moving mass. Structural Engineering and Mechanics. An Int’l J. 2023;87(6):529–40.Search in Google Scholar
[8] Li J, Zhang C, Zhao Y, Qiu W, Chen Q, Zhang X. Federated learning-based short-term building energy consumption prediction method for solving the data silos problem. Build Simul (Engl). 2022;15(6):1145–59.10.1007/s12273-021-0871-ySearch in Google Scholar
[9] Zhang K. Energy-saving parameterized design of buildings based on genetic algorithm. Int J Build Pathol Adapt. 2020;38(5):785–95.10.1108/IJBPA-05-2019-0050Search in Google Scholar
[10] Mu X. Discussion on energy saving technology of building heating ventilation air conditioning. World Archit (Baitu). 2020;4(2):4–8.10.26689/jwa.v4i2.1137Search in Google Scholar
[11] Liu X, Sun H, Han S, Han S, Niu S, Qin W, et al. A data mining research on office building energy pattern based on time-series energy consumption data. Energy Build. 2022;259(Mar):20–39.10.1016/j.enbuild.2022.111888Search in Google Scholar
[12] Zhao Q. A short-term prediction method of building energy consumption based on gradient progressive regression tree. Int J Glob Energy Issues. 2022;44(2):182–97.10.1504/IJGEI.2022.121404Search in Google Scholar
[13] Wenninger S, Kaymakci C, Wiethe C. Explainable long-term building energy consumption prediction using QLattice. Appl Energy. 2022;308(10):1–13.10.1016/j.apenergy.2021.118300Search in Google Scholar
[14] Rongfang C. Energy consumption and cost control method of engineering projects based on building energy-saving theory. Int J Glob Energy Issues. 2021;43(1):79–97.10.1504/IJGEI.2021.113455Search in Google Scholar
[15] Sun J, Liu G, Sun B, Xiao G. Light-stacking strengthened fusion based building energy consumption prediction framework via variable weight feature selection. Appl Energy. 2021;303(11):1–14.10.1016/j.apenergy.2021.117694Search in Google Scholar
[16] Shen Y, Hu Y, Cheng K, Yan H, Cai K, Hua J, et al. Utilizing interpretable stacking ensemble learning and NSGA-III for the prediction and optimisation of building photo-thermal environment and energy consumption. Build Simul. 2024;17(5):819–38.10.1007/s12273-024-1108-7Search in Google Scholar
[17] Markarian E, Qiblawi S, Krishnan S, Divakaran A, Ramalingam Rethnam O, Thomas A, et al. Informing building retrofits at low computational costs: A multi-objective optimisation using machine learning surrogates of building performance simulation models. J Build Perform Simul. 2024;31(6):1–7.10.1080/19401493.2024.2384487Search in Google Scholar
[18] Zhong J, Zhang P, Wang L. An energy consumption calculation model of prefabricated building envelope system based on BIM technology. Int J Glob Energy Issues. 2022;44(2):121–38.10.1504/IJGEI.2022.121403Search in Google Scholar
[19] Roy AM, Venkatesan RP, Shanmugapriya T. Simulation and analysis of a factory building’s energy consumption using eQuest software. Chem Eng Technol. 2021;44(5):928–33.10.1002/ceat.202000489Search in Google Scholar
[20] Peng B, Zou HM, Bai PF, Feng YY. Building energy consumption prediction and energy control of large-scale shopping malls based on a noncentralized self-adaptive energy management control system. Energy Explor Exploit. 2020;39(5):1381–93.10.1177/0144598720920731Search in Google Scholar
[21] Sun X. Design of building energy consumption monitoring model based on parallel cloud computing. Int J Glob Energy Issues. 2020;42(6):457–69.10.1504/IJGEI.2020.111174Search in Google Scholar
[22] Jahani E, Cetin K, Cho IH. City-scale single family residential building energy consumption prediction using genetic algorithm-based numerical moment matching technique. Build Environ. 2020;172(6):2–11.10.1016/j.buildenv.2020.106667Search in Google Scholar
[23] Kumar S, Kumar S, Das P. Second-order a priori and a posteriori error estimations for integral boundary value problems of nonlinear singularly perturbed parameterized form. Numer Algor. 2024;17(8):1–5.10.1007/s11075-024-01918-5Search in Google Scholar
[24] Wang R, Lu S, Feng W. A novel improved model for building energy consumption prediction based on model integration. Appl Energy. 2020;262(5):1388–401.10.1016/j.apenergy.2020.114561Search in Google Scholar
[25] Kim YU, Yang S, Yun BY, Kim S. Evaluation of energy consumption in apartment buildings with biochar and phase‐change material aggregate‐applied artificial stone finishing materials. Int J Energy Res. 2022;46(9):12772–86.10.1002/er.8043Search in Google Scholar
[26] Choudhuri S, Adeniye S, Sen A. Distribution alignment using complement entropy objective and adaptive consensus-based label refinement for partial domain adaptation. Artif Intell Appl. 2023;1(1):43–51.10.47852/bonviewAIA2202524Search in Google Scholar
[27] Shiromani R, Shanthi V, Das P. A higher order hybrid-numerical approximation for a class of singularly perturbed two-dimensional convection-diffusion elliptic problem with non-smooth convection and source terms. Computers Math Appl. 2023;142(6):9–30.10.1016/j.camwa.2023.04.004Search in Google Scholar
[28] Sarkar D, Kumar S, Das P, Ramos H. Higher-order convergence analysis for interior and boundary layers in a semi-linear reaction-diffusion system networked by a $ k $-star graph with non-smooth source terms. Netw Heterog Media. 2024;19(3):1085–115.10.3934/nhm.2024048Search in Google Scholar
[29] Kumar S, Das P. A uniformly convergent analysis for multiple scale parabolic singularly perturbed convection-diffusion coupled systems: Optimal accuracy with less computational time. Appl Numer Math. 2025;207(1):534–57.10.1016/j.apnum.2024.09.020Search in Google Scholar
[30] Santra S, Mohapatra J, Das P, Choudhuri D. Higher order approximations for fractional order integro-parabolic partial differential equations on an adaptive mesh with error analysis. Computers Math Appl. 2023;150(10):87–101.10.1016/j.camwa.2023.09.008Search in Google Scholar
[31] Choudhary R, Singh S, Das P, Kumar D. A higher order stable numerical approximation for time‐fractional non‐linear Kuramoto–Sivashinsky equation based on quintic B B‐spline. Math Methods Appl Sci. 2024;47(15):11953–75.10.1002/mma.9778Search in Google Scholar
[32] Srivastava HM, Nain AK, Vats RK, Das P. A theoretical study of the fractional-order p-Laplacian nonlinear Hadamard type turbulent flow models having the Ulam–Hyers stability. Revista de la Real Academia de Ciencias Exactas, Físicas y Naturales Serie A Matemáticas. 2023;117(4):160–1.10.1007/s13398-023-01488-6Search in Google Scholar
[33] Das P, Rana S, Ramos H. A perturbation-based approach for solving fractional-order Volterra–Fredholm integro differential equations and its convergence analysis. Int J Computer Math. 2020;97(10):1994–2014.10.1080/00207160.2019.1673892Search in Google Scholar
[34] Chandru M, Prabha T, Das P, Shanthi V. A numerical method for solving boundary and interior layers dominated parabolic problems with discontinuous convection coefficient and source terms. Differ Equ Dyn Syst. 2019;27:91–112.10.1007/s12591-017-0385-3Search in Google Scholar
© 2025 the author(s), published by De Gruyter
This work is licensed under the Creative Commons Attribution 4.0 International License.
Articles in the same Issue
- Research Articles
- Generalized (ψ,φ)-contraction to investigate Volterra integral inclusions and fractal fractional PDEs in super-metric space with numerical experiments
- Solitons in ultrasound imaging: Exploring applications and enhancements via the Westervelt equation
- Stochastic improved Simpson for solving nonlinear fractional-order systems using product integration rules
- Exploring dynamical features like bifurcation assessment, sensitivity visualization, and solitary wave solutions of the integrable Akbota equation
- Research on surface defect detection method and optimization of paper-plastic composite bag based on improved combined segmentation algorithm
- Impact the sulphur content in Iraqi crude oil on the mechanical properties and corrosion behaviour of carbon steel in various types of API 5L pipelines and ASTM 106 grade B
- Unravelling quiescent optical solitons: An exploration of the complex Ginzburg–Landau equation with nonlinear chromatic dispersion and self-phase modulation
- Perturbation-iteration approach for fractional-order logistic differential equations
- Variational formulations for the Euler and Navier–Stokes systems in fluid mechanics and related models
- Rotor response to unbalanced load and system performance considering variable bearing profile
- DeepFowl: Disease prediction from chicken excreta images using deep learning
- Channel flow of Ellis fluid due to cilia motion
- A case study of fractional-order varicella virus model to nonlinear dynamics strategy for control and prevalence
- Multi-point estimation weldment recognition and estimation of pose with data-driven robotics design
- Analysis of Hall current and nonuniform heating effects on magneto-convection between vertically aligned plates under the influence of electric and magnetic fields
- A comparative study on residual power series method and differential transform method through the time-fractional telegraph equation
- Insights from the nonlinear Schrödinger–Hirota equation with chromatic dispersion: Dynamics in fiber–optic communication
- Mathematical analysis of Jeffrey ferrofluid on stretching surface with the Darcy–Forchheimer model
- Exploring the interaction between lump, stripe and double-stripe, and periodic wave solutions of the Konopelchenko–Dubrovsky–Kaup–Kupershmidt system
- Computational investigation of tuberculosis and HIV/AIDS co-infection in fuzzy environment
- Signature verification by geometry and image processing
- Theoretical and numerical approach for quantifying sensitivity to system parameters of nonlinear systems
- Chaotic behaviors, stability, and solitary wave propagations of M-fractional LWE equation in magneto-electro-elastic circular rod
- Dynamic analysis and optimization of syphilis spread: Simulations, integrating treatment and public health interventions
- Visco-thermoelastic rectangular plate under uniform loading: A study of deflection
- Threshold dynamics and optimal control of an epidemiological smoking model
- Numerical computational model for an unsteady hybrid nanofluid flow in a porous medium past an MHD rotating sheet
- Regression prediction model of fabric brightness based on light and shadow reconstruction of layered images
- Dynamics and prevention of gemini virus infection in red chili crops studied with generalized fractional operator: Analysis and modeling
- Qualitative analysis on existence and stability of nonlinear fractional dynamic equations on time scales
- Review Article
- Haar wavelet collocation method for existence and numerical solutions of fourth-order integro-differential equations with bounded coefficients
- Special Issue: Nonlinear Analysis and Design of Communication Networks for IoT Applications - Part II
- Silicon-based all-optical wavelength converter for on-chip optical interconnection
- Research on a path-tracking control system of unmanned rollers based on an optimization algorithm and real-time feedback
- Analysis of the sports action recognition model based on the LSTM recurrent neural network
- Industrial robot trajectory error compensation based on enhanced transfer convolutional neural networks
- Research on IoT network performance prediction model of power grid warehouse based on nonlinear GA-BP neural network
- Interactive recommendation of social network communication between cities based on GNN and user preferences
- Application of improved P-BEM in time varying channel prediction in 5G high-speed mobile communication system
- Construction of a BIM smart building collaborative design model combining the Internet of Things
- Optimizing malicious website prediction: An advanced XGBoost-based machine learning model
- Economic operation analysis of the power grid combining communication network and distributed optimization algorithm
- Sports video temporal action detection technology based on an improved MSST algorithm
- Internet of things data security and privacy protection based on improved federated learning
- Enterprise power emission reduction technology based on the LSTM–SVM model
- Construction of multi-style face models based on artistic image generation algorithms
- Special Issue: Decision and Control in Nonlinear Systems - Part II
- Animation video frame prediction based on ConvGRU fine-grained synthesis flow
- Application of GGNN inference propagation model for martial art intensity evaluation
- Benefit evaluation of building energy-saving renovation projects based on BWM weighting method
- Deep neural network application in real-time economic dispatch and frequency control of microgrids
- Real-time force/position control of soft growing robots: A data-driven model predictive approach
- Mechanical product design and manufacturing system based on CNN and server optimization algorithm
- Application of finite element analysis in the formal analysis of ancient architectural plaque section
- Research on territorial spatial planning based on data mining and geographic information visualization
- Fault diagnosis of agricultural sprinkler irrigation machinery equipment based on machine vision
- Closure technology of large span steel truss arch bridge with temporarily fixed edge supports
- Intelligent accounting question-answering robot based on a large language model and knowledge graph
- Analysis of manufacturing and retailer blockchain decision based on resource recyclability
- Flexible manufacturing workshop mechanical processing and product scheduling algorithm based on MES
- Exploration of indoor environment perception and design model based on virtual reality technology
- Tennis automatic ball-picking robot based on image object detection and positioning technology
- A new CNN deep learning model for computer-intelligent color matching
- Design of AR-based general computer technology experiment demonstration platform
- Indoor environment monitoring method based on the fusion of audio recognition and video patrol features
- Health condition prediction method of the computer numerical control machine tool parts by ensembling digital twins and improved LSTM networks
- Establishment of a green degree evaluation model for wall materials based on lifecycle
- Quantitative evaluation of college music teaching pronunciation based on nonlinear feature extraction
- Multi-index nonlinear robust virtual synchronous generator control method for microgrid inverters
- Manufacturing engineering production line scheduling management technology integrating availability constraints and heuristic rules
- Analysis of digital intelligent financial audit system based on improved BiLSTM neural network
- Attention community discovery model applied to complex network information analysis
- A neural collaborative filtering recommendation algorithm based on attention mechanism and contrastive learning
- Rehabilitation training method for motor dysfunction based on video stream matching
- Research on façade design for cold-region buildings based on artificial neural networks and parametric modeling techniques
- Intelligent implementation of muscle strain identification algorithm in Mi health exercise induced waist muscle strain
- Optimization design of urban rainwater and flood drainage system based on SWMM
- Improved GA for construction progress and cost management in construction projects
- Evaluation and prediction of SVM parameters in engineering cost based on random forest hybrid optimization
- Museum intelligent warning system based on wireless data module
- Special Issue: Nonlinear Engineering’s significance in Materials Science
- Experimental research on the degradation of chemical industrial wastewater by combined hydrodynamic cavitation based on nonlinear dynamic model
- Study on low-cycle fatigue life of nickel-based superalloy GH4586 at various temperatures
- Some results of solutions to neutral stochastic functional operator-differential equations
- Ultrasonic cavitation did not occur in high-pressure CO2 liquid
- Research on the performance of a novel type of cemented filler material for coal mine opening and filling
- Testing of recycled fine aggregate concrete’s mechanical properties using recycled fine aggregate concrete and research on technology for highway construction
- A modified fuzzy TOPSIS approach for the condition assessment of existing bridges
- Nonlinear structural and vibration analysis of straddle monorail pantograph under random excitations
- Achieving high efficiency and stability in blue OLEDs: Role of wide-gap hosts and emitter interactions
- Construction of teaching quality evaluation model of online dance teaching course based on improved PSO-BPNN
- Enhanced electrical conductivity and electromagnetic shielding properties of multi-component polymer/graphite nanocomposites prepared by solid-state shear milling
- Optimization of thermal characteristics of buried composite phase-change energy storage walls based on nonlinear engineering methods
- A higher-performance big data-based movie recommendation system
- Nonlinear impact of minimum wage on labor employment in China
- Nonlinear comprehensive evaluation method based on information entropy and discrimination optimization
- Application of numerical calculation methods in stability analysis of pile foundation under complex foundation conditions
- Research on the contribution of shale gas development and utilization in Sichuan Province to carbon peak based on the PSA process
- Characteristics of tight oil reservoirs and their impact on seepage flow from a nonlinear engineering perspective
- Nonlinear deformation decomposition and mode identification of plane structures via orthogonal theory
- Numerical simulation of damage mechanism in rock with cracks impacted by self-excited pulsed jet based on SPH-FEM coupling method: The perspective of nonlinear engineering and materials science
- Cross-scale modeling and collaborative optimization of ethanol-catalyzed coupling to produce C4 olefins: Nonlinear modeling and collaborative optimization strategies
- Unequal width T-node stress concentration factor analysis of stiffened rectangular steel pipe concrete
- Special Issue: Advances in Nonlinear Dynamics and Control
- Development of a cognitive blood glucose–insulin control strategy design for a nonlinear diabetic patient model
- Big data-based optimized model of building design in the context of rural revitalization
- Multi-UAV assisted air-to-ground data collection for ground sensors with unknown positions
- Design of urban and rural elderly care public areas integrating person-environment fit theory
- Application of lossless signal transmission technology in piano timbre recognition
- Application of improved GA in optimizing rural tourism routes
- Architectural animation generation system based on AL-GAN algorithm
- Advanced sentiment analysis in online shopping: Implementing LSTM models analyzing E-commerce user sentiments
- Intelligent recommendation algorithm for piano tracks based on the CNN model
- Visualization of large-scale user association feature data based on a nonlinear dimensionality reduction method
- Low-carbon economic optimization of microgrid clusters based on an energy interaction operation strategy
- Optimization effect of video data extraction and search based on Faster-RCNN hybrid model on intelligent information systems
- Construction of image segmentation system combining TC and swarm intelligence algorithm
- Particle swarm optimization and fuzzy C-means clustering algorithm for the adhesive layer defect detection
- Optimization of student learning status by instructional intervention decision-making techniques incorporating reinforcement learning
- Fuzzy model-based stabilization control and state estimation of nonlinear systems
- Optimization of distribution network scheduling based on BA and photovoltaic uncertainty
- Tai Chi movement segmentation and recognition on the grounds of multi-sensor data fusion and the DBSCAN algorithm