Spatiotemporal variation pattern and spatial coupling relationship between NDVI and LST in Mu Us Sandy Land
-
Liangyan Yang
 ,
Lei Shi
,
Lei Shi

Abstract
Normalized difference vegetation index (NDVI) and land surface temperature (LST) are important indicators of ecological changes, and their spatial and temporal variations and spatial coupling can provide a theoretical basis for the sustainable development of the ecological environment. Based on the MOD13A1 and MOD11A2 datasets, the spatial distribution characteristics of NDVI and LST from 2000 to 2020 were analyzed, and the trend change slope method and spatial coupling model were used to calculate the significant changes. Finally, the spatial coupling model was used to calculate the spatial coupling degree between NDVI and LST. The study shows that: (1) From 2000 to 2020, the annual NDVI value of the Mu Us Sandy Land was between 0.25 and 0.43, showing a stable upward trend overall, with an increase rate of 0.074/(10a). The proportion of improvement areas in the study area is 81.48%. (2) There are significant differences in the spatial distribution of surface temperature in Mu Us Sandy Land, showing an overall trend of decreasing from northwest to southeast and higher in the west than in the east. The LST of Mu Us Sandy Land is greatly affected by changes in land use types. The spatiotemporal variation trend of LST is different from the gradual warming trend of global climate change. The main reason is that human activities have changed land use types and increased local vegetation coverage. (3) There is a significant negative correlation between LST and NDVI in Mu Us Sandy Land, with an R 2 of 0.5073 and passing the significance test at the 0.01 level. This indicates that ecological engineering policies can effectively reduce LST in the study area, thereby achieving the effect of improving the environment. The overall spatial coupling between LST and NDVI is at a very high level, with an average coupling degree of 0.895 in the study area. The two mainly exhibit a state of mutual antagonism in space, reflecting the importance of green vegetation in regulating regional climate and LST. The vegetation index and spatiotemporal variation of LST in Mu Us Sandy Land are the result of the joint influence of human activities and climate change, and human activities dominated from 2000 to 2020.
1 Introduction
Land surface temperature (LST) is an important parameter for studying energy and material exchange between the surface and atmosphere, playing an important role in regional and global surface ecosystems [1,2,3]. The variation of surface temperature at the regional scale is closely related to various environmental factors such as vegetation, hydrology, and climate [4,5,6]. It has been widely applied in urban heat island effects [7,8,9,10], ecological environment assessment [11,12], climate change [13,14,15], vegetation monitoring [16,17,18], and many other directions. The normalized difference vegetation index (NDVI) can be used to characterize the growth status of regional vegetation and is an important parameter for ecological environment assessment [19,20,21,22]. Among the environmental factors that affect surface temperature changes, vegetation is the most affected by human activities. Therefore, studying the response relationship between surface temperature and vegetation index is of great significance.
In recent years, due to the impact of global climate change and human activities, there have been significant changes in global biodiversity, ecosystems, and their services [23], and the ecological environment quality in arid and semi-arid areas has also fluctuated. The relationship between LST and NDVI, as important parameters in ecological environment change research, is one of the hot topics in ecology. The rapid development of remote sensing technology and the widespread application of satellite data provide abundant data sources for obtaining regional surface temperature and vegetation indices. At present, domestic and foreign scholars mainly use remote sensing technology to study the spatiotemporal variation characteristics of long-time series of LST and NDVI at the regional scale [24,25], influencing factors research [26], and correlation analysis [27,28]. Such as Ebrahim et al. [29] used Moderate Resolution Imaging Spectrometer (MODIS) data to analyze the spatiotemporal changes of LST in central Italy through Sen’s slope and nonparametric Mann–Kendall trend test. The results showed that LST was significantly negatively correlated with altitude. Xuzhen et al. [30] used MODIS NDVI data and the Hurst index to study the temporal and spatial evolution trend and future sustainability of NDVI in the Lancang Mekong River Basin. The results showed that the NDVI in the study area generally showed a fluctuating upward trend, and there were differences in the growth rate of NDVI in different regions, with the highest growth rate in China. However, there is a relative lack of research on the coupling relationship between the two. LST and NDVI are the most important indicators in ecological environment research, and there is an interactive and coupled relationship between the two. On the one hand, surface temperature promotes or inhibits vegetation growth through the influence of solar radiation and underlying surface changes; on the other hand, vegetation can absorb solar radiation energy and release water vapor through transpiration to lower surface temperature. Therefore, studying the spatiotemporal variation patterns of LST and its spatial coupling relationship with NDVI can effectively reflect the trend of ecological environment change in the study area, which is of great significance in ecology and climate research. It can be used to analyze land use change, observe climate change, and evaluate the health status of ecosystems, which helps to provide a theoretical basis for improving regional ecological environment models.
The climate of Mu Us Sandy Land is arid, and the ecological environment is fragile, making it the most ecologically sensitive area in the agricultural pastoral ecotone of northwest China. Due to the influence of China’s ecological policies and human activities, the vegetation coverage of Mu Us Sandy Land has undergone significant changes. The continuous monitoring of surface temperature and the analysis of its spatial coupling relationship with the vegetation index can provide theoretical support for the rational utilization of water resources and the restoration of the ecological environment in Mu Us Sandy Land. Therefore, the main contributions of this work are
Through MODIS LST, NDVI products and Trend change slope method, analyze the spatiotemporal distribution characteristics of LST and NDVI in Mu Us sandy land from 2000 to 2020.
Through the spatial coupling model, explore the spatial coupling relationship between land LST and NDVI.
Estimate the correlation between LST and NDVI.
Discuss the impact of meteorology, land use types, and vegetation changes on LST.
2 Materials and methods
2.1 Overview of the study area
Mu Us Sandy Land is located in the hinterland of the Loess Plateau, spanning the northern part of Yulin City, the southern part of Ordos City, and the northeastern part of Yanchi County (37.45°–39.37°N, 107.67°–110.67°E) (Figure 1). It covers an area of approximately 42,200 km2, with an average elevation of around 1,300 m, gradually increasing from east to west and reaching a maximum of 1,900 m in the southern part. The Mu Us Sandy Land is located in the transitional zone between arid and semi-arid regions and is a transitional zone between desert grasslands, grasslands, and forest grasslands in China, with a very fragile ecological environment [31,32,33]. The research area is mainly characterized by a temperature continental climate, with drought and uneven distribution of rainfall. Rainfall is mainly concentrated from June to August, with an annual precipitation of 250–440 mm, increasing from west to southeast. There are differences in the spatial distribution of water resources in the Mu Us Sandy Land, with drought and water scarcity in the northwest and abundant surface and groundwater in the southeast. There are numerous rivers, including the Wuding River, Tuwei River, and Kuye River, which run through the southeast of the sandy land, providing important guarantees for the ecological environment restoration and agricultural development in the southeast of Mu Us Sandy Land.

Geographic location and DEM of Mu Us Sandy Land.
2.2 Data sources and processing
This study used data from the MODIS surface temperature product, sourced from the MODIS/TERRA satellite MOD11A2 surface temperature 8 days composite product provided by NASA from 2000 to 2020, with a spatial resolution of 1 km (Table 1). The image row numbers covering the research area are H26V04 and H26V05, totaling 1,820 images. Using format conversion, projection transformation, concatenation, and cropping to obtain the 8 days composite surface temperature data of the study area, and then using the weighted average method to obtain monthly and annual surface temperature data of the Mu Us Sandy Land from 2000 to 2020. The calculation of remote sensing data was completed under ENVI 5.3 software. The NDVI data are sourced from MODIS 16 d composite data, consisting of a total of 786 images with row and column numbers H26V04 and H26V05. The spatial resolution is 500 m, and the temporal resolution is 16 days. Two images can be obtained per month, and the average of the two is taken as the vegetation index for the current month. Convert HDF format to TIFF format data using ENVI5.3 software and perform projection conversion, stitching, cropping, and resampling.
Source and description of research data
| Name and description | Period | Spatial and temporal resolution | Data sources |
|---|---|---|---|
| LST: MOD11A2 | 2000–2020 | 1,000 m | National Aeronautics and Space Administration (https://search.earthdata.nasa.gov/) |
| 8 days | |||
| NDVI: MOD13A1 | 2000–2020 | 500 m | National Aeronautics and Space Administration (https://search.earthdata.nasa.gov/) |
| 16 days | |||
| Meteorological data: China Surface Climate Normals Dataset | 2000–2020 | — | China Meteorological Data Network (https://data.cma.cn/) |
| 1 days | |||
| LULC: China Multi-Period Land Use Remote Sensing Monitoring Dataset | 2000–2020 | 1,000 m | Resource and Environmental Science Data Center of the Chinese Academy of Sciences (http://www.resdc.cn/) |
| 5 Year |
The meteorological data are sourced from the China Meteorological Data Network (https://data.cma.cn/). There are a total of six national meteorological stations in the research area, namely Hengshan Station (53,740), Jingbian Station (53,735), Dingbian Station (53,725), Yanchi Station (53,723), Yulin Station (53,646), and Etuoqi Station (53,529). The meteorological data include eight types of daily data such as surface temperature, temperature, and precipitation. The monthly and annual average temperature data of each station are obtained through statistical analysis, and the average temperature of six meteorological stations in Mu Us Sandy Land is calculated as the temperature of the study area. Land use and land cover (LULC) grid data are provided by the Resource and Environmental Science Data Center of the Chinese Academy of Sciences (http://www.resdc.cn/). The data production is based on Landsat series satellite data as the data source and is completed through image classification and manual visual interpretation [34]. The spatial resolution of the dataset is 1 km, including six primary types: cropland, woodland, grassland, water area, built-up land, and unused land.
2.3 Research methods
2.3.1 Maximum value synthesis method
Maximum value compositions is an internationally recognized method for NDVI data statistics. The maximum value synthesis method can eliminate interference from factors such as air pollution, clouds, and solar altitude angle and obtain the best NDVI value for vegetation growth in the study area. This study selected the NDVI values of Mu Us Sandy Land from January to December every year from 2000 to 2020 and took the average of two data periods per month as the vegetation index data for that month. Then, using the maximum value synthesis method, the maximum value of each pixel was extracted as the NDVI value for that year. The formula is
where NDVI i represents the NDVI value in the i-th year, with values ranging from 1 to 21, representing the years 2000–2020, respectively. NDVI ij represents the NDVI value in the j-th month of the i-th year, with values ranging from 1 to 12, representing the months 1–12, respectively.
2.3.2 Trend change slope method
The trend change slope method is a pixel scale-based trend analysis method widely used in the analysis of spatiotemporal changes of large-scale surface parameters. This article uses the trend change slope method to simulate the trend of surface temperature changes at the pixel scale in the study area, analyzes the spatial variation patterns of surface temperature at different periods in the Mu Us Sandy Land, and obtains the change slope of each pixel during the study time period. The interannual change trend of the pixel is judged by the magnitude of the slope. The calculation formula is referenced in [35]:
where Slope is the slope of the NDVI change trend and N is the number of years during the monitoring period. This study was divided into two time periods, 2000–2010 and 2010–2020, with a value of 11; NDVI i represents the vegetation index for the i-th year. When Slope >0, it indicates that vegetation growth tends to improve, while Slope <0 indicates that vegetation growth tends to deteriorate.
The significance of Slope will be further verified by the Mann–Kendall nonparametric statistical test [30], described as follows:
where n represents the time series length, sgn is a symbolic function, and the value range of the statistic Z can evaluate the significance of NDVI. In this study, the significance of the NDVI time series trend was judged at the 0.05 and 0.01 confidence levels. The definition of insignificant change is (|Z| < 1.96), the significant change is (1.96 < |Z| < 2.58), and the extremely significant change is |Z| > 2.58.
2.3.3 Spatial coupling model
Coupling is a concept in physics that refers to the phenomenon of two or more elements or systems interacting and influencing each other. The coupling degree is used to measure the degree of interaction between elements or systems. A spatial coupling model is selected to calculate the spatial coupling degree between NDVI and LST in Mu Us Sandy Land. The calculation formula is
In equation (3), C is the coupling degree; F(x) and g(x) are the normalized values of NDVI and LST at x, respectively. Referring to the literature [3], the spatial coupling index is divided into four levels, with coupling degrees [0, 0.3], (0.3, 0.5], (0.5, 0.8], and (0.8, 1.0) indicating extremely poor, poor, good, and excellent coupling effects, respectively.
2.3.4 Pearson correlation coefficient
The Pearson correlation coefficient is a statistic that measures the strength and direction of the linear relationship between two continuous variables [36]. The values of the Pearson correlation coefficient range from −1 to 1. The calculation formula is
where
3 Results and analysis
3.1 NDVI spatiotemporal distribution characteristics
3.1.1 NDVI time distribution characteristics
Figure 2 shows the interannual variation trend of NDVI in Mu Us Sandy Land. From Figure 2, it can be seen that from 2000 to 2020, the annual NDVI value of the Mu Us Sandy Land was between 0.25 and 0.43, showing a stable upward trend with an increase rate of 0.074/(10a). There were occasional fluctuations, with a significant downward trend observed from 2013 to 2015. Through meteorological data analysis, it was found that the precipitation in the study area decreased significantly in 2015, and insufficient water affected the growth of vegetation. Overall analysis shows that the NDVI value of the Mu Us Sandy Land showed a continuous upward trend from 2000 to 2020, mainly due to the implementation of ecological environment protection policies such as afforestation and wind and sand fixation in the study area, which maintained an overall upward trend in vegetation coverage of the Mu Us Sandy Land. The NDVI value in the study area fluctuates locally due to the uncertainty of water and heat changes.
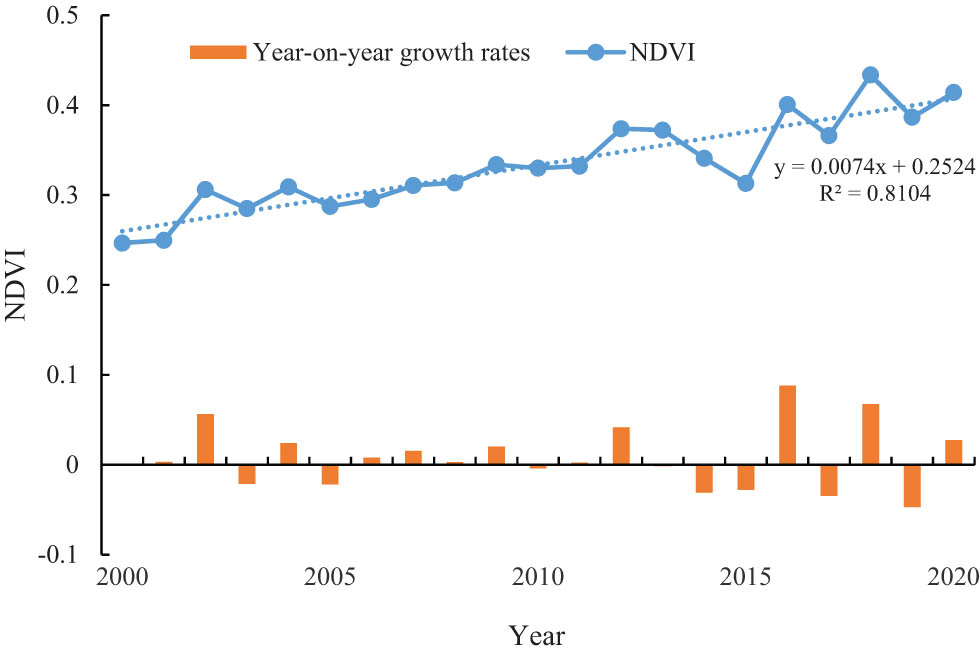
Interannual variation of NDVI in Mu Us Sandy Land from 2000 to 2020.
3.1.2 Spatial distribution characteristics of NDVI
Figure 3 shows the spatial distribution of NDVI mean in Mu Us Sandy Land from 2000 to 2020. According to the changes in vegetation cover, the NDVI of the study area is divided into nonvegetation area (NDVI ≤ 0.2), extremely low vegetation area (0.2 < NDVI ≤ 0.3), low vegetation area (0.3 < NDVI ≤ 0.4), medium vegetation area (0.4 < NDVI ≤ 0.5), high vegetation area (0.5 < NDVI ≤ 0.6), and dense vegetation coverage area (0.6 < NDVI) [37]. The spatial distribution of NDVI in Mu Us Sandy Land shows significant differences, with an overall trend of gradually increasing from northwest to southeast. Dense vegetation areas are distributed on both sides of rivers in the study area and within the territory of Ningxia Hui Autonomous Region. High vegetation is mainly distributed in the southeast of Mu Us Sandy Land, located in Yulin City, Shaanxi Province. The terrain of this area is mainly low mountains and hills, with relatively abundant water resources and suitable water and thermal conditions for vegetation growth. The central vegetation area is distributed in the central and eastern part of the research area, which is located in the agricultural forestry transitional zone. The vegetation is mainly grassland, and the vegetation coverage is not high. The low vegetation area and no vegetation area are located in the northwest of the research area, which is the grassland area. The terrain is mostly eroded sand dunes and grassland between dunes, with low vegetation coverage and fragile ecological environment, which is easily affected by the natural environment and human activities.

Annual mean spatial distribution of NDVI in Mu Us Sandy Land from 2000 to 2020.
3.2 NDVI dynamic change characteristics
Figure 4 shows the slope and significance distribution of NDVI trend changes in Mu Us Sandy Land from 2000 to 2020, and Table 2 shows the statistical table of different NDVI trend changes in Mu Us Sandy Land. The slope of NDVI variation in Mu Us Sandy Land from 2000 to 2020 was −0.0240–0.0389, with an average value of 0.0073. From 2000 to 2020, the NDVI of Mu Us Sandy Land was mainly improved and basically unchanged, with the proportion of basically unchanged areas accounting for 18.39% of the study area. It was mainly distributed in the windy and sandy areas in the northwest of the study area, where precipitation was sparse and vegetation was mainly sparse grasslands. The proportion of improvement areas in the study area is 81.48%, with the vast majority being extremely significant improvement areas, distributed in the central and eastern parts of the study area. The degraded area is relatively small, accounting for 0.12% of the study area.
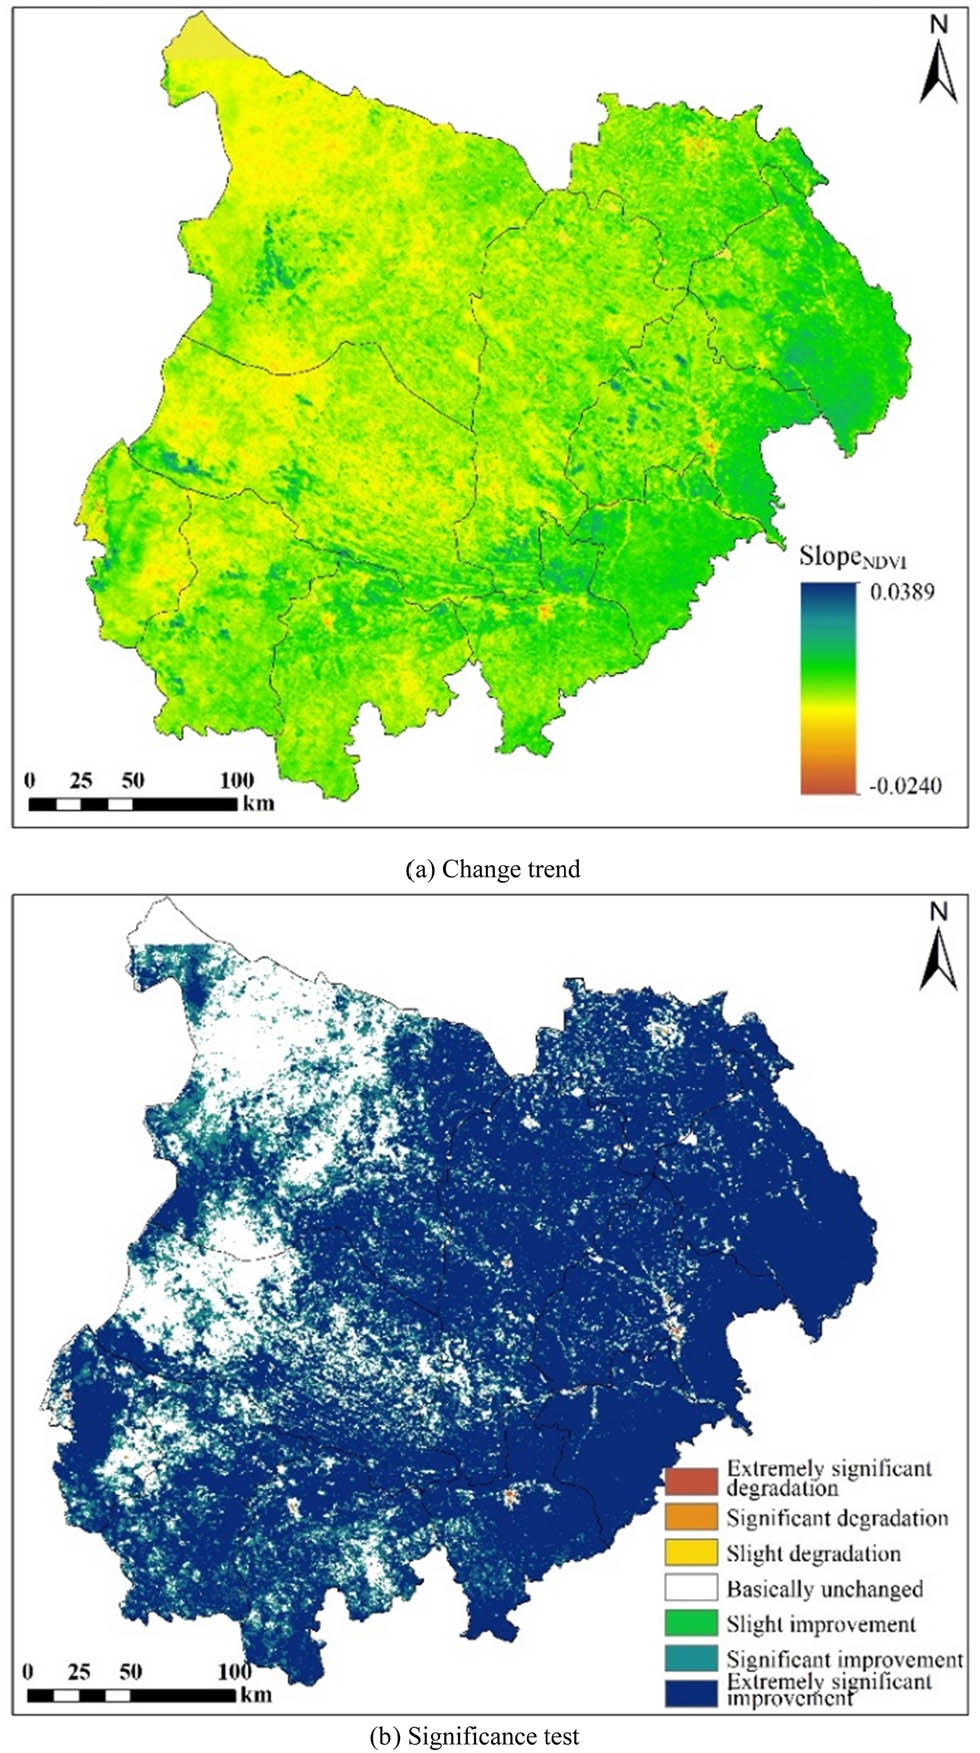
NDVI variation trend (a) and significance test (b) in Mu Us Sandy Land from 2000 to 2020.
Statistical table of different trends in NDVI changes in Mu Us Sandy Land
| Slope | Significance level Z value | Trend of change | Ratio (%) |
|---|---|---|---|
| <−0.0005 | <0.01 | Extremely significant degradation | 0.04 |
| <−0.0005 | 0.01–0.05 | Significant degradation | 0.05 |
| <−0.0005 | ≥0.05 | Slight degradation | 0.04 |
| −0.0005–0.0005 | ≥0.05 | Basically unchanged | 18.39 |
| >0.0005 | ≥0.05 | Slight improvement | 4.97 |
| >0.0005 | 0.01–0.05 | Significant improvement | 12.67 |
| >0.0005 | <0.01 | Extremely significant improvement | 63.84 |
3.3 Spatial and temporal distribution characteristics of surface temperature
Figure 5 and Table 3 show the spatial distribution of surface temperature in the Mu Us Sandy Land in 2000, 2010, and 2020, as well as the statistical table of the proportion of different surface temperatures. From the chart, it can be seen that the surface temperature of Mu Us Sandy Land has obvious spatial distribution characteristics, showing a gradually increasing trend from southeast to northwest. The distribution pattern of surface temperature in Mu Us Sandy Land varies in terms of time distribution, with surface temperature mainly concentrated at 32–36°C in 2000, accounting for 76.01%. In 2010, the surface temperature was concentrated at 30–34°C, accounting for 67.37%. The distribution of surface temperature in 2020 was relatively uniform between 28 and 36°C. From 2000 to 2020, the number of low-temperature areas continued to increase. The areas below 28°C in 2000 were relatively scattered in the study area, and the area continued to expand. In 2020, low-temperature areas were scattered throughout the eastern and southern parts of the study area. The main reason for the high distribution of surface temperature in the western region is that the human density is relatively low, the land use type is mainly unused land, and the density of surface vegetation coverage is relatively low. The low values are distributed in the eastern and southern regions, where water resources are relatively abundant, human activities are more frequent, agriculture and forestry development are relatively good, and land use types change significantly, mainly grassland, farmland, and forest land. The surface temperature shows a continuous downward trend.
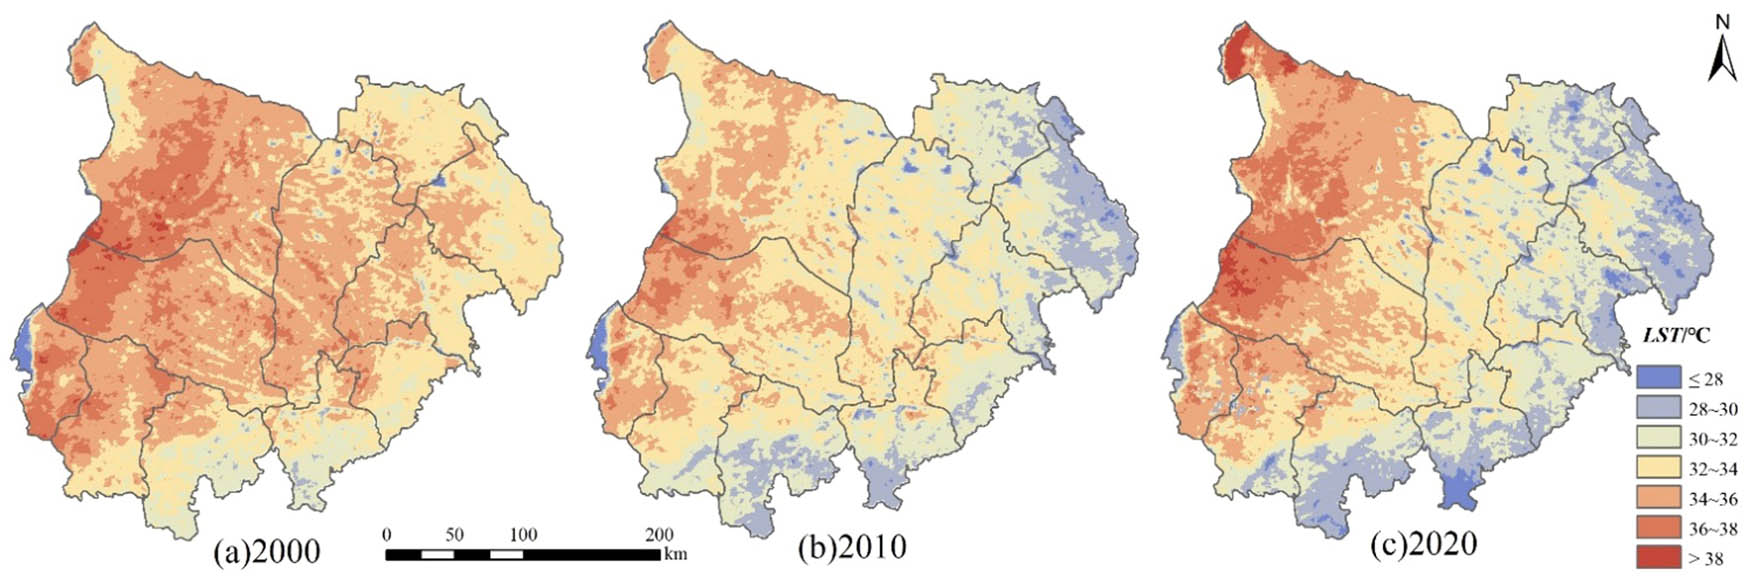
Spatial distribution map of annual LST in Mu Us Sandy Land from 2000 to 2020. (a) 2000, (b) 2010, and (c) 2020.
Proportion of different LST in Mu Us Sandy Land from 2000 to 2020
| LST/°C | 2000 | 2010 | 2020 |
|---|---|---|---|
| <30 | 1.26 | 12.75 | 32.30 |
| 30–32 | 9.05 | 27.94 | 23.65 |
| 32–34 | 31.07 | 39.43 | 23.91 |
| 34–36 | 44.94 | 17.71 | 16.49 |
| >36 | 13.68 | 2.17 | 3.64 |
In order to further analyze the variation pattern of surface temperature in Mu Us Sandy Land from 2000 to 2020, this study divided the trend of surface temperature change in Mu Us Sandy Land from 2000 to 2020 into seven levels based on trend analysis and significance analysis (Figure 6 and Table 4): extremely significant decrease, significant decrease, weak significant decrease, stable zone, weak significant increase, significant increase, and extremely significant increase. Among them, the extremely significant decrease zone, significant decrease zone, and weak significant decrease zone accounted for 20.33, 12.07, and 6.70% of the study area, while the stable zone accounted for 57.53% of the study area. The weak significant increase zone, significant increase zone, and extremely significant increase zone accounted for 1.01, 1.35, and 1.02% of the study area, respectively. The area of surface temperature rise is concentrated in the western part of the study area, with a relatively small proportion. The stable area of surface temperature is distributed in the west and scattered in the middle of the study area, which is the main dynamic change feature of surface temperature in the study area. The declining areas are mainly distributed in the central and eastern parts of the research area, with a wide area distribution. The most significant decline is mainly concentrated in the northeast, distributed in Yuyang City and Shenmu City. The overall trend of surface temperature variation in Mu Us Sandy Land is similar to the distribution pattern of high and low temperatures in the study area, mainly due to the impact of human activities on land use types in the central and eastern regions.

Interannual variation trend of LST in Mu Us Sandy Land.
Statistical table of different trends in LST Changes in Mu Us Sandy Land
| Slope | Significance level P | Trend of change | Ratio (%) |
|---|---|---|---|
| <−0.05 | <0.01 | Extremely significant degradation | 20.33 |
| <−0.05 | 0.01–0.05 | Significant degradation | 12.07 |
| <−0.05 | ≥0.05 | Slight degradation | 6.70 |
| −0.05–0.05 | ≥0.05 | Basically unchanged | 57.53 |
| >0.05 | ≥0.05 | Slight improvement | 1.01 |
| >0.05 | 0.01–0.05 | Significant improvement | 1.35 |
| >0.05 | <0.01 | Extremely significant improvement | 1.02 |
From 2000 to 2020, the surface temperature of Mu Us Sandy Land fluctuated between 30.94 and 34.23°C, with an average surface temperature of 32.29°C, showing an overall downward trend. The change pattern of surface temperature is different from the gradual warming trend of global climate change. The main reason is that Mu Us Sandy Land is the main area for afforestation and returning farmland to forests and grasslands in China. Human activities have changed the land use type of the study area, reduced unused land area, and increased air humidity and surface evapotranspiration, thereby reducing the solar shortwave radiation received by the surface and maintaining a downward trend in surface temperature.
3.4 Annual LST variation characteristics of different land use type
Using overlay analysis to statistically analyze the average annual surface temperature of different land use types in Mu Us Sandy Land from 2000 to 2020 (Table 5). According to Table 5, there is a significant difference in annual surface temperature among different land use types. Construction land and unused land are the two land types with the highest surface temperature in the study area, at 33.25 and 33.20°C, respectively. Forest land and grassland are the second highest, with surface temperatures of 32.53 and 31.31°C, respectively. Farmland and water have the lowest surface temperatures, at 30.99 and 29.76°C, respectively. In cultivated land and water areas, water resources are relatively abundant, and higher evapotranspiration absorbs some of the solar radiation energy, resulting in lower surface temperatures. Construction land and unused land have no vegetation cover on their surfaces, and the surface temperature rises rapidly under the influence of solar radiation. The average surface temperature of each land use type showed a trend of first decreasing and then increasing. The decrease in surface temperature from 2000 to 2010 was related to national policies. From 1999 to 2010, the country implemented the project of returning farmland to forests and grasslands, which effectively prevented the process of land desertification, increased vegetation coverage in the study area, and significantly improved the ecological environment quality of Mu Us Sandy Land. The surface temperature has rebounded again from 2010 to 2020, which is related to the continuous warming of the global climate.
Average LST of different land use types in Mu Us Sandy Land from 2000 to 2020
| LST (°C) | 2000 | 2010 | 2020 | Mean value |
|---|---|---|---|---|
| Cultivated land | 32.18 | 30.33 | 30.29 | 30.99 |
| Woodland | 33.80 | 31.88 | 31.87 | 32.53 |
| Meadow | 32.43 | 30.50 | 31.46 | 31.31 |
| Waters | 30.60 | 29.41 | 30.45 | 29.76 |
| Land used for building | 34.19 | 32.47 | 33.05 | 33.25 |
| Unutilized land | 34.45 | 32.56 | 32.90 | 33.20 |
3.5 Spatial coupling analysis of surface temperature and vegetation index
The 2D scatter plot tool of ENVI was used to obtain the scatter distribution maps and linear regression equations of LST and NDVI (Figure 7). R 2 of the two was 0.5073 and passed the significance test at the 0.01 level, indicating a significant negative correlation between LST and NDVI in the Mu Us Sandy Land. This indicates that ecological engineering policies such as afforestation and wind and sand fixation can effectively reduce surface temperature in the study area, thereby achieving the effect of improving the environment.

2D scatter plot of LST and NDVI.
To further investigate the spatial correlation between LST and NDVI, a spatial coupling degree model was used to calculate the spatial coupling degree between LST and NDVI in the Mu Us Sandy Land. The results are shown in Figure 8. The overall spatial coupling between LST and NDVI is at a very high level, and the two mainly exhibit an antagonistic state in space. An increase in vegetation coverage can effectively reduce surface temperature, which occurs in most areas of the Mu Us sandy land. The increase in construction land has led to an increasingly prominent negative feedback effect of vegetation coverage on surface temperature, which is mainly affected by the urbanization process.

Spatial coupling distribution of LST and NDVI in Mu Us Sandy Land.
Statistical analysis was conducted on the coupling degree zones of the Mu Us Sandy Land, and the results are shown in Table 6. According to Table 6, the coupling degree of Mu Us Sandy Land in the range of (0.8, 1.0] has the highest number of grids, followed by (0.5, 0.8], [0, 0.3], and (0.3, 0.5]). The average coupling degree in the study area is 0.895, further proving the significant correlation between LST and NDVI and reflecting the importance of green vegetation in regulating regional climate and surface temperature.
Statistical table of spatial coupling between LST and NDVI in Mu Us Sandy Land
| Coupling degree | Coupling effect | Grid number | Proportion (%) | Mean coupling degree |
|---|---|---|---|---|
| [0, 0.3] | Range | 2,359 | 2.58 | 0.895 |
| (0.3, 0.5) | Poor | 334 | 0.36 | |
| (0.5, 0.8) | Preferably | 8,551 | 9.34 | |
| (0.8, 1.0) | Excellent | 80,278 | 87.71 |
4 Discussion
The Mu Us Sandy Land is located in the northwest arid and semi-arid areas, with a terrain mainly composed of windblown sand and grassland. The ecological environment is fragile, and it has a unique agricultural pastoral transitional zone. Based on MODIS data, studying the spatiotemporal distribution patterns of surface temperature and vegetation coverage, and further exploring the interrelationship between surface temperature and vegetation changes, evaluating the impact of vegetation on surface temperature, can provide a scientific basis for ecological environment protection and adaptation to climate change. According to the analysis of the interannual variation trend of NDVI in Mu Us sandy land, the overall NDVI showed a fluctuating upward trend from 2000 to 2020, indicating that the vegetation in the study area was generally developing in a good trend, which was consistent with the research results of Zuguang et al. [38] in the Yellow River Basin and Tong et al. [39] in the northern Loess Plateau. However, NDVI showed a relatively large downward trend in 2015. By reviewing the climate change in the study area, it is found that 2015 is the minimum point of temperature and precipitation in Mu Us sandy land [40,41,42], indicating that the main reason for the sudden change of NDVI in Mu Us sandy land in 2015 is the lack of hydrothermal conditions.
Vegetation index and surface temperature are important input parameters for studying water cycle, energy cycle, and ecological environment changes [29,43]. Clarifying the spatiotemporal evolution patterns of vegetation index and surface temperature in Mu Us Sandy Land is helpful for the rational allocation of water resources and the sustainable development of the ecological environment in the research area. Over the years, the average annual precipitation in Mu Us sandy land is 337.8 mm, the interannual fluctuation of precipitation is large, and the upward trend is not obvious [44]. However, the vegetation index of the Mu Us Sandy Land has steadily increased, indicating that China has made significant achievements in the implementation of large-scale projects such as returning farmland to forests and grasslands, diverting floods and silting land, constructing wind and sand prevention forests, and managing steep slopes under the leadership of the country and the government. In the context of global temperature rise, the surface temperature of the Mu Us Sandy Land has shown a downward trend, which is different from the change patterns in places such as the Yunnan-Kweichow Plateau [45]. The main reason is the implementation of ecological policies such as returning farmland to forests and grasslands, windbreak and sand fixation, and afforestation, which have changed the land use type and climate of Mu Us Sandy Land, increased vegetation coverage in the study area, and thus reduced surface temperature. Therefore, there is a close relationship between surface temperature and vegetation coverage, which is regulated through interactions: (1) Reflection and absorption: Vegetation can reflect solar radiation and reduce the area of direct sunlight shining on the surface, thereby reducing the absorption capacity of the surface. (2) Evapotranspiration: Vegetation evaporates soil moisture into the atmosphere through transpiration, which lowers surface temperature. Evapotranspiration uses water within plants to transfer heat, thereby reducing surface heat. (3) Climate regulation: The stomata of plants can be opened and closed for regulation, reducing water evaporation and preventing overheating. When the temperature rises, plants reduce the opening of stomata, reduce water evaporation, and thus lower the surface temperature. (4) Shadow effect: The growth of vegetation forms shadows, which can lower the temperature of the soil surface in direct contact with sunlight, thereby lowering the surface temperature. Overall, the higher the vegetation coverage, the lower the surface temperature, and the growth and protection of vegetation are important factors in reducing surface temperature.
The spatiotemporal variation of vegetation index and surface temperature is the result of the comprehensive influence of geographical factors, climate factors, and socio-economic factors. This study only analyzed the spatial variation and coupling relationship between the two, which has significant limitations in research. Moreover, the Mu Us Sandy Land has a large area that spans multiple administrative regions. There are significant differences in ecological and environmental policies among different administrative regions, resulting in different directions of vegetation index changes in the north-south and east–west regions of the Mu Us Sandy Land. This is also the main reason for the trend of surface temperature changes in the Mu Us Sandy Land to show an increase in the west and a decrease in the east. The quantification of the impact mechanism of ecological policies has always been a hot and difficult research topic in land science and ecological science, and it is also a key research direction in the future.
5 Conclusions
Using MOD13A1 and MOD11A2 as data sources, the spatial distribution characteristics of NDVI and LST in Mu Us Sandy Land from 2000 to 2020 were analyzed. ENVI and MATLAB software were used to calculate the significant trend changes of NDVI and LST over the years. Finally, a spatial coupling model was used to calculate the spatial coupling degree between NDVI and LST in four seasons, and the spatial coupling differentiation characteristics of Mu Us Sandy Land were analyzed. The main conclusions are as follows:
From 2000 to 2020, the annual NDVI value of Mu Us Sandy Land was between 0.25 and 0.43, showing a stable upward trend with an increase rate of 0.074/(10 a). The main reason for this was the implementation of ecological and environmental protection policies such as afforestation and wind and sand fixation in the study area, which had individual year fluctuations. The reason for this was the uncertainty of water and heat changes. The spatial distribution of NDVI in Mu Us Sandy Land shows significant differences, with an overall trend of gradually increasing from northwest to southeast. The slope of NDVI variation in Mu Us Sandy Land from 2000 to 2020 was −0.0240–0.0389, with an average value of 0.0073. The proportion of improvement areas in the study area is 81.48%, with the vast majority being extremely significant improvement areas, distributed in the central and eastern parts of the study area.
There are significant differences in the spatial distribution of surface temperature in Mu Us Sandy Land, showing an overall trend of decreasing from northwest to southeast and higher in the west than in the east. The surface temperature of Mu Us Sandy Land is greatly affected by changes in land use types, and there is a significant difference in surface temperature among different land use types. Construction land and unused land have the highest surface temperature, followed by grasslands and forests, and finally, farmland and water bodies. The spatiotemporal variation trend of surface temperature in Mu Us Sandy Land is different from the gradual warming trend of global climate change. The main reason is that human activities have changed land use types and increased local vegetation coverage. Human activities have had a significant impact on surface temperature, reflecting the importance of green vegetation in regulating regional surface temperature. Therefore, the spatiotemporal variation of surface temperature in the Mu Us Sandy Land is the result of the joint influence of human activities and climate change, and human activities dominated from 2000 to 2020.
The R 2 of LST and NDVI is 0.5073 and has passed the significance test at the 0.01 level, indicating a significant negative correlation between LST and NDVI in Mu Us Sandy Land. This indicates that ecological engineering policies such as afforestation and wind and sand fixation can effectively reduce surface temperature in the study area, thereby achieving the effect of improving the environment. Moreover, the overall spatial coupling degree between LST and NDVI is at a very high level, with an average coupling degree of 0.895 in the study area. The two mainly exhibit a state of mutual antagonism in space, further proving the significant correlation between LST and NDVI, and reflecting the importance of green vegetation in regulating regional climate and surface temperature.
It is hoped that the presented results could be used to analyze land-use change, observe climate change, and assess the health of the ecosystem, which will help to provide a theoretical basis for improving the regional ecological and environmental model. However, the interpretation of policies still needs to be deepened. In terms of research data, the lack of detailed socio-economic statistical data is a shortcoming of this study. In addition, the resolution of the surface temperature data used in this study is 1 km, and the spatial resolution is relatively coarse, which has caused certain limitations to this study. Therefore, the direction of future work is to provide more in-depth analysis for the study of the ecological environment of the Mu Us Sandy Land by utilizing higher-resolution satellite data, such as Landsat, Sentinel, and GaoFen, and more advanced data analysis models, and by taking into account socio-economic and policy documents.
Acknowledgments
The authors gratefully acknowledge researchers at the Institute of Land Engineering and Technology, Shaanxi Provincial Land Engineering Construction Group, for their help with the field experiments. We wish to thank the editor of this journal and the anonymous reviewers during the revision process.
-
Funding information: This research was funded by Natural Science Basic Research Program of Shaanxi (Program No. 2024JC-YBQN-0329), Scientific Research Program Funded by Education Department of Shaanxi Provincial Government (Program No. 23JK0273), the Fund for Less Developed Regions of the National Natural Science Foundation of China (Program No. 42167039), and Scientific Research Item of Shaanxi Provincial Land Engineering Built-up Group (DJNY2024-35 and DJNY-YB-2023-8).
-
Author contributions: L. Y. managed the entire research project and also analyzed and considered the research materials. L. S. collected and analyzed the meteorological data; J. L. and H. K. drew the figures for this article; and L. Y. and L. S. reviewed and edited the article. All authors have read and agreed to the published version of the manuscript.
-
Conflict of interest: The authors declare no conflict of interest.
References
[1] Zahra P, Abdolrassoul S. PyLST: a remote sensing application for retrieving land surface temperature (LST) from Landsat data. Environ Earth Sci. 2024;83(12):373. 10.1007/s12665-024-11644-9.Search in Google Scholar
[2] Sajjad H, Muhammad M, Ashfaq A, Nasir M, Mohkum HH, Muhammad A, et al. Satellite-based evaluation of temporal change in cultivated land in Southern Punjab (Multan region) through dynamics of vegetation and land surface temperature. Open Geosci. 2021;13:1561–77.10.1515/geo-2020-0298Search in Google Scholar
[3] Jiao H, Ding Y, Duan S, Xiao H. Spatially coupled seasonal variation of vegetation cover and surface temperature in the Three Gorges Reservoir. J Ecol Rural Environ. 2022;38:1604–12.Search in Google Scholar
[4] Yuanhong D, Shijie W, Xiaoyong B, Yichao T, Luhua W, Jianyong X, et al. Relationship among land surface temperature and LUCC. NDVI Typ Karst Area Sci Rep. 2018;8:641.10.1038/s41598-017-19088-xSearch in Google Scholar PubMed PubMed Central
[5] Guo Y, Han L, Zhang D, Sun G, Fan J, Ren X. The factors affecting the quality of the temperature vegetation dryness index (TVDI) and the Spatial–temporal variations in drought from 2011 to 2020 in regions affected by climate change. Sustainability. 2023;15(14):11350. 10.3390/su151411350.Search in Google Scholar
[6] Jing X, Xinwei L, Hay CLC, John WC. Effects of land surface temperatures on vegetation phenology along urban–rural local climate zone gradients. Landsc Ecol. 2024;39(3):62. 10.1007/s10980-024-01856-.Search in Google Scholar
[7] Marzie N, Hart MA, Negin N, Benjamin B. Background climate modulates the impact of land cover on urban surface temperature. Sci Rep. 2022;12:15433.10.1038/s41598-022-19431-xSearch in Google Scholar PubMed PubMed Central
[8] Ayansina A, Aigbirmolen MI, Oladosu OR. Variations in urban land surface temperature intensity over four cities in different ecological zones. Sci Rep. 2021;11:20537.10.1038/s41598-021-99693-zSearch in Google Scholar PubMed PubMed Central
[9] Zhang X, Meng C, Gou P, Huang Y, Ma Y, Ma W, et al. Evaluating the reconstructed all-weather land surface temperature for urban heat island analysis. Remote Sens. 2024;16:373.10.3390/rs16020373Search in Google Scholar
[10] Tanoori G, Soltani A, Modiri A. Machine learning for urban heat island (UHI) analysis: predicting land surface temperature (LST) in urban environments. Urban Clim. 2024;55:101962.10.1016/j.uclim.2024.101962Search in Google Scholar
[11] Liu SY, Ding JL, Zhang JY, Zhang ZH, Chen XY, Mayra JCD. Remote sensing diagnosis of environmental health of grassland ecosystems in the Abby Lake Basin. J Grassl Sci. 2020;29:1–13.Search in Google Scholar
[12] Anupam P, Arun M, Subhanil G, Durgesh S, Rashmi, Sananda K. Analysis of the variability in land surface temperature due to land use/land cover change for a sustainable urban planning. J Landsc Ecol. 2023;16:20–35.10.2478/jlecol-2023-0015Search in Google Scholar
[13] Aminzadeh M, Or D, Stevens B, AghaKouchak A, Shokri N. Upper bounds of maximum land surface temperatures in a warming climate and limits to plant growth. Earth’s Future. 2023;11: e2023EF003755.10.1029/2023EF003755Search in Google Scholar
[14] Fan J, Chen X, Xie S, Zhang Y. Study on the response of the summer land surface temperature to urban morphology in Urumqi, China. Sustainability. 2023;15(21):15255. 10.3390/su152115255.Search in Google Scholar
[15] Lingxue Y, Ye L, Xuan L, Fengqin Y, Vincent L, Tingxiang L. Vegetation-induced asymmetric diurnal land surface temperatures changes across global climate zones. Sci Total Environ. 2023;896:165255.10.1016/j.scitotenv.2023.165255Search in Google Scholar PubMed
[16] Zhou S, Zheng H, Liu X, Gao Q, Xie J. Identifying the effects of vegetation on urban surface temperatures based on urban–rural local climate zones in a subtropical metropolis. Remote Sens. 2023;15:4743.10.3390/rs15194743Search in Google Scholar
[17] Yadav B, Malav LC, Singh SV, Kharia SK, Yeasin MdSingh, RN, et al. Spatiotemporal responses of vegetation to hydroclimatic factors over arid and semi-arid climate. Sustainability. 2023;15(21):15191. 10.3390/su152115191.Search in Google Scholar
[18] Yuhei Y, Kazuhito I, Youngryel R, Minseok K, Shohei M, Su-Jin K, et al. Detection of vegetation drying signals using diurnal variation of land surface temperature: application to the 2018 east asia heatwave. Remote Sens Environ. 2023;291:113572. 10.1016/j.rse.2023.113572.Search in Google Scholar
[19] Yong X, Qiang-Yu D, Bin Z, Ming X, Yu-Xi F. Tracing climatic and human disturbance in diverse vegetation zones in China: Over 20 years of NDVI observations. Ecol Indic. 2023;156:7713.10.1016/j.ecolind.2023.111170Search in Google Scholar
[20] Jiaxin Z, Tao Y, Mingjiang D, Huiping H, Yuping H, Huanhuan X. Spatiotemporal variations and its driving factors of NDVI in Northwest China during 2000-2021. Environ Sci Pollut Res Int. 2023;30:118782–800.10.1007/s11356-023-30250-zSearch in Google Scholar PubMed
[21] Yan Z, Luoqi Z, Junyi W, Gaocheng D, Yali W. Quantitative analysis of NDVI driving factors based on the geographical detector model in the Chengdu-Chongqing region, China. Ecol Indic. 2023;155:263639240.10.1016/j.ecolind.2023.110978Search in Google Scholar
[22] Yibo Y, Kebiao M, Jiancheng S, Shilong P, Xinyi S, Jeff D, et al. Driving forces of land surface temperature anomalous changes in North America in 2002-2018. Sci Rep. 2020;10:6931.10.1038/s41598-020-63701-5Search in Google Scholar PubMed PubMed Central
[23] Luo Q, Zhou J, Li Z, Yu B. Spatial differences of ecosystem services and their driving factors: A comparation analysis among three urban agglomerations in China’s Yangtze River Economic Belt. Sci Total Environ. 2020;725:138452.10.1016/j.scitotenv.2020.138452Search in Google Scholar PubMed
[24] Zare KH, Reza GMH, Sahar A, Alfred S, Zahra K, Santos FCS. Proof of evidence of changes in global terrestrial biomes using historic and recent NDVI time series. Heliyon. 2023;9:e18686.10.1016/j.heliyon.2023.e18686Search in Google Scholar PubMed PubMed Central
[25] Yunjun Z, Jiemeng F, Tingting M, Zhongwu L, Yan Y, Jiejun H, et al. Analysis on vegetation cover changes and the driving factors in the mid-lower reaches of Hanjiang River Basin between 2001 and 2015. Open Geosci. 2021;13:675–89.10.1515/geo-2020-0259Search in Google Scholar
[26] Tuoku L, Wu Z, Men B. Impacts of climate factors and human activities on NDVI change in China. Ecol Inform. 2024;81:102555.10.1016/j.ecoinf.2024.102555Search in Google Scholar
[27] Wenrui L, Baoquan J, Tong L, Qiumeng Z, Jie M. Correlation analysis between urban green space and land surface temperature from the perspective of spatial heterogeneity: a case study within the sixth ring road of Beijing. Sustainability. 2022;14:13492.10.3390/su142013492Search in Google Scholar
[28] Samyuktha N, Rao PJ, Ramu N. Correlation analysis of land surface temperature on landsat-8 data of Visakhapatnam Urban Area, Andhra Pradesh, India. Earth Sci Inform. 2022;15:1963–75.10.1007/s12145-022-00850-3Search in Google Scholar
[29] Ebrahim G, Paolo M, Francesca B, Gabriele Scarascia M. Trend analysis of MODIS land surface temperature and land cover in Central Italy. Land. 2024;13:796.10.3390/land13060796Search in Google Scholar
[30] Xuzhen Z, Jie L, Jinliang W, Jianpeng Z, Lanfang L, Jun M. Linear and nonlinear characteristics of long-term NDVI using trend analysis: A case study of Lancang-Mekong River basin. Remote Sens. 2022;14:6271–1.10.3390/rs14246271Search in Google Scholar
[31] Liu J, Liu HM, Zhuo Y, Liu DW, Wang LX. Changes in landscape patterns and driving forces in the Maowusu Sandland from 1990 to 2014. Grass Sci. 2017;34:255–63.Search in Google Scholar
[32] Kun F, Tao W, Shulin L, Wenping K, Xiang C, Zichen G, et al. Monitoring desertification using machine-learning techniques with multiple indicators derived from MODIS Images in Mu Us Sandy Land, China. Remote Sens. 2022;14:2663.10.3390/rs14112663Search in Google Scholar
[33] Zhao W, Tinglong Z, Chenyang P, Xiaonan Z, Yingying L, Shuai H, et al. Multisource remote sensing monitoring and analysis of the driving forces of vegetation restoration in the Mu Us sandy land. Land. 2022;11:1553.10.3390/land11091553Search in Google Scholar
[34] Luan JK, Liu DF, Huang Q, Feng JL, Lin M, Li GB. Spatial and temporal variations of vegetation indices in Yulin, Shaanxi Province, in the last 17 years and the factors affecting them. J Ecol. 2018;38:2780–90.10.5846/stxb201704210718Search in Google Scholar
[35] Cheng J, Yang LY, Li YN. Spatial and temporal variations of NDVI and its response to hydrothermal conditions in northern Shaanxi, 2000-2018. J Irrig Drain. 2020;39:111–9.Search in Google Scholar
[36] Ebrahim G, Paolo M, Scarascia MG, Francesca B. Coherency and phase delay analyses between land cover and climate across Italy via the least-squares wavelet software. Int J Appl Earth Obs Geoinf. 2023;118:103241.10.1016/j.jag.2023.103241Search in Google Scholar
[37] Zenghui S, Zhongan M, Liangyan Y, Zhe L, Jichang H, Huanyuan W, et al. Impacts of climate change and afforestation on vegetation dynamic in the Mu Us Desert, China. Ecol Indic. 2021;129:108020.10.1016/j.ecolind.2021.108020Search in Google Scholar
[38] Zuguang R, Zhihui T, Haitao W, Yan L, Yipin Y. Spatiotemporal evolution and driving mechanisms of vegetation in the Yellow River Basin, China during 2000–2020. Ecol Indic. 2022;138:108832. 10.1016/j.ecolind.2022.108832.Search in Google Scholar
[39] Tong N, Guotao D, Xiaohui J, Yuxin L. Spatio-temporal changes and driving forces of vegetation coverage on the loess plateau of Northern Shaanxi. Remote Sens. 2021;13:613.10.3390/rs13040613Search in Google Scholar
[40] Ji X, Yang J, Liu J, Du X, Zhang W, Liu J, et al. Analysis of spatial-temporal changes and driving forces of desertification in the Mu Us Sandy Land from 1991 to 2021. Sustainability. 2023;15:10399.10.3390/su151310399Search in Google Scholar
[41] Liangyan Y, Lei S, Juan L, Hui K, Dan W, Jing W. Effects of climatic conditions and vegetation changes on actual evapotranspiration in Mu Us sandy land. Water Sci Technol : A J Int Assoc Water Pollut Res. 2023;88:723–37.Search in Google Scholar
[42] Zhu Y, Li J, Xi X, Zhang J, Ma P, Liang L, et al. Spatial and temporal characteristics of drought in the Mu Us Sandy land based on the standardized precipitation index. Front Environ Sci. 2024;12:1349228. 10.3389/fenvs.2024.1349228.Search in Google Scholar
[43] Karlinasari L, Pertiwi S, Erizal E. Urban heat island (UHI) index change detection based on LST, NDVI, NDBI (Case Study in Bima City, West Nusa Tenggara Province, Indonesia). J Ecol Eng. 2023;24:91–107.10.12911/22998993/171371Search in Google Scholar
[44] Liangyan Y, Lei S, Juan L, Hui K, Dan W, Jing W. Effects of climatic conditions and vegetation changes on actual evapotranspiration in Mu Us sandy land. Water Sci Technol: A J Int Assoc Water Pollut Res. 2023;88:723–37.10.2166/wst.2023.226Search in Google Scholar PubMed
[45] ZhiWei H, BoHui T. Spatiotemporal change patterns and driving factors of land surface temperature in the Yunnan-Kweichow Plateau from 2000 to 2020. Sci Total Environ. 2023;896:165288.10.1016/j.scitotenv.2023.165288Search in Google Scholar PubMed
© 2024 the author(s), published by De Gruyter
This work is licensed under the Creative Commons Attribution 4.0 International License.
Articles in the same Issue
- Regular Articles
- Theoretical magnetotelluric response of stratiform earth consisting of alternative homogeneous and transitional layers
- The research of common drought indexes for the application to the drought monitoring in the region of Jin Sha river
- Evolutionary game analysis of government, businesses, and consumers in high-standard farmland low-carbon construction
- On the use of low-frequency passive seismic as a direct hydrocarbon indicator: A case study at Banyubang oil field, Indonesia
- Water transportation planning in connection with extreme weather conditions; case study – Port of Novi Sad, Serbia
- Zircon U–Pb ages of the Paleozoic volcaniclastic strata in the Junggar Basin, NW China
- Monitoring of mangrove forests vegetation based on optical versus microwave data: A case study western coast of Saudi Arabia
- Microfacies analysis of marine shale: A case study of the shales of the Wufeng–Longmaxi formation in the western Chongqing, Sichuan Basin, China
- Multisource remote sensing image fusion processing in plateau seismic region feature information extraction and application analysis – An example of the Menyuan Ms6.9 earthquake on January 8, 2022
- Identification of magnetic mineralogy and paleo-flow direction of the Miocene-quaternary volcanic products in the north of Lake Van, Eastern Turkey
- Impact of fully rotating steel casing bored pile on adjacent tunnels
- Adolescents’ consumption intentions toward leisure tourism in high-risk leisure environments in riverine areas
- Petrogenesis of Jurassic granitic rocks in South China Block: Implications for events related to subduction of Paleo-Pacific plate
- Differences in urban daytime and night block vitality based on mobile phone signaling data: A case study of Kunming’s urban district
- Random forest and artificial neural network-based tsunami forests classification using data fusion of Sentinel-2 and Airbus Vision-1 satellites: A case study of Garhi Chandan, Pakistan
- Integrated geophysical approach for detection and size-geometry characterization of a multiscale karst system in carbonate units, semiarid Brazil
- Spatial and temporal changes in ecosystem services value and analysis of driving factors in the Yangtze River Delta Region
- Deep fault sliding rates for Ka-Ping block of Xinjiang based on repeating earthquakes
- Improved deep learning segmentation of outdoor point clouds with different sampling strategies and using intensities
- Platform margin belt structure and sedimentation characteristics of Changxing Formation reefs on both sides of the Kaijiang-Liangping trough, eastern Sichuan Basin, China
- Enhancing attapulgite and cement-modified loess for effective landfill lining: A study on seepage prevention and Cu/Pb ion adsorption
- Flood risk assessment, a case study in an arid environment of Southeast Morocco
- Lower limits of physical properties and classification evaluation criteria of the tight reservoir in the Ahe Formation in the Dibei Area of the Kuqa depression
- Evaluation of Viaducts’ contribution to road network accessibility in the Yunnan–Guizhou area based on the node deletion method
- Permian tectonic switch of the southern Central Asian Orogenic Belt: Constraints from magmatism in the southern Alxa region, NW China
- Element geochemical differences in lower Cambrian black shales with hydrothermal sedimentation in the Yangtze block, South China
- Three-dimensional finite-memory quasi-Newton inversion of the magnetotelluric based on unstructured grids
- Obliquity-paced summer monsoon from the Shilou red clay section on the eastern Chinese Loess Plateau
- Classification and logging identification of reservoir space near the upper Ordovician pinch-out line in Tahe Oilfield
- Ultra-deep channel sand body target recognition method based on improved deep learning under UAV cluster
- New formula to determine flyrock distance on sedimentary rocks with low strength
- Assessing the ecological security of tourism in Northeast China
- Effective reservoir identification and sweet spot prediction in Chang 8 Member tight oil reservoirs in Huanjiang area, Ordos Basin
- Detecting heterogeneity of spatial accessibility to sports facilities for adolescents at fine scale: A case study in Changsha, China
- Effects of freeze–thaw cycles on soil nutrients by soft rock and sand remodeling
- Vibration prediction with a method based on the absorption property of blast-induced seismic waves: A case study
- A new look at the geodynamic development of the Ediacaran–early Cambrian forearc basalts of the Tannuola-Khamsara Island Arc (Central Asia, Russia): Conclusions from geological, geochemical, and Nd-isotope data
- Spatio-temporal analysis of the driving factors of urban land use expansion in China: A study of the Yangtze River Delta region
- Selection of Euler deconvolution solutions using the enhanced horizontal gradient and stable vertical differentiation
- Phase change of the Ordovician hydrocarbon in the Tarim Basin: A case study from the Halahatang–Shunbei area
- Using interpretative structure model and analytical network process for optimum site selection of airport locations in Delta Egypt
- Geochemistry of magnetite from Fe-skarn deposits along the central Loei Fold Belt, Thailand
- Functional typology of settlements in the Srem region, Serbia
- Hunger Games Search for the elucidation of gravity anomalies with application to geothermal energy investigations and volcanic activity studies
- Addressing incomplete tile phenomena in image tiling: Introducing the grid six-intersection model
- Evaluation and control model for resilience of water resource building system based on fuzzy comprehensive evaluation method and its application
- MIF and AHP methods for delineation of groundwater potential zones using remote sensing and GIS techniques in Tirunelveli, Tenkasi District, India
- New database for the estimation of dynamic coefficient of friction of snow
- Measuring urban growth dynamics: A study in Hue city, Vietnam
- Comparative models of support-vector machine, multilayer perceptron, and decision tree predication approaches for landslide susceptibility analysis
- Experimental study on the influence of clay content on the shear strength of silty soil and mechanism analysis
- Geosite assessment as a contribution to the sustainable development of Babušnica, Serbia
- Using fuzzy analytical hierarchy process for road transportation services management based on remote sensing and GIS technology
- Accumulation mechanism of multi-type unconventional oil and gas reservoirs in Northern China: Taking Hari Sag of the Yin’e Basin as an example
- TOC prediction of source rocks based on the convolutional neural network and logging curves – A case study of Pinghu Formation in Xihu Sag
- A method for fast detection of wind farms from remote sensing images using deep learning and geospatial analysis
- Spatial distribution and driving factors of karst rocky desertification in Southwest China based on GIS and geodetector
- Physicochemical and mineralogical composition studies of clays from Share and Tshonga areas, Northern Bida Basin, Nigeria: Implications for Geophagia
- Geochemical sedimentary records of eutrophication and environmental change in Chaohu Lake, East China
- Research progress of freeze–thaw rock using bibliometric analysis
- Mixed irrigation affects the composition and diversity of the soil bacterial community
- Examining the swelling potential of cohesive soils with high plasticity according to their index properties using GIS
- Geological genesis and identification of high-porosity and low-permeability sandstones in the Cretaceous Bashkirchik Formation, northern Tarim Basin
- Usability of PPGIS tools exemplified by geodiscussion – a tool for public participation in shaping public space
- Efficient development technology of Upper Paleozoic Lower Shihezi tight sandstone gas reservoir in northeastern Ordos Basin
- Assessment of soil resources of agricultural landscapes in Turkestan region of the Republic of Kazakhstan based on agrochemical indexes
- Evaluating the impact of DEM interpolation algorithms on relief index for soil resource management
- Petrogenetic relationship between plutonic and subvolcanic rocks in the Jurassic Shuikoushan complex, South China
- A novel workflow for shale lithology identification – A case study in the Gulong Depression, Songliao Basin, China
- Characteristics and main controlling factors of dolomite reservoirs in Fei-3 Member of Feixianguan Formation of Lower Triassic, Puguang area
- Impact of high-speed railway network on county-level accessibility and economic linkage in Jiangxi Province, China: A spatio-temporal data analysis
- Estimation model of wild fractional vegetation cover based on RGB vegetation index and its application
- Lithofacies, petrography, and geochemistry of the Lamphun oceanic plate stratigraphy: As a record of the subduction history of Paleo-Tethys in Chiang Mai-Chiang Rai Suture Zone of Thailand
- Structural features and tectonic activity of the Weihe Fault, central China
- Application of the wavelet transform and Hilbert–Huang transform in stratigraphic sequence division of Jurassic Shaximiao Formation in Southwest Sichuan Basin
- Structural detachment influences the shale gas preservation in the Wufeng-Longmaxi Formation, Northern Guizhou Province
- Distribution law of Chang 7 Member tight oil in the western Ordos Basin based on geological, logging and numerical simulation techniques
- Evaluation of alteration in the geothermal province west of Cappadocia, Türkiye: Mineralogical, petrographical, geochemical, and remote sensing data
- Numerical modeling of site response at large strains with simplified nonlinear models: Application to Lotung seismic array
- Quantitative characterization of granite failure intensity under dynamic disturbance from energy standpoint
- Characteristics of debris flow dynamics and prediction of the hazardous area in Bangou Village, Yanqing District, Beijing, China
- Rockfall mapping and susceptibility evaluation based on UAV high-resolution imagery and support vector machine method
- Statistical comparison analysis of different real-time kinematic methods for the development of photogrammetric products: CORS-RTK, CORS-RTK + PPK, RTK-DRTK2, and RTK + DRTK2 + GCP
- Hydrogeological mapping of fracture networks using earth observation data to improve rainfall–runoff modeling in arid mountains, Saudi Arabia
- Petrography and geochemistry of pegmatite and leucogranite of Ntega-Marangara area, Burundi, in relation to rare metal mineralisation
- Prediction of formation fracture pressure based on reinforcement learning and XGBoost
- Hazard zonation for potential earthquake-induced landslide in the eastern East Kunlun fault zone
- Monitoring water infiltration in multiple layers of sandstone coal mining model with cracks using ERT
- Study of the patterns of ice lake variation and the factors influencing these changes in the western Nyingchi area
- Productive conservation at the landslide prone area under the threat of rapid land cover changes
- Sedimentary processes and patterns in deposits corresponding to freshwater lake-facies of hyperpycnal flow – An experimental study based on flume depositional simulations
- Study on time-dependent injectability evaluation of mudstone considering the self-healing effect
- Detection of objects with diverse geometric shapes in GPR images using deep-learning methods
- Behavior of trace metals in sedimentary cores from marine and lacustrine environments in Algeria
- Spatiotemporal variation pattern and spatial coupling relationship between NDVI and LST in Mu Us Sandy Land
- Formation mechanism and oil-bearing properties of gravity flow sand body of Chang 63 sub-member of Yanchang Formation in Huaqing area, Ordos Basin
- Diagenesis of marine-continental transitional shale from the Upper Permian Longtan Formation in southern Sichuan Basin, China
- Vertical high-velocity structures and seismic activity in western Shandong Rise, China: Case study inspired by double-difference seismic tomography
- Spatial coupling relationship between metamorphic core complex and gold deposits: Constraints from geophysical electromagnetics
- Disparities in the geospatial allocation of public facilities from the perspective of living circles
- Research on spatial correlation structure of war heritage based on field theory. A case study of Jinzhai County, China
- Formation mechanisms of Qiaoba-Zhongdu Danxia landforms in southwestern Sichuan Province, China
- Magnetic data interpretation: Implication for structure and hydrocarbon potentiality at Delta Wadi Diit, Southeastern Egypt
- Deeply buried clastic rock diagenesis evolution mechanism of Dongdaohaizi sag in the center of Junggar fault basin, Northwest China
- Application of LS-RAPID to simulate the motion of two contrasting landslides triggered by earthquakes
- The new insight of tectonic setting in Sunda–Banda transition zone using tomography seismic. Case study: 7.1 M deep earthquake 29 August 2023
- The critical role of c and φ in ensuring stability: A study on rockfill dams
- Evidence of late quaternary activity of the Weining-Shuicheng Fault in Guizhou, China
- Extreme hydroclimatic events and response of vegetation in the eastern QTP since 10 ka
- Spatial–temporal effect of sea–land gradient on landscape pattern and ecological risk in the coastal zone: A case study of Dalian City
- Study on the influence mechanism of land use on carbon storage under multiple scenarios: A case study of Wenzhou
- A new method for identifying reservoir fluid properties based on well logging data: A case study from PL block of Bohai Bay Basin, North China
- Comparison between thermal models across the Middle Magdalena Valley, Eastern Cordillera, and Eastern Llanos basins in Colombia
- Mineralogical and elemental analysis of Kazakh coals from three mines: Preliminary insights from mode of occurrence to environmental impacts
- Chlorite-induced porosity evolution in multi-source tight sandstone reservoirs: A case study of the Shaximiao Formation in western Sichuan Basin
- Predicting stability factors for rotational failures in earth slopes and embankments using artificial intelligence techniques
- Origin of Late Cretaceous A-type granitoids in South China: Response to the rollback and retreat of the Paleo-Pacific plate
- Modification of dolomitization on reservoir spaces in reef–shoal complex: A case study of Permian Changxing Formation, Sichuan Basin, SW China
- Geological characteristics of the Daduhe gold belt, western Sichuan, China: Implications for exploration
- Rock physics model for deep coal-bed methane reservoir based on equivalent medium theory: A case study of Carboniferous-Permian in Eastern Ordos Basin
- Enhancing the total-field magnetic anomaly using the normalized source strength
- Shear wave velocity profiling of Riyadh City, Saudi Arabia, utilizing the multi-channel analysis of surface waves method
- Effect of coal facies on pore structure heterogeneity of coal measures: Quantitative characterization and comparative study
- Inversion method of organic matter content of different types of soils in black soil area based on hyperspectral indices
- Detection of seepage zones in artificial levees: A case study at the Körös River, Hungary
- Tight sandstone fluid detection technology based on multi-wave seismic data
- Characteristics and control techniques of soft rock tunnel lining cracks in high geo-stress environments: Case study of Wushaoling tunnel group
- Influence of pore structure characteristics on the Permian Shan-1 reservoir in Longdong, Southwest Ordos Basin, China
- Study on sedimentary model of Shanxi Formation – Lower Shihezi Formation in Da 17 well area of Daniudi gas field, Ordos Basin
- Multi-scenario territorial spatial simulation and dynamic changes: A case study of Jilin Province in China from 1985 to 2030
- Review Articles
- Major ascidian species with negative impacts on bivalve aquaculture: Current knowledge and future research aims
- Prediction and assessment of meteorological drought in southwest China using long short-term memory model
- Communication
- Essential questions in earth and geosciences according to large language models
- Erratum
- Erratum to “Random forest and artificial neural network-based tsunami forests classification using data fusion of Sentinel-2 and Airbus Vision-1 satellites: A case study of Garhi Chandan, Pakistan”
- Special Issue: Natural Resources and Environmental Risks: Towards a Sustainable Future - Part I
- Spatial-temporal and trend analysis of traffic accidents in AP Vojvodina (North Serbia)
- Exploring environmental awareness, knowledge, and safety: A comparative study among students in Montenegro and North Macedonia
- Determinants influencing tourists’ willingness to visit Türkiye – Impact of earthquake hazards on Serbian visitors’ preferences
- Application of remote sensing in monitoring land degradation: A case study of Stanari municipality (Bosnia and Herzegovina)
- Optimizing agricultural land use: A GIS-based assessment of suitability in the Sana River Basin, Bosnia and Herzegovina
- Assessing risk-prone areas in the Kratovska Reka catchment (North Macedonia) by integrating advanced geospatial analytics and flash flood potential index
- Analysis of the intensity of erosive processes and state of vegetation cover in the zone of influence of the Kolubara Mining Basin
- GIS-based spatial modeling of landslide susceptibility using BWM-LSI: A case study – city of Smederevo (Serbia)
- Geospatial modeling of wildfire susceptibility on a national scale in Montenegro: A comparative evaluation of F-AHP and FR methodologies
- Geosite assessment as the first step for the development of canyoning activities in North Montenegro
- Urban geoheritage and degradation risk assessment of the Sokograd fortress (Sokobanja, Eastern Serbia)
- Multi-hazard modeling of erosion and landslide susceptibility at the national scale in the example of North Macedonia
- Understanding seismic hazard resilience in Montenegro: A qualitative analysis of community preparedness and response capabilities
- Forest soil CO2 emission in Quercus robur level II monitoring site
- Characterization of glomalin proteins in soil: A potential indicator of erosion intensity
- Power of Terroir: Case study of Grašac at the Fruška Gora wine region (North Serbia)
- Special Issue: Geospatial and Environmental Dynamics - Part I
- Qualitative insights into cultural heritage protection in Serbia: Addressing legal and institutional gaps for disaster risk resilience