Mineralogical and elemental analysis of Kazakh coals from three mines: Preliminary insights from mode of occurrence to environmental impacts
-
Medet Junussov
 ,
Farkhad Tarikhov
,
Farkhad Tarikhov

Abstract
This study aims to comprehensively characterize coal extracted from three active mines in northeastern Kazakhstan: Lenin, Saradyr, and Bogatyr. These mines exploit two Carboniferous coal-bearing formations, Dolyn and Karagandy. Dolyn, extracted by the Lenin underground mine at a depth of 700 m, contrasts with Karagandy, extracted at depths up to 260 m in Saradyr and Bogatyr. Six selected samples from the Lenin, Saradyr, and Bogatyr mines underwent various analyses, including proximate and ultimate analyses, elemental analyses (acid digestions with HCl + HNO3 + HF, ICP-MS), and determination of mineral matter contents (XRD and SEM-EDS). This research aimed to understand the mode of occurrence of minerals and elements, technological and environmental implications of the coal seams extracted from these mines. Results indicate low sulfur and high ash content in the organic matter of all samples. Quartz and kaolinite dominate, with minor euhedral pyrite present in all samples. Framboidal pyrite, iron oxides, and rare earth element (REE)-bearing minerals are exclusively found in Saradyr and Bogatyr samples. Quartz and kaolinite likely reached the peat swamp through detrital processes, while pyrite formation occurred through both syngenetic and epigenetic processes in the coal samples. Ratios like Ce n /Ce n , Eu n /Eu n , Y n /Ho n , and Gd n /Gd n suggest REE deposition in anoxic hydrothermal water environments, possibly indicating a tuffaceous origin for the coal samples. Examining the elements’ mode of occurrence suggests their preferential association with mineral matter. Strong positive correlations among elements like Al, K, Na, Ti, Ba, Be, Ni, Cr, Co, Ga, Sc, V, As, Pb, Cu, Zn, and Zr, along with Eu and Sc of the REEs, suggest association with ash yield, consistent with kaolinite and accessory minerals. Comparative analysis of inorganic geochemical composition of coal worldwide reveals notable depletion of major, trace elements, and REEs in samples from all three mines, suggesting limited economic interest. Furthermore, coal samples containing trace elements pose minimal environmental impact.
1 Introduction
Understanding coal mineralogy, and geochemistry is crucial for coal utilization and environmental management, impacting quality, processing methods, and resource exploration [1,2,3]. Coal is a complex mixture of both organic and inorganic components [4,5,6], formed through the diagenesis of organic matter, and characterized by a diverse range of minerals [7] and chemical elements [8,9,10]. Despite the inorganic fraction typically being a small part of coal, many challenges associated with coal are related to this component [11,12,13,14]. Inorganic materials in coal come from three main sources: a dissolved salt within the water-filled spaces (pores) in coals with a low rank, inorganic elements bound to organic compounds (into coal structures as a chelate), and mineral compounds [11,15,16,17]. Inorganic components provide geological insights into deposition and coal-bearing sequences [18], play a crucial role in controlling trace element pollution during coal activities [19,20], and have economic significance in exploring for essential trace elements, including rare earth elements (REEs, Y and Sc), precious metals (Au, Ag, PGE), radioactive metals (U, Th), and base metals (Al, Mg, Cu, Zn, Pb, etc.), and it has grown significantly in recent years [21,22,23,24,25].
Recently, metals have been discovered in coals from Central and Northeastern Kazakhstan. Coals from the Shubarkol deposit contain Y (254 ppm), Nd (806 ppm), La (46 ppm), and Gd (335 ppm) [26]. In contrast, earlier literature reports from the Karagandy coal basin contain Y (up to 54 ppm), Sc (up to 43 ppm), U (6.4 ppm), and Th (11.4 ppm) [27,28]. Additionally, coals from the Ekibastuz basin contain Ti and Zr (up to 1%), Y (up to 30 ppm), U (2.5 ppm), and Th (3.1 ppm) [27,28,29].
Coals in Kazakhstan mostly occur in the Carboniferous coal basins, but northeastern Kazakhstan hosts the largest Carboniferous coal basins, including Karagandy, Tenyz-Korzhinkol, and Ekibastuz, totaling 4,155 km² and holding the region’s highest coal reserves, amounting to 54.4 billion tons [27,28,30,31,32]. These areas are the primary target in this study for preliminary assessment of coal evaluation based on mineralogy and inorganic geochemistry of coals for further detailed investigation. The Carboniferous coals within these three basins vary in the number of total coal seams, ranging from 6 to 80. The thickness of these coal seams ranges from 1.5 to 100 m. The mineable coal seams (see Figure 1a–c) of the Carboniferous basins are primarily located in the Karagandy basin, which hosts approximately 10 underground coal mines, including the active Lenin mine, in the southwest Ekibastuz basin, which produces from the Bogatyr mine, in the east Tenyz-Korzhynkol basin, producing from the Saradyr mine. Mineralogy and geochemistry studies are still lacking for coals from the Saradyr and Bogatyr coal mines, as well as from Lenin, whereas similar studies have been conducted for one of the underground mines in the Karagandy coal basin, as reported in the literature [33]. Kopobayeva et al. [33] conducted parallel research on the “k7” seam of the Karagandy coal basin, finding trace elements (Ge, Ga, Se, Li, Th, U, and REE + Y), with most trace elements positively correlated with aluminosilicates components, suggesting an affinity with kaolinite clay minerals.

Geological map of three Carboniferous coal basins with active mining areas: (a) Ekibastuz (Bogatyr coal mine); (b) Tenyz-Korzhynkol (Saradyr coal mine); and (c) Karagandy (Lenin coal mine).
The Carboniferous coals are primarily classified as bituminous coal, known for their high ash content and varying sulfur levels, often exhibiting coking properties [27,28]. Within the Carboniferous coal basins, the coals differ in petrographic quality, predominantly composed of vitrinite (81%), liptinite (11%, mostly sporinite), and inertinite (8%). Vitrinite reflectance measurements indicate that the thermal maturity of the coals ranges from approximately 0.5 to 1.3% across the basins, as reported in earlier studies [27,28].
The aim of this study is to provide a preliminary analysis of the inorganic components in coals from three coal mines, addressing a key gap in knowledge regarding coal composition and its broader implications. The research focuses on areas with limited prior investigation and examines the mineral and elemental compositions of these coals, including their modes of occurrence, technological implications, and potential environmental impacts. By providing these preliminary insights, the study seeks to enhance understanding of Kazakh coals and contribute valuable knowledge to their industrial applications and environmental considerations.
2 Geological settings
The geological evolution of the coal deposits at Lenin, Saradyr, and Bogatyr, associated with the Karagandy, Tenyz-Korzhinkol, and Ekibastuz Carboniferous coal basins, respectively, has been extensively documented by various authors [27,28], and our understanding of their geological development within active mining areas is based on this research.
The Ekibastuz coal basin is restricted to the asymmetrical graben-syncline (8.5 × 24 km), and extends in the northwestern direction. It is bounded in the northeast and southeast by large faults with amplitudes of 1,000 m and 150 m, respectively. The Lower Carboniferous sequence shows coal-bearing formations of Nadkaraganda, Karagandy, Ashlyar, and Akkuduk, alternating with dark grey mudstone, siltstone, and green find-grained sandstones. The maximum depth of coal occurrences ranges between 530 and 680 m below the surface (Figure 1a).
The Teniz-Korzhynkol coal basin occurs as a large brachysynclinal structure (20 × 20 km2) including four small syncline structures of Qosmurun, Qyzylsor, Bozshasor, and Saradyr, formed as coal deposits, currently mined by open-pit only from the Saradyr coal deposit. A depth of coal occurrences reaches up to 1,800 m below the surface. Coal seams are found in the Lower Carboniferous formations of Karagandy, Ashlyar, and Akkuduk, occurring within sedimentary rocks of grey to dark clay, marl, mudstone, sandstone, and siltstone. The basin covers more magmatic intrusions than other basins. Magmatic intrusions are primarily composed of granite-porphyry and include dikes, sills, and a deeply buried batholith in contact with highly metamorphosed coals (Figure 1b).
The Karagandy coal basin has the largest area in Kazakhstan, a deep synclinal W-E striking structure with a width ranging from 30 km north to south, and a length of 120 km east to west. It hosts three synclinal troughs of Tentek, Churubay-Nurun, and Dubov separated by the Alabas and Maikuduk uplifts. The Carboniferous sequence ranges around 4,500 m in thickness. Coal is found in the Lower-Middle Carboniferous and the Lower-Middle Jurassic formations. Depths of the Carboniferous coal formation are up to 1,800 m while the Jurassic coal formation varies from 300 to 450 m. The Lower-Middle Carboniferous coal formations consist of deep coal seams in the Akkuduk, Ashlyar, and Karagandy formations, while the Nadkaragandy, Dolyn, Tentek, and Shahan formations contain shallow coal seams. Additionally, besides the Carboniferous period, coals in the Karagandy basin also formed during the Jurassic period (Figure 1c). The primary focus of coal extraction at Lenin mine is the Dolyn coal formation, which is 430–560 m thick and contains 11 thin coal seams ranging from 0.6 to 6 m in thickness. Currently, seam number 6, known as D6, is being mined.
There are two major cycles of Carboniferous coal accumulation documented in northeastern Kazakhstan: the Lower Carboniferous cycle, represented by the Akkuduk, Ashlyar, and Karagandy formations, and the Middle-Upper Carboniferous cycle, characterized by the Dolyn, Tentek, and Shahan formations (Figure 2). The Karagandy coal basin includes both of these Carboniferous cycles, while the Tenyz-Korzhinkol and Ekibastuz basins exhibit only the Lower Carboniferous cycle. The coal-bearing sedimentary sequences of these three Carboniferous coal basins are represented by three divisions. Their lowest horizons are characterized by marine carbonate-clay sediments, changing upward along the section by a thick complex of first coastal marine and then continental sandy-clayey coal-bearing sediments. The marine carbonate rocks were formed during the Devonian period, which serves as the basement rocks for the Carboniferous coal formations of the three coal basins. The most productive coal-bearing formations belong to the Lower Carboniferous across all three basins, while those from the Lower-Middle Carboniferous are found exclusively in the Karagandy coal basin (Figure 2).

Stratigraphy of three basins along with their associated active mining and sampling areas (Lenin in Karagandy basin; Saradyr in Tenyz-Korzhynkol basin; and Bogatyr in Ekibastuz basin).
The three Carboniferous basins begin with the Akkuduk formation, which is non-productive. Productive coal formations span from the Ashlyar to the Karagandy formations across all basins. However, the Karagandy basin extends further, encompassing productive coal formations from Nadkaragandy, Dolyn, and continuing to Shahan.
The thickest seam, D6 from the Dolyn formation, is currently mined at the Lenin mine. The other two coal mines of Saradyr and Bogatyr are actively engaged in coal production, focusing on the Karagandy coal formation, which shares similar names with the formations in the Ekibastuz and Tenyz-Korzhynkol coal basins.
3 Materials and methods
3.1 Study area and sample collection
The study area encompasses three major Lower-Middle Carboniferous coal mines of Lenin, Saradyr, and Bogatyr in northeast Kazakhstan (Figure 3a–c). Sampling at these mines was specifically chosen due to their status as the country’s oldest coal deposits, featuring extensive sedimentary deposition, high ash yield, substantial reserves, and significant mining activity, which makes them crucial for both industrial applications and environmental studies.

General overview map of three active coal mining areas: (a) Lenin underground mine (identified as Dolyn); (b) Saradyr coal mine; and (c) Bogatyr coal mine. The star symbol denotes the locations where coal sampling took place (a satellite map, Google Earth Pro 7.3).
Sampling was conducted across three operational coal mines Lenin, Saradyr, and Bogatyr. A total of six samples were collected and studied from working and exposed coal seams at the three locations. Using a grab sampling method, samples were collected from the top portion of a single coal seam at each mine and then combined through composite sampling to conduct a comprehensive analysis, which involved integrated mineralogical and inorganic geochemical investigations.
The six coal samples were selected: two samples from workable coal seam No 6 within the Dolyn coal formation in the underground Lenin mine (located in Shahtinsk town) at a depth of approximately 700 m; and four samples from the Saradyr (near Yerementau town) and Bogatyr (near Ekibastuz city) open-pit coal mines, ranging in depth from 140 to 260 m. All samples were stored in plastic bags to minimize potential contamination and oxidation. The coal samples are labeled as D1 and D2 (as sampled from Dolyn) from the Lenin mine, B1/0 and B1/1 (as sampled from seam No 1 out of three total seams) from the Bogatyr mine; and S1 and S2 from Saradyr mine.
3.2 Analytical methods
3.2.1 Sample preparation
The coal samples were prepared as polished blocks, powdered coal samples, and coal ash (coal combustion residuals). To obtain polished blocks, each sample underwent preparation, facilitating subsequent analysis through scanning electron microscopy. For the preparation of powdered coal samples, 2 g of each coal sample was accurately weighed and crushed to particle sizes ranging from ∼50 to 200 μm using an agate mortar and pestle. These powder samples were then prepared for bulk and elemental, proximate, and ultimate analyses.
Additionally, 1 g of powdered coal was weighed in a porcelain crucible to obtain coal ash and heated in an open muffle furnace (Carbolite ELF 11). This process involved two phases: first at 500°C for 30 min and then at 815°C for 60 min, followed by cooling after removal from the muffle furnace. These coal ash samples were then prepared for trace element (acid digestion) analysis, proposed by several authors [34,35]; while the preparation of low-temperature coal ash (LTA) for mineralogical composition analysis was conducted at 150°C for 60 min in a muffle furnace (Carbolite ELF 11), based on protocol described by various authors [36,37]. The detailed descriptions of all prepared samples used in analytical methods are provided in the subsequent sections.
3.2.2 Proximate and ultimate analysis
The proximate analysis was performed to determine ash yields and volatile matter content. Ash yields and volatile matter were measured using a Simultaneous Thermal Analyzer (STA 6000), in accordance with protocols described by several authors [38,39,40]. Both parameters were determined by heating the sample at 900°C for 7 min in a covered crucible under a nitrogen atmosphere.
An organic elemental analyzer (OEA, Elementar UNICUBE) for ultimate analysis determined the levels of selected organic elements of C, H, S, and N, following ASTM D5373-16.
3.2.3 Mineralogical, major and trace element (acid digestion) analyses
The six polished blocks were coated with carbon, and these samples were investigated under a scanning electron microscope in conjunction with energy-dispersive X-ray spectroscopy (SEM-EDS, Jeol JSM-IT200 LA) to observe minor mineral characteristics and to determine elemental distribution in the coal samples. The operating parameters were set to 20 kV acceleration voltage and high vacuum mode.
In addition, minerals in the coal were determined using LTA of coal on a Rigaku SmartLab X-ray diffractometer (XRD) machine with a Ni-filtered Cu Kα X-ray source (energy 8.04 keV and X-ray wavelength 1.5406 Å) and XRD pattern was recorded with a step size of 0.01°, over a 2θ interval of 2.6°–70° [41]. Further details demonstrating the use of this technique for coal-related materials are given by several authors [11,36,42,43]. The XRD evaluation of the LTA was conducted at room temperature. The X-ray diffractograms were subjected to quantitative mineralogical analysis using Crystal Impact software (Match), following methods from the literature [44].
Coal ash samples, each weighing 0.5 g, underwent the 6 ml HCl, 2 ml of HNO3, and 2 ml of HF-lean hot block digestion process, proposed by various authors [45,46]. The heating of samples was up to 180°C for 1 h in a hot block digestion system (HotBlock 200), and made syringe filtration with a 0.2-μm filter. Dilution factor - 100 ppb. The filtrated liquids were then analyzed using ICP-MS (Thermo Fisher Scientific iCAP RQ) equipment to determine the quantities of major and trace elements. The digestion of International Reference Materials and blanks involved preparation and analysis following the same procedure. During coal ash preparation and digestion, volatile elements like mercury (Hg), arsenic (As), and selenium (Se) can be lost due to high temperatures, and some trace elements may be lost during acid digestion or filtration [47–49], all of which have been considered in our analysis.
All analytical analyses and lab works were conducted at the Core Facilities and laboratories of the School of Mining and Geosciences, Nazarbayev University in Astana, Kazakhstan.
4 Results
4.1 Results of proximate and ultimate analysis
Results from the proximate and ultimate of all coal samples are presented in Table 1. The coal samples D1 and D2 demonstrate relatively low ash yields (up to 15%), the highest C content (81.5 and 83.9%), and volatile matter (up to 23%). In contrast, the coal samples from Saradyr and Bogatyr present comparatively low carbon content (31.6 and 58.1%) and high ash yields (36.5–55.1%). Volatile matter contents (up to 24.7%) are similar to those from D6 samples. Furthermore, all samples demonstrate low sulfur contents (0.2–0.5%); and relatively high nitrogen (up to 2.1%) and hydrogen contents (up to 4.9%) in the D1 and D2 samples. Conversely, Saradyr and Bogatyr samples show comparatively lower nitrogen content (0.6–1.8%) and higher hydrogen content (2–3.7%).
Ranges of the values obtained from proximate and ultimate analyses of the coal samples from three coal mines (Unit for all parameters: %)
| Samples | D1 | D2 | S1 | S2 | B1/0 | B1/1 |
|---|---|---|---|---|---|---|
| Ash yields (d) | 15.0 | 12.0 | 40.0 | 36.5 | 55.1 | 36.2 |
| Volatile matter (daf) | 22.5 | 23.0 | 24.6 | 22.1 | 16.1 | 24.7 |
| C (d) | 81.5 | 83.9 | 56.3 | 40.0 | 31.6 | 58.1 |
| H (d) | 4.77 | 4.91 | 3.39 | 3.03 | 2.03 | 3.74 |
| S (d) | 0.2 | 0.2 | 0.5 | 0.3 | 0.5 | 0.4 |
| N (d) | 1.8 | 2.1 | 0.75 | 0.64 | 0.74 | 1.81 |
Note: d – dry basis; daf – dry, ash-free basis.
4.2 Mineralogical characteristics
Based on the results of XRD analysis, and SEM-EDS, the samples primarily consist of kaolinite, quartz, and pyrite. Additionally, SEM-EDS data also revealed the presence of accessory minerals such as apatite, barite, chalcopyrite, galena, monazite, rutile, ilmenite, and zircon. The mineralogical contents of the samples from the Bogatyr and Saradyr mines are relatively similar to each other and are comparable to those from the Lenin (Dolyn) mine (Table 2 and Figure 4).
Mineral contents in six coal samples from the three coal mines, measured by Low-temperature ashing X-ray diffraction (LTA-XRD) and SEM
| Minerals | Samples | |||||
|---|---|---|---|---|---|---|
| D1 | D2 | S1 | S1 | B1/0 | B1/1 | |
| Quartz | +++ | +++ | +++ | +++ | +++ | +++ |
| Kaolinite | ++ | ++ | ++ | ++ | ++ | ++ |
| Pyrite | ± | ± | + | + | + | + |
| Apatite | a | |||||
| Fluorapatite | a | |||||
| Monazite | a | |||||
| Barite | a | |||||
| Iron oxide | a | |||||
| Rutile | a | |||||
| Ilmenite | a | |||||
| Zircon | a | |||||
| Chalcopyrite | a | a | ||||
Note: +++ - dominant phase >20 wt%, ++ – abundant phase 20–5 wt%, + – minor phase <5 wt%, and ± – detected in a few samples by XRD, a: accessory mineral detected by SEM-EDS.

X-ray diffraction (XRD) patterns of six coal samples from three active mines. Abbreviations: Q-quartz; K-kaolinite; P-pyrite.
The dominant silicate mineral phases varied among the studied samples, with quartz and kaolinite being particularly prominent. Quartz and kaolinite were identified as the most dominant minerals in all samples. Kaolinite is present as pore- and cell-fillings within the coal, whereas quartz is observed as angular grains and occasionally as particles exhibiting good abrasion, appearing as rounded or subangular quartz grains, as shown in Figures 5–7. Additionally, pyrite was the only minor mineral detected in a few samples by XRD. Accessory minerals, including chalcopyrite, barite, rutile, ilmenite, iron oxide, REE minerals, and zircon, were detected in all samples except for those from the Lenin mine, as identified during SEM-EDX studies. The accessory minerals, consistently found in association with kaolinite crystal grains, were identified through SEM-EDS analysis as cleat/pore-infilling minerals within the coal.
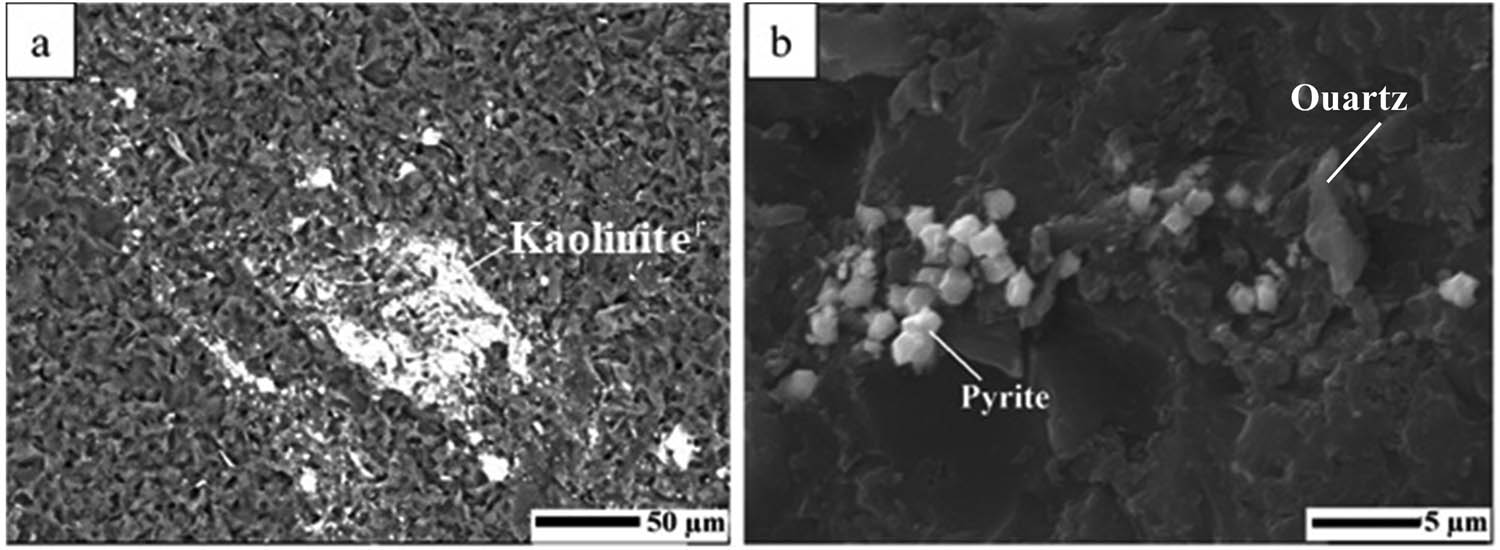
Selected SEM microphotographs (backscattered images) of crystalline phases in the studied coal samples: (a) D1 sample, individual kaolinite crystal; and (b) D2 sample, detailed view of a framboidal pyrite.
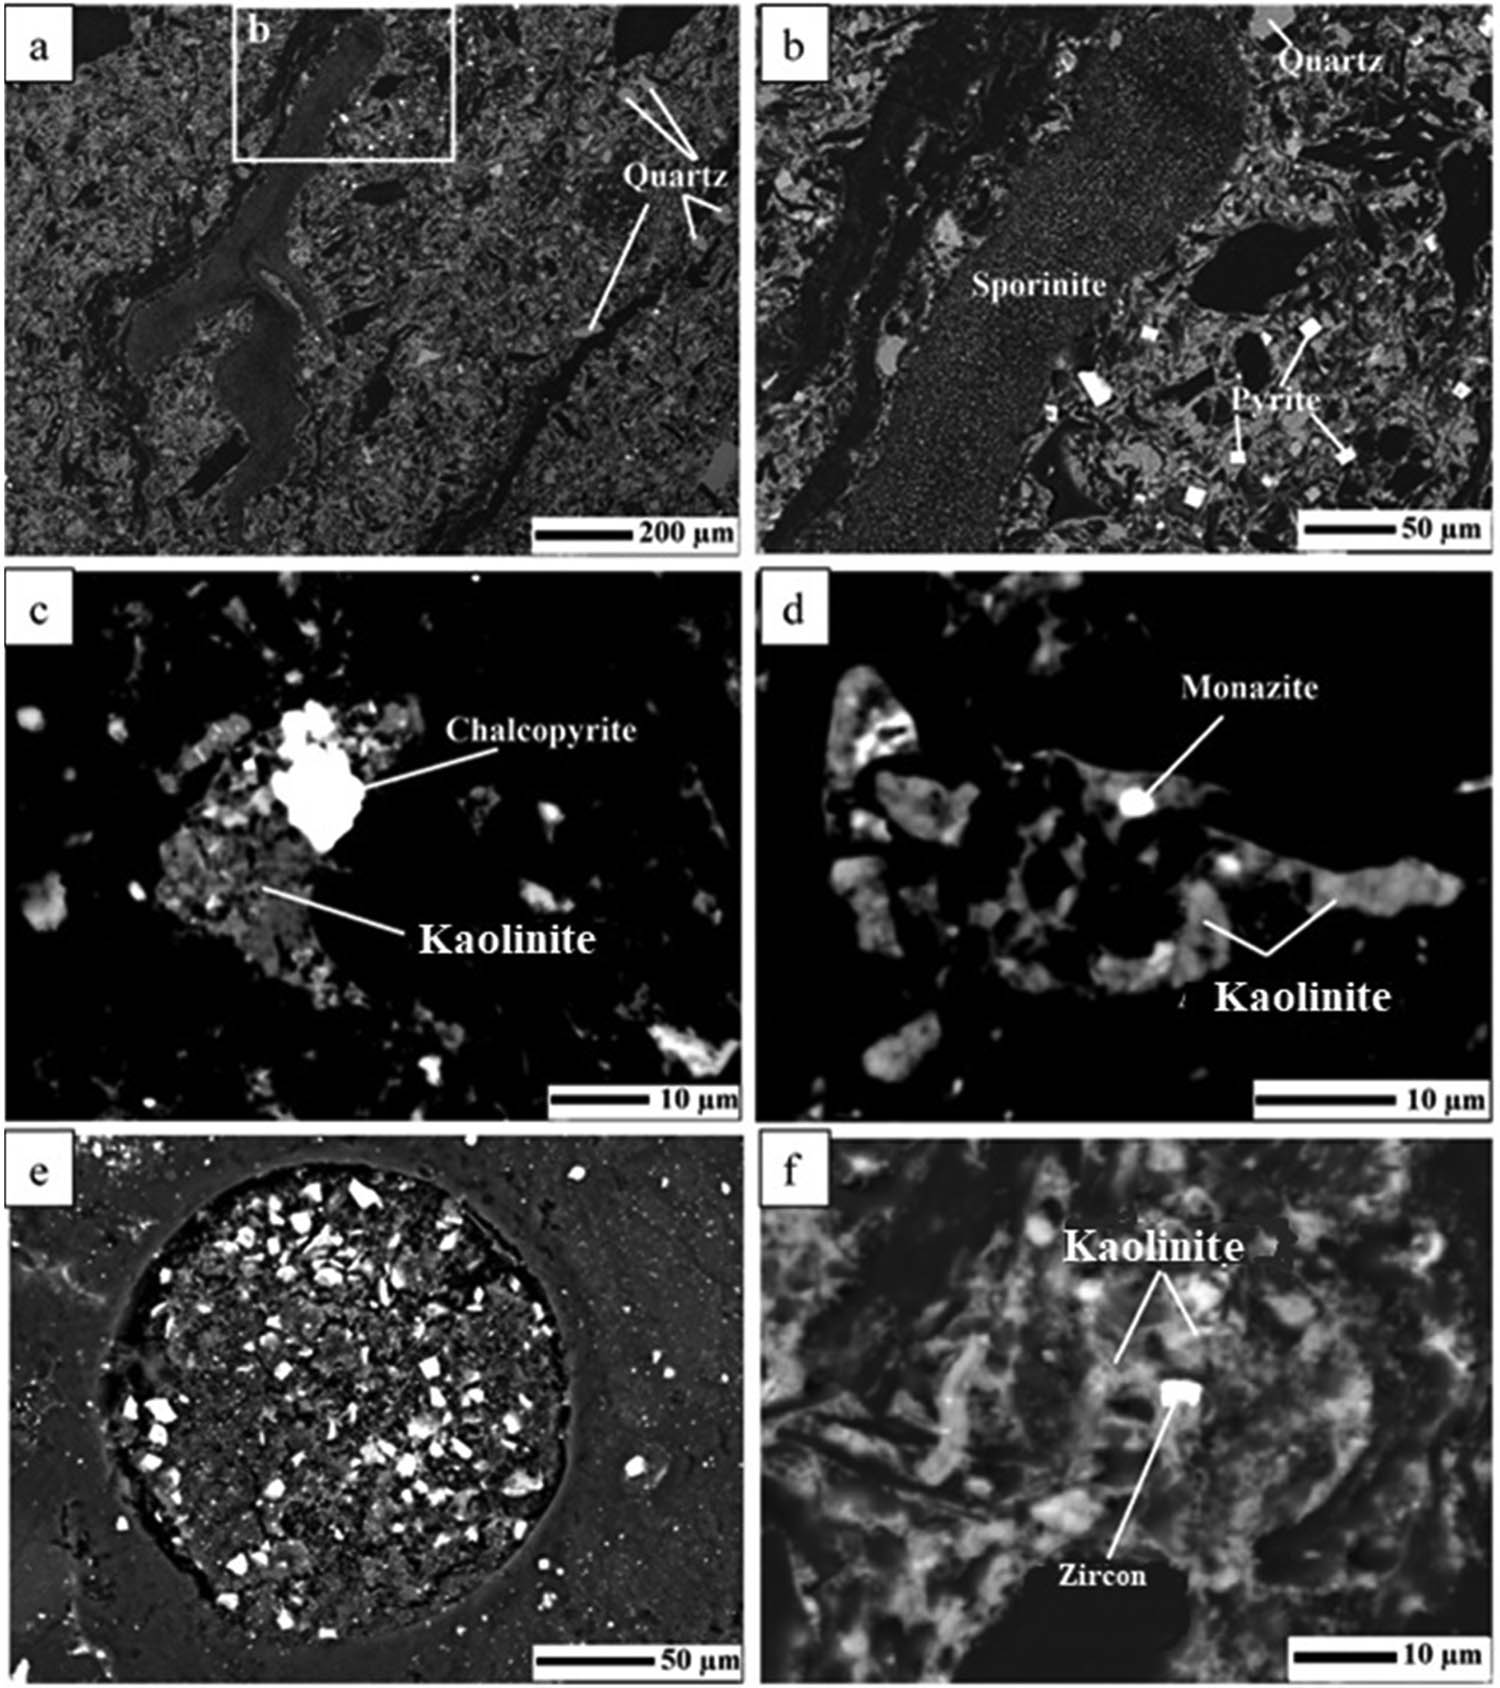
Selected SEM microphotographs (backscattered images) of crystalline phases in coal samples S1 (a–d) and S2 (e–f): (a) and (b) crystal growth of quartz and pyrite surrounding sporinite fragment; (c) chalcopyrite crystals associated with kaolinite matrix; (d) monazite minerals associated with kaolinite matrix; (e) euhedral pyrite crystals associated with coal pores; and (f) zircon crystal associated with kaolinite matrix.

Selected SEM microphotographs (backscattered images) of crystalline phases in coal samples B1/0 (a–e) and B1/1 (f–g): (a) framboidal pyrite and individual fluorapatite and apatite crystals associated with kaolinite matrix; (b) framboidal pyrite, quartz, and kaolinite; (c) chalcopyrite crystals associated with kaolinite matrix; (d) barite associated with kaolinite matrix; (e) quartz and chalcopyrite crystals associated with kaolinite matrix; (f) individual crystals of ilmenite and rutile, as well as quartz occurring within coal fractures; and (g) individual kaolinite crystals associated coal matrix.
The samples of D1 and D2 are enriched in quartz and kaolinite, with minor amounts of pyrite. Accessory minerals were not observed in these samples (Figure 6a and b). Quartz occurs as grains of variable roundness (around 5–10 µm), kaolinite is mainly distributed along the bedding planes and in the cleats of the coals, while pyrite occurs as isolated euhedral pyrite particles with sizes ranging from 0.5 to 2 µm (Figure 5).
The samples from S1 and S2 primarily consist of quartz grains with a size of around 25 µm, along with kaolinite distributed along the bedding planes and in the cleats of the coals. Additionally, minor amounts of euhedral pyrite, with sizes of up to 10 µm, are observed in the samples. Within the kaolinite grains, accessory minerals such as chalcopyrite (10 µm), zircon (5 µm), and monazite (3–4 µm) were identified within the coals (Figure 6a–f).
The samples from B1/0 and B1/1 are mainly composed of quartz grains ranging in size from 5 to 10 µm. Additionally, kaolinite is distributed along the bedding planes and in the cleats of the coals within these samples. Minor amounts of pyrite are also present, occurring in two forms: euhedral (7 µm) and framboidal (10 µm). Accessory minerals, including chalcopyrite (up to 10 µm), barite (3–5 µm), fluorapatite (4 µm), and apatite (2 µm), were observed within the kaolinite grains. Additionally, rutile (3 µm) and ilmenite (2 µm) were identified as fracture-infilling minerals within the coals (Figure 7a–f).
4.3 Contents of major and trace elements
The geochemical composition of the major elements in the samples generally exhibits similarities, with Al and Fe being the most abundant elements, each exceeding 1%. This is followed by lower concentrations of Ca, K, Mg, Na, P, and Ti (<1%). Notably, the most abundant elements show significantly higher concentrations in the majority of samples from the Saradyr and Bogatyr mines (Figure 8a). This observation is attributed to the presence of kaolinite, pyrite, and iron oxides, which were identified during LTA-XRD and SEM-EDS studies.

The concentrations of major (a) and trace elements (b) in six coal ash samples from the three coal mines; and comparison of the mean concentration values versus the WHC (c) and Clarke values for the Earth’s crust (CC) (d).
In terms of trace elements, their contents are generally similar among the samples from each area, except for those from the Lenin mine. Samples from the Saradyr and Bogatyr mines exhibit comparatively higher trace element concentrations, with more than 250 ppb of Cu, Zr, V, Zn, Mn, Sc, LREE, and REE, while other elements have values lower than 250 ppb (Figure 8b). The mean values of the trace elements show concentrations higher than 0.1 ppm for Zr, Cu, Sc, and V, while the remaining elements have concentrations lower than 0.1 ppm. Furthermore, all elements in the coal ash samples exhibit significantly lower concentrations compared to trace element concentrations in world hard coal combustion (WHC) [9] (Figure 8c). While the average values of the major elements Al, K, Ti, P, and Ba in the coal ash samples from Saradyr and Bogatyr, except for those from Dolyn, are higher than the average Clarke values for the Earth’s crust (CC), the remaining major elements, such as Ca, Fe, Mg, and Na, are lower than the CC [9,50,51] (see Table 3; Figure 8d).
Major and trace element concentrations in coal ash samples after acidic leaching, compared to the average geochemical composition of WHC and CC
| Elemental content of samples (trace elements in ppb) | Mean value (trace elements in ppm) | ||||||||||
|---|---|---|---|---|---|---|---|---|---|---|---|
| Element | D1 | D2 | S1 | S2 | B1/0 | B1/1 | Dolyn | Saradyr | Bogatyr | WHC | CC |
| Al (%) | 6.5 | 5.1 | 16.8 | 21.7 | 21.3 | 4.6 | 5.8 | 19.2 | 12.9 | n.a. | 8.23 |
| Ca (%) | 1.3 | 0.3 | 0.5 | 0.6 | 1.0 | 0.9 | 0.8 | 0.5 | 0.9 | n.a. | 4.15 |
| P (%) | 0.12 | 0.12 | 0.05 | 0.14 | 0.09 | 0.22 | 0.12 | 0.095 | 0.31 | 0.15 | 0.10 |
| Fe (%) | 1.4 | 1.1 | 0.8 | 9.1 | 3.3 | 0.2 | 1.25 | 4.9 | 1.7 | n.a. | 5.63 |
| K (%) | 0.2 | 0.2 | 2.3 | 3.9 | 2.5 | 0.2 | 0.2 | 3.1 | 1.3 | n.a. | 2.09 |
| Mg (%) | 0.4 | 0.1 | 0.2 | 0.5 | 0.1 | 0.3 | 0.25 | 0.3 | 0.2 | n.a. | 2.33 |
| Na (%) | 0.2 | 0.1 | 1.4 | 2.6 | 1.3 | 0.8 | 0.15 | 2 | 1.05 | n.a. | 2.36 |
| Ti (%) | 0.1 | 0.8 | 1.5 | 3.3 | 1.9 | 0.2 | 0.45 | 2.4 | 1.05 | 0.53 | 0.57 |
| Ba (%) | 0.025 | 0.116 | 0.042 | 0.017 | 0.38 | 0.02 | 0.070 | 0.030 | 0.20 | 0.98 | 0.04 |
| Ag | n.a. | n.a. | 0.5 | 1.74 | 1.33 | n.a. | n.a. | 0.001 | 0.001 | 0.63 | 0.12 |
| As | 20.2 | 13.9 | 16.5 | 37.62 | 117.5 | 14.4 | 0.017 | 0.03 | 0.066 | 46 | 7.6 |
| Be | 1.6 | 1.0 | 7.2 | 8.40 | 9.7 | 1.0 | 0.003 | 0.007 | 0.005 | 12 | 1.9 |
| Co | 3.8 | 2.0 | 16.1 | 18.8 | 60.8 | 8.1 | 0.003 | 0.017 | 0.034 | 37 | 25 |
| Cr | n.a. | 12.4 | 38.2 | 69.9 | 47.2 | 35.1 | n.a. | 0.054 | 0.041 | 120 | 100 |
| Cu | 44.7 | 48.3 | 196.6 | 217.5 | 262.2 | 82.0 | 0.046 | 0.20 | 0.172 | 110 | 55 |
| Ga | 9.5 | 6.8 | 54.8 | 113.6 | 78.5 | 10.6 | 0.008 | 0.084 | 0.044 | 36 | 15 |
| Li | 54.4 | 49.9 | 135.9 | 272.1 | 81.8 | 24.2 | 0.052 | 0.204 | 0.053 | 82 | 33 |
| Mn | 51.7 | 29.2 | 39.5 | 282.8 | 113.8 | 64.6 | 0.040 | 0.612 | 0.089 | 430 | 830 |
| Ni | n.a. | n.a. | 8.8 | 14.2 | 53.4 | 5.5 | n.a. | 0.011 | 0.029 | 100 | 37 |
| Pb | 7.6 | 6.1 | 137.8 | 75.1 | 73.4 | 3.8 | 0.007 | 0.106 | 0.038 | 55 | 12.5 |
| Zr | 78.2 | 33.2 | 545.3 | 696.0 | 565.8 | 79.9 | 0.056 | 0.620 | 0.322 | 230 | 165 |
| V | 200.0 | 83.1 | 343.0 | 442.7 | 415.1 | 48.1 | 0.141 | 0.392 | 0.231 | 170 | 135 |
| Zn | 16.4 | n.a. | 499.3 | 35.8 | 331.3 | 28.2 | 0.008 | 0.267 | 0.179 | 170 | 70 |
| Th | n.a. | n.a. | 16.0 | 9.1 | n.a. | n.a. | n.a. | 0.012 | n.a. | 23 | 9.6 |
In comparison to the average Clarke values for the Earth’s crust (CC), the concentrations of trace elements in the samples are all lower than those values [9,50,51] (Table 3; Figure 8d).
4.4 Contents of REE in coal ashes
The results of REEs analysis were presented for samples from Saradyr and Bogatyr mines, as samples from Dolyn either showed no detectable REE or had content below the limit of quantification of the ICP-MS (Table 4). This was further confirmed by SEM-EDS analysis. ICP-MS was employed to assess the quantity and distribution of REE in the four coal ash samples, as presented in Table 4 and Figure 9. Coal, derived from the upper layers of the Earth’s crust and sharing genetic similarities with the upper continental crust (UCC), often normalizes REE found in coal or coal-related materials to the average abundance of REEs in the UCC, aiding in the comparison and understanding of their distribution and behavior in coal samples within a broader geological context [52]. The total REEs (TREEs: light REE (La–Eu) and heavy REE (Gd–Lu + Y)) observed in Saradyr were higher at 0.52 ppm compared to Bogatyr at 0.38 ppm, yet they did not exceed the average TREEs of world coal ash (435.5 ppm), US coal ash (459.6 ppm), Chinese coal ash (473.0 ppm) or Clarke value of the Earth’s crust (164.3 ppm), as reported by several authors [9,53], see Table 5. This indicates that the REEs values in the examined coal ash samples are relatively low.
ICP-MS analysis results showing the concentration of REE (TREEs, C outlook together with important REE ratios, UCC values [53], in coal ash samples after the acidic leaching procedure
| REE | Isotope (m/z) | LLOQ (ppb) | Samples and elemental concentration (ppb) | UCC (ppm) | |||||
|---|---|---|---|---|---|---|---|---|---|
| S1 | S2 | Σelement (ppb) | B1/0 | B1/1 | Σelement (ppb) | ||||
| La | 139 | 0.07 | 18.56 | 2.61 | 21.17 | 3.76 | 2.49 | 6.25 | 30 |
| Ce | 140 | 0.03 | 44.61 | 5.4 | 50.01 | 6.58 | 6.47 | 13.05 | 64 |
| Pr | 141 | 0.03 | 4.36 | 0.88 | 5.24 | 0.73 | 0.8 | 1.53 | 7.1 |
| Nd | 146 | 0 | 19.13 | 4.03 | 23.16 | 1.59 | 4.08 | 5.67 | 26 |
| Sm | 147 | 0.11 | 5.13 | 1.09 | 6.22 | 0.28 | 1.24 | 1.52 | 4.5 |
| Eu | 153 | 0 | 1.08 | 0.21 | 1.29 | 0.12 | 0.77 | 0.89 | 0.88 |
| Sc | 45 | 2.37 | 180.64 | 198.49 | 379.1 | 87.96 | 251.89 | 339.85 | 13.6 |
| Gd | 157 | 0.2 | 4.5 | 1.09 | 5.59 | 0.47 | 1.09 | 1.56 | 3.8 |
| Tb | 159 | 0.03 | 0.71 | 0.12 | 0.83 | 0.08 | 0.21 | 0.29 | 0.64 |
| Dy | 163 | 0 | 4.9 | 1.19 | 6.09 | 0.74 | 1.53 | 2.27 | 3.5 |
| Y | 89 | 0.04 | 15.34 | 2.83 | 18.17 | 4.66 | 4.41 | 9.07 | 22 |
| Ho | 165 | 0 | 0.85 | 0.21 | 1.06 | 0.2 | 0.31 | 0.51 | 0.8 |
| Er | 166 | 0.11 | 2.63 | 0.8 | 3.43 | 0.55 | 0.93 | 1.48 | 2.3 |
| Tm | 169 | 0.03 | 0.57 | 0.09 | 0.66 | 0.14 | 0.16 | 0.3 | 0.33 |
| Yb | 172 | 0 | 4.01 | 0.93 | 4.94 | 0.71 | 0.71 | 1.42 | 2.2 |
| Lu | 175 | 0.03 | 0.4 | 0.25 | 0.65 | 0.07 | 0.13 | 0.2 | 0.32 |
| Σeach sample (ppb) | 307.4 | 220.2 | 527.6 | 108.6 | 277.2 | 385.8 | |||
| ΣTREEs (ppm) | 0.52 | 0.38 | |||||||
| ΣHREEs (ppm) | 0.04 | 0.02 | |||||||
| ΣLREEs (ppm) | 0.48 | 0.36 | |||||||
| ΣCREEs (ppm) | 0.052 | 0.019 | |||||||
| ΣUREEs (ppm) | 0.038 | 0.010 | |||||||
| C outlook | 1.3 | 1.9 | |||||||
Note: LLOQ – lower limit of quantification; UCC – upper continental crust.

The concentrations of REEs in four coal ash samples from the two coal mines.
Comparison of the abundances of REEs in coal ash from around the world, including the US and China (Sc value not available) (Unit: ppm)
| REE | US coal asha | Chinese coal ashb | World coal ashc | Clarke value of the crustd |
|---|---|---|---|---|
| La | 73.5 | 84.4 | 73.1 | 32 |
| Ce | 161.6 | 176.8 | 156.8 | 52 |
| Pr | 17.2 | 19.1 | 17.0 | 6.8 |
| Nd | 74.3 | 75.3 | 71.2 | 24 |
| Sm | 14.3 | 13.7 | 13.2 | 5.5 |
| Eu | 3.0 | 2.5 | 2.6 | 0.94 |
| Gd | 14.8 | 14.1 | 13.5 | 4.0 |
| Tb | 2.3 | 2.0 | 2.0 | 0.69 |
| Dy | 12.3 | 11.3 | 11.0 | 3.6 |
| Y | 68.2 | 57.4 | 58.5 | 29 |
| Ho | 2.2 | 2.2 | 2.1 | 0.92 |
| Er | 7.7 | 6.5 | 6.9 | 1.7 |
| Tm | 1.0 | 0.9 | 0.9 | 0.78 |
| Yb | 6.5 | 5.9 | 5.8 | 2.0 |
| Lu | 0.9 | 0.9 | 0.8 | 0.44 |
| TREEs (ppm) | 459.6 | 473.0 | 435.5 | 164.3 |
The highest individual REEs values observed in both mine samples include comparatively much higher Sc (0.33–0.37 ppm), followed by Ce (13–50 ppb), Nd (5–23 ppb), Y (9–18 ppb), and La (6–21 ppb), while the concentrations of the remaining REEs are all less than 6 ppb.
In this study, an important criterion proposed by Seredin [54] was employed to evaluate both mine coal ash samples as potential sources of REEs. This criterion, known as the outlook coefficient (C outlook), assesses the quality of coal ash in coal deposits based on the ratio of the sum of CREEs (critical elements Nd, Eu, Tb, Dy, Er, Y) to the sum of UCREEs (uncritical elements Ce, Ho, Tm, Yb, Lu) relative to TREEs (the sum or total content of all 17 REEs), as shown in equation (1) [23].
The C outlook values of both mine samples (1.3–1.9) significantly exceed the C outlook value of 0.64 for world coals, as determined by Dai and Finkelman [23], indicating a high potential industrial value for REEs [23] due to elevated concentrations of CREEs, notably Y and Nd. Nevertheless, the exceedingly lower concentrations of TREEs in these coal samples compared to the world average TREEs indicate a low economic value in the studied samples.
5 Discussion
5.1 Mode of occurrence of minerals, and major and trace elements in coal
5.1.1 Modes of occurrence of minerals in coals
The in situ weathering of coal may involve natural oxidation at low temperatures, resulting in changes to both organic and inorganic components [58–61]. Considering the effects outlined in the literature [61], it appears that the studied samples may have been relatively minimally affected by weathering processes (Table 6). The coal samples, except those from the Dolyn, exhibit high mineralogical distribution, as confirmed by LTA-XRD and SEM-EDS analyses. Quartz, a major mineral found in all coal samples, appears as variable rounded grains and is absent as fracture fillings. It could be indicative of a detrital origin and may also result from syngenetic alteration of aluminosilicate minerals [11].
Depositional characteristics of minerals from all coal samples were conducted using XRD and SEM-EDS. Solid lines denote confirmed minerals, while dashed lines represent possible identifications
 |
Kaolinite is predominantly distributed along the beddings and in the pores of the coals in all samples. According to Ribeiro et al. [62] kaolinite, likely derived from the weathering of detrital materials, is found in the pores and cell cavities of coals, suggesting a possible authigenic origin [12]. The low sulfur content (up to 0.5%) observed in all coal samples may suggest a non-marine origin, potentially indicating deposition in lacustrine and swamp environments [12]. As previous authors investigated these coal formations also confirmed this concept [27,28].
Pyrite may vary as the predominant sulfide mineral in all coals [11,63,64], with its concentration varying significantly among different coal samples. Euhedral pyrite appears to be more abundant than framboidal pyrite, with both types being exclusively found in samples from Bogatyr (Figure 10a), which may be associated with slightly higher total sulfur contents 0.84 and 0.93%. The deposition of pyrite, in the absence of marine influence and the low sulfur presence in the coals likely reflects conditions during the peat accumulation stage, including a high-water table, high pH, and low Eh environment [12]. Euhedral pyrite often appears to fill the pores and cavities in organic matter, while syngenetic pyrite is rarely found as individual framboids associated with coals. These modes of crystallization may suggest that pyrites are predominantly formed through epigenetic processes, with some contribution from syngenetic processes. This occurrence could imply sulfide mineralization during or shortly after peat accumulation [12]. Accessory minerals are closely associated with kaolinite grains in all studied samples. Individual grains of accessory minerals (Figure 10b–d; Table 6) were challenging to locate in the samples, potentially due to their small size, sporadic distribution, and minute dimensions. Among these minerals were sulfide minerals such as chalcopyrite, with a size of 2 µm and an epigenetic origin. Sulfate minerals such as barite were very rare, only found in the sample of B1/0. Additionally, rare earth element (REE) minerals, like monazite, were observed, with a size around 2 µm in samples of Saradyr and apatite minerals in the samples of Bogatyr.

Selected SEM images and EDS spectra of samples. (a) General view of sample B1/0 showing the occurrence of pyrite crystals (EDS spectrum 1); (b) Sample B1/1, the individual crystal of iron oxides (EDS spectrum 2). Sample S1: (c) Detailed view of minor-sized chalcopyrite crystal (EDS spectrum 3), and (d) Detailed view of tiny-sized monazite (Ce) crystal associated with kaolinite matrix (EDS spectrum 4).
The mineral occurrence in the samples from all three mines may be predominantly characterized by syngenetic minerals, followed by epigenetic minerals, which could contribute to higher ash yields and volatile matter contents.
The observed detrital minerals and lack of marine organic matter in the studied samples are consistent with the continental depositional environment inferred for these coal formations, likely representing fluvial or lacustrine deposits [65].
5.1.2 Mode of occurrence of major and trace elements in coals
Understanding the distribution of major and trace elements in coal involves recognizing their occurrence within both organic and inorganic phases [7,66]. The elemental composition of coal is influenced by the conditions prevailing during its formation and may undergo alterations throughout the coalification process [67]. This knowledge is crucial for assessing the potential environmental impact when coal is mined, stored, or utilized [8,11,22]. It may also play a significant role in evaluating strategies to reduce specific element contents in coal products through selective mining and preparation processes [11,15,68].
The investigation into the elemental occurrence within the studied samples involved the usage of Pearson’s correlation coefficients. These coefficients, ranging from −1 to 1, signify the extent of the linear relationship between two metric variables, organic carbon content (OC) and ash yields. Thus, the correlation of the element concentrations with ash yield derived from Pearson’s correlation may offer insights into the organic and inorganic affinities of the elements [69–72]. The classification proposed by Kus et al. [61] divides elements based on their correlation with ash yields into three groups: (i) elements with a strong positive correlation (r ash > 0.5) are associated with inorganic content, (ii) elements with a significant negative correlation (r ash < −0.5) are linked with organic content, and (iii) elements with correlation coefficients (−0.5 < r ash < 0.5) exhibit intermediate affinity (both organic and inorganic).
The results suggest (Table 7; Figure 11) a possible division of elements into two groups based on their correlation coefficients. The first group, including elements such as Al, K, Na, Ti, Ba, Be, Ni Cr, Co, Ga, Sc, V, As, Pb, Cu, Zn, and Zr shows a significant positive correlation (r ash > 0.5) with ash yield, suggesting a preference for association with mineral matter. The second group, consisting of Fe, Mn, Mg, P, Li, Th, and Ca, exhibits correlation coefficients below statistically significant values (−0.5 < r ash < 0.5), which may suggest an intermediate organic–inorganic affinity [61].
Pearson correlation coefficient matrix (r) between geochemical parameters for six coal samples
 |

Correlation coefficient between major, trace elements, and ash yield/OC.
The strong correlation observed between Al and ash yield, coupled with elevated ratios like Al/K, Al/Ti, Al/Fe, Al/Na, Al/Zr, and Al/Cu, suggests the presence of kaolinite and its possible association with accessory minerals (rutile, ilmenite, chalcopyrite, pyrite, zircon, etc.), as confirmed by SEM-EDS analysis.
No clear positive correlations were observed between Ca and Mg with ash yields, which may be consistent with findings from other authors [61]. Additionally, elements such as Fe, Th, P, Li, and Mn also lacked significant correlations. The absence of significant positive or negative correlations between Ca and Mg indicates the absence of carbonate minerals. Additionally, Fe is primarily associated with iron oxides and framboidal pyrite (of sulfate-reducing bacteria origin) within organic matter, demonstrating organic affinity, and with euhedral pyrite, found with kaolinite indicates an inorganic affinity. Other elements (P, Th, Li, Mn) do not show positive correlations with each other and are found between inorganic and organic fractions, suggesting that they are not primarily derived from minerals. These observations are supported by analyses from ICP-MS, LTA-XRD, and SEM-EDS. Table 7 presents p-values used to estimate the probability of replicating statistically significant results from an initial study, including for correlation coefficients. Each correlation coefficient in the matrix is paired with a significance level (***p < 0.001, **p < 0.01, *p < 0.05, p ≥ 0.05, not significant). These significance levels help assess the strength of the correlations and the confidence in rejecting the null hypothesis, aiding in the evaluation of the reliability of results for future studies.
5.1.3 Mode of occurrence of REE in coals
The occurrence of REE within the studied coal samples was analyzed using Pearson’s correlation coefficients. These coefficients, ranging from −1 to 1, indicate the strength of the linear relationship between two metric variables: OC and ash yields. Based on the correlation results, three distinct groups of elements show: Eu and Sc show a positive correlation (0.5–0.75) with ash content (1), while elements La, Ce, and Y exhibit positive correlation (up to 0.56) with organic matter (2). The remaining elements (Pr, Nd, Sm, Gd, Tb, Dy, Ho, Er, Tm, Yb, and Lu) are classified into the intermediate affinity group (3), see Table 8 and Figure 12 for details. Table 8 presents p-values estimating the likelihood of replicating statistically significant findings from the REE distribution study, particularly for correlation coefficients. Each correlation coefficient in the matrix is accompanied by a significance level (***p < 0.001, **p < 0.01, *p < 0.05, p ≥ 0.05, not significant), indicating both the strength of the correlation and the confidence in rejecting the null hypothesis.
Pearson correlation coefficient matrix (r) between parameters for the four coal samples from the two coal mines (blue-positive and red-negative correlation)
 |

Correlation coefficient between elements and ash yield/Total organic carbon.
Dai and Finkelman [23] have proposed that the ratios La n /Lu n , La n /Sm n , and Gd n /Lu n highlight anomalies in REE enrichment and offer insights into REE accumulation during coal formation. Analyzing the La n /Lu n , La n /Sm n , and Gd n /Lu n ratios for each sample suggests that the Saradyr and Bogatyr coals may exhibit ratios La n /Lu n < 1, La n /Sm n < 1, and Gd n /Lu n < 1, shown in Table 8. This suggests that these coals are characterized by an H-type distribution [23]. The different H-type distribution observed in REEs-bearing coal ashes of different genetic types, suggesting a wide distribution of natural waters enriched in REEs within coal basins. This frequent occurrence of H-type distribution in coals may potentially be attributed to the circulation of these REE-enriched waters [23], see Table 9.
Enrichment patterns and anomalies for individual REEs of the four coal samples sourced from Saradyr and Bogatyr, UCC ratio (calculated using values of [53])
| Sample/REE ratio | La n /Lu n | La n /Sm n | Gd n /Lu n | *Ce n /Ce n | *Eu n /Eu n | *Gd n /Gd n | Y n /Ho n |
|---|---|---|---|---|---|---|---|
| S1 | 0.49 | 0.54 | 0.94 | 0.88 | 1.07 | 1.04 | 0.65 |
| S2 | 0.11 | 0.35 | 0.36 | 0.92 | 0.9 | 1.24 | 0.49 |
| B1/0 | 0.57 | 0.21 | 0.56 | 0.83 | 2.05 | 1.62 | 0.84 |
| B1/1 | 0.20 | 0.30 | 0.70 | 1.17 | 3.13 | 0.99 | 0.51 |
Note: “n” denotes the REE/UCC normalized values; *Ce n /Ce n = 0.67Lan + 0.33Nd n ; *Eu n /Eu n = Eu n /(0.67Sm n + 0.33Tb n ); and *Gd n /Gd n = Gd n /(0.33Sm n + 0.67Tb n ) [56].
The Ce n /Ce n ratio of the four coal samples shows weakly negative to no significant anomalies. The approximate ratio of 1 obtained for the Ce n /Ce n ratios of the four samples suggests REEs deposition due to an anoxic hydrothermal water environment [56,73]. This indicates a possible tuffaceous origin for these coal samples.
Furthermore, both mine samples exhibit positive Eu anomalies, with Eu n /Eu n > 1, likely due to high apatite contents in the coal [56]. The Eu n /Eu n ratio is 0.9 and 3.13 for the Saradyr and Bogatyr samples, respectively, which may suggest positive Eu anomalies. SEM-EDS analysis also indicated the possible presence of apatite/fluorapatite in the samples.
The Gd n /Gd n ratio ranges between 0.99 and 1.62 for the four samples, indicating a weak positive anomaly. This suggests that hydrothermal injections may have contributed to Gd input into the coal strata [56].
Additionally, the utilization of the Y n /Ho n ratio reveals the decoupling of geochemical twins Y and Ho, with the four samples showing a ratio between 0.49 and 0.84. This suggests a weak negative yttrium anomaly compared to the UCC, suggesting Yttrium accumulation may occur due to aqueous or highly evolved magmatic systems, particularly those with a high complexing capacity with basaltic and felsic-intermediate terrigenous materials [56].
Ultimately, the REEs accumulation within these coal deposits may be attributed to basaltic and felsic-intermediate terrigenous materials.
5.2 Technological implications
The enrichment factor of trace elements in the studied samples was calculated using the reference values established for WHC by Ketris and Yudovich [9]. The enrichment factor quantifies whether elements are enriched or depleted and is determined by comparing the trace element concentration in the studied coal ash samples to the corresponding value established for the WHC reference. All major and trace elements in the studied samples show an enrichment factor of less than 0.204 (Ba) compared to WHC (Figure 13). According to the classification of concentration coefficient (CC) by Dai et al. [56], the enrichment factor of all elements in the studied samples is considered as depleted, as indicated by CC values <0.5. Only two elements, Ba (CCmean = 0.204) in the samples of Bogatyr and Sc (CCmean = 0.007) in the samples of Saradyr and Bogatyr, exhibit comparatively higher concentrations compared to other elements. However, overall, the data indicate significantly depleted concentrations of trace elements in the studied samples, suggesting limited technological and economic interests in trace elements in the current samples.

The enrichment factor of elements in the samples from three mines (only two mines for REE, Sc, and Y) compared to WHC.
5.3 Environmental implications
As Bugaru and Rujoiu [74] noted, the environmental impact elements associated with coals include As (0.12–0.3 ppm), Sb (45 ppm), Hg (1,500 ppm), Pb (500 ppm), Cu (1–1.5%) Cd (0.1%), Bi (0.8%), Ag (1%), Zn (0.3–0.5%), Cr (0.5%), Mn (0.5%), and Ba (0.4%), shown in parentheses the concentrations considered harmful to the environment. These chemical elements originate from both associated minerals and transformation processes during combustion [74]. It is well-established that environmental impact elements in coal tend to be associated with mineral matter, particularly in high-ash coal containing significant amounts of heavy-metal-bearing minerals like pyrite, barite, and rutile/ilmenite. During coal combustion, ashes become enriched with trace elements, often reaching concentrations 3–10 times higher than those in the original coal. Remarkably, these elements are not released during combustion, as evidenced by the consistent concentration ratios found in both ash and original coal [75]. The comparison in Figure 14 illustrates the concentrations of trace elements in samples from three mines against standard harmful thresholds, based on protocols described in the literature [74]. The findings suggest that the trace element-bearing coal samples position minimal environmental impact, as key toxic elements such as, Pb, Cu, Zn, and Cr exhibit concentrations below 0.26 ppm. Even Ag, which is typically significant at harmful levels, does not show sufficient values in the samples, contrasting with levels of up to 10,000 ppm in harmful scenarios. Additionally, elements like Mn (0.6 ppm) and Ba (300 ppm) exceed the concentrations found in the samples but remain at levels ten times lower than those deemed harmful.
![Figure 14
Comparative environmental impact assessment of trace elements in three coal mines against standard harmful thresholds (referred as impact value) (Impact value for comparison as per [74]).](/document/doi/10.1515/geo-2022-0721/asset/graphic/j_geo-2022-0721_fig_014.jpg)
Comparative environmental impact assessment of trace elements in three coal mines against standard harmful thresholds (referred as impact value) (Impact value for comparison as per [74]).
In comparing the results of coal samples for technological and environmental impacts, our findings align with those of Kopobayeva et al. [33], who highlighted specifically in the Karagandy coal basin, with a focus on the “k7” seam, coal’s potential for metal extraction, regarding their study emphasizes the significance of processing critical coal elements to reduce disposal costs and mitigate environmental impacts.
6 Conclusion
Examinations of six coal samples from Lenin, Saradyr, and Bogatyr mines have predominantly focused on mineralogical and inorganic elemental compositions, their mode of occurrence, and industrial and environmental implications. This research article addresses this gap through comprehensive mineralogical and inorganic geochemical analyses. Six coal samples from three coal mines underwent proximate, and ultimate analysis for organic elements, ash yield and volatile matter, mineralogical analysis with low-temperature ash-X-ray diffraction (LTA-XRD), SEM-EDS, and inorganic geochemical analysis (major, trace, and REEs) with acid digestions (HCl + HNO3 + HF) of coal ash and ICP-MS measurements.
The mineralogical composition of the samples primarily comprises quartz, kaolinite, and minor pyrite, with accessory minerals closely associated with kaolinite. Mineral content, major detrital minerals like quartz and kaolinite dominate, while minor euhedral pyrite are present in all mine samples, with framboidal pyrite, iron oxides, and REE-bearing minerals (monazite, apatite, and fluorapatite) exclusively found in Saradyr and Bogatyr samples. Quartz was likely transported to the peat swamp through detrital processes, while kaolinite primarily originated from the weathering of aluminum silicate minerals during peat accumulation. Pyrite formation in the coal samples likely occurred through both syngenetic and epigenetic processes. The samples from the Lenin, Sarady, and Bogatyr mines primarily contain syngenetic minerals followed by epigenetic minerals, contributing to elevated ash yields and volatile matter contents. Analysis of ratios like Ce n /Ce n , Eu n /Eu n , and Gd n /Gd n suggests REEs deposition in anoxic hydrothermal water environments, possibly indicating a tuffaceous origin for the coal samples. Additionally, the Y n /Ho n ratio implies REE association with aqueous or highly evolved magmatic systems containing basaltic and felsic-intermediate terrigenous materials.
Inorganic geochemical results, the observed strong positive correlation among elements like Al, K, Na, Ti, Ba, Be, Ni, Cr, Co, Ga, Sc, V, As, Pb, Cu, Zn, and Zr, along with only Eu and Sc of the REEs, suggests their association with ash yield, consistent with the composition of kaolinite and accessory minerals. Additionally, La, Ce, and Y among the REEs exhibit a positive correlation with organic matter, while remaining elements Fe, Mn, Mg, P, Li, Th, Ca, and most REEs (Pr, Nd, Sm, Gd, Tb, Dy, Ho, Er, Tm, Yb, and Lu) are related to intermediate affinity.
A comparative analysis of the inorganic geochemical composition of hard coal combustion worldwide reveals a notable depletion of major and trace elements in samples from all three mines. This suggests that there is limited economic interest in these elements within the current samples. The findings further indicate that the coal samples containing trace elements pose minimal environmental impact. The coefficient outlook of REE values ranging from 1.3 to 1.9 indicates industrial potential for REE recovery. However, the significantly depleted REE content suggests that these coal samples may not hold substantial economic value in terms of REEs extraction.
Acknowledgments
The authors are thankful to Nazarbayev University, Kazakhstan (SPG grant 064.01.00) for their financial support.
-
Funding information: Authors state no funding involved.
-
Author contributions: M.J. conceived the study and contributed to the preparation of the manuscript, conception, analysis, and interpretation of data. F.T., A.A., and D.Zh. analayzed and interpreted organic elemental data. M.J., G.M., and A.A. contributed to the finanical support.
-
Conflict of interest: Authors state no conflict of interest.
-
Data availability statement: Data available on request from the author.
References
[1] Finkelman RB. Coal petrology: Its principles, methods, and applications. Int J Coal Geol. 1994;28(1–2):117–48.Search in Google Scholar
[2] Finkelman RB. Modes of occurrence of potentially hazardous elements in coal: levels of confidence. Fuel Process Technol. 2004;85(7–8):1213–37.Search in Google Scholar
[3] Finkelman RB. Health impacts of coal: facts and fiction. Environ Geochem Health. 2004;26(4):421–42.10.1007/s10653-004-1308-0Search in Google Scholar PubMed
[4] Liu G, Xu C, Zhou L, Huang J, Li Y, Wang X. The formation of hydrogen and methane from water by interaction with coal at temperatures between 500 and 1200°C. Int J Coal Geol. 2005;61(1–2):1–9.Search in Google Scholar
[5] Liu H, Zhao Y, Jiang Y, Zou J. Prediction of CO2 adsorption capacity of coal by a kinetic model. Energy Procedia. 2018;142:2205–10.Search in Google Scholar
[6] Dai S, Zhao L, Hower JC, Johnston MN, Song W, Wang P, et al. Petrology, mineralogy, and chemistry of size-fractioned fly ash from the Jungar power plant, Inner Mongolia, China, with emphasis on the distribution of rare earth elements. Energy Fuels. 2014;28:1502–14. 10.1021/ef402184t.Search in Google Scholar
[7] Finkelman RB, Orem WH, Castranova V, Tatu CA, Belkin HE, Zheng B, et al. Health impacts of coal and coal use: possible solutions. Int J Coal Geol. 2019;203:103–16.Search in Google Scholar
[8] Swaine DJ. The chemistry of coal. San Diego, California: Academic Press; 1990.Search in Google Scholar
[9] Ketris MP, Yudovich YE. Estimations of Clarkes for carbonaceous biolithes: World averages for trace element contents in black shales and coals. Int J Coal Geol. 2009;78(2):135–48.10.1016/j.coal.2009.01.002Search in Google Scholar
[10] Junussov M. Characteristics, distribution and morphogenesis of gold-bearing sulfide minerals in the gold black shale deposit of Bakyrchik. Int Multidiscip Sci Geo Conf Surv Geol Min Ecol Manage, SGEM. 2018;18(1.1):643–50.10.5593/sgem2018/1.1/S01.081Search in Google Scholar
[11] Ward CR. Coal geology and coal technology. London: Blackwell Science Ltd; 2002.10.1016/B0-12-227410-5/00111-3Search in Google Scholar
[12] Moore TA, Esmaeili A. Element association and mobility in coals and combusted coal wastes. In Encyclopedia of Earth Sciences Series. Dordrecht: Springer; 2011. p. 111–21.Search in Google Scholar
[13] Longinos SN, Wang L, Hazlett R. Advances in cryogenic fracturing of coalbed methane reservoirs with LN2. Energies. 2022;15(24):9464.10.3390/en15249464Search in Google Scholar
[14] Longinos SN, Serik A, Bayramov E, Junussov M, Begaliyev D, Hazlett R. Laboratory study of liquid nitrogen cryo-fracturing as an environmentally friendly approach for coalbed methane (CBM) reservoirs. Energies. 2024;17(10):2359.10.3390/en17102359Search in Google Scholar
[15] Harvey CF, DeMaris PJ. Geochemistry of heavy metals in fine-grained sediments: Peoria Lake, Illinois. Environ Sci Technol. 1987;21(4):354–60.Search in Google Scholar
[16] Dai S, Ren D, Chou CL, Wang X. Fluid inclusion and stable isotope constraints on the origin of coal-bed gas in the Haerwusu coal field, Jungar Coalfield, Inner Mongolia, China. Int J Coal Geol. 2020;221:103–19.Search in Google Scholar
[17] Junussov M, Madai F, Kristály F, Tóth T, Fintor K, Muránszky G, et al. Preliminary analysis on roles of metal–organic compounds in the formation of invisible gold. Acta Geochim. 2021;40:1050–72.10.1007/s11631-021-00494-ySearch in Google Scholar
[18] Anggara F, Subandi MA, Masto RE. Characterization of coal and biomass co-pyrolysis products by TGA/FTIR. J Therm Anal Calorim. 2024;138(3):2069–79.Search in Google Scholar
[19] Dai S, Jiang Y, Ward CR, Hower JC, Duan C. Formation of low-rank coal and carbonaceous shale from the early Permian Period, southeastern Yunnan Province, China: Implications for coalbed gas generation potential. Int J Coal Geol. 2008;76(1–2):3–16.Search in Google Scholar
[20] Wu Y, Hu Y, Zheng L, Huang W, Chen Q. Coal-petroleum interactions: A review. Fuel. 2023;315:124130.Search in Google Scholar
[21] Sagunov VG, Nurmagambetov KO. Supply of trace elements available to plants in soils of some regions of Kazakhstan. Almaty: Vestn. Akad. Nauk Kazakh. SSR; 1965. p. 24–8.Search in Google Scholar
[22] Seredin VV, Finkelman RB. Trace and minor elements in coal. In Treatise on geochemistry. Vol. 9, 2nd edn. Amsterdam, Netherlands: Elsevier; 2008. p. 379–415.Search in Google Scholar
[23] Dai S, Finkelman RB. Coal deposits as potential alternative sources for rare metals. Elements. 2017;13(4):231–6.Search in Google Scholar
[24] Junussov M, Mohammad A, Longinos S. Geochemical analysis of organic matter associated with gold in ore deposits: A study of Kazakhstan and Hungary. Acta Geochim. 2024;3–13. 10.1007/s11631-024-00710-5.Search in Google Scholar
[25] Junussov M, Mádai F, Földessy J, Hámor-Vidó M. The role of organic matter in gold occurrence: insights from Western Mecsek uranium ore deposit. Econ Environ Geol. 2024;57:371–86. 10.9719/EEG.2024.57.4.371.Search in Google Scholar
[26] Blyalova GG, Kopobayeva AN, Amangeldykyzy A, Askarova NS, Ozhigin DS. Ways of rare earth elements migration and transportation to the coals of the Shubarkol deposit. Compl Use Miner Resour. 2023;324(1):24–33.10.31643/2023/6445.04Search in Google Scholar
[27] Ammosov II, Burcev DN, Gorsky II, Ivanov GA, Kotlukov VA, Kuznecov IA, et al. Geology of coal and black deposits (Russian). Book: Issue 5. Part 1. Moscow: Academy of Sciences of the USSR; 1973. p. 13–718.Search in Google Scholar
[28] Azizov TM, Vlasov YI. Book reference: coal and oil shale basins and deposits of Kazakhstan. Almaty: Institute of Geological Sciences of the RK; 2013. p. 6–106.Search in Google Scholar
[29] Safonov AA, Parafilov VI, Maussymbaeva AD, Ganeeva LM, Portnov VS. Microscopic compound of Central Kazakhstan coal. Ugol’ – Russ Coal J. 2018;9:70–5. 10.18796/0041-5790-2018-9-70-75 (Russian).Search in Google Scholar
[30] Longinos SN, Serik A, Zhang D, Wang L, Hazlett R. Experimental evaluation of liquid Nitrogen fracturing on the coal rocks in Karaganda Basin, Kazakhstan. Arab J Sci Eng. 2023;48:1–16.10.1007/s13369-023-07857-ySearch in Google Scholar
[31] Longinos SN, Dillinger A, Wang L, Hazlett R. Uniaxial compressive strength (UCS) and SEM study of liquid nitrogen for waterless hydraulic fracturing in coalbed methane reservoirs of Karaganda Basin in Kazakhstan. Gas Sci Eng. 2023;115:204998.10.1016/j.jgsce.2023.204998Search in Google Scholar
[32] Longinos SN, Abbas AH, Bolatov A, Skrzypacz P, Hazlett R. Application of image processing in evaluation of hydraulic fracturing with liquid nitrogen: A case study of coal samples from Karaganda Basin. Appl Sci. 2023;13(13):7861.10.3390/app13137861Search in Google Scholar
[33] Kopobayeva A, Baidauletova I, Amangeldikyzy A, Askarova N. Trace elements distribution in the k7 seam of the Karaganda Coal Basin, Kazakhstan. Geosciences. 2024;14(6):143. 10.3390/geosciences14060143.Search in Google Scholar
[34] Low GKC, Zhang H. Trace element analysis of coal and coal combustion ash. In Trace elements in coal. Dordrecht: Springer; 2012. p. 41–65.Search in Google Scholar
[35] Modi SN, Pandya KI, Kesarwani DK. A study of ash fusion characteristics and thermal behavior of coal. In Environmental challenges in coal-fired power plants. Singapore: Springer; 2021. p. 93–103.Search in Google Scholar
[36] Qi J, Liu Y, Li S, Hu X. Transformation characteristics of minerals during low-temperature ashing of coal and the effect on element migration. Int J Coal Geol. 2021;238:103735.Search in Google Scholar
[37] Han F, Chen J, Zhang L, Wang H. Mineralogical characteristics and chemical structure of low-temperature ash of bituminous coal under controlled atmosphere. Fuel. 2022;309:122981.Search in Google Scholar
[38] Warne ST. Thermal analysis of coal. In Thermal analysis. Vol. 1. Amsterdam, Netherlands: Elsevier; 1991. p. 235–58.Search in Google Scholar
[39] Beamish BB. Coal thermal analysis. In Advanced reservoir and production engineering for coal Bed Methane. Amsterdam, Netherlands: Elsevier; 1994. p. 81–94.Search in Google Scholar
[40] Donahue R, Rais J. Coal: Its properties, analysis, classification, geology, extraction, uses, and distribution. 2nd edn., Colorado, USA: Society for Mining, Metallurgy, and Exploration; 2009.Search in Google Scholar
[41] Yang Y, Wei X, Wang H, Ma D. Characterization of coal ash from thermal power plants in China and its environmental impact assessment. Fuel. 2015;143:39–45.Search in Google Scholar
[42] Ward CR, French D, Erceg M, Brough G. Application of X-ray diffraction techniques to coal and organic-rich sedimentary rocks. Int J Coal Geol. 1999;40(2–3):205–40.Search in Google Scholar
[43] Ruan H, Ward CR. Combustion mineralogy of late Permian coals from the Huaibei coalfield, Anhui Province, China. Int J Coal Geol. 2002;51(1):47–64.Search in Google Scholar
[44] Rietveld HM. A profile refinement method for nuclear and magnetic structures. J Appl Crystallogr. 1969;2:65–71. 10.1107/S0021889869006558.Search in Google Scholar
[45] Saydut A. Determination of trace elements in coal samples by inductively coupled plasma mass spectrometry. Int J Coal Geol. 2010;82(1–2):58–63.Search in Google Scholar
[46] Ma J, Li J, Zheng L, Lin Y. Evaluation of the potential environmental risks of heavy metals from coal gangue dump based on multimedia environmental model. Environ Pollut 252:188–97.Search in Google Scholar
[47] Yudovich Ya E, Ketris MP. Arsenic in coal: a review. Int J Coal Geol. 2005;61(3–4):141–96.10.1016/j.coal.2004.09.003Search in Google Scholar
[48] Yudovich Ya E, Ketris MP. Mercury in coal: a review: Part 1. Geochemistry. Int J Coal Geol. 2005;62(3):107–34.10.1016/j.coal.2004.11.002Search in Google Scholar
[49] Yudovich Ya E, Ketris MP. Selenium in coal: A review. Int J Coal Geol. 2006;67(1–2):112–26.10.1016/j.coal.2005.09.003Search in Google Scholar
[50] Zhao ZG. Research on rare earth element geochemistry of coal bearing strata. Beijing: Coal Industry Publishing House; 2002. p. 37 (in Chinese).Search in Google Scholar
[51] Ronov AB, Yaroshevsky AA, Migdisov AA. Chemical composition of the Earth’s crust and geochemical balance of main elements. 192. Moscow: Science Pub. House; 1990.Search in Google Scholar
[52] Fu J, Ma L, Tang L, Zhu R, Wang Y. Application of rare earth elements as geochemical tracers in coal combustion residues: A review. Fuel. 2022;310:121224.Search in Google Scholar
[53] Taylor SR, McLennan SM. The continental crust: its composition and evolution. London: Blackwell Scientific Publications; 1985.Search in Google Scholar
[54] Seredin VV. World resources of rare earth elements and their correlation with environmental functions. Russ J Earth Sci. 2010;12(1):ES1001.Search in Google Scholar
[55] Hower JC, Groppo JG, Henke KR, Hood MM, Eble CF, Honaker RQ, et al. Notes on the potential for the concentration of rare earth elements and yttrium in coal combustion fly ash. Minerals. 2015;5:356–66. 10.3390/min5020356.Search in Google Scholar
[56] Dai S, Wang X, Zhao L, Chou CL, Ren D. Rare earth elements in Mesozoic coals from southwestern China: Evidence for their provenance and tectonic significance. Int J Coal Geol. 2016;158:188–99.Search in Google Scholar
[57] Pan J, Nie T, Vaziri Hassas B, Rezaee M, Wen Z, Zhou C. Recovery of rare earth elements from coal fly ash by integrated physical separation and acid leaching. Chemosphere. 2020;248:126112. 10.1016/j. chemosphere.2020.126112.Search in Google Scholar
[58] Ingram RL, Rimstidt JD. Weathering of rocks and soil minerals. Treatise Geochem. 1984;5:291–306.Search in Google Scholar
[59] Swaine DJ, Goodarzi F. Geochemistry of trace elements in coal and coal combustion byproducts. In Coal combustion byproducts and environmental issues. Boston, MA: Springer; 1995. p. 1–23.Search in Google Scholar
[60] Taylor CD, Post JE, Heaney PJ. Synthesis of berlinite (AlPO4) from gibbsite (Al(OH)3) and quartz (SiO2): implications for phosphate-mineral stability in granitic rocks. Am Mineral. 1998;83(7–8):701–9.Search in Google Scholar
[61] Kus J, Heaney PJ, Post JE. Synthesis of hydroxylherderite, CaBePO4 (OH), from beryl, Be3Al2(Si6O18), and quartz, SiO2, and the solubility of herderite, CaBePO4 (OH), and phosphophyllite, Zn2Fe (PO4)2 (OH)2·4H2O. Am Mineral. 2017;102(2):344–9.Search in Google Scholar
[62] Ribeiro DA, Leão VA, Azevedo JC, Oliveira ML. The influence of soil texture on the interactions between kaolinite and imidacloprid insecticide. Geoderma. 2019;347:57–63.Search in Google Scholar
[63] Dai S, Jiang Y, Ward CR, Hower JC. Distribution and modes of occurrence of selected trace elements in some Australian coals. Int J Coal Geol. 2002;49(4):283–305.Search in Google Scholar
[64] Kolker A. Geochemistry of the rare earth elements: meteorite studies. In Treatise on geochemistry. Vol. 12, 2nd edn. Amsterdam, Netherlands: Elsevier; 2012. p. 61–91.Search in Google Scholar
[65] Machado W, Ribeiro JC, Ramos AY, Oliveira ML, Biondi CM. Study of the rare earth elements potential in coal ashes from the south of Brazil. Quím Nova. 2012;35(8):1573–7.Search in Google Scholar
[66] Eskenazy GM, Stefanova M. The mineral and chemical composition of coals and their relation to the environment. Sci Total Environ. 2007;383(1–3):89–104.Search in Google Scholar
[67] Saxby JD. Chemical analyses and physical properties of 12 coal samples from the Pocahontas field, Tazewell County, Virginia, and McDowell County, West Virginia. Virginia, USA: U.S. Department of the Interior, US Geological Survey; 2000.Search in Google Scholar
[68] Garcia E, Martinez-Tarazona MR. Characterization of a medium-volatile bituminous coal from the Juan Carlos mine, northern Spain. Int J Coal Geol. 1993;22(1–4):297–321.Search in Google Scholar
[69] Kortenski J, Sotirov D. Distribution of some major and trace elements in the coals of Bulgaria. Int J Coal Geol. 2002;52(3):183–93.10.1016/S0166-5162(02)00133-7Search in Google Scholar
[70] Liu Z, Bai Y, Li Y. Chemical constitution of the minerals and trace elements of the Late Permian coals in western Guizhou Province, China. Int J Coal Geol. 2007;70(1–3):281–92.Search in Google Scholar
[71] Gűrdal G. Mineralogy, geochemistry, and distribution of trace elements in three seams of the Uzulmez coal deposit, Turkey. Int J Coal Geol. 2008;73(3):227–48.Search in Google Scholar
[72] Taghipour B, Marsh H. Selected pathfinders, coal quality trends and potential environmentally sensitive trace elements in some Australian Permian coals. Int J Coal Geol. 2015;146:1–13.Search in Google Scholar
[73] Chen Y, Li X, Zhou T, Gao X, Lu L. Anoxic hydrothermal environment of oil shale formation: A case study from the Qingshankou Formation (Lower Cretaceous) of the Songliao Basin, NE China. J Pet Sci Eng. 2015;133:161–71.Search in Google Scholar
[74] Bugaru V, Rujoiu V. Geochemistry and environmental impact of trace elements in coal and coal combustion residues from the Oltenia region. Rom Environ Earth Sci. 2014;71(8):3833–44.Search in Google Scholar
[75] Flues M, Mierzwa-Hersztek M, Chauvel JJ, Maurin M. Concentrations and spatial distribution of heavy metals in soils near three coal-fired power plants in Poland. Environ Earth Sci. 2013;68(7):2099–108.Search in Google Scholar
© 2024 the author(s), published by De Gruyter
This work is licensed under the Creative Commons Attribution 4.0 International License.
Articles in the same Issue
- Regular Articles
- Theoretical magnetotelluric response of stratiform earth consisting of alternative homogeneous and transitional layers
- The research of common drought indexes for the application to the drought monitoring in the region of Jin Sha river
- Evolutionary game analysis of government, businesses, and consumers in high-standard farmland low-carbon construction
- On the use of low-frequency passive seismic as a direct hydrocarbon indicator: A case study at Banyubang oil field, Indonesia
- Water transportation planning in connection with extreme weather conditions; case study – Port of Novi Sad, Serbia
- Zircon U–Pb ages of the Paleozoic volcaniclastic strata in the Junggar Basin, NW China
- Monitoring of mangrove forests vegetation based on optical versus microwave data: A case study western coast of Saudi Arabia
- Microfacies analysis of marine shale: A case study of the shales of the Wufeng–Longmaxi formation in the western Chongqing, Sichuan Basin, China
- Multisource remote sensing image fusion processing in plateau seismic region feature information extraction and application analysis – An example of the Menyuan Ms6.9 earthquake on January 8, 2022
- Identification of magnetic mineralogy and paleo-flow direction of the Miocene-quaternary volcanic products in the north of Lake Van, Eastern Turkey
- Impact of fully rotating steel casing bored pile on adjacent tunnels
- Adolescents’ consumption intentions toward leisure tourism in high-risk leisure environments in riverine areas
- Petrogenesis of Jurassic granitic rocks in South China Block: Implications for events related to subduction of Paleo-Pacific plate
- Differences in urban daytime and night block vitality based on mobile phone signaling data: A case study of Kunming’s urban district
- Random forest and artificial neural network-based tsunami forests classification using data fusion of Sentinel-2 and Airbus Vision-1 satellites: A case study of Garhi Chandan, Pakistan
- Integrated geophysical approach for detection and size-geometry characterization of a multiscale karst system in carbonate units, semiarid Brazil
- Spatial and temporal changes in ecosystem services value and analysis of driving factors in the Yangtze River Delta Region
- Deep fault sliding rates for Ka-Ping block of Xinjiang based on repeating earthquakes
- Improved deep learning segmentation of outdoor point clouds with different sampling strategies and using intensities
- Platform margin belt structure and sedimentation characteristics of Changxing Formation reefs on both sides of the Kaijiang-Liangping trough, eastern Sichuan Basin, China
- Enhancing attapulgite and cement-modified loess for effective landfill lining: A study on seepage prevention and Cu/Pb ion adsorption
- Flood risk assessment, a case study in an arid environment of Southeast Morocco
- Lower limits of physical properties and classification evaluation criteria of the tight reservoir in the Ahe Formation in the Dibei Area of the Kuqa depression
- Evaluation of Viaducts’ contribution to road network accessibility in the Yunnan–Guizhou area based on the node deletion method
- Permian tectonic switch of the southern Central Asian Orogenic Belt: Constraints from magmatism in the southern Alxa region, NW China
- Element geochemical differences in lower Cambrian black shales with hydrothermal sedimentation in the Yangtze block, South China
- Three-dimensional finite-memory quasi-Newton inversion of the magnetotelluric based on unstructured grids
- Obliquity-paced summer monsoon from the Shilou red clay section on the eastern Chinese Loess Plateau
- Classification and logging identification of reservoir space near the upper Ordovician pinch-out line in Tahe Oilfield
- Ultra-deep channel sand body target recognition method based on improved deep learning under UAV cluster
- New formula to determine flyrock distance on sedimentary rocks with low strength
- Assessing the ecological security of tourism in Northeast China
- Effective reservoir identification and sweet spot prediction in Chang 8 Member tight oil reservoirs in Huanjiang area, Ordos Basin
- Detecting heterogeneity of spatial accessibility to sports facilities for adolescents at fine scale: A case study in Changsha, China
- Effects of freeze–thaw cycles on soil nutrients by soft rock and sand remodeling
- Vibration prediction with a method based on the absorption property of blast-induced seismic waves: A case study
- A new look at the geodynamic development of the Ediacaran–early Cambrian forearc basalts of the Tannuola-Khamsara Island Arc (Central Asia, Russia): Conclusions from geological, geochemical, and Nd-isotope data
- Spatio-temporal analysis of the driving factors of urban land use expansion in China: A study of the Yangtze River Delta region
- Selection of Euler deconvolution solutions using the enhanced horizontal gradient and stable vertical differentiation
- Phase change of the Ordovician hydrocarbon in the Tarim Basin: A case study from the Halahatang–Shunbei area
- Using interpretative structure model and analytical network process for optimum site selection of airport locations in Delta Egypt
- Geochemistry of magnetite from Fe-skarn deposits along the central Loei Fold Belt, Thailand
- Functional typology of settlements in the Srem region, Serbia
- Hunger Games Search for the elucidation of gravity anomalies with application to geothermal energy investigations and volcanic activity studies
- Addressing incomplete tile phenomena in image tiling: Introducing the grid six-intersection model
- Evaluation and control model for resilience of water resource building system based on fuzzy comprehensive evaluation method and its application
- MIF and AHP methods for delineation of groundwater potential zones using remote sensing and GIS techniques in Tirunelveli, Tenkasi District, India
- New database for the estimation of dynamic coefficient of friction of snow
- Measuring urban growth dynamics: A study in Hue city, Vietnam
- Comparative models of support-vector machine, multilayer perceptron, and decision tree predication approaches for landslide susceptibility analysis
- Experimental study on the influence of clay content on the shear strength of silty soil and mechanism analysis
- Geosite assessment as a contribution to the sustainable development of Babušnica, Serbia
- Using fuzzy analytical hierarchy process for road transportation services management based on remote sensing and GIS technology
- Accumulation mechanism of multi-type unconventional oil and gas reservoirs in Northern China: Taking Hari Sag of the Yin’e Basin as an example
- TOC prediction of source rocks based on the convolutional neural network and logging curves – A case study of Pinghu Formation in Xihu Sag
- A method for fast detection of wind farms from remote sensing images using deep learning and geospatial analysis
- Spatial distribution and driving factors of karst rocky desertification in Southwest China based on GIS and geodetector
- Physicochemical and mineralogical composition studies of clays from Share and Tshonga areas, Northern Bida Basin, Nigeria: Implications for Geophagia
- Geochemical sedimentary records of eutrophication and environmental change in Chaohu Lake, East China
- Research progress of freeze–thaw rock using bibliometric analysis
- Mixed irrigation affects the composition and diversity of the soil bacterial community
- Examining the swelling potential of cohesive soils with high plasticity according to their index properties using GIS
- Geological genesis and identification of high-porosity and low-permeability sandstones in the Cretaceous Bashkirchik Formation, northern Tarim Basin
- Usability of PPGIS tools exemplified by geodiscussion – a tool for public participation in shaping public space
- Efficient development technology of Upper Paleozoic Lower Shihezi tight sandstone gas reservoir in northeastern Ordos Basin
- Assessment of soil resources of agricultural landscapes in Turkestan region of the Republic of Kazakhstan based on agrochemical indexes
- Evaluating the impact of DEM interpolation algorithms on relief index for soil resource management
- Petrogenetic relationship between plutonic and subvolcanic rocks in the Jurassic Shuikoushan complex, South China
- A novel workflow for shale lithology identification – A case study in the Gulong Depression, Songliao Basin, China
- Characteristics and main controlling factors of dolomite reservoirs in Fei-3 Member of Feixianguan Formation of Lower Triassic, Puguang area
- Impact of high-speed railway network on county-level accessibility and economic linkage in Jiangxi Province, China: A spatio-temporal data analysis
- Estimation model of wild fractional vegetation cover based on RGB vegetation index and its application
- Lithofacies, petrography, and geochemistry of the Lamphun oceanic plate stratigraphy: As a record of the subduction history of Paleo-Tethys in Chiang Mai-Chiang Rai Suture Zone of Thailand
- Structural features and tectonic activity of the Weihe Fault, central China
- Application of the wavelet transform and Hilbert–Huang transform in stratigraphic sequence division of Jurassic Shaximiao Formation in Southwest Sichuan Basin
- Structural detachment influences the shale gas preservation in the Wufeng-Longmaxi Formation, Northern Guizhou Province
- Distribution law of Chang 7 Member tight oil in the western Ordos Basin based on geological, logging and numerical simulation techniques
- Evaluation of alteration in the geothermal province west of Cappadocia, Türkiye: Mineralogical, petrographical, geochemical, and remote sensing data
- Numerical modeling of site response at large strains with simplified nonlinear models: Application to Lotung seismic array
- Quantitative characterization of granite failure intensity under dynamic disturbance from energy standpoint
- Characteristics of debris flow dynamics and prediction of the hazardous area in Bangou Village, Yanqing District, Beijing, China
- Rockfall mapping and susceptibility evaluation based on UAV high-resolution imagery and support vector machine method
- Statistical comparison analysis of different real-time kinematic methods for the development of photogrammetric products: CORS-RTK, CORS-RTK + PPK, RTK-DRTK2, and RTK + DRTK2 + GCP
- Hydrogeological mapping of fracture networks using earth observation data to improve rainfall–runoff modeling in arid mountains, Saudi Arabia
- Petrography and geochemistry of pegmatite and leucogranite of Ntega-Marangara area, Burundi, in relation to rare metal mineralisation
- Prediction of formation fracture pressure based on reinforcement learning and XGBoost
- Hazard zonation for potential earthquake-induced landslide in the eastern East Kunlun fault zone
- Monitoring water infiltration in multiple layers of sandstone coal mining model with cracks using ERT
- Study of the patterns of ice lake variation and the factors influencing these changes in the western Nyingchi area
- Productive conservation at the landslide prone area under the threat of rapid land cover changes
- Sedimentary processes and patterns in deposits corresponding to freshwater lake-facies of hyperpycnal flow – An experimental study based on flume depositional simulations
- Study on time-dependent injectability evaluation of mudstone considering the self-healing effect
- Detection of objects with diverse geometric shapes in GPR images using deep-learning methods
- Behavior of trace metals in sedimentary cores from marine and lacustrine environments in Algeria
- Spatiotemporal variation pattern and spatial coupling relationship between NDVI and LST in Mu Us Sandy Land
- Formation mechanism and oil-bearing properties of gravity flow sand body of Chang 63 sub-member of Yanchang Formation in Huaqing area, Ordos Basin
- Diagenesis of marine-continental transitional shale from the Upper Permian Longtan Formation in southern Sichuan Basin, China
- Vertical high-velocity structures and seismic activity in western Shandong Rise, China: Case study inspired by double-difference seismic tomography
- Spatial coupling relationship between metamorphic core complex and gold deposits: Constraints from geophysical electromagnetics
- Disparities in the geospatial allocation of public facilities from the perspective of living circles
- Research on spatial correlation structure of war heritage based on field theory. A case study of Jinzhai County, China
- Formation mechanisms of Qiaoba-Zhongdu Danxia landforms in southwestern Sichuan Province, China
- Magnetic data interpretation: Implication for structure and hydrocarbon potentiality at Delta Wadi Diit, Southeastern Egypt
- Deeply buried clastic rock diagenesis evolution mechanism of Dongdaohaizi sag in the center of Junggar fault basin, Northwest China
- Application of LS-RAPID to simulate the motion of two contrasting landslides triggered by earthquakes
- The new insight of tectonic setting in Sunda–Banda transition zone using tomography seismic. Case study: 7.1 M deep earthquake 29 August 2023
- The critical role of c and φ in ensuring stability: A study on rockfill dams
- Evidence of late quaternary activity of the Weining-Shuicheng Fault in Guizhou, China
- Extreme hydroclimatic events and response of vegetation in the eastern QTP since 10 ka
- Spatial–temporal effect of sea–land gradient on landscape pattern and ecological risk in the coastal zone: A case study of Dalian City
- Study on the influence mechanism of land use on carbon storage under multiple scenarios: A case study of Wenzhou
- A new method for identifying reservoir fluid properties based on well logging data: A case study from PL block of Bohai Bay Basin, North China
- Comparison between thermal models across the Middle Magdalena Valley, Eastern Cordillera, and Eastern Llanos basins in Colombia
- Mineralogical and elemental analysis of Kazakh coals from three mines: Preliminary insights from mode of occurrence to environmental impacts
- Chlorite-induced porosity evolution in multi-source tight sandstone reservoirs: A case study of the Shaximiao Formation in western Sichuan Basin
- Predicting stability factors for rotational failures in earth slopes and embankments using artificial intelligence techniques
- Origin of Late Cretaceous A-type granitoids in South China: Response to the rollback and retreat of the Paleo-Pacific plate
- Modification of dolomitization on reservoir spaces in reef–shoal complex: A case study of Permian Changxing Formation, Sichuan Basin, SW China
- Geological characteristics of the Daduhe gold belt, western Sichuan, China: Implications for exploration
- Rock physics model for deep coal-bed methane reservoir based on equivalent medium theory: A case study of Carboniferous-Permian in Eastern Ordos Basin
- Enhancing the total-field magnetic anomaly using the normalized source strength
- Shear wave velocity profiling of Riyadh City, Saudi Arabia, utilizing the multi-channel analysis of surface waves method
- Effect of coal facies on pore structure heterogeneity of coal measures: Quantitative characterization and comparative study
- Inversion method of organic matter content of different types of soils in black soil area based on hyperspectral indices
- Detection of seepage zones in artificial levees: A case study at the Körös River, Hungary
- Tight sandstone fluid detection technology based on multi-wave seismic data
- Characteristics and control techniques of soft rock tunnel lining cracks in high geo-stress environments: Case study of Wushaoling tunnel group
- Influence of pore structure characteristics on the Permian Shan-1 reservoir in Longdong, Southwest Ordos Basin, China
- Study on sedimentary model of Shanxi Formation – Lower Shihezi Formation in Da 17 well area of Daniudi gas field, Ordos Basin
- Multi-scenario territorial spatial simulation and dynamic changes: A case study of Jilin Province in China from 1985 to 2030
- Review Articles
- Major ascidian species with negative impacts on bivalve aquaculture: Current knowledge and future research aims
- Prediction and assessment of meteorological drought in southwest China using long short-term memory model
- Communication
- Essential questions in earth and geosciences according to large language models
- Erratum
- Erratum to “Random forest and artificial neural network-based tsunami forests classification using data fusion of Sentinel-2 and Airbus Vision-1 satellites: A case study of Garhi Chandan, Pakistan”
- Special Issue: Natural Resources and Environmental Risks: Towards a Sustainable Future - Part I
- Spatial-temporal and trend analysis of traffic accidents in AP Vojvodina (North Serbia)
- Exploring environmental awareness, knowledge, and safety: A comparative study among students in Montenegro and North Macedonia
- Determinants influencing tourists’ willingness to visit Türkiye – Impact of earthquake hazards on Serbian visitors’ preferences
- Application of remote sensing in monitoring land degradation: A case study of Stanari municipality (Bosnia and Herzegovina)
- Optimizing agricultural land use: A GIS-based assessment of suitability in the Sana River Basin, Bosnia and Herzegovina
- Assessing risk-prone areas in the Kratovska Reka catchment (North Macedonia) by integrating advanced geospatial analytics and flash flood potential index
- Analysis of the intensity of erosive processes and state of vegetation cover in the zone of influence of the Kolubara Mining Basin
- GIS-based spatial modeling of landslide susceptibility using BWM-LSI: A case study – city of Smederevo (Serbia)
- Geospatial modeling of wildfire susceptibility on a national scale in Montenegro: A comparative evaluation of F-AHP and FR methodologies
- Geosite assessment as the first step for the development of canyoning activities in North Montenegro
- Urban geoheritage and degradation risk assessment of the Sokograd fortress (Sokobanja, Eastern Serbia)
- Multi-hazard modeling of erosion and landslide susceptibility at the national scale in the example of North Macedonia
- Understanding seismic hazard resilience in Montenegro: A qualitative analysis of community preparedness and response capabilities
- Forest soil CO2 emission in Quercus robur level II monitoring site
- Characterization of glomalin proteins in soil: A potential indicator of erosion intensity
- Power of Terroir: Case study of Grašac at the Fruška Gora wine region (North Serbia)
- Special Issue: Geospatial and Environmental Dynamics - Part I
- Qualitative insights into cultural heritage protection in Serbia: Addressing legal and institutional gaps for disaster risk resilience