Evaluation of Viaducts’ contribution to road network accessibility in the Yunnan–Guizhou area based on the node deletion method
-
Zichen Wang
 ,
Lanlan Guo
,
Lanlan Guo

Abstract
It is necessary to evaluate the construction effect of viaducts and identify the viaducts that play a key role in road networks. Based on the node deletion method, this article proposes a method to identify the importance of viaducts in road networks. After applying this method to simulate the importance of viaducts in the highway networks in Yunnan and Guizhou Provinces from 2001 to 2020, the results show the following: (1) The viaducts with high importance were mainly built in 2002, 2009, 2015, and 2016. They are mainly distributed on expressways such as the HUKUN Expressway, HANGRUI Expressway, and YINBAI Expressway. Among the viaducts, the Mengzhai Bridge and Beipanjiang Bridge Hukun are the most important. (2) The importance of viaducts will increase, decrease, or increase first and then decrease. Among the years studied, 2012 and 2016 are important time nodes for change. The trend of changes is affected by the construction of highways and viaducts in other locations. In this road network, there are strong coupling relationships between nodes. (3) The importance of some viaducts is not prominent in the whole region, but that does not mean their construction value is low. They may have a high connectivity effect on specific regions from a local perspective.
1 Introduction
Yunnan and Guizhou Provinces, located in the Yunnan–Guizhou Plateau, exhibit a fractured landscape composed of staggered valleys and ridges. Affected by the terrain, the transportation infrastructure of the two provinces lags far behind those of the plains and coastal regions, hindering local economic development [1]. In 2000, the density of highway mileage in Yunnan and Guizhou Provinces was only 0.254 km/km2, while in the same year, the highway mileage in Henan Province was 0.386 km/km2. To develop the economy of the western area, China implemented the Western Development Plan and improved the infrastructure in remote regions [2]. On this basis, Yunnan and Guizhou Provinces have built a number of viaducts in the past to improve the traffic conditions in backward mountainous areas. The scale and construction speed of these viaducts were beyond imagination. From 2001 to 2020, more than 266 viaducts over 100 m high were built in the two provinces. Therefore, it is necessary to evaluate the construction effect of the viaducts and identify the viaducts that play a key role in the road network. These tasks will help to maintain the existing viaducts and provide a reference for future bridge site selection.
However, previous evaluations of viaducts were mainly from the engineering perspective to analyze the seismic resistance capacity [3], structural performance [4], stress characteristics [5], and so on. But as viaducts link road networks, there are not only direct losses caused by viaducts’ physical damage but also indirect losses due to time delays in the transportation system [6]. Therefore, it is necessary to combine viaduct analysis with transportation network analysis in the viaduct evaluation. In previous studies, the evaluation of the connecting capacity of viaducts is often used in the post-disaster restoration field. For example, Merschman et al. proposed a decision framework to determine an optimal bridge repair sequence after a disruptive event [7]. Somy et al. developed a mathematical model to improve the resilience of road–bridge transportation networks in the recovery phase [8]. However, these studies discussed the repair sequence of bridges by calculating the changes in the road network’s performance after bridge repair rather than focusing on the characteristics and historical changes of the importance of the bridges in an undamaged road network. Based on the road network accessibility, this study proposed a method to identify the key viaduct nodes in the road network and explore the changes in their importance over the past 20 years.
The problem of identifying critical nodes in the network is widely recognized as a critical node detection problem. Methods to solve such problems can be divided into two categories. One is based on the statistical perspective, the most typical of which is the machine learning-based solutions at the forefront of research. For example, Yu et al. [9] and Munikoti et al. [10] used the convolutional neural network model and the graph neural network model to identify critical nodes in the network. However, sufficient training sample data are required to train the model, which cannot be satisfied in some application scenarios. Therefore, we chose another method, based on the mechanistic perspective, to study in the network analysis domain.
The node deletion method is often used in network analysis research. It was first proposed in 1982 by Corley and Sha, who wanted to find the most vital link in a network whose removal results in the greatest increase in the shortest distance between two nodes [11]. This method has extensive real-world applications [12], such as network attack response [13], biological molecular research [14], Internet of things-based system communication [15], social network analysis [16], and so on. Furthermore, in previous research on evaluating transportation networks, the node deletion method was often used to assess the importance of road sections. Taylor et al. identified vulnerable sections and nodes in an Australian road network by cutting the network at each link of the minimum path in succession [17]. Yin and Xu studied how road network connectivity and efficiency are affected by the disruption of intersections and road sections and identified the critical road sections and intersections [18]. Viljoen and Joubert simulated progressive random link disruption of an urban road network and assessed the impact this had on different network archetypes [19]. There are two treatments in the calculations. One is single node removal, where each road section is disconnected separately [20]. This scheme is easier to calculate, but the simulation scenario is relatively simple. The other is multi-node removal, where multiple road sections are disconnected at the same time [21]. This method can better simulate road failure in the real world, but it is complicated to determine the combination of disconnected road sections. Based on this idea, this article combined two treatment methods to disconnect the road sections where the viaducts are located and then calculated the changes in road network accessibility before and after the sections were disconnected. Then, we ranked the changes by size to evaluate the contributions of the viaducts to the overall transportation network.
Distance measures [22], cumulative opportunity [23], gravity or potential models [24], and other methods are commonly used in the evaluation of road network accessibility. These methods have their own merits and demerits. The cumulative opportunity measure is relatively simple but is sensitive to the given distance or travel time limit defined in its formulation [25]. The results of gravity models are delivered in less meaningful measurements. By comparison, the distance measures are more intuitive and suitable for the calculations of this study [26]. This approach uses different distance cost factors (i.e., distance, travel time, or money) as accessibility indicators, including relative accessibility and integral accessibility [26]. Based on the geometric network of the traffic road network, this article selected the average integral accessibility index to measure the road network accessibility of the Yunnan–Guizhou region with time distance cost as the measurement unit.
The remainder of this article is organized as follows. Section 2 introduces the areas of study and the data used. Section 3 gives the definition and calculation formula of viaduct importance based on road accessibility. Section 4 shows the results of currently important viaducts and the changes in their importance from 2001 to 2020. Section 5 gives some examples illustrating our calculation results to verify the feasibility of the calculation method. Finally, Section 6 concludes this study.
2 Study area and data
2.1 Study area
The study area includes Yunnan and Guizhou Provinces, located in Southwest China (97°30′–109°40′E, 21°–29°20′N), covering approximately 570,000 km2 (Figure 1). The main part of the two provinces is the Yunnan–Guizhou Plateau, where the plateau and mountain areas account for 92.5% and 94% of the provinces’ total areas, respectively [27,28]. The landform undulates terribly at elevations ranging from 76 to 6,456 m. The Yunnan–Guizhou Plateau is the origin or flow place of the Nujiang River, Lancang–Mekong River, Jinsha River, and others, and they have formed deep canyons. Otherwise, karst landforms are very typical in the study area, with the karst area of Guizhou Province measured at 109,084 km2, accounting for 61.9% of the province’s total land area [28]. Therefore, the topography in the area is very complex, hindering the development of transportation.
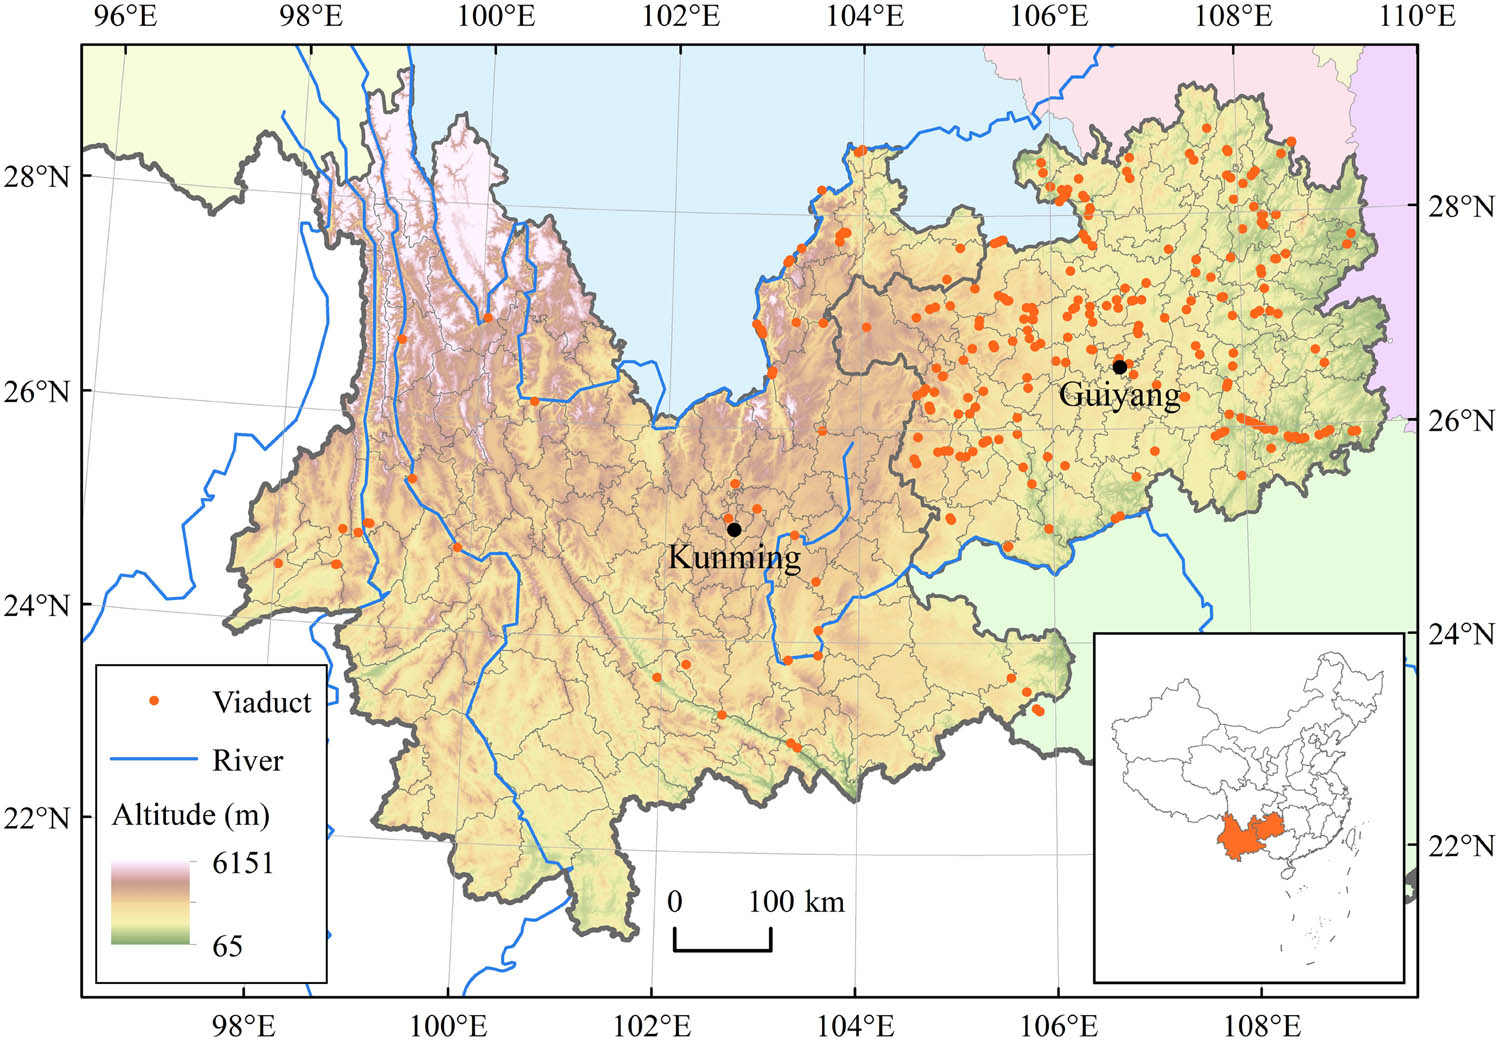
Distribution of viaducts built in Yunnan–Guizhou area from 2001 to 2020.
Yunnan and Guizhou Provinces have jurisdiction over 14 prefecture-level cities and 11 autonomous prefectures, including 217 county-level administrative regions. Affected by location, terrain, and other factors, the economic development of most of the county-level administrative regions in Yunnan and Guizhou Provinces is relatively backward. For example, the per capita GDP of Guizhou and Yunnan Provinces was 46,267 yuan and 51,975 yuan in 2020, ranking 28th and 23rd in China, respectively [29]. In addition, the economic development of Yunnan and Guizhou Provinces has great regional differences, with low levels of development found in remote mountainous areas. For example, the per capita GDP of Zhenxiong County in Yunnan Province was 16,145 yuan, which was only one-third of the per capita GDP of Yunnan Province [30]. Therefore, the evaluation of key traffic nodes is very important.
2.2 Data
The highway data, updated through October 2020, come from the OpenStreetMap dataset (https://www.openstreetmap.org). The topological relationships of highway intersections are verified manually. The expressway network data in 2000, 2005, 2010, and 2015 are provided by the National Earth System Science Data Center, National Science & Technology Infrastructure of China (http://www.geodata.cn). A list of viaducts built in the 2001–2020 period is provided by the HighestBridges website (https://www.highestbridges.com) in tabular form. The table contains each viaduct’s name, year built, height, main span length, and other relevant information. In this study, a total of 266 viaducts above 100 m were selected. Their geographical positions were marked manually based on remote sensing images from Map World. The administrative scope of the base map in this article comes from the Resource and Environmental Science Data Center, Chinese Academy of Sciences (http://www.resdc.cn).
3 Methods
This study simulated the changes in the importance of viaducts in the highway networks in Yunnan and Guizhou Provinces (Figure 2). The highway data in 2020 were obtained to assign speed according to the grade of the road, i.e., 90 km/h for expressways and 60 km/h for other highways. The highway data and the county administrative regions were combined to build the network dataset. In the network dataset, the average integral accessibility was calculated before and after the studied viaduct was removed from the network dataset. The difference between the two average integral accessibilities was considered the importance of the studied viaduct. After the importance of all bridges was calculated, all the viaducts built in 2020 were removed from the network dataset to build the assumed historical network dataset in 2019. Then, the above steps were repeated to obtain the importance of viaducts in 2019. Afterward, all the viaducts built in 2019 were removed to build the historical network dataset in 2018, and so on, until the importance of viaducts in the 2001 network dataset was calculated.

The workflow of the research.
Because of the difficulty of obtaining detailed highway data for each year, this study took the highways in 2020 as the benchmark and removed viaducts to simulate the inverse process of viaducts connecting highways through construction. When studying the importance of viaducts in a given year, it is assumed that the viaducts built after that year were in a disconnection state. Under this assumption, the calculation results of remote years are more uncertain. However, the calculation results can be considered the importance of viaducts under the best traffic conditions at that time.
The average integral accessibility index (A) was calculated to reflect the overall road accessibility of the study area [31]. The value of A was calculated as
where T ij is the shortest travel time between county i and county j, and n is the number of county administrative regions in the study area.
4 Results
4.1 Importance of current viaducts
Based on the current highway network, viaducts were removed from the network dataset. The differences in average integral accessibility before and after removing viaducts were calculated to reflect the importance of each viaduct in the highway network. The greater the importance is, the greater the impact of the viaduct’s removal on the highway network in Yunnan and Guizhou Provinces. The differences were arranged according to the values to obtain the importance ranking of the viaducts (Table A1).
The viaducts with high importance were mainly built in 2002, 2009, 2015, and 2016 (Figure 3). Among them, the Mengzhai Bridge and Beipanjiang Bridge Hukun, which were both built in 2009, are the most important. If these viaducts were removed, the average integral accessibility of each county administrative area would increase by 19.95325 h. The Balinghe Bridge takes second place, as its removal would increase the average integral accessibility by 17.93804 h. In addition, there are 70 viaducts whose importance is 0; their removal would not affect the average integral accessibility in the study area.
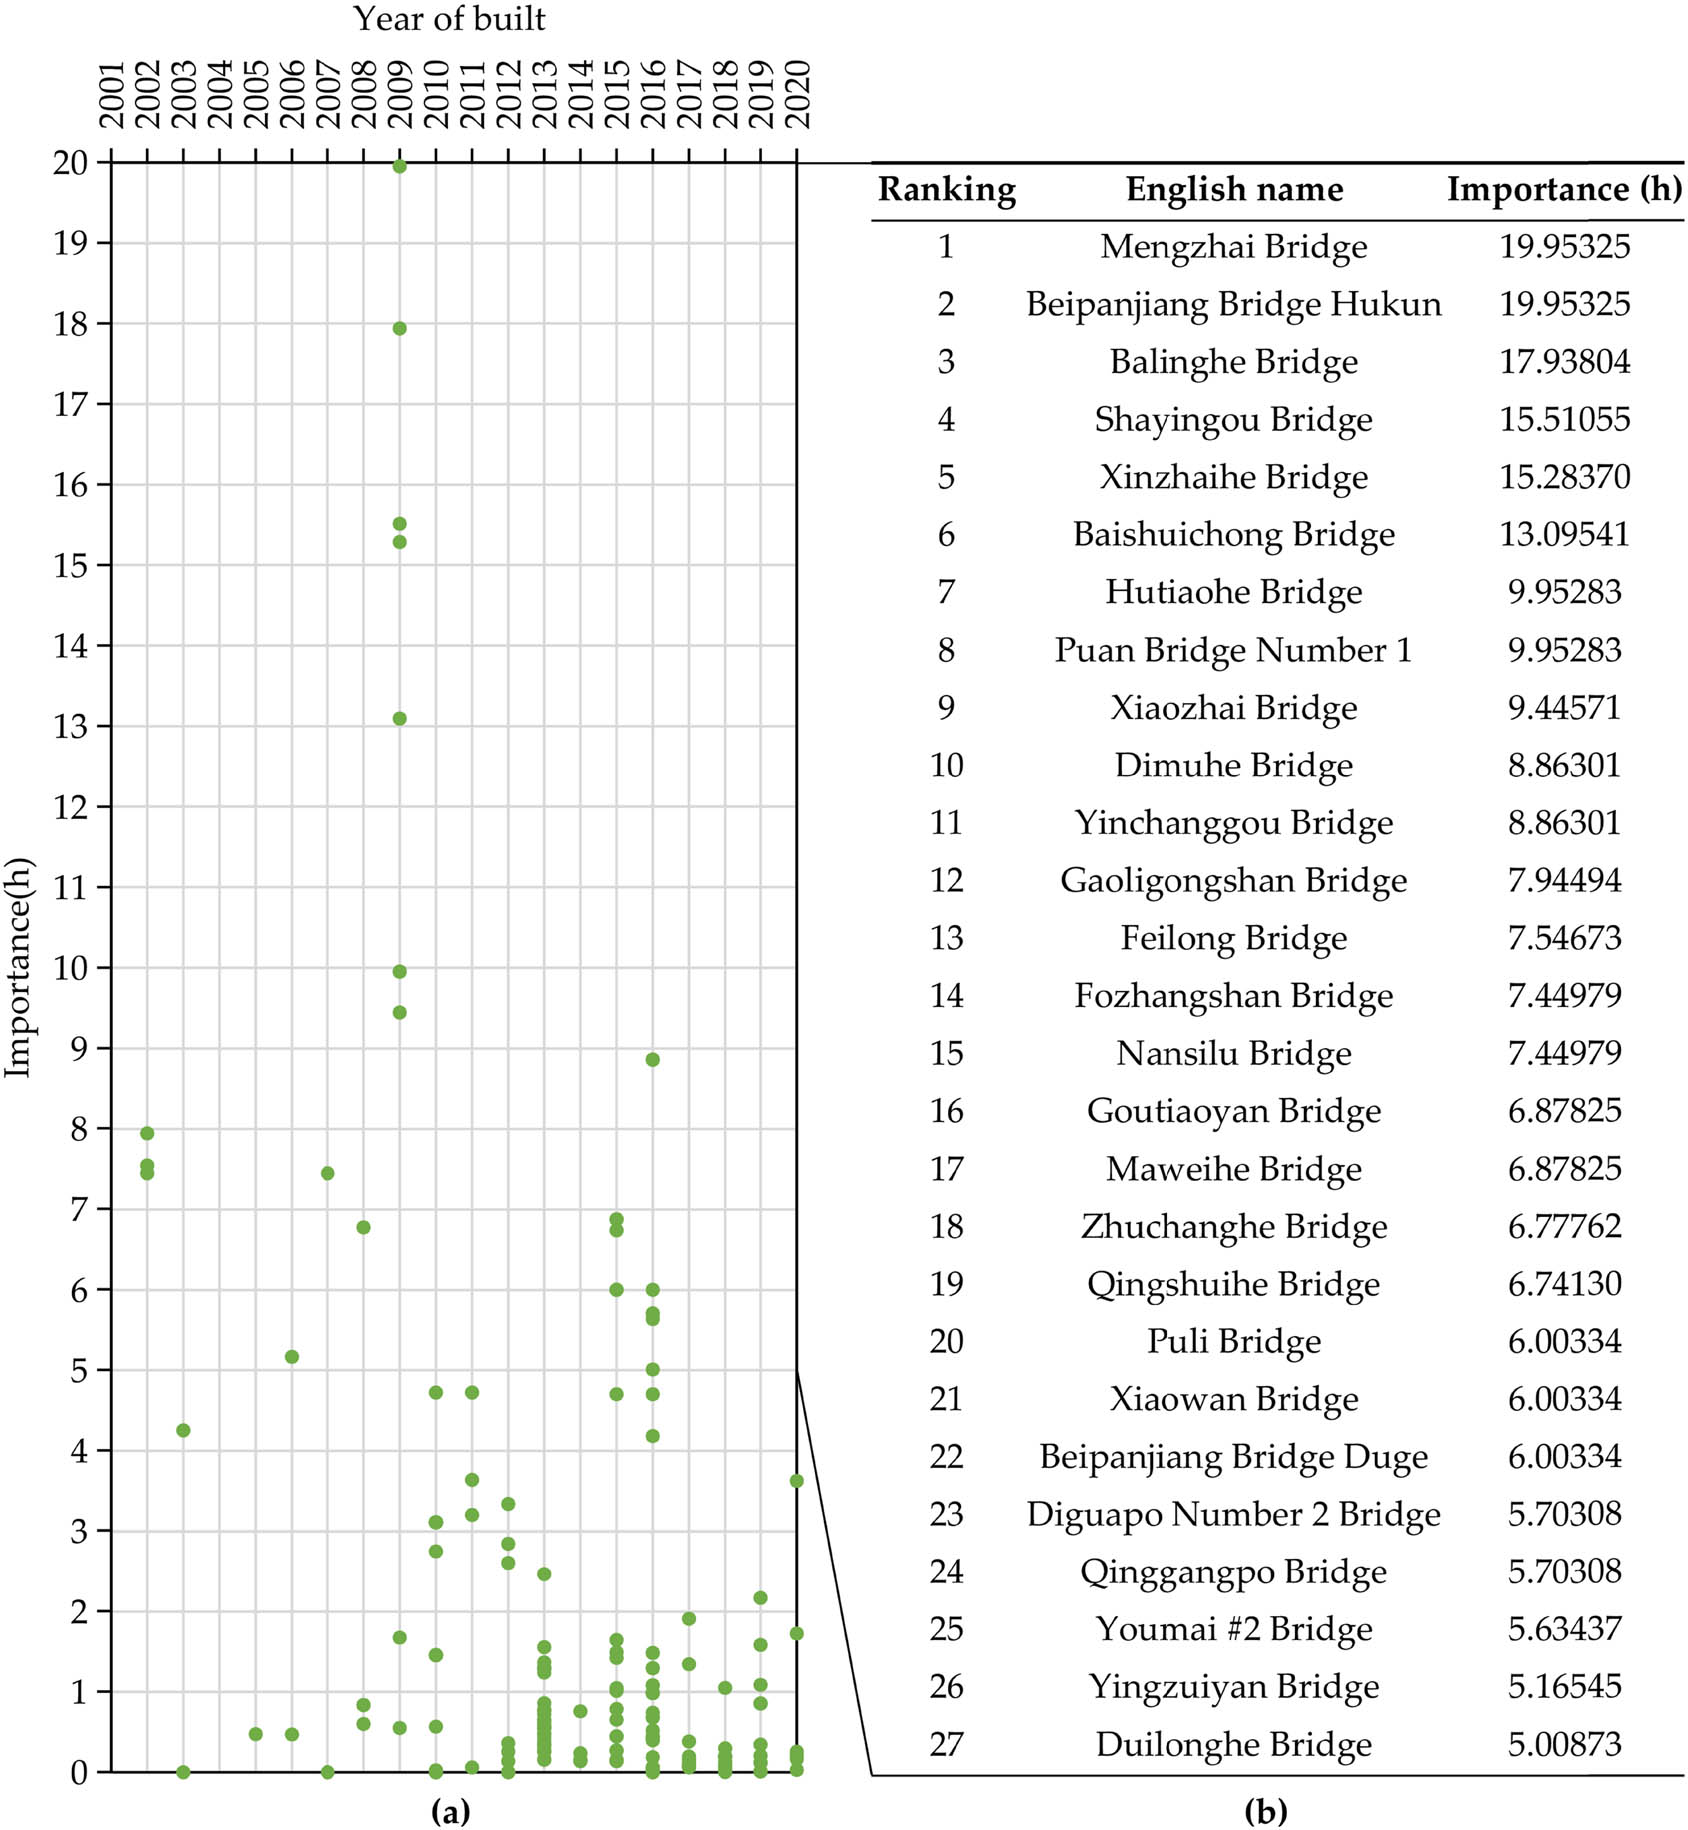
(a) Data distribution of viaduct importance greater than 0, and (b) rankings of viaduct importance greater than 5.
With its spatial distribution of the importance classifications of the viaducts, Figure 4 shows that the viaducts with high importance are distributed on the expressways. Among them, the viaducts along the HUKUN Expressway are the most important, followed by the viaducts along the HANGRUI Expressway and YINBAI Expressway.

Spatial distribution of the importance classification of viaducts in the highway network in 2001–2020.
4.2 Change in viaducts’ importance from 2001 to 2020
Since it is difficult to obtain detailed highway network data for every year, based on the highway data of 2020, viaducts were removed from the highway network dataset year by year from 2020 to simulate the highway network data for each year. Afterward, the importance levels of the viaducts for each year were calculated to obtain the changes in viaduct importance.
The results show that the importance of the viaducts in the highway network changed over time during the construction process of highways and other viaducts (Figure 5). Among them, 2012 and 2016 are important time nodes for change. The importance of most viaducts decreased after their construction. The viaducts with high importance, such as the Mengzhai Bridge, Beipanjiang Bridge Hukun, Balinghe Bridge, and Shayingou Bridge, have decreased in importance since 2012, reducing by more than 45%. However, there are other trends in the importance of some viaducts. In 2016, the importance of the Qingshuihe Bridge, Maweihe Bridge, and Xiaowan Bridge increased by more than 4 h. In addition, there are coupling relationships between viaducts. The importance of viaducts will always be affected by other viaducts, so their importance levels will rise and fall in complex combinations.

Changes in viaducts’ importance in 2001–2020.
5 Discussion
5.1 Spatial distribution of viaduct importance in 2020
Within the whole road network, viaducts in some positions are of prominent importance (Figure 4). The viaducts between Guiyang and Kunming are the most important. They are mainly distributed on the HUKUN Expressway and HANGRUI Expressway, which are critical roads between Yunnan and Guizhou, promoting communication between the two provinces. In addition, since the HUKUN Expressway is the shortest path between the two provincial capitals, the viaducts on this expressway play a key role in connecting transport hub cities. They have high betweenness [32] and strong control ability over the whole network.
Viaducts on the YINBAI Expressway and the western section of the HANGRUI Expressway are also of high importance. The viaducts on the YINBAI Expressway help Guiyang, the provincial capital, control the eastern region of Guizhou and promote communication between the Yunnan–Guizhou area and the eastern provinces. The viaducts on the HANGRUI Expressway help western Yunnan communicate with other counties by expressway for the first time, effectively promoting the connection of mountainous areas in western Yunnan.
5.2 Case analysis of changes in importance
After viaduct construction, their importance will change over time, usually due to the construction of other road sections and viaducts. In the case of different viaduct interactions, the importance of viaducts will increase, decrease, or increase first and then decrease over time. Some cases are explored in the following text to explain this situation.
The orange circles in Figure 6 represent a series of viaducts whose importance decreased over time. These viaducts were built in 2009 at the junction of the two provinces. They connected the first expressway between the two provinces, which is also the shortest path between the capital cities of the two provinces. Before that, Yunnan and Guizhou were connected only through ordinary highways. Therefore, these viaducts had high importance from the beginning of their construction.

Examples of viaducts whose importance decreased after their construction.
However, the importance of these viaducts decreased significantly from 2012 to 2016. That is because with the continuous construction of infrastructure in Yunnan and Guizhou Provinces, an increasing number of viaducts were built, and the expressway networks were continuously improved. There were more alternative routes available for traffic. Therefore, when these viaducts built in 2009 are removed, the impact on traffic is less than before.
However, there are some viaducts whose importance improved after their construction. For example, on the HANGRUI Expressway in southwest Yunnan, the Gaoligongshan Bridge and Fozhangshan Bridge were completed in 2002 (Figure 7). The importance of these two viaducts was not high at the time; in particular, the importance of the Fozhangshan Bridge was 0. However, when the Nansilu Bridge was completed in 2007, the expressway was finally opened to traffic. Therefore, the importance of the Gaoligongshan Bridge and Fozhangshan Bridge was greatly improved 5 years after their construction.

Examples of viaducts whose importance increased after their construction.
The change in viaducts’ importance is influenced by the elements of the whole traffic system. When different situations are combined, there are complex changes in the increase and decrease of viaducts’ importance. For example, the Shimenkan Bridge was the first to be built on the XIARONG Expressway in 2010, and its importance was very low at the time (Figure 8). By 2011, after the construction of the other two viaducts (the Bailupo Bridge and Bamaochong Bridge) on the same expressway, the importance of the Shimenkan Bridge was improved. Because the Bamaochong Bridge and Shimenkan Bridge are close to each other, their importance has always been the same. In 2019, another expressway was opened, along which the Daxiaojing Bridge, Pingtang Bridge, Shahe Bridge, and others were built. This expressway shared some of the traffic pressure of the XIARONG Expressway, whose irreplaceability was reduced. Therefore, the importance of the Shimenkan Bridge, Bailupo Bridge, and Bamaochong Bridge decreased in 2019.

Examples of viaducts whose importance increased and then decreased after their construction.
5.3 Viaducts with low importance still matter
The improvement of transportation infrastructure, such as bridges, can promote regional economic growth and social development [33,34]. However, the construction of viaducts requires capital and technical investment, so it is necessary to consider the relationship between the construction cost and the effect of viaducts. When we observed the regularity of viaducts’ importance changing with time (Figure 5), we found that the early stage of viaduct construction had an apparent effect. Particularly for the viaducts built in 2009, their importance was very high. However, after 2009, plenty of viaducts with comparatively low importance were still constructed. To understand the reasons for building these viaducts in the highway network, we explored the construction law of viaducts.
By illustrating the expressway network from 2000 to 2020, Figure 9a shows that the expressway network in the Yunnan–Guizhou area has increasingly improved. In 2001, the density of the expressway network was only 0.001452 km/km2. The network structure was incomplete and mainly distributed around provincial capital cities. In 2010, the expressway network initially reached a certain scale, forming a ring-radial road network with Kunming and Guiyang as the center. This network pattern enabled a connection between major cities and significantly improved the road accessibility of the region. Then, the expressway network gradually improved. By 2020, Guizhou had basically formed a mature square net-grid road network. In this situation, Guizhou’s road accessibility was further improved, and more counties were included in the expressway network.

(a) Process of expressway development, and (b) distribution of viaducts built in different years.
Comparing the spatial distribution pattern of viaducts and highways, Figure 9 shows that with the change in the road network structure, the status of viaducts also changes. The viaducts before 2009 were mainly built on the radial road system. Due to their special location, they are of high importance. With the continuous construction of expressways, there was a need for further improvement of the road network. Therefore, the construction of subsequent viaducts was mainly used to improve the road network, and the geographical location was not as important as before. Among them, the viaducts in Guizhou were built to improve the gridiron road system and strengthen the robustness of the road network. The viaducts in Yunnan were built to expand the radial road system and enhance the connectivity between Kunming and remote mountainous areas, promoting economic development in these poor areas.
However, the importance of viaducts in the whole region is not prominent enough, which does not mean their construction value is low. In some areas, the construction of viaducts plays a vital role. For example, the Jinshajiang Bridge Taoyuan, built in 2020, is located on the DAYONG Expressway (Figure 10). It crosses the Ludila hydropower station reservoir in the Jinsha River valley, extending the DAYONG Expressway northbound to Yongsheng County. Although overall, it reduces the average integral accessibility of each county administrative area by only 1.72 h, it is an irreplaceable viaduct for Yongsheng County to join the expressway network. If this viaduct was removed, the integral accessibility of Yongsheng County would change from 1,899 to 1961.73 h, an increase of 62.73 h. The Jinshajiang Bridge Taoyuan promotes communication between Yongsheng County and Dali, Kunming, and other cities and is an important factor in promoting the economic development of Yongsheng County.

Location of the Jinshajiang Bridge Taoyuan.
6 Conclusions
Based on road accessibility indices, this study simulated the importance of viaducts in the highway networks in Yunnan and Guizhou Provinces from 2001 to 2020. Several conclusions can be drawn.
This study calculated the importance of viaducts and ranked them according to their values. The viaducts with high importance were mainly built in 2002, 2009, 2015, and 2016. These viaducts are mainly distributed on expressways, such as the HUKUN Expressway, HANGRUI Expressway, and YINBAI Expressway.
After viaduct construction, the importance of viaducts will increase, decrease, or increase first and then decrease over time. Among the years studied, 2012 and 2016 are important time nodes for change. The trend of changes is affected by the construction of highways and viaducts in other locations. In road networks, there are strong coupling relationships between nodes. Therefore, the location of a viaduct should be considered by its place within the whole road network.
The importance of some viaducts is not prominent in the whole region; however, this does not mean that their construction value is low. From a local perspective, they may have a high connectivity effect on specific regions.
There are also some limitations in this study. First, the status of the county-level administrative districts in road networks is equal. It would be more realistic if the counties were given weight according to their socioeconomic status. Second, due to the limitations in data acquisition, this study just calculated the impact of viaduct removal on the average integral accessibility from the perspective of individual traffic. In the future, traffic flow data can be used to measure the importance of viaducts considering expressway capacity. Third, the impact of viaduct construction on domains such as poverty alleviation and ecological protection was not thoroughly elaborated. Considering these factors in the calculation will improve the comprehensiveness of the viaduct evaluation. In addition, the study considered only the highway network in the Yunnan–Guizhou area. In the future, calculations can be based on the national highway network so that the connections between Yunnan and Guizhou and other provinces also can be considered.
-
Funding information: This study was supported by the Strategic Priority Research Program of the Chinese Academy of Sciences (Grant No. XDA23100303).
-
Author contributions: ZC: conceptualization, data collection, formal analysis, methodology, writing – original draft; CC: conceptualization, methodology, supervision, validation, writing – review and editing; LG: conceptualization, methodology, validation, writing – review and editing; SL: data collection, writing – review and editing.
-
Conflict of interest: Authors declare that they have no conflict of interest.
-
Data availability statement: The data involved during the present study are available from the corresponding author upon reasonable request.
Rankings of viaduct importance in Guizhou and Yunnan Provinces
| Year built | Chinese name | English name | Importance (h) |
|---|---|---|---|
| 2009 | 孟寨大桥 | Mengzhai Bridge | 19.95325 |
| 2009 | 沪昆高速北盘江大桥 | Beipanjiang Bridge Hukun | 19.95325 |
| 2009 | 坝陵河特大桥 | Balinghe Bridge | 17.93804 |
| 2009 | 沙银沟大桥 | Shayingou Bridge | 15.51055 |
| 2009 | 新寨河大桥 | Xinzhaihe Bridge | 15.28370 |
| 2009 | 白水冲大桥 | Baishuichong Bridge | 13.09541 |
| 2009 | 虎跳河大桥 | Hutiaohe Bridge | 9.95283 |
| 2009 | 普安1号大桥 | Puan Bridge Number 1 | 9.95283 |
| 2009 | 小寨大桥 | Xiaozhai Bridge | 9.44571 |
| 2016 | 抵母河特大桥 | Dimuhe Bridge | 8.86301 |
| 2016 | 银长沟大桥 | Yinchanggou Bridge | 8.86301 |
| 2002 | 高黎贡山大桥 | Gaoligongshan Bridge | 7.94494 |
| 2002 | 飞龙大桥 | Feilong Bridge | 7.54673 |
| 2002 | 佛掌山大桥 | Fozhangshan Bridge | 7.44979 |
| 2007 | 南丝路大桥 | Nansilu Bridge | 7.44979 |
| 2015 | 狗跳岩大桥 | Goutiaoyan Bridge | 6.87825 |
| 2015 | 马尾河大桥 | Maweihe Bridge | 6.87825 |
| 2008 | 朱昌河特大桥 | Zhuchanghe Bridge | 6.77762 |
| 2015 | 清水河特大桥 | Qingshuihe Bridge | 6.74130 |
| 2015 | 普立特大桥 | Puli Bridge | 6.00334 |
| 2015 | 小湾大桥 | Xiaowan Bridge | 6.00334 |
| 2016 | 杭瑞高速北盘江大桥 | Beipanjiang Bridge Duge | 6.00334 |
| 2016 | 地瓜坡2号大桥 | Diguapo Number 2 Bridge | 5.70308 |
| 2016 | 青杠坡大桥 | Qinggangpo Bridge | 5.70308 |
| 2016 | 油迈2号大桥 | Youmai #2 Bridge | 5.63437 |
| 2006 | 鹰嘴岩大桥 | Yingzuiyan Bridge | 5.16545 |
| 2016 | 对龙河特大桥 | Duilonghe Bridge | 5.00873 |
| 2010 | 石门坎特大桥 | Shimenkan Bridge | 4.72275 |
| 2011 | 芭茅冲特大桥 | Bamaochong Bridge | 4.72275 |
| 2015 | 总溪河特大桥 | Zongxihe Bridge | 4.70178 |
| 2016 | 以补鲁大桥 | Yibulu Bridge | 4.70178 |
| 2003 | 红河大桥 | Yuanjiang River Bridge | 4.25405 |
| 2016 | 岩根河大桥 | Yangenhe Bridge | 4.18271 |
| 2011 | 汕昆高速马岭河大桥 | Malinghe Bridge Shankun | 3.64007 |
| 2020 | 上元1号大桥 | Shangyuan Number 1 Bridge | 3.62741 |
| 2012 | 杭瑞高速落脚河大桥 | Luojiaohe Bridge Hangrui | 3.34077 |
| 2011 | 摆鲁坡大桥 | Bailupo Bridge | 3.20470 |
| 2010 | 乌细沟特大桥 | Wuxigou Bridge | 3.11382 |
| 2010 | 乌贼沟大桥 | Wuzeigou Bridge | 3.11382 |
| 2010 | 排调河号大桥一号桥 | Paidiaohe Number 1 Bridge | 3.11382 |
| 2010 | 排调河号大桥二号桥 | Paidiaohe Number 2 Bridge | 3.11382 |
| 2010 | 猴子河特大桥 | Houzihe Bridge | 3.11382 |
| 2010 | 老山特大桥 | Laoshan Bridge | 3.11382 |
| 2010 | 高尧Ⅰ号大桥 | Gaoyao One Bridge | 3.11382 |
| 2010 | 高晒溪大桥 | Gaoshaixi Bridge | 3.11382 |
| 2010 | 也送坡特大桥 | Yesongpo Bridge | 3.11382 |
| 2010 | 巫进沟Ⅰ号大桥 | Wujingou One Bridge | 3.11382 |
| 2010 | 巫进沟Ⅱ号大桥 | Wujingou Two Bridge | 3.11382 |
| 2012 | 金沙特大桥 | Jinsha Bridge | 2.84555 |
| 2010 | 交梨河特大桥 | Jiaolihe Bridge | 2.75227 |
| 2012 | 洛安江特大桥 | Luoanjiang Bridge G56 | 2.60845 |
| 2013 | 锁蒙高速公路南盘江特大桥 | Nanpanjiang Bridge Suomenggao | 2.46840 |
| 2019 | 大小井特大桥 | Daxiaojing Bridge | 2.17156 |
| 2017 | 沾会高速牛栏江大桥 | Niulanjiang Bridge Zhanhui | 1.91067 |
| 2020 | 涛源金沙江特大桥 | Jinshajiang Bridge Taoyuan | 1.72698 |
| 2009 | 坪子上大桥 | Pingzishang Bridge | 1.67651 |
| 2015 | 黔大高速西溪河大桥 | Xixihe Bridge Qianda | 1.64660 |
| 2019 | 平塘特大桥 | Pingtang Bridge | 1.58547 |
| 2013 | 桐子园特大桥 | Tongziyuan Bridge | 1.55696 |
| 2015 | 八抱树特大桥 | Babaoshu Bridge | 1.49479 |
| 2016 | 马路坡一号大桥 | Malupo #1 Bridge | 1.48560 |
| 2016 | 凯峡河特大桥 | Kaixiahe Bridge | 1.48560 |
| 2010 | 归屯大桥 | Guitun Bridge | 1.45798 |
| 2010 | 污河昔特大桥 | Wuhexi Bridge | 1.45798 |
| 2010 | 流架I号大桥 | Liujia Number One Bridge | 1.45798 |
| 2010 | 九昔大桥 | Jiuxi Bridge | 1.45798 |
| 2010 | 都柳江一号大桥 | Duliujiang Bridge Number 1 | 1.45798 |
| 2010 | 八吉溪大桥 | Bajixi Bridge | 1.45798 |
| 2015 | 松河特大桥 | Songhe Bridge | 1.42336 |
| 2013 | 弄林大桥 | Nonglin Bridge | 1.36691 |
| 2017 | 小旱庄大桥 | Xiaohanzhuang Bridge | 1.34518 |
| 2013 | 柏杨湾大桥 | Boyangwan Bridge | 1.29734 |
| 2013 | 二郎河特大桥 | Erlanghe Bridge | 1.29734 |
| 2013 | 桐梓特大桥 | Tongzihe Bridge | 1.29734 |
| 2013 | 五岔河特大桥 | Wuchahe Bridge | 1.29734 |
| 2013 | 关寨大桥 | Guanzhai Bridge | 1.29734 |
| 2016 | 方家寨特大桥 | Fangjiazhai Bridge | 1.29622 |
| 2016 | 羊叉河特大桥 | Yangchahe Bridge | 1.29622 |
| 2013 | 西游洞大桥 | Xiyoudong Bridge | 1.24129 |
| 2019 | 宜毕高速赤水河大桥 | Chishuihe Bridge Yibi | 1.08768 |
| 2016 | 老团坡1号大桥 | Laotuanpo Number 1 Bridges | 1.08194 |
| 2016 | 老团坡2号大桥 | Laotuanpo Number 2 Bridges | 1.08194 |
| 2018 | 李子沟大桥 | Lizigou Bridge | 1.04998 |
| 2015 | 武佐河特大桥 | Wuzuohe Bridge | 1.04826 |
| 2015 | 夹岩特大桥 | Jiayan Bridge | 1.01444 |
| 2016 | 三岔沟特大桥 | Sanchagou Bridge | 0.98671 |
| 2016 | 泡桐湾大桥 | Paotongwan Bridge | 0.98671 |
| 2016 | 洒鱼河特大桥 | Sayuhe Bridge | 0.98671 |
| 2016 | 牛家沟大桥 | Niujiagou Bridge | 0.98671 |
| 2016 | 芝来沟特大桥 | Zhilaigou Bridge | 0.98671 |
| 2016 | 龙洞湾大桥 | Longdongwan Bridge | 0.98671 |
| 2013 | 天池特大桥 | Tianchi Bridge Dejiang | 0.85934 |
| 2019 | 马场河大桥 | Machanghe Bridge | 0.85588 |
| 2019 | 打见河大桥 | Dajianhe Bridge | 0.85588 |
| 2019 | 沙河大桥 | Shahe Bridge | 0.85588 |
| 2008 | 牛棚特大桥 | Niupeng Bridge | 0.83649 |
| 2008 | 黑冲沟特大桥 | Heichonggou Bridge | 0.83649 |
| 2015 | 余凯高速舞阳河大桥 | Wuyanghe Bridge Yukai | 0.78746 |
| 2013 | 新寨大桥 | Xinzhai Bridge | 0.77186 |
| 2013 | 望龙包特大桥 | Wanglongbao Bridge | 0.77186 |
| 2013 | 老鹰岩特大桥 | Laoyingyan Bridge | 0.77186 |
| 2014 | 贞丰北盘江大桥 | Beipanjiang Bridge Zhenfeng | 0.75885 |
| 2016 | 陡山坝特大桥 | Doushanba Bridge | 0.74041 |
| 2013 | 清渡河大桥 | Qingduhe Bridge | 0.72148 |
| 2016 | 马蹄河特大桥 | Matihe Bridge | 0.68040 |
| 2016 | 麻岭大桥 | Maling Bridge Yande | 0.68040 |
| 2015 | 纳雍特大桥 | Nayong Bridge | 0.65455 |
| 2013 | 天桥特大桥 | Tian Bridge | 0.65306 |
| 2013 | 冷水沟大桥 | Lengshuigou Bridge | 0.65249 |
| 2013 | 小江河特大桥 | Xiaojiang Bridge | 0.61905 |
| 2008 | 兰海高速乌江大桥 | Wujiang Bridge Lanhai | 0.60087 |
| 2013 | 七星河特大桥 | Qixinghe Bridge | 0.58503 |
| 2013 | 小营盘大桥 | Xiaoyingpan Bridge | 0.56828 |
| 2010 | 四寨河大桥 | Sizhaihe Bridge | 0.56760 |
| 2013 | 河头1号大桥 | Hetou Bridge Number 1 | 0.56122 |
| 2013 | 岩子脚特大桥 | Yanzijiao Bridge | 0.55449 |
| 2009 | 茅台特大桥 | Maotai Bridge | 0.55085 |
| 2013 | 乌木铺特大桥 | Wumupu Bridge | 0.55082 |
| 2013 | 麻元特大桥 | Mayuan Bridge | 0.54263 |
| 2016 | 余庆乌江大桥 | Wujiang Bridge Yuqing | 0.52137 |
| 2013 | 马岩沟特大桥 | Mayangou Bridge | 0.48187 |
| 2013 | 土城特大桥 | Tucheng Bridge | 0.48187 |
| 2005 | 老王田大桥 | Laowangtian Bridge | 0.47437 |
| 2006 | 各闷特大桥 | Gemen Bridge | 0.47042 |
| 2016 | 席子河大桥 | Xizihe Bridge | 0.45656 |
| 2015 | 摆捞河大桥 | Bailaohe Bridge | 0.44625 |
| 2015 | 石桥特大桥 | Shiqiao Bridge | 0.44625 |
| 2013 | 六冲河特大桥 | Liuchonghe Bridge | 0.43544 |
| 2016 | 下平川特大桥 | Xiapingchuan Bridge | 0.43048 |
| 2016 | 背武甲大桥 | Beiwujia Bridge | 0.43048 |
| 2016 | 青曲坝大桥 | Qingquba Bridge | 0.40543 |
| 2016 | 三岔河大桥 | Sanchahe Bridge G69 | 0.39720 |
| 2013 | 赫章特大桥 | Hezhang Bridge | 0.38897 |
| 2017 | 沙子坡特大桥 | Shazipo Bridge | 0.38338 |
| 2012 | 龙生特大桥 | Zongqihe Viaduct | 0.36252 |
| 2013 | 笋子岩大桥 | Sunziyan Bridge | 0.34781 |
| 2019 | 火花特大桥 | Huohua Bridge | 0.34425 |
| 2013 | 小关子特大桥 | Xiaoguanzi Bridge | 0.34033 |
| 2013 | 陛诏大桥 | Bizhao Bridge | 0.34033 |
| 2018 | 穿岩洞大桥 | Chuanyandong Bridge | 0.29776 |
| 2013 | 高过河特大桥 | Gaoguohe Bridge | 0.28850 |
| 2015 | 厦蓉高速三岔河大桥 | Sanchahe Bridge Xiarong | 0.27402 |
| 2015 | 龙井湾特大桥 | Longjingwan Bridge | 0.26792 |
| 2012 | 木篷特大桥 | Mupeng Bridge | 0.25726 |
| 2013 | 龙川河特大桥 | Longchuan Bridge | 0.25726 |
| 2013 | 杭瑞高速乌江大桥 | Wujiang Bridge Hangrui | 0.25691 |
| 2020 | 新寨村2号大桥 | Xinzhaicun Number 2 Bridge | 0.25598 |
| 2014 | 竹林坳特大桥 | Zhulinao Bridge | 0.23727 |
| 2019 | 格巧高速小江特大桥 | Xiaojiang Bridge Geqiao | 0.20674 |
| 2020 | 大水沟大桥 | Dashuigou Bridge | 0.20674 |
| 2017 | 香火岩特大桥 | Xianghuoyan Bridge | 0.19592 |
| 2018 | 长滩河特大桥 | Changtanhe Bridge | 0.19592 |
| 2018 | 新田坡特大桥 | Xintianpo Bridge | 0.19592 |
| 2018 | 柿花寨特大桥 | Shihuazhai Bridge | 0.19592 |
| 2016 | 官林特大桥 | Guanlin Bridge | 0.18764 |
| 2020 | 普拉河大桥 | Pulahe Bridge | 0.16557 |
| 2017 | 徐家寨大桥 | Xujiazhai Bridge | 0.16363 |
| 2013 | 舞阳河特大桥 | Wuyanghe Bridge | 0.16008 |
| 2013 | 沿榕高速乌江大桥 | Wujiang Bridge Yanrong | 0.15576 |
| 2014 | 周家院大桥 | Zhoujiayuan Bridge | 0.15432 |
| 2015 | 马河特大桥 | Mahe Bridge | 0.15379 |
| 2015 | 鱼洞大桥 | Yudong Bridge | 0.15016 |
| 2015 | 余凯高速清水江大桥 | Qingshuijiang Bridge Yukai | 0.13777 |
| 2012 | 大汶溪大桥 | Dawenxi Bridge | 0.13776 |
| 2014 | 浪坝河特大桥 | Langbahe Bridge | 0.13772 |
| 2018 | 水昔河大桥 | Shuixihe Bridge | 0.12740 |
| 2017 | 息黔高速公路六广河特大桥 | Liuguanghe Bridge Xiqian | 0.12245 |
| 2019 | 三施江凯河大桥 | Jiangkai Bridge Sanshi | 0.12001 |
| 2019 | 三施高速舞阳河大桥 | Wuyanghe Bridge Sanshi | 0.12001 |
| 2017 | 鹿窝大桥 | Luwo Bridge | 0.09213 |
| 2017 | 息烽河大桥 | Xifenghe Bridge | 0.09213 |
| 2018 | 楠木渡乌江大桥 | Wujiang Bridge Nanmudu | 0.08089 |
| 2018 | 银厂河特大桥 | Yinchanghe Bridge | 0.08089 |
| 2017 | 洋水河特大桥 | Yangshuihe Bridge | 0.06284 |
| 2017 | 温泉特大桥 | Wenquan Bridge | 0.06284 |
| 2011 | 田坝大桥 | Tianba Bridge | 0.05992 |
| 2016 | 白黔高速干河大桥 | Ganhe Bridge Baiqian | 0.05922 |
| 2016 | 中坪河大桥 | Zhongpinghe Bridge | 0.05922 |
| 2016 | 耳海河大桥 | Erhaihe Bridge | 0.05922 |
| 2016 | 巧马林场1号大桥 | Qiaomalinchang #1 Bridge | 0.04037 |
| 2018 | 夜郎湖特大桥 | Yelanghu Bridge | 0.03498 |
| 2020 | 牛长河特大桥 | Niuchanghe Bridge | 0.02873 |
| 2016 | 牛栏江大桥北支 | Niulanjiang Bridge Northbound | 0.02488 |
| 2010 | 巧马林场1号大桥 | Qiaomalinchang #1 Bridge | 0.02452 |
| 2019 | 都柳江特大桥 | Duliujiang Bridge | 0.01049 |
| 2019 | 护国河特大桥 | Huguohe Bridge | 0.01033 |
| 2018 | 官渡河特大桥 | Guanduhe Bridge | 0.00241 |
| 2012 | 汶溪大桥 | Wenxi Bridge | 0.00231 |
| 2016 | 云桂铁路丘北南盘江大桥 | Nanpanjiang Railway Bridge Qiubei | 0.00075 |
| 2012 | 江门口特大桥 | Jiangmenkou Bridge | 0.00068 |
| 2016 | 黔灵湖大桥 | Qianlinghu Bridge | 0.00038 |
| 2010 | 江凯河大桥 | Jiangkai Bridge | 0.00026 |
| 2010 | 鹅翅膀大桥 | Echibang Bridge | 0.00026 |
| 2007 | 乌江河大桥 | Wujiang Route S204 Bridge | 0.00011 |
| 2007 | 盐津河梁桥 | Yanjinhe Route S208 Bridge | 0.00008 |
| 2003 | 小关水库大桥 | Xiaoguanshuiku Bridge | 0.00007 |
| 2001 | 乌溪大桥 | Wuxi Bridge | 0 |
| 2001 | 六广河大桥 | Liuguanghe Bridge | 0 |
| 2001 | 干沟大桥 | Gangou Bridge | 0 |
| 2001 | 西溪干沟大桥 | Xixi Gangou Bridge | 0 |
| 2001 | 贵毕公路落脚河大桥 | Luojiaohe Bridge Guibi | 0 |
| 2001 | 贵毕公路西溪河大桥 | Xixihe Bridge Guibi | 0 |
| 2003 | 关兴公路北盘江大桥 | Beipanjiang Bridge Guanxing | 0 |
| 2003 | 清水大桥 | Qingshui Bridge | 0 |
| 2003 | 阿志河大桥 | Azhihe Bridge | 0 |
| 2005 | 两岔河大桥 | Liangchahe Bridge | 0 |
| 2005 | 六圭河大桥 | Liuguihe Bridge | 0 |
| 2005 | 南孟溪大桥 | Nanmengxi Bridge | 0 |
| 2005 | 满天星大桥 | Mantianxing Bridge | 0 |
| 2006 | 宜良南盘江大桥 | Nanpanjiang Bridge Yiliang | 0 |
| 2006 | 西山沟大桥 | Xishangou Bridge | 0 |
| 2008 | 牛栏江大桥南支 | Niulanjiang Bridge Southbound | 0 |
| 2008 | 珍珠大桥 | Zhenzhu Bridge | 0 |
| 2009 | 乌江河 闪渡大桥 | Wujiang Bridge Shandu | 0 |
| 2009 | 漭街渡大桥 | Mangjiedu Bridge | 0 |
| 2010 | 洛香大桥 | Luoxiang Bridge | 0 |
| 2010 | 肇兴大桥 | Zhaoxing Bridge | 0 |
| 2011 | 岩头河大桥 | Yantouhe Bridge | 0 |
| 2011 | 罗天乐大桥 | Luotianle Bridge | 0 |
| 2012 | 偏坡特大桥 | Pianpo Bridge | 0 |
| 2012 | 北盘江花叶岩大桥 | Beipanjiang Bridge Huayeyan | 0 |
| 2012 | 者告河特大桥 | Zhegao Bridge | 0 |
| 2012 | 马过河特大桥 | Maguohe Bridge | 0 |
| 2012 | 叙永赤水河大桥 | Chishuihe Bridge Xuyong | 0 |
| 2012 | 毕节机场路南河大桥 | Diaolanhe Bijie Airport Expressway Bridge | 0 |
| 2013 | 油房沟特大桥 | Youfanggou Bridge | 0 |
| 2013 | 洪渡河特大桥 | Hongduhe Bridge | 0 |
| 2014 | 城洋北盘江大桥 | Beipanjiang Bridge Chengyang | 0 |
| 2014 | 情人谷特大桥 | Qingrengu Bridge | 0 |
| 2014 | 百大特大桥 | Baida Bridge | 0 |
| 2015 | 云川金沙江大桥 | Jinshajiang Bridge Yunchuan | 0 |
| 2015 | 法朗沟特大桥 | Falanggou Bridge | 0 |
| 2015 | 灯场大桥 | Dengchang Bridge | 0 |
| 2015 | 碾子坪特大桥 | Nianziping Bridge | 0 |
| 2015 | 金口河大桥 | Jinkouhe Bridge | 0 |
| 2015 | 韩家沟特大桥 | Hanjiagou Bridge | 0 |
| 2015 | 北盘江岩架大桥 | Beipanjiang Bridge Wang’an | 0 |
| 2015 | 在拱特大桥 | Zaigong Bridge | 0 |
| 2015 | 小河口特大桥 | Xiaohekou Bridge | 0 |
| 2016 | 大漆特大桥 | Daqi Bridge | 0 |
| 2016 | 德江小河特大桥 | Xiaohe Dejiang Bridge | 0 |
| 2016 | 新场特大桥 | Xinchang Bridge | 0 |
| 2016 | 板仑河特大桥 | Banlunhe Bridge | 0 |
| 2016 | 沿河乌江大桥 | Wujiang Bridge Yanhe | 0 |
| 2016 | 芙蓉江大桥 | Furongjiang Bridge Dao’an | 0 |
| 2016 | 贵黔高速鸭池河大桥 | Yachi Bridge | 0 |
| 2016 | 乌江海马大桥 | Wujiang Bridge Haima | 0 |
| 2016 | 马岭河大桥 | Malinghe Bridge One | 0 |
| 2016 | 龙江大桥 | Longjiang Bridge | 0 |
| 2016 | 卡拉河大桥 | Kalahe Bridge | 0 |
| 2017 | 黑土特大桥 | Heitu Bridge | 0 |
| 2017 | 惠罗高速红水河大桥 | Hongshuihe Bridge Huiluo | 0 |
| 2017 | 金沙江葫芦口大桥 | Jinshajiang Bridge Hulukou | 0 |
| 2018 | 临江庙大桥 | Linjiangmiao Bridge | 0 |
| 2018 | 九天大桥 | Jiutian Bridge | 0 |
| 2018 | 袁家特大桥 | Yuanjia Bridge | 0 |
| 2018 | 夜郎河特大桥 | Yelanghe Railway Bridge | 0 |
| 2018 | 天堂河特大桥 | Tiantanghe Bridge | 0 |
| 2018 | 底那河大桥 | New Dinahe Bridge | 0 |
| 2019 | 渔塘特大桥 | Yutang Bridge | 0 |
| 2019 | 赤水河红军大桥 | Chishuihe Bridge Hongjun | 0 |
| 2019 | 月亮湾金沙江大桥 | Jinshajiang Bridge Yueliangwan | 0 |
| 2020 | 小溪大桥 | Xiaoxi Bridge | 0 |
| 2020 | 羊乐大桥 | Yangle Bridge | 0 |
| 2020 | 高粱地特大桥 | Gaoliangdi Bridge | 0 |
| 2020 | 黑泥沟特大桥 | Heinigou Bridge | 0 |
References
[1] Wang WL, Huang XY, Cao XS. Evolution of road accessibility of concentrated contiguous areas with particular difficulties in China from 1980 to 2010. Sci Geographica Sin. 2016;36(1):29–38 (in Chinese with English summary).Search in Google Scholar
[2] Luo XB, Zhu N, Zou HF. China’s lagging region development and targeted transportation infrastructure investments. Ann Econ Financ. 2014;15:365–409.Search in Google Scholar
[3] Choi E, Jeon JS, Kim WJ, Kang JW. Investigation of MRS and SMA Dampers Effects on Bridge Seismic Resistance Employing Analytical Models. Int J Steel Struct. 2018;18:1325–35.10.1007/s13296-018-0125-8Search in Google Scholar
[4] Kim SJ, Kim JHJ, Yi ST, Noor NM, Kim SC. Structural Performance evaluation of a precast PSC curved girder bridge constructed using multi-tasking formwork. Int J Concr Struct Mater. 2016;10(Suppl 3):1–17.10.1007/s40069-016-0160-9Search in Google Scholar
[5] Wang CQ, Shen YG, Zou Y, Zhuang YZ, Li TQ. Analysis of Mechanical characteristics of steel-concrete composite flat link slab on simply-supported beam bridge. KSCE J Civ Eng. 2019;23:3571–80.10.1007/s12205-019-1921-1Search in Google Scholar
[6] Padgett JE, DesRoches R, Nilsson E. Regional Seismic Risk Assessment of Bridge Network in Charleston, South Carolina. J Earthq Eng. 2010;14(6):918–33.10.1080/13632460903447766Search in Google Scholar
[7] Merschman E, Doustmohammadi M, Salman AM, Anderson M. Postdisaster decision framework for bridge repair prioritization to improve road network resilience. Transp Res Rec. 2020;2674(3):81–92.10.1177/0361198120908870Search in Google Scholar
[8] Somy S, Shafaei R, Ramezanian R. Resilience-based mathematical model to restore disrupted road-bridge transportation networks. Struct Infrastruct Eng. 2022;18(9):1334–49.10.1080/15732479.2021.1906711Search in Google Scholar
[9] Yu EY, Wang YP, Fu Y, Chen DB, Xie M. Identifying critical nodes in complex networks via graph convolutional networks. Knowl-Based Syst. 2020;198:105893.10.1016/j.knosys.2020.105893Search in Google Scholar
[10] Munikoti S, Das L, Natarajan B. Scalable graph neural network-based framework for identifying critical nodes and links in complex networks. Neurocomputing. 2022;468:211–21.10.1016/j.neucom.2021.10.031Search in Google Scholar
[11] Corley HW, Sha DY. Most vital links and nodes in weighted networks. Oper Res Lett. 1982;1(4):157–60.10.1016/0167-6377(82)90020-7Search in Google Scholar
[12] Megzari A, Raj PP, Osamy W, Khedr AM. Applications, challenges, and solutions to single- and multi-objective critical node detection problems: a survey. J Supercomput. 2023;79:19770–808.10.1007/s11227-023-05429-3Search in Google Scholar
[13] Faramondi L, Oliva G, Pascucci F, Panzieri S, Setola R. Critical node detection based on attacker preferences. 2016 24th Mediterranean Conference on Control and Automation (MED). Athens, Greece; 2016. p. 773–8.10.1109/MED.2016.7535859Search in Google Scholar
[14] Tomaino V, Arulselvan A, Veltri P, Pardalos PM. Studying connectivity properties in human protein-protein interaction network in cancer pathway. In: Pardalos P, Xanthopoulos P, Zervakis M, editor. Data Mining for Biomarker Discovery. Boston, MA: Springer; 2012. p. 187–97.10.1007/978-1-4614-2107-8_10Search in Google Scholar
[15] Ugurlu O, Akram N, Akram VK. Critical nodes detection in iot-based cyber-physical systems: applications, methods, and challenges. In: Taser PY, editor. Emerging Trends in IoT and Integration with Data Science, Cloud Computing, and Big Data Analytics. Hershey, PA: IGI Global; 2022. p. 226–39.10.4018/978-1-7998-4186-9.ch012Search in Google Scholar
[16] Borgatti SP. Identifying sets of key players in a social network. Comput Math Organiz Theor. 2006;12:21–34.10.1007/s10588-006-7084-xSearch in Google Scholar
[17] Taylor MAP, Sekhar SVC, D’Este GM. Application of accessibility based methods for vulnerability analysis of strategic road networks. Netw Spat Econ. 2006;6:267–91.10.1007/s11067-006-9284-9Search in Google Scholar
[18] Yin HY, Xu LQ. Measuring the structural vulnerability of road network: A network efficiency perspective. J Shanghai Jiaotong Univ. (Sci.). 2010;15:736–42.10.1007/s12204-010-1078-zSearch in Google Scholar
[19] Viljoen NM, Joubert JW. The road most travelled: the impact of urban road infrastructure on supply chain network vulnerability. Netw Spat Econ. 2018;18:85–113.10.1007/s11067-017-9370-1Search in Google Scholar
[20] Matisziw TC, Murray AT. Modeling s-t path availability to support disaster vulnerability assessment of network infrastructure. Comput Oper Res. 2009;36(1):16–26.10.1016/j.cor.2007.09.004Search in Google Scholar
[21] Jenelius E, Mattsson LG. Road network vulnerability analysis of area-covering disruptions: A grid-based approach with case study. Transport Res Part A. 2012;46(5):746–60.10.1016/j.tra.2012.02.003Search in Google Scholar
[22] Rudolfson N, Gruendl M, Nkurunziza T, Kateera F, Sonderman K, Nihiwacu E, et al. Validating the global surgery geographical accessibility indicator: differences in modeled versus patient-reported travel times. World J Surg. 2020;44:2123–30.10.1007/s00268-020-05480-8Search in Google Scholar PubMed PubMed Central
[23] Handy SL, Niemeier DA. Measuring accessibility: An exploration of issues and alternatives. Environ Plan A. 1997;29(7):1175–94.10.1068/a291175Search in Google Scholar
[24] Pooler J. Measuring geographical accessibility: A review of current approaches and problems in the use of population potentials. Geoforum. 1987;18(3):269–89.10.1016/0016-7185(87)90012-1Search in Google Scholar PubMed
[25] Condeço-Melhorado A, Christidis P. Road accessibility in border regions: A joint approach. Netw Spat Econ. 2018;18:363–83.10.1007/s11067-017-9362-1Search in Google Scholar
[26] Lu H, Zhang XY, Holt JB, Kanny D, Croft JB. Quantifying spatial accessibility in public health practice and research: an application to on-premise alcohol outlets, United States, 2013. Int J Health Geogr. 2018;17:23.10.1186/s12942-018-0143-ySearch in Google Scholar PubMed PubMed Central
[27] Local History Compilation Committee in Yunnan Province. Yunnan Yearbook 2020. Kunming: The Yearbook Publishing House of Yunnan; 2020; p. 23–5.Search in Google Scholar
[28] Local History Compilation Committee in Guizhou Province. Guizhou Yearbook 2020. Guiyang: Editorial Department of Guizhou Yearbook; 2020; p. 32–3.Search in Google Scholar
[29] National Bureau of Statistics. China Statistical Yearbook. Beijing: China Statistics Press; 2021. p. 92.Search in Google Scholar
[30] Yunnan Provincial Bureau of Statistics. Yunnan Statistical Yearbook. Beijing: China Statistics Press; 2021. p. 457.Search in Google Scholar
[31] Ingram DR. The concept of accessibility: A search for an operational form. Reg Stud. 1971;5(2):101–7.10.1080/09595237100185131Search in Google Scholar
[32] Bavelas A. Mathematical model of group structures. Appl Anthropol. 1948;7(3):16–30.10.17730/humo.7.3.f4033344851gl053Search in Google Scholar
[33] Berechman J, Ozmen D, Ozbay K. Empirical analysis of transportation investment and economic development at state, county and municipality levels. Transportation. 2006;33:537–51.10.1007/s11116-006-7472-6Search in Google Scholar
[34] Mohmand YT, Wang AH, Saeed A The impact of transportation infrastructure on economic growth: empirical evidence from Pakistan. Transport Lett. 2017;9(2):63–9.10.1080/19427867.2016.1165463Search in Google Scholar
© 2024 the author(s), published by De Gruyter
This work is licensed under the Creative Commons Attribution 4.0 International License.
Articles in the same Issue
- Regular Articles
- Theoretical magnetotelluric response of stratiform earth consisting of alternative homogeneous and transitional layers
- The research of common drought indexes for the application to the drought monitoring in the region of Jin Sha river
- Evolutionary game analysis of government, businesses, and consumers in high-standard farmland low-carbon construction
- On the use of low-frequency passive seismic as a direct hydrocarbon indicator: A case study at Banyubang oil field, Indonesia
- Water transportation planning in connection with extreme weather conditions; case study – Port of Novi Sad, Serbia
- Zircon U–Pb ages of the Paleozoic volcaniclastic strata in the Junggar Basin, NW China
- Monitoring of mangrove forests vegetation based on optical versus microwave data: A case study western coast of Saudi Arabia
- Microfacies analysis of marine shale: A case study of the shales of the Wufeng–Longmaxi formation in the western Chongqing, Sichuan Basin, China
- Multisource remote sensing image fusion processing in plateau seismic region feature information extraction and application analysis – An example of the Menyuan Ms6.9 earthquake on January 8, 2022
- Identification of magnetic mineralogy and paleo-flow direction of the Miocene-quaternary volcanic products in the north of Lake Van, Eastern Turkey
- Impact of fully rotating steel casing bored pile on adjacent tunnels
- Adolescents’ consumption intentions toward leisure tourism in high-risk leisure environments in riverine areas
- Petrogenesis of Jurassic granitic rocks in South China Block: Implications for events related to subduction of Paleo-Pacific plate
- Differences in urban daytime and night block vitality based on mobile phone signaling data: A case study of Kunming’s urban district
- Random forest and artificial neural network-based tsunami forests classification using data fusion of Sentinel-2 and Airbus Vision-1 satellites: A case study of Garhi Chandan, Pakistan
- Integrated geophysical approach for detection and size-geometry characterization of a multiscale karst system in carbonate units, semiarid Brazil
- Spatial and temporal changes in ecosystem services value and analysis of driving factors in the Yangtze River Delta Region
- Deep fault sliding rates for Ka-Ping block of Xinjiang based on repeating earthquakes
- Improved deep learning segmentation of outdoor point clouds with different sampling strategies and using intensities
- Platform margin belt structure and sedimentation characteristics of Changxing Formation reefs on both sides of the Kaijiang-Liangping trough, eastern Sichuan Basin, China
- Enhancing attapulgite and cement-modified loess for effective landfill lining: A study on seepage prevention and Cu/Pb ion adsorption
- Flood risk assessment, a case study in an arid environment of Southeast Morocco
- Lower limits of physical properties and classification evaluation criteria of the tight reservoir in the Ahe Formation in the Dibei Area of the Kuqa depression
- Evaluation of Viaducts’ contribution to road network accessibility in the Yunnan–Guizhou area based on the node deletion method
- Permian tectonic switch of the southern Central Asian Orogenic Belt: Constraints from magmatism in the southern Alxa region, NW China
- Element geochemical differences in lower Cambrian black shales with hydrothermal sedimentation in the Yangtze block, South China
- Three-dimensional finite-memory quasi-Newton inversion of the magnetotelluric based on unstructured grids
- Obliquity-paced summer monsoon from the Shilou red clay section on the eastern Chinese Loess Plateau
- Classification and logging identification of reservoir space near the upper Ordovician pinch-out line in Tahe Oilfield
- Ultra-deep channel sand body target recognition method based on improved deep learning under UAV cluster
- New formula to determine flyrock distance on sedimentary rocks with low strength
- Assessing the ecological security of tourism in Northeast China
- Effective reservoir identification and sweet spot prediction in Chang 8 Member tight oil reservoirs in Huanjiang area, Ordos Basin
- Detecting heterogeneity of spatial accessibility to sports facilities for adolescents at fine scale: A case study in Changsha, China
- Effects of freeze–thaw cycles on soil nutrients by soft rock and sand remodeling
- Vibration prediction with a method based on the absorption property of blast-induced seismic waves: A case study
- A new look at the geodynamic development of the Ediacaran–early Cambrian forearc basalts of the Tannuola-Khamsara Island Arc (Central Asia, Russia): Conclusions from geological, geochemical, and Nd-isotope data
- Spatio-temporal analysis of the driving factors of urban land use expansion in China: A study of the Yangtze River Delta region
- Selection of Euler deconvolution solutions using the enhanced horizontal gradient and stable vertical differentiation
- Phase change of the Ordovician hydrocarbon in the Tarim Basin: A case study from the Halahatang–Shunbei area
- Using interpretative structure model and analytical network process for optimum site selection of airport locations in Delta Egypt
- Geochemistry of magnetite from Fe-skarn deposits along the central Loei Fold Belt, Thailand
- Functional typology of settlements in the Srem region, Serbia
- Hunger Games Search for the elucidation of gravity anomalies with application to geothermal energy investigations and volcanic activity studies
- Addressing incomplete tile phenomena in image tiling: Introducing the grid six-intersection model
- Evaluation and control model for resilience of water resource building system based on fuzzy comprehensive evaluation method and its application
- MIF and AHP methods for delineation of groundwater potential zones using remote sensing and GIS techniques in Tirunelveli, Tenkasi District, India
- New database for the estimation of dynamic coefficient of friction of snow
- Measuring urban growth dynamics: A study in Hue city, Vietnam
- Comparative models of support-vector machine, multilayer perceptron, and decision tree predication approaches for landslide susceptibility analysis
- Experimental study on the influence of clay content on the shear strength of silty soil and mechanism analysis
- Geosite assessment as a contribution to the sustainable development of Babušnica, Serbia
- Using fuzzy analytical hierarchy process for road transportation services management based on remote sensing and GIS technology
- Accumulation mechanism of multi-type unconventional oil and gas reservoirs in Northern China: Taking Hari Sag of the Yin’e Basin as an example
- TOC prediction of source rocks based on the convolutional neural network and logging curves – A case study of Pinghu Formation in Xihu Sag
- A method for fast detection of wind farms from remote sensing images using deep learning and geospatial analysis
- Spatial distribution and driving factors of karst rocky desertification in Southwest China based on GIS and geodetector
- Physicochemical and mineralogical composition studies of clays from Share and Tshonga areas, Northern Bida Basin, Nigeria: Implications for Geophagia
- Geochemical sedimentary records of eutrophication and environmental change in Chaohu Lake, East China
- Research progress of freeze–thaw rock using bibliometric analysis
- Mixed irrigation affects the composition and diversity of the soil bacterial community
- Examining the swelling potential of cohesive soils with high plasticity according to their index properties using GIS
- Geological genesis and identification of high-porosity and low-permeability sandstones in the Cretaceous Bashkirchik Formation, northern Tarim Basin
- Usability of PPGIS tools exemplified by geodiscussion – a tool for public participation in shaping public space
- Efficient development technology of Upper Paleozoic Lower Shihezi tight sandstone gas reservoir in northeastern Ordos Basin
- Assessment of soil resources of agricultural landscapes in Turkestan region of the Republic of Kazakhstan based on agrochemical indexes
- Evaluating the impact of DEM interpolation algorithms on relief index for soil resource management
- Petrogenetic relationship between plutonic and subvolcanic rocks in the Jurassic Shuikoushan complex, South China
- A novel workflow for shale lithology identification – A case study in the Gulong Depression, Songliao Basin, China
- Characteristics and main controlling factors of dolomite reservoirs in Fei-3 Member of Feixianguan Formation of Lower Triassic, Puguang area
- Impact of high-speed railway network on county-level accessibility and economic linkage in Jiangxi Province, China: A spatio-temporal data analysis
- Estimation model of wild fractional vegetation cover based on RGB vegetation index and its application
- Lithofacies, petrography, and geochemistry of the Lamphun oceanic plate stratigraphy: As a record of the subduction history of Paleo-Tethys in Chiang Mai-Chiang Rai Suture Zone of Thailand
- Structural features and tectonic activity of the Weihe Fault, central China
- Application of the wavelet transform and Hilbert–Huang transform in stratigraphic sequence division of Jurassic Shaximiao Formation in Southwest Sichuan Basin
- Structural detachment influences the shale gas preservation in the Wufeng-Longmaxi Formation, Northern Guizhou Province
- Distribution law of Chang 7 Member tight oil in the western Ordos Basin based on geological, logging and numerical simulation techniques
- Evaluation of alteration in the geothermal province west of Cappadocia, Türkiye: Mineralogical, petrographical, geochemical, and remote sensing data
- Numerical modeling of site response at large strains with simplified nonlinear models: Application to Lotung seismic array
- Quantitative characterization of granite failure intensity under dynamic disturbance from energy standpoint
- Characteristics of debris flow dynamics and prediction of the hazardous area in Bangou Village, Yanqing District, Beijing, China
- Rockfall mapping and susceptibility evaluation based on UAV high-resolution imagery and support vector machine method
- Statistical comparison analysis of different real-time kinematic methods for the development of photogrammetric products: CORS-RTK, CORS-RTK + PPK, RTK-DRTK2, and RTK + DRTK2 + GCP
- Hydrogeological mapping of fracture networks using earth observation data to improve rainfall–runoff modeling in arid mountains, Saudi Arabia
- Petrography and geochemistry of pegmatite and leucogranite of Ntega-Marangara area, Burundi, in relation to rare metal mineralisation
- Prediction of formation fracture pressure based on reinforcement learning and XGBoost
- Hazard zonation for potential earthquake-induced landslide in the eastern East Kunlun fault zone
- Monitoring water infiltration in multiple layers of sandstone coal mining model with cracks using ERT
- Study of the patterns of ice lake variation and the factors influencing these changes in the western Nyingchi area
- Productive conservation at the landslide prone area under the threat of rapid land cover changes
- Sedimentary processes and patterns in deposits corresponding to freshwater lake-facies of hyperpycnal flow – An experimental study based on flume depositional simulations
- Study on time-dependent injectability evaluation of mudstone considering the self-healing effect
- Detection of objects with diverse geometric shapes in GPR images using deep-learning methods
- Behavior of trace metals in sedimentary cores from marine and lacustrine environments in Algeria
- Spatiotemporal variation pattern and spatial coupling relationship between NDVI and LST in Mu Us Sandy Land
- Formation mechanism and oil-bearing properties of gravity flow sand body of Chang 63 sub-member of Yanchang Formation in Huaqing area, Ordos Basin
- Diagenesis of marine-continental transitional shale from the Upper Permian Longtan Formation in southern Sichuan Basin, China
- Vertical high-velocity structures and seismic activity in western Shandong Rise, China: Case study inspired by double-difference seismic tomography
- Spatial coupling relationship between metamorphic core complex and gold deposits: Constraints from geophysical electromagnetics
- Disparities in the geospatial allocation of public facilities from the perspective of living circles
- Research on spatial correlation structure of war heritage based on field theory. A case study of Jinzhai County, China
- Formation mechanisms of Qiaoba-Zhongdu Danxia landforms in southwestern Sichuan Province, China
- Magnetic data interpretation: Implication for structure and hydrocarbon potentiality at Delta Wadi Diit, Southeastern Egypt
- Deeply buried clastic rock diagenesis evolution mechanism of Dongdaohaizi sag in the center of Junggar fault basin, Northwest China
- Application of LS-RAPID to simulate the motion of two contrasting landslides triggered by earthquakes
- The new insight of tectonic setting in Sunda–Banda transition zone using tomography seismic. Case study: 7.1 M deep earthquake 29 August 2023
- The critical role of c and φ in ensuring stability: A study on rockfill dams
- Evidence of late quaternary activity of the Weining-Shuicheng Fault in Guizhou, China
- Extreme hydroclimatic events and response of vegetation in the eastern QTP since 10 ka
- Spatial–temporal effect of sea–land gradient on landscape pattern and ecological risk in the coastal zone: A case study of Dalian City
- Study on the influence mechanism of land use on carbon storage under multiple scenarios: A case study of Wenzhou
- A new method for identifying reservoir fluid properties based on well logging data: A case study from PL block of Bohai Bay Basin, North China
- Comparison between thermal models across the Middle Magdalena Valley, Eastern Cordillera, and Eastern Llanos basins in Colombia
- Mineralogical and elemental analysis of Kazakh coals from three mines: Preliminary insights from mode of occurrence to environmental impacts
- Chlorite-induced porosity evolution in multi-source tight sandstone reservoirs: A case study of the Shaximiao Formation in western Sichuan Basin
- Predicting stability factors for rotational failures in earth slopes and embankments using artificial intelligence techniques
- Origin of Late Cretaceous A-type granitoids in South China: Response to the rollback and retreat of the Paleo-Pacific plate
- Modification of dolomitization on reservoir spaces in reef–shoal complex: A case study of Permian Changxing Formation, Sichuan Basin, SW China
- Geological characteristics of the Daduhe gold belt, western Sichuan, China: Implications for exploration
- Rock physics model for deep coal-bed methane reservoir based on equivalent medium theory: A case study of Carboniferous-Permian in Eastern Ordos Basin
- Enhancing the total-field magnetic anomaly using the normalized source strength
- Shear wave velocity profiling of Riyadh City, Saudi Arabia, utilizing the multi-channel analysis of surface waves method
- Effect of coal facies on pore structure heterogeneity of coal measures: Quantitative characterization and comparative study
- Inversion method of organic matter content of different types of soils in black soil area based on hyperspectral indices
- Detection of seepage zones in artificial levees: A case study at the Körös River, Hungary
- Tight sandstone fluid detection technology based on multi-wave seismic data
- Characteristics and control techniques of soft rock tunnel lining cracks in high geo-stress environments: Case study of Wushaoling tunnel group
- Influence of pore structure characteristics on the Permian Shan-1 reservoir in Longdong, Southwest Ordos Basin, China
- Study on sedimentary model of Shanxi Formation – Lower Shihezi Formation in Da 17 well area of Daniudi gas field, Ordos Basin
- Multi-scenario territorial spatial simulation and dynamic changes: A case study of Jilin Province in China from 1985 to 2030
- Review Articles
- Major ascidian species with negative impacts on bivalve aquaculture: Current knowledge and future research aims
- Prediction and assessment of meteorological drought in southwest China using long short-term memory model
- Communication
- Essential questions in earth and geosciences according to large language models
- Erratum
- Erratum to “Random forest and artificial neural network-based tsunami forests classification using data fusion of Sentinel-2 and Airbus Vision-1 satellites: A case study of Garhi Chandan, Pakistan”
- Special Issue: Natural Resources and Environmental Risks: Towards a Sustainable Future - Part I
- Spatial-temporal and trend analysis of traffic accidents in AP Vojvodina (North Serbia)
- Exploring environmental awareness, knowledge, and safety: A comparative study among students in Montenegro and North Macedonia
- Determinants influencing tourists’ willingness to visit Türkiye – Impact of earthquake hazards on Serbian visitors’ preferences
- Application of remote sensing in monitoring land degradation: A case study of Stanari municipality (Bosnia and Herzegovina)
- Optimizing agricultural land use: A GIS-based assessment of suitability in the Sana River Basin, Bosnia and Herzegovina
- Assessing risk-prone areas in the Kratovska Reka catchment (North Macedonia) by integrating advanced geospatial analytics and flash flood potential index
- Analysis of the intensity of erosive processes and state of vegetation cover in the zone of influence of the Kolubara Mining Basin
- GIS-based spatial modeling of landslide susceptibility using BWM-LSI: A case study – city of Smederevo (Serbia)
- Geospatial modeling of wildfire susceptibility on a national scale in Montenegro: A comparative evaluation of F-AHP and FR methodologies
- Geosite assessment as the first step for the development of canyoning activities in North Montenegro
- Urban geoheritage and degradation risk assessment of the Sokograd fortress (Sokobanja, Eastern Serbia)
- Multi-hazard modeling of erosion and landslide susceptibility at the national scale in the example of North Macedonia
- Understanding seismic hazard resilience in Montenegro: A qualitative analysis of community preparedness and response capabilities
- Forest soil CO2 emission in Quercus robur level II monitoring site
- Characterization of glomalin proteins in soil: A potential indicator of erosion intensity
- Power of Terroir: Case study of Grašac at the Fruška Gora wine region (North Serbia)
- Special Issue: Geospatial and Environmental Dynamics - Part I
- Qualitative insights into cultural heritage protection in Serbia: Addressing legal and institutional gaps for disaster risk resilience