Impact of high-speed railway network on county-level accessibility and economic linkage in Jiangxi Province, China: A spatio-temporal data analysis
-
Lei Wu

 ,
Xiaodan Song
and
Feng Yin
,
Xiaodan Song
and
Feng Yin

Abstract
High-speed railway (HSR) networks have profoundly influenced interregional accessibility and economic linkages. This study examined 100 counties (cities) and districts in Jiangxi Province, using spatial and temporal data to measure weighted average travel time, daily accessibility, the accessibility coefficient, and the total and intensity of economic linkages. This study analyzed the impacts of operating a single HSR line versus an entire network. The findings revealed that (1) the HSR network has created a balanced spatial–temporal convergence effect, narrowing the gap between most locations and showing a clear “corridor effect”; (2) the network has strengthened economic connections among counties and has significantly enhanced overall economic output by creating two high-level economic linkage belts, formed around the Shanghai–Kunming and Beijing–Hong Kong HSRs; and (3) the network amplifies the “Siphon effect” and “Matthew effect,” further disadvantaging non-connected regions. Therefore, the province should promote a well-designed, HSR network, enhancing economic exchanges among counties and fostering a high-level economic belt characterized by diversity, complementary advantages, and coordinated development.
1 Introduction
China’s Medium- and Long-Term Railway Plan (National Development and Reform Commission, 2016) aims to build an advanced high-speed railway (HSR) network. The focus is on connecting provincial capitals and cities with populations exceeding 500,000 people. The goal is to create a transportation circle with travel times ranging between 1 and 4 h. The construction and operation of an extensive HSR network will significantly impact China’s urban and regional economy [1]. It will expedite the interaction of people, logistics, and capital flows along HSR, playing a crucial role in regional–economic integration [2]. The influence of HSR on inter-regional accessibility and economic linkages has consistently been a focal point of research in academia.
While the broader impacts of HSR are complex, ranging from environmental concerns to social changes, this study specifically focused on accessibility and economic linkage strength due to their key roles in regional–economic development and integration. Accessibility, as defined in this context, refers to the ease with which goods, services, and labor could move across regions, which was a direct outcome of improved transportation infrastructure [3]. Economic linkages, on the other hand, pertain to the strength and depth of economic relationships that were fostered by the enhanced connectivity provided by HSR [4]. These aspects are essential because they directly influence the economic vitality and growth potential of urban and rural areas alike, making them fundamental to assessing the true impact of HSR [5]. Consequently, understanding these elements provides valuable insights into the strategic advantages and potential drawbacks of HSR implementations.
In the initial phases, research on the regional accessibility and economic impacts of HSR concentrated on countries and regions where HSR was introduced earlier. The mainstream view among scholars is that HSR enhanced transportation along the routes and in surrounding areas, promoting local economic development [6,7]. The ongoing expansion of the HSR network is expected to stimulate growth across various sectors, fostering the establishment of a resilient regional–economic structure [8]. Nonetheless, some scholars contended that HSR may also bring negative effects to areas along the route [9,10], especially in areas far from the HSR station, where the benefits are limited [11].
Scholars used econometric models and geographic information system (GIS) techniques to analyze the impacts of HSR. Key indicators such as weighted average travel time (WATT), economic potential, and daily accessibility (DA) were applied to gauge the accessibility effects of this new infrastructure [12]. Advanced methodologies including structural equation modeling [13], multi-regional modeling [14], data envelopment analysis, and principal component analysis [15] were employed to assess and forecast the influence of HSR on regional economies and accessibility. Additionally, the impact of HSR construction was studied at various levels, including specific routes like Japan’s Tokyo–Osaka, France’s Paris–Lyon, and Germany’s Frankfurt–Cologne [16]; specific areas such as Manchester and its surrounding region in England, and Lille and its sub-region in France [17]; and at a national level, as seen between Spain and France [18].
In recent years, with the extensive construction of China’s HSR, an increasing number of scholars have directed their attention to the changes induced by HSR in China. They have employed diverse methods, perspectives, and viewpoints to analyze the influence of HSR on regional accessibility and economic linkages [19]. In terms of research subjects, some studies center on specific HSR lines, such as the Shanghai–Kunming HSR [20] and the Beijing–Shanghai HSR [21]. Other scholars concentrate on regional HSR networks, such as the Yangtze River Delta [22] and the Great Pearl River Delta [23]. In terms of research contents, this mainly involves the evolution of accessibility [24,25], patterns of accessibility and economic linkages [4,26], and changes in the structure of economic linkages, etc. [20,27]. In terms of research scales, emphasis is placed on macro- and meso-levels such as national [5,28], urban agglomeration [29,30], and provincial levels [25,31]. In terms of research methods, accessibility measures frequently rely on ArcGIS cost raster analysis [25], network analysis [32,33], and economic linkage measures are mainly based on gravitational force and its modified modeling [26,29,34].
As research advances, it has become evident that the impact of HSR construction varies across different city types in China. The introduction of HSR has not shown significant positive effects on small and medium-sized cities; instead, it has had a notable negative impact. The growth of these cities is often hindered by the siphoning effect of larger cities and the lack of attention to the development of infrastructure and services, known as the “soft environment,” in smaller urban areas [35,36]. Contrarily, some scholars posit that HSR has enhanced accessibility across all cities and regions, particularly benefiting small cities within western China’s urban clusters. These cities have experienced a more substantial decrease in rail travel times compared to other city types. Although HSR may lead to a notable decline in the resident population of small cities, it simultaneously presents an opportunity for these cities to overcome regional disadvantages and leverage the benefits of HSR more extensively and profoundly [37,38].
Although extensive research has analyzed the effects of HSR on regional accessibility and economic linkages at various spatial scales, studies that specifically focus on HSR accessibility across all counties within a single province are still limited. The study of HSR accessibility in Jiangxi Province, a key transportation hub in central China and the only province where the Shanghai–Kunming and Beijing–Hong Kong high-speed rail routes intersect, holds significant representational and referential value. Research has shown that the HSR network in Jiangxi Province has significantly enhanced inter-city connectivity and supported balanced economic development [39]. These findings are consistent with Spanish–French [6] and Korean [7] HSR studies, demonstrating similar benefits of HSR networks across diverse economic contexts. Furthermore, the GIS analysis methods and accessibility models applied in the Jiangxi study [40] offer technical frameworks and tools adaptable to HSR network studies in other regions. This enhances the theoretical foundation for HSR construction and provides practical support for policymakers, fostering coordinated transportation and economic development, particularly at the county level. Such studies enhance our understanding of HSR’s complex impacts on various regions and inform global optimization of HSR networks.
In summary, while there have been more extensive and systematic studies on the impact of HSR on regional accessibility and economic links, several shortcomings persist that this study aims to address:
Distinct impacts analysis: Existing research often focuses merely on the presence or absence of HSR, generally lacking detailed comparisons between individual HSR lines and the broader network’s integrated effects. This study undertakes a comparative analysis of the single HSR period and multiple HSR periods within Jiangxi, examining their interconnected impacts rather than viewing them in isolation. This approach provides a detailed understanding of how a single HSR line and a comprehensive HSR network distinctly affect regional accessibility and economic linkages.
Micro-level focus: Previous studies typically operate on macro- and meso-levels, with scarce attention to micro-level details. In contrast, our research drills down to the micro-scale by concentrating on 100 counties in Jiangxi, providing an in-depth view of how HSR influences smaller administrative regions. This micro-level focus allows for a comprehensive investigation of the specific impacts across 100 counties in Jiangxi Province, highlighting localized patterns and discrepancies.
Methodological enhancement: Standard methodologies in the field commonly employ cost raster and network analysis to calculate accessibility; these often result in substantial deviations from actual travel experiences. This study enhances methodological precision by integrating door-to-door HSR travel times acquired from open map application programming interface (API) and the China Railway 12306 website. This precise measurement allows for a more accurate representation of accessibility, providing a clearer picture of the actual benefits and challenges brought by HSR.
Advanced data utilization: Traditional studies frequently rely on gross domestic product (GDP) and end-of-year population statistics, which may not accurately reflect current conditions. This research addresses this by utilizing up-to-date, high-resolution spatial data to provide a more accurate and timely analysis. By employing night lighting data and LandScan population data, we overcome the limitations of traditional statistics, ensuring our findings are grounded in the most current and comprehensive data available.
These methodologies and detailed analyses offer a practical perspective on the effects of HSR on regional dynamics. This approach aims to understand both the broader economic and accessibility impacts as well as the specific variations within the HSR network’s influence.
In view of this, this study focuses on 100 counties (including urban districts and county-level cities) in Jiangxi Province, China, as the research subject (Table A1). It computes various metrics, such as the WATT, DA, accessibility coefficient (AC), economic linkage intensity (ELI), and total amount of economic linkage (TAEL). These calculations are based on door-to-door HSR travel time acquired from the open map API and the China Railway 12306 website, as well as night lighting data and LandScan population data. Ultimately, this article compares the spatial and temporal evolution of inter-county accessibility and economic linkage patterns post the operation of a single HSR line (2015) with the completion of the HSR network (2022).
This study is structured as follows. Section 2 describes the data and methodology adopted. It begins with an overview of the study area. This is followed by a description of the temporal and spatial data processing procedures, along with an illustration of the methodologies employed. Section 3 examines the similarities and differences in the impact on county accessibility and inter-county economic linkages before and after the construction of the HSR network in Jiangxi Province. Section 4 offers recommendations concerning both the planning for the construction of the HSR network and regional–economic integration. Section 5 identifies the shortcomings of this study and suggests future research directions by reviewing the latest advancements in related studies.
2 Data and methodology
2.1 Study area
Situated in southeastern China, Jiangxi Province is positioned on the south bank of the middle and lower reaches of the Yangtze River. It shares borders with the Guangdong–Hong Kong–Macao Greater Bay Area, the Yangtze River Delta Economic Zone, and the West Coast Economic Zone, providing a distinctive location advantage. Furthermore, it plays an important role as a transportation hub in China’s central region. According to the data released by the National Bureau of Statistics of China, the GDP growth rate of Jiangxi Province in 2022 was 4.7% as the fastest growing province in China. Based on the statistics of the website (www.sohu.com), as of the end of 2022, the mileage of HSR in Jiangxi Province was 2,094 kilometers, which ranked the seventh in the country, among which the operating mileage of 350 km speed HSR was nearly 1,300 kilometers, which was high and ranked the third in the country. But there was no HSR line in the province 8 years ago. It is worth paying attention to whether there is a close correlation between the rapid economic growth of Jiangxi Province and the convenient HSR network.
The first HSR line, with a design speed of 350 km per hour, known as the Jiangxi section of the Shanghai–Kunming High-Speed Railway (referred to as Jiangxi Section SH-KM HSR), commenced operation in September 2014. Subsequently, the Hefei–Fuzhou HSR, Wuhan–Jiujiang HSR, and Nanchang–Ji’an–Ganzhou HSR were sequentially opened within the region. The Jiangxi Section of the Beijing–Hong Kong High-Speed Railway (referred to as Jiangxi Section BJ-HK HSR) was inaugurated in December 2021, achieving seamless connectivity of HSRs along both vertical and horizontal axes in Jiangxi Province.
This configuration forms a “Big Cross” type HSR network (Figure 1). By the end of 2022, the province had 39 HSR stations, 5 HSR lines, and 5 Intercity Railway lines. The HSR network, with a speed of 200 kilometers per hour and above, spans 2,094 kilometers, ranking at the forefront among the central provinces of China. This convenient HSR network has significantly bolstered transportation accessibility and spurred the economic development of counties.
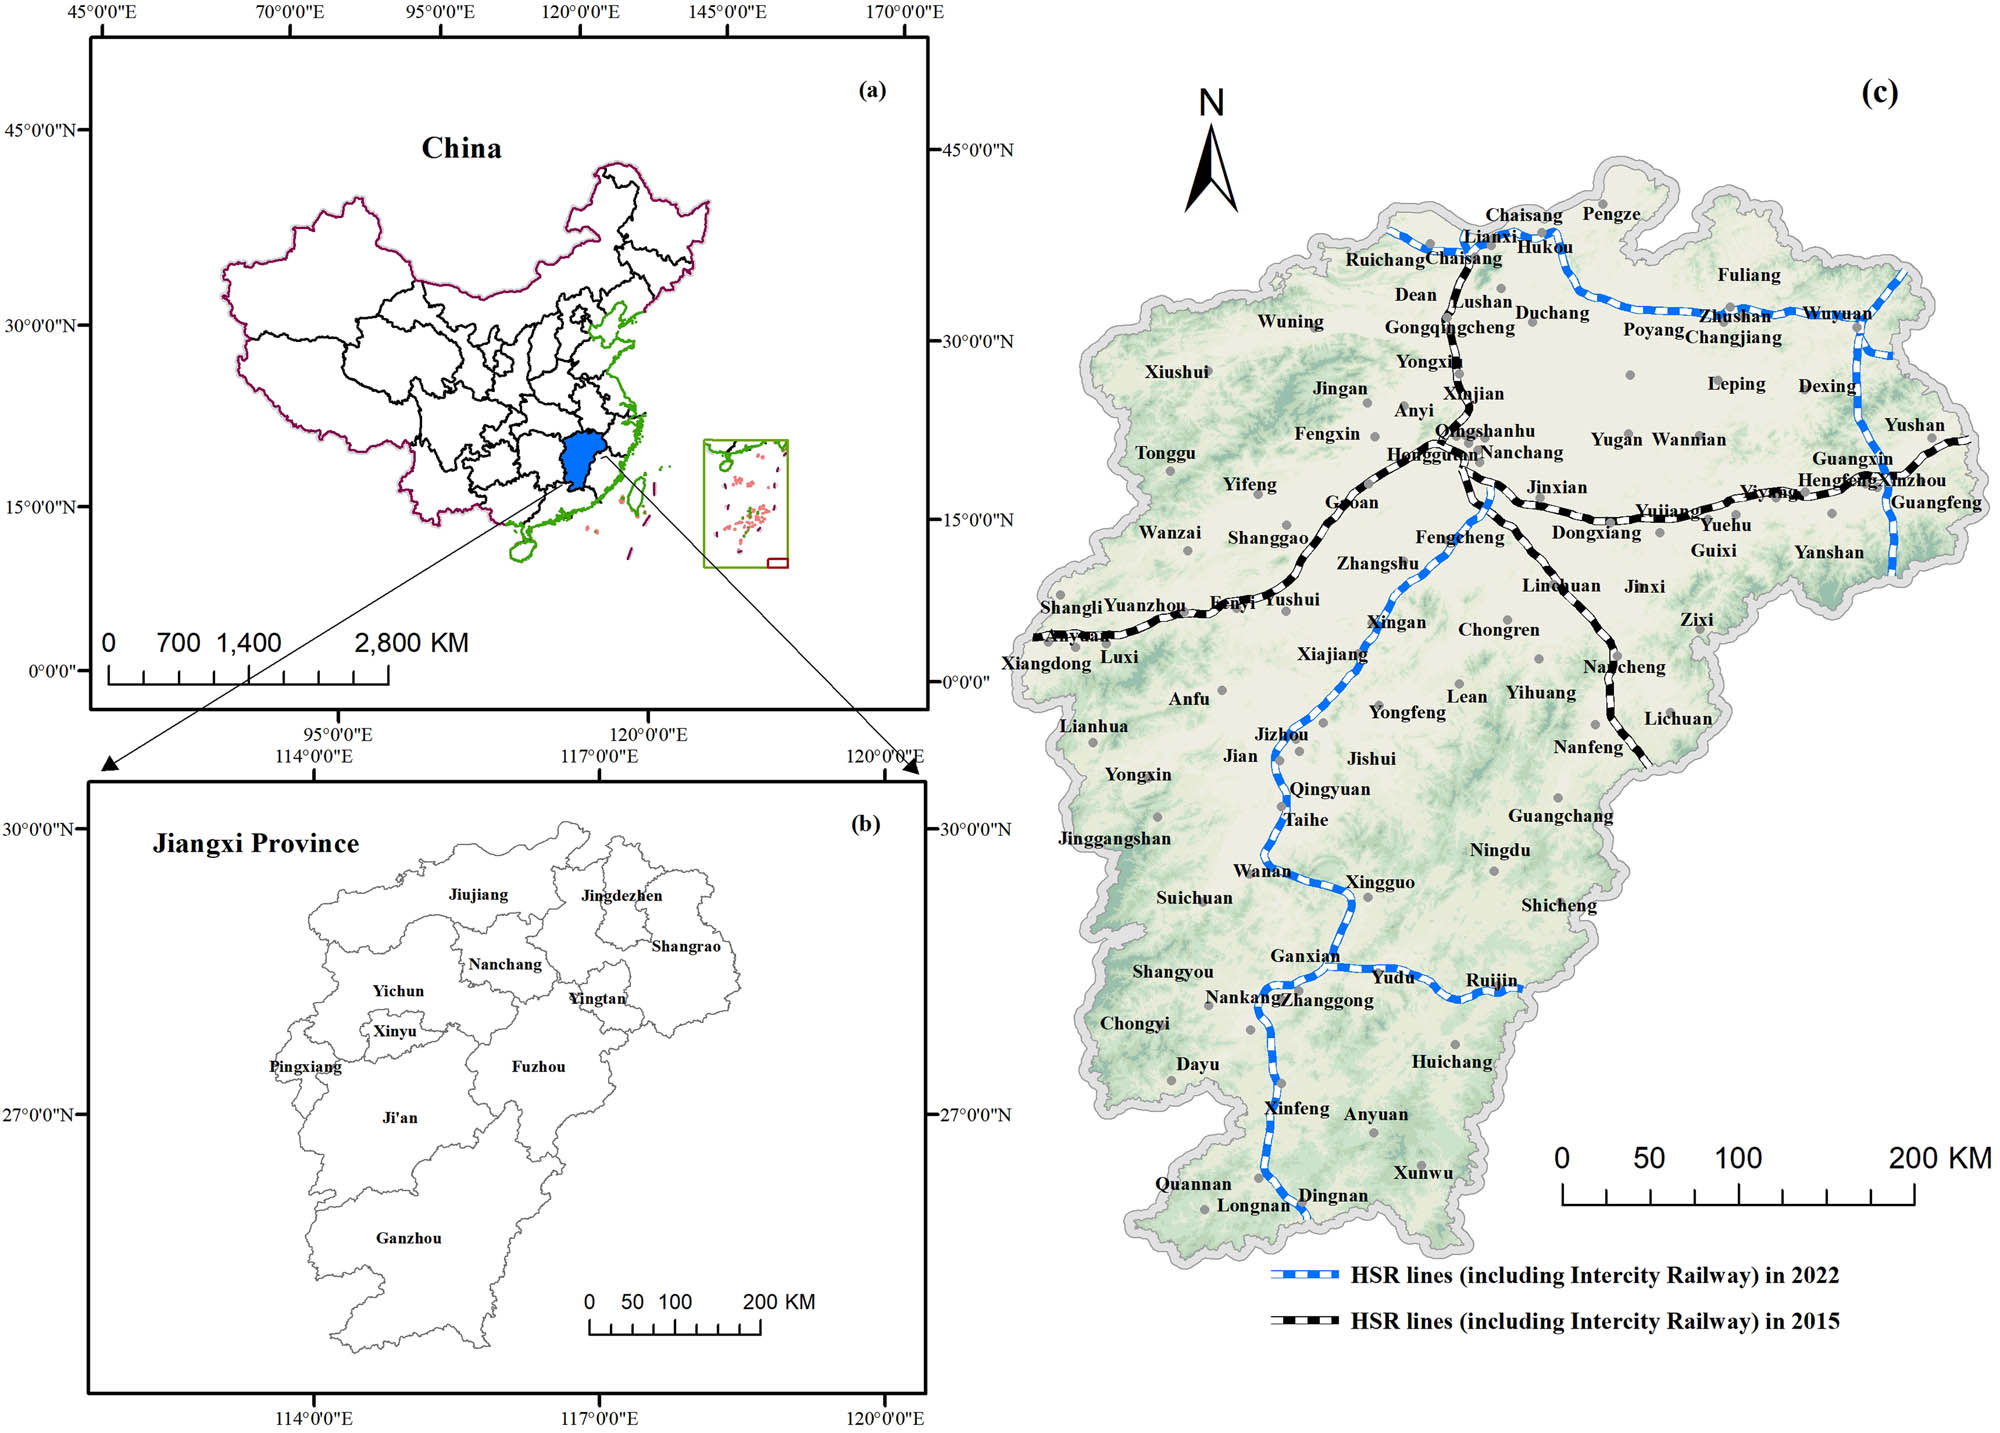
HSR network of Jiangxi Province. (a) Location of Jiangxi Province within China, (b) Administrative map of Jiangxi Province, and (c) HSR network within Jiangxi Province in 2015 and 2022.
2.2 Data sources and processing
This study focuses on the years 2015 and 2022 to analyze the difference impact between the HSR single line and HSR network on accessibility and economic linkages among counties in Jiangxi Province. In September 2014, the “Horizontal Axis” of Jiangxi’s HSR network, the Jiangxi Section SH-KM HSR, commenced operation. Relevant data from 1 year after the line’s operation were selected for analysis due to the delayed influence of HSR on the economy [41,42]. The Jiangxi Section BJ-HK HSR, representing the “Vertical Axis” of Jiangxi’s HSR network, was inaugurated in December 2021, and data from 1 year after its operation will be utilized for the same reason.
2.2.1 Spatial data sources and processing
Figure 2 provides an overview of this study’s spatial data sources and processing. The economic-level data in this study utilize nighttime lighting data, a substitute for traditional GDP statistics that scholars have used to analyze the relationship between HSR and economic development [43,44], aiming to mitigate GDP measurement errors. The nighttime lighting data for this article are derived from the corrected China-wide class DMSP-OLS data [45]. The data underwent processing, involving calibration using the “Pseudo-invariant Pixel” method. The temporal resolution consistency between DMSP-OLS data and SNPP-VIIRS data was considered. Missing data in the original monthly SNPP-VIIRS data were addressed before synthesizing the annual SNPP-VIIRS data. Additionally, the calibrated DMSP-OLS data (1992–2013) and the class DMSP-OLS data (2013–2022) converted from SNPP-VIIRS data were combined to calculate the enhanced class DMSP-OLS dataset (1992–2022).
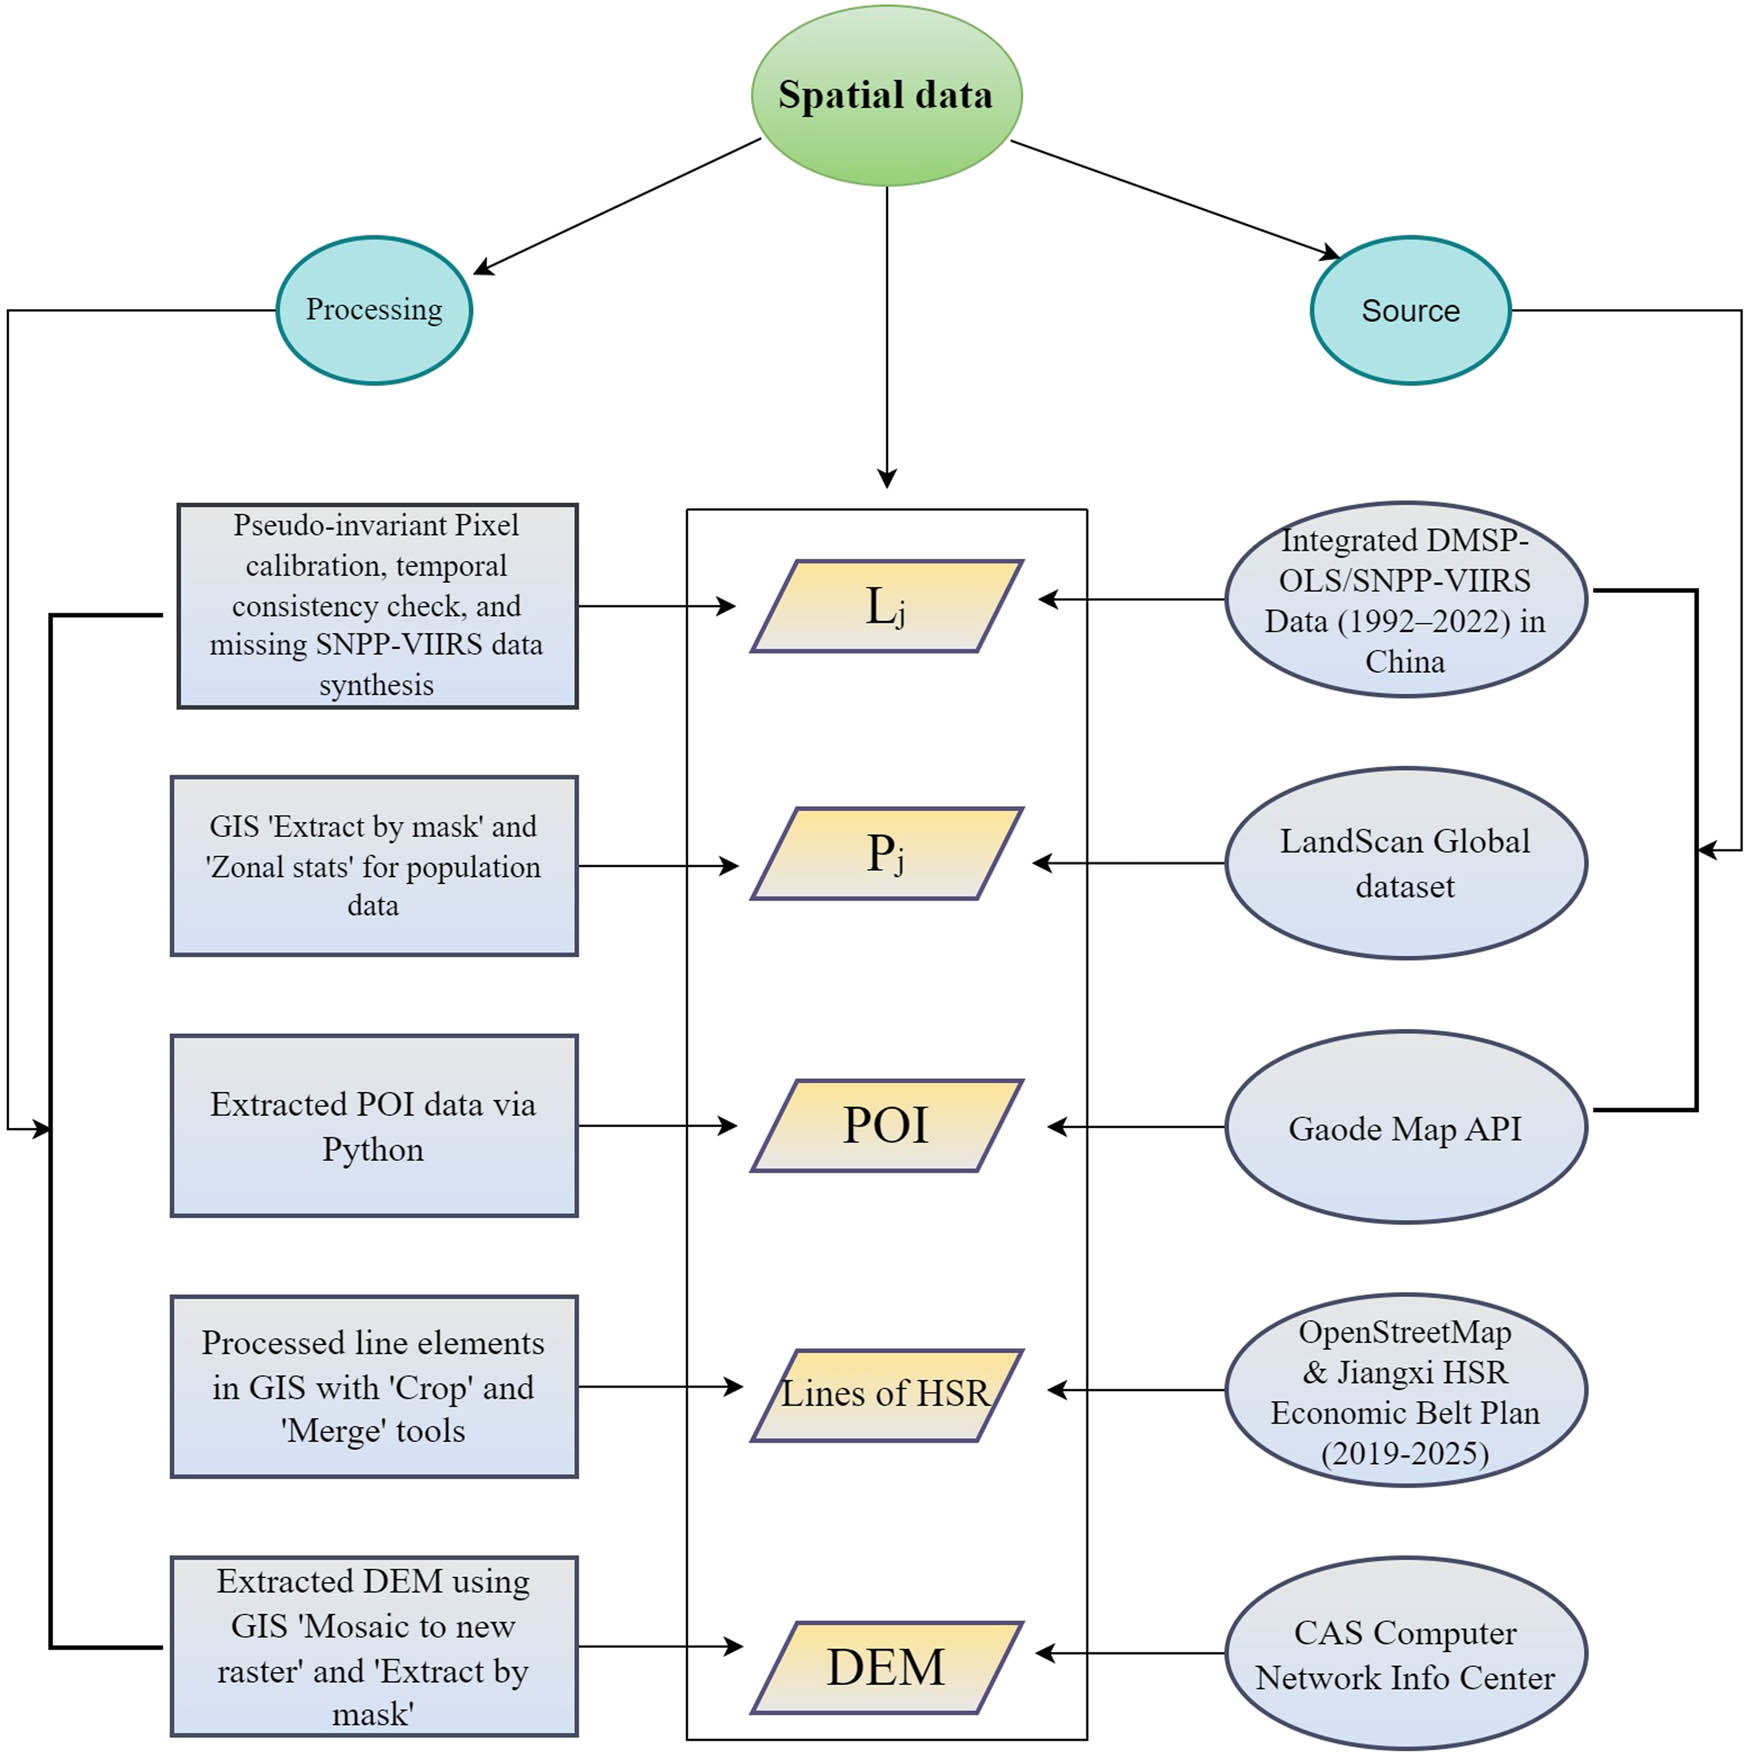
Spatial data sources and processing.
Similarly, some scholars are employing LandScan data as an alternative to traditional population data [46]. The population data for this article is sourced from the LandScan Global dataset, developed by the U.S. Department of Energy’s Oak Ridge National Laboratory, accessible on the LandScan website (https://landscan.ornl.gov, accessed on July 20th, 2023). The downloaded file (landscan-global-2022.tif) is utilized to extract the population within Jiangxi Province through the “extract-by-mask” function of ArcGIS 10.8 spatial analysis tools. Subsequently, the population distribution of the 100 counties in Jiangxi Province is extracted using the “zonal-statistics-as-table” method.
Point-of-interest data, including county governments and HSR stations, were scraped using Python from the Gaode Map API (https://lbs.amap.com/). HSR lines data were obtained from the official website of OpenStreetMap (www.openstreetmap.org, accessed on January 5th, 2023), and the Development Plan of the High-speed Railway Economic Belt in Jiangxi Province, China (2019–2025). Digital elevation model data originate from the Geospatial Data Cloud website developed by the Computer Network Information Center of the Chinese Academy of Sciences (www.gscloud.cn).
2.2.2 Temporal data sources and processing
Figure 3 shows an overview of this study’s temporal data sources and processing. This article utilizes the Baidu Map API (https://lbsyun.baidu.com) via Python to calculate the shortest travel time between the origin and destination. The process involves systematically extracting driving distance and duration data for various county pairs. HSR is most effective for medium- to long-distance travel (200–800 km) [19]. Journeys under 200 km are typically better served by traditional road travel due to its common and convenient nature, while air transportation is preferred for distances exceeding 800 km [47,48]. Within the 200–800 km range (noting that no inter-county distances in Jiangxi Province exceed 800 km), this research dictates the use of door-to-door HSR travel time as the shortest travel time metric. For distances less than 200 km, the driving duration is considered the shortest travel time metric. It is crucial to emphasize that this study primarily focuses on assessing the impacts of the HSR network, intentionally neglecting changes in the road network from 2015 to 2022.
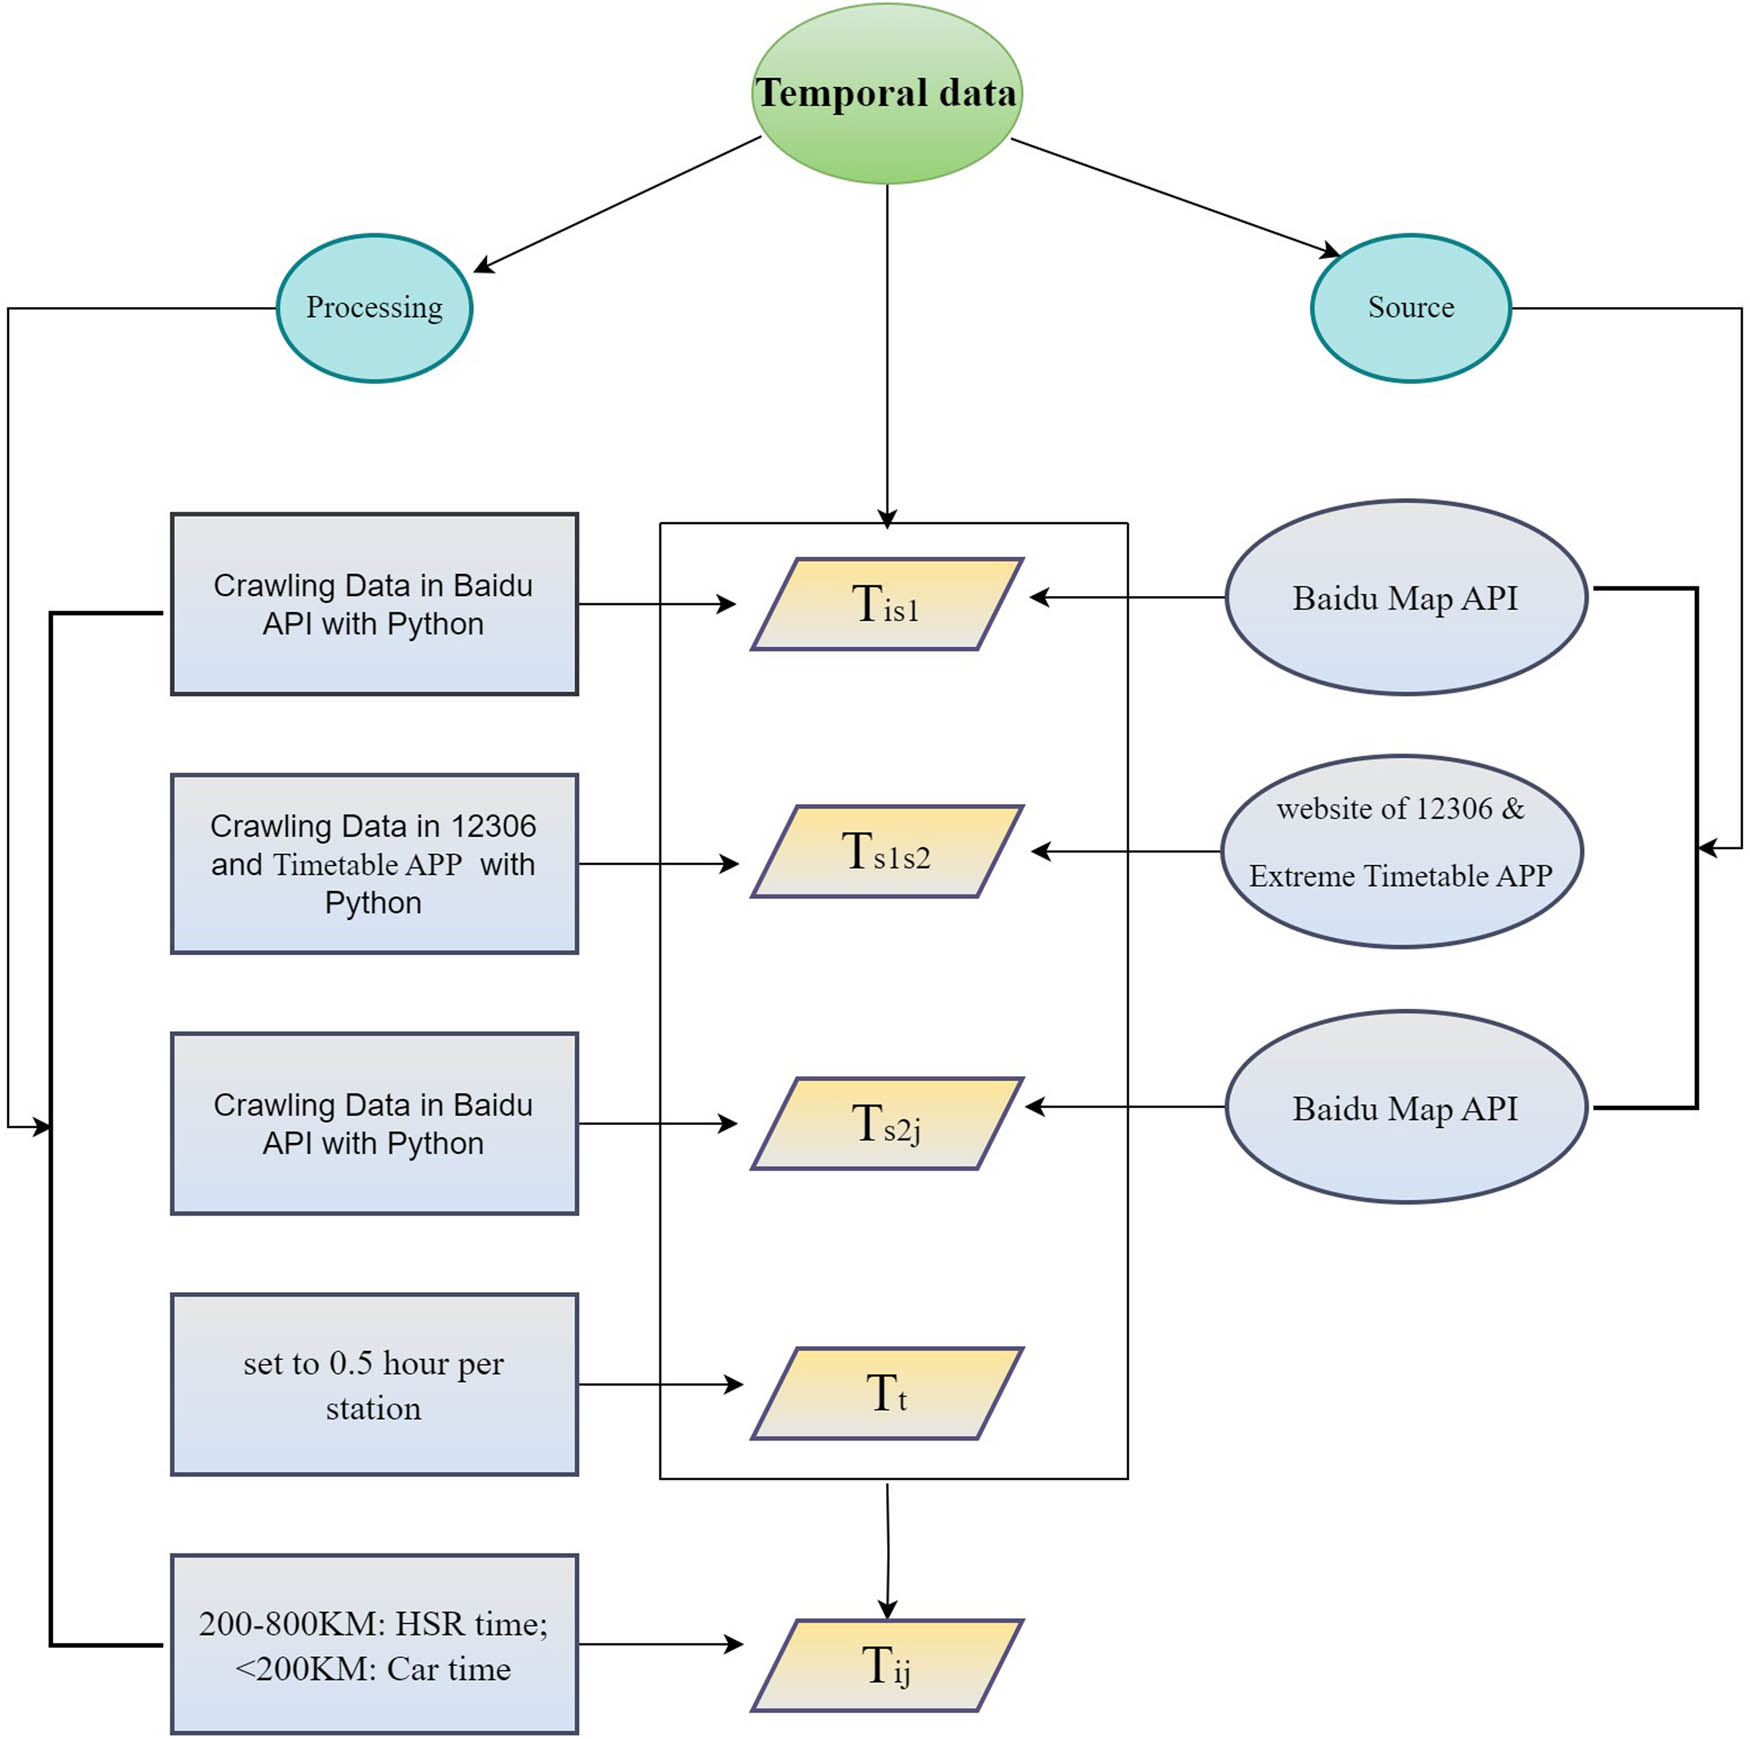
Temporal data sources and processing.
The time from the origin to the nearest HSR station and from the destination to the nearest HSR station is determined using the Baidu Map API. The duration from the initial HSR station to the destination HSR station is obtained from the China Railway official website (www.12306.cn/index/) and the Extreme Timetable APP (version June 2015). In cases where direct HSR trains operate between the two stations, the shortest time of G, D, and C trains will be considered. In the absence of direct HSR trains, the shortest time for HSR transfers will be selected. If there are no direct HSR or HSR transfer options, then ordinary trains starting with Z, T, K, L, and Y will be considered for both direct and transfer options. The data query time periods are 9:00–11:00 and 14:00–16:00 from December 5–25, 2022, to avoid morning and evening peaks.
2.3 Methodology
2.3.1 Door-to-door HSR travel time
Travel time in previous studies often failed to completely reflect all the time consumed during a trip, and the proportion of time spent outside the railroad system in HSR travel was even higher. Therefore, this study adopts the door-to-door approach, initially developed by Salonen and Toivonen [49], to estimate travel time at every stage of a journey. The approach considers the county government as the point of origin and destination, using door-to-door HSR travel time to calculate the shortest time for HSR transportation between the origin and destination, as referenced in the relevant literature [25,50]. This approach results in a 100 × 100 origin–destination HSR travel matrix, and the specific formulas are as follows:
where
2.3.2 WATT
WATT is the weighted average of the shortest travel time from origin to destination, mainly reflecting the difficulty of interconnecting and interacting between origin county and destination county. It primarily measures the level of regional accessibility from the perspective of time cost. This indicator is typically weighted by the local economic level (GDP) and population [26,51]. In this study, nighttime light data and LandScan population data are used to replace traditional statistics, given the authenticity and accuracy of GDP and population data published by government departments. The following formulas are applied:
where
2.3.3 DA
DA indicates the scale of economic activities or population size that can be reached by a location within a specified limited time. The 3 h traffic circle method is a common approach for DA analysis [25,52]. In this study, 3 h is chosen as the time threshold to calculate the population size covered by the 3 h traffic circle of each county’s external connection. The specific formula is as follows:
where
2.3.4 AC
The AC, calculated as the ratio of a county’s accessibility value to the regional average level of the counties, offers a more intuitive comparison of the accessibility levels among counties [53]. The specific formula is as follows:
where
2.3.5 External economic linkages
The gravity model is a commonly used method for measuring the intensity of economic linkages between locations in a region [54,55,56]. This article modifies the gravity model by incorporating the shortest travel time between counties, calculates the strength of economic linkages between counties, and characterizes the economic role status of counties in the region based on the total volume of their external economic linkages.
where
3 Results and analysis
3.1 Impact of HSR network on county accessibility
3.1.1 WATT analysis
Following the establishment of the Jiangxi HSR “big cross” network, the WATT for each county significantly improved. The average value decreased from 4.76 h in 2015 to 3.41 h in 2022, representing a change rate of 28.36%. In 2015, there were 41 counties defined as having superior accessibility (referring to the relevant literature and considering the actual situation of Jiangxi Province, locations with an
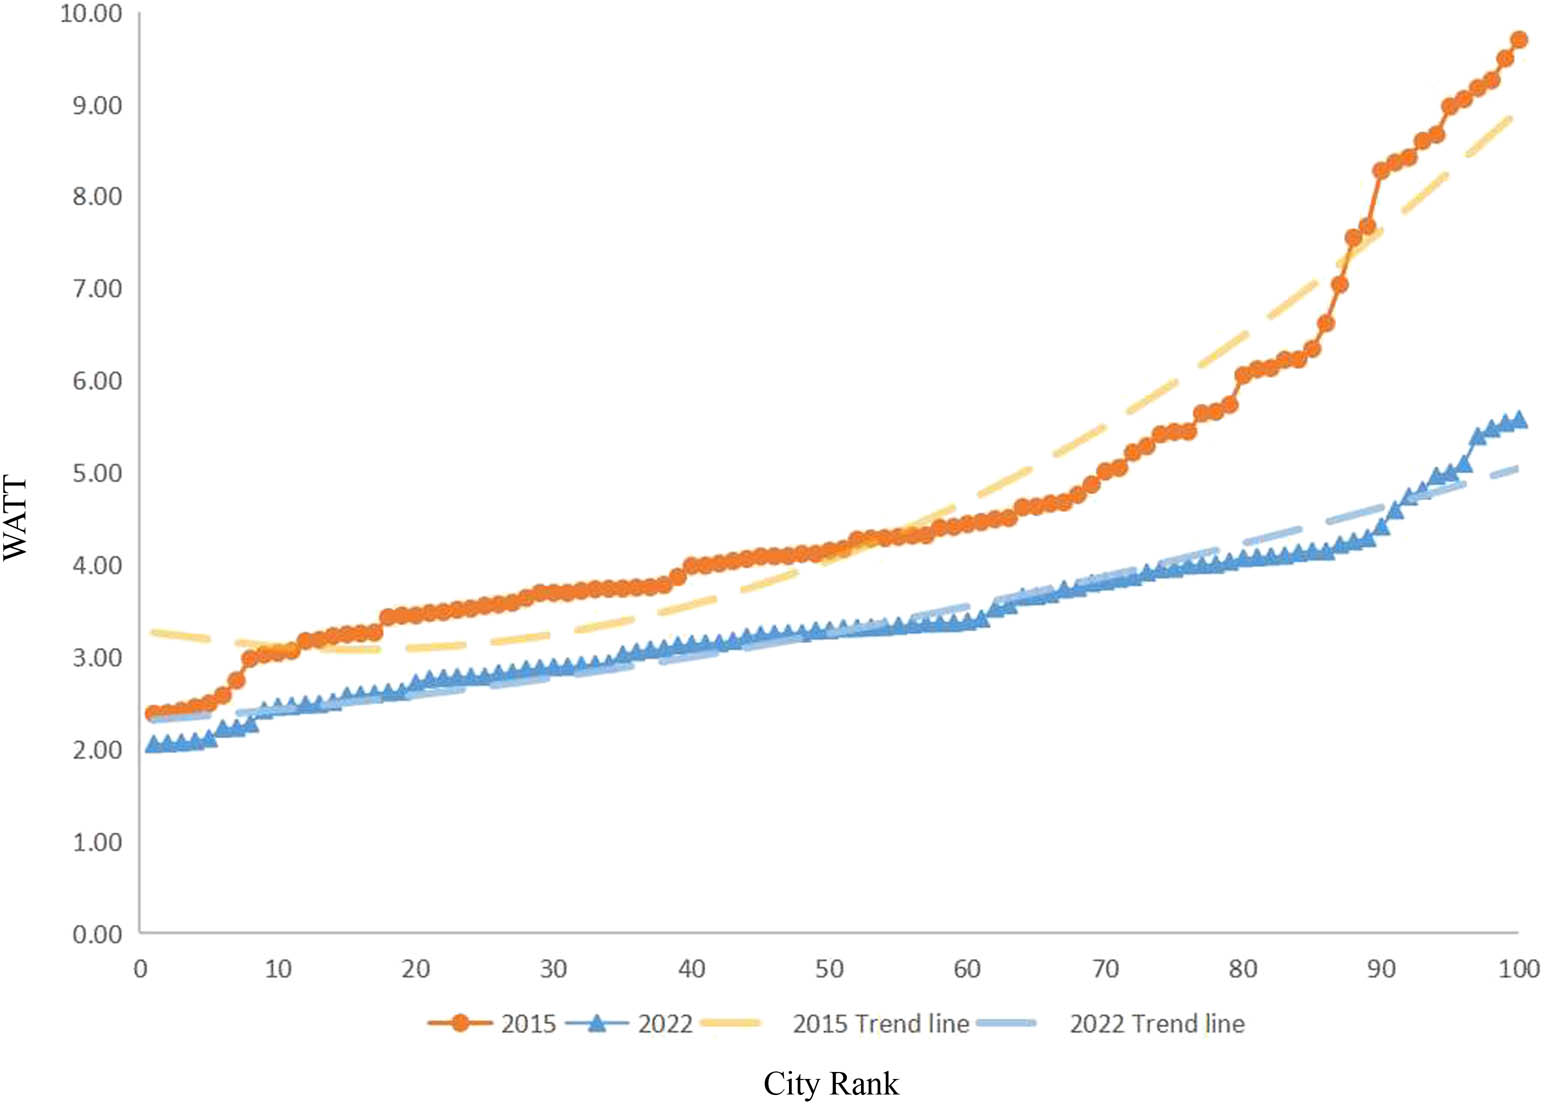
Rank-size distribution of WATT for counties of Jiangxi Province in 2015 and 2022.
In 2015–2022, the distribution of changes in high-accessibility areas (lower
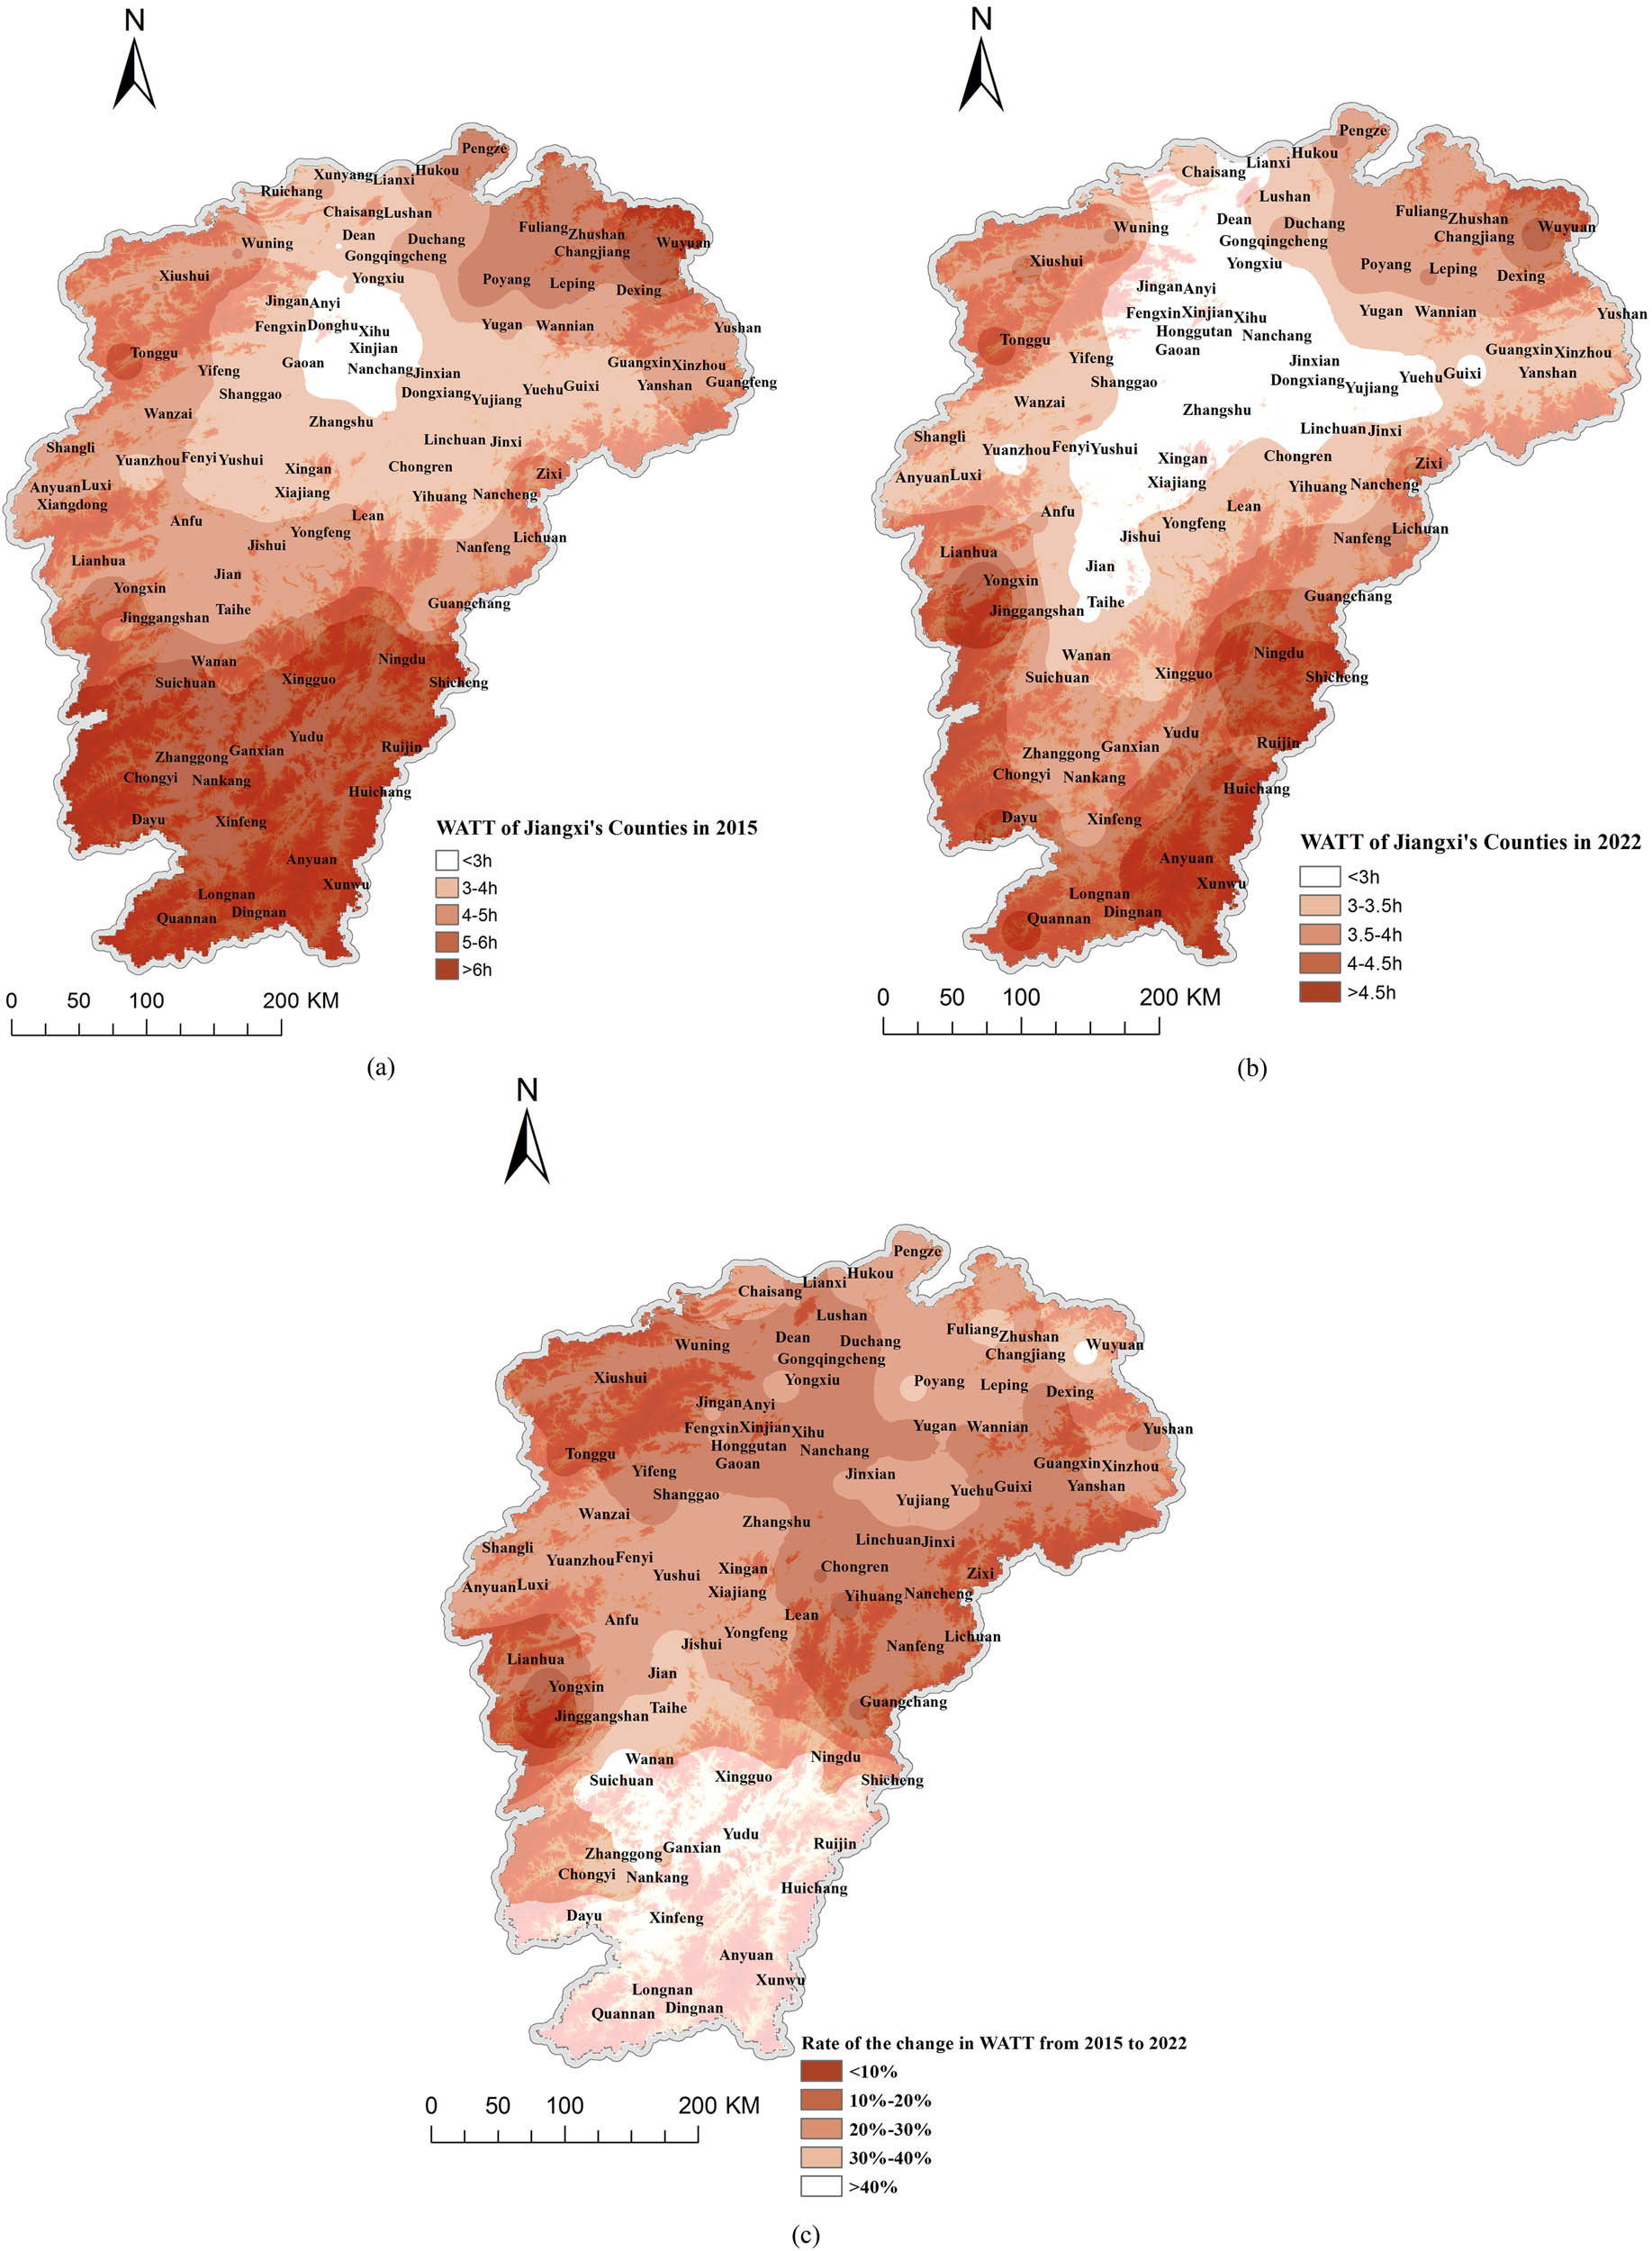
WATT of Jiangxi’s Counties, China, from 2015 to 2022: (a) WATT in 2015, (b) WATT in 2022, and (c) rate of the change in WATT from 2015 to 2022.
After the completion of the HSR network in Jiangxi in 2022, the spatial pattern of accessibility still exhibits a “core–edge” structure (Figure 5b), with minimal changes in the top and bottom 10 counties of accessibility values. However, the high-accessibility area extends both horizontally and vertically, demonstrating clear traffic directionality. According to Figure 5c, the HSR network brings the most significant improvement in accessibility to the edge areas. Sixteen counties in the south of Jiangxi exhibited a change in accessibility of more than 40% (with an average change of 24.82%), and Poyang County (32.86%), Fuliang County (33.87%), and Wuyuan County (42.75%) in the northeast of Jiangxi experienced a change of more than 30%.
The change in the WATT of Jiangxi counties is closely synchronized with the construction of the HSR. The opening of the Jiangxi Section BJ-HK HSR has significantly improved the accessibility of the central and southern regions of Jiangxi, leading to a pronounced “spatio-temporal convergence” effect. Although the overall spatial pattern has altered, it continues to exhibit the typical “core–edge” distribution. This is primarily due to the evident location advantages of the core circle, superior transportation infrastructure, and a high degree of connectivity between counties. However, the development of edge areas is still constrained by factors such as geography and economic foundation.
3.1.2 DA analysis of the central urban district
The DA of the central urban district indicated the proximity of the district to the surrounding areas and was typically characterized by a 3 h traffic circle to illustrate the radiating capacity of the central city [57,58]. This study focused on districts in 11 prefecture-level cities in Jiangxi, selecting the most populous districts from each city (central urban districts were selected as the representative units for this study because they typically serve as the political, economic, and transportation hubs of counties, directly influencing the overall accessibility and economic connections of the area). Qingshanhu District in Nanchang, Zhanggong District in Ganzhou, Xunyang District in Jiujiang, Zhushan District in Jingdezhen, Jizhou District in Ji’an City, Guangfeng District in Shangrao, Linchuan District in Fuzhou, Anyuan District in Pingxiang, Yujiang District in Yingtan, Yuanzhou District in Yichun, and Yushui District in Xinyu were selected. The number of 3 h reachable locations and the DA index were employed to analyze changes in the coverage of these 11 central urban districts.
Table 1 shows that the number of 3 h reachable locations in 11 urban districts was 453 in 2015, constituting 41.59% of the total locations (1,089). By 2022, the number had increased to 533, representing 48.94% of the total locations. In 2015, the top two districts with the highest number of reachable locations were Qingshanhu District (63) and Linchuan District (62), both part of the accessibility core area. In 2022, Qingshanhu District (71) and Jizhou District (59) took the lead, aligning with the vertical extension characteristics of high-accessibility zones. The most significant rate changes occurred in Jizhou District (78.79%), Zhanggong District (52.38%), and Xunyang District (46.88%), closely tied to the operation of the Jiangxi Section BJ-HK HSR and the Wuhan–Jiujiang HSR. (The decrease in the number of 3 h daily reachable locations in Linchuan District in 2022 is primarily attributed to the newly constructed Fuzhou East Station being approximately 51 km away from Linchuan District government, resulting in a driving time of about 1.2 h.)
Changes in the number of 3 h accessible locations and DA index in the central urban district
| District | Number of 3 h accessible locations | 3 h DA index (10,000 persons) | ||||
|---|---|---|---|---|---|---|
| Year | 2015 | 2022 | Rate of change (%) | 2015 | 2022 | Rate of change (%) |
| Qingshanhu District | 63 | 71 | 12.70 | 2960.55 | 3414.06 | 15.32 |
| Zhanggong District | 21 | 32 | 52.38 | 965.00 | 1591.78 | 64.95 |
| Xunyang District | 32 | 47 | 46.88 | 1562.11 | 2356.14 | 50.83 |
| Zhushan District | 33 | 36 | 9.09 | 1536.72 | 1746.23 | 13.63 |
| Jizhou District | 33 | 59 | 78.79 | 1672.90 | 2919.51 | 74.52 |
| Guangfeng District | 34 | 37 | 8.82 | 1786.57 | 1807.49 | 1.17 |
| Linchuan District | 62 | 55 | −11.29 | 2850.50 | 2559.73 | −10.20 |
| Anyuan District | 32 | 37 | 15.63 | 1545.86 | 1852.70 | 19.85 |
| Yujiang District | 44 | 50 | 13.64 | 2194.61 | 2545.25 | 15.98 |
| Yuanzhou District | 50 | 56 | 12.00 | 2328.17 | 2598.77 | 11.62 |
| Yushui District | 49 | 53 | 8.16 | 2270.34 | 2517.48 | 10.89 |
| Total | 453 | 533 | 21673.33 | 25909.14 | ||
| Standard deviation | 13.48 | 11.97 | 607.56 | 557.62 | ||
The trend in the 3 h DA index aligned with the change of 3 h reachable locations, and in 2015, only two districts had a radiation index exceeding 25 million people: Qingshanhu District (29,605,500) and Linchuan District (28,550,000). In 2022, new additions included Jizhou District (29,195,100), Yujiang District (25,452,500), Yuanzhou District (25,987,700), and Yushui District (25,174,800). This indicated that central urban districts with high radiation indices exhibited a spatial shift from a “dual core” to “multiple cores,” establishing closer connections with the surrounding districts. The index change rate in the south-central region of Jiangxi exceeded 60%, emphasizing the significant role of the HSR network in enhancing the radiation capacity of edge areas. Simultaneously, traditional core areas, like Qingshanhu District, witnessed strengthened capacity, with its 3 h DA index surpassing 30 million people. The changes in standard deviation in Table 1 revealed that the HSR network construction had progressively reduced the gap in DA indices among central urban districts, enhancing the development potential of other urban districts and optimizing the overall development pattern in Jiangxi Province.
3.1.3 Analysis of AC
Following the establishment of the HSR network, the overall AC of Jiangxi counties tended to be balanced. In 2015, there were 68 counties with AC less than 1, with 38 of them exhibiting better accessibility (coefficients less than 0.8), primarily concentrated along the Jiangxi Section SH-KM HSR. In contrast, 15 counties in the southern and northeastern edge areas of Jiangxi Province had poor accessibility (coefficients greater than 1.4). In 2022, the number of counties with AC less than 1 decreased to 61, with 20 counties exhibiting better accessibility, and the number of counties with poor accessibility dropped to 7. This suggested that the accessibility gap between Jiangxi counties had diminished with the HSR connecting the province. The relative transportation advantage in traditional core areas weakened, while accessibility in the edge areas improved significantly.
Table 2 reveals that the top 10 counties by AC remained unchanged, all of which were Nanchang and Jiujiang counties and districts (cities) with earlier HSR station openings, situated along the routes of the Jiangxi Section SH-KM HSR and Nanchang–Jiujiang Intercity Railway. The bottom 10 AC in 2015 were all counties and districts (cities) belonging to Ganzhou, which was attributed to the absence of HSR line in Ganzhou at that time. However, Leping City lacked an HSR station, and the closest one, Jingdezhen North Station, was located 63 kilometers away. Jinggangshan City had an HSR station, but it lacked a main HSR line, only serving as a connection point for a liaison line. Moreover, it operated trains at a speed of 160 kilometers per hour with limited frequency. Yongxin County did not have any HSR stations, and the closest HSR station, Jinggangshan Station, was situated 46 kilometers away. It can be seen that the HSR mainline and HSR stations were important factors that swayed the location AC.
Top ten and bottom ten Counties in AC Index for 2015 and 2022
| 2015 | 2022 | |
|---|---|---|
| Top ten AC | Xihu District (0.49) | Xihu District (0.60) |
| Honggutan District (0.50) | Qingyunpu District (0.60) | |
| Xinjian District (0.50) | Xinjian District (0.60) | |
| Qingyunpu District (0.51) | Honggutan (0.61) | |
| Donghu District (0.52) | Donghu District (0.62) | |
| Qingshanhu District (0.54) | Nanchang County (0.64) | |
| Nanchang County (0.57) | Qingshanhu District (0.65) | |
| De’an County (0.62) | Yongxiu County (0.66) | |
| Yongxiu County (0.63) | Gongqingcheng City (0.70) | |
| Gongqingcheng City (0.63) | De’an County (0.71) | |
| Bottom ten AC | Dingnan County (1.74) | Quannan County (1.33) |
| Ruijin City (1.75) | Wuyuan County (1.38) | |
| Longnan City (1.79) | Dayu County (1.40) | |
| Dayu County (1.80) | Huichang County (1.44) | |
| Huichang County (1.87) | Jinggangshan City (1.45) | |
| Quannan County (1.88) | Anyuan County (1.48) | |
| Anyuan County (1.91) | Ningdu County (1.57) | |
| Ningdu County (1.92) | Shicheng County (1.59) | |
| Shicheng County (1.97) | Xunwu County (1.61) | |
| Xunwu County (2.02) | Yongxin County (1.62) | |
| Range | 1.52 | 1.02 |
| Standard deviation | 0.68 | 0.44 |
In 2022, the mean value of the top ten locations’ AC (0.64) had increased by 16% compared to the mean value in 2015 (0.55), suggesting a weakening advantage in transportation-convenient regions. Meanwhile, the mean value of the bottom ten locations’ AC in 2022 (1.49) had decreased by 25% compared to the mean value in 2015 (1.86), indicating a reduction in the disadvantage of transportation-lagging regions. The range of the AC in 2015 and 2022 was 1.52 and 1.02, respectively, narrowing the gap between the first and last positions. Additionally, the standard deviation decreased from 0.68 to 0.44, indicating a reduced degree of dispersion. This further suggests that the impact of the HSR network on the accessibility of Jiangxi’s counties is becoming more balanced over time.
3.2 Impact of HSR network on regional economic linkages
3.2.1 Analysis of economic linkages intensity
The evolution of ELI in Jiangxi counties was closely associated with the construction of HSR lines, exhibiting a networked character. The point–axis spatial pattern with five districts and one county of Nanchang and two districts of Jiujiang as the core (Figure 6), along with the Jiangxi Section SH-KM HSR and Nanchang–Jiujiang Intercity Railway as the main axes in 2015, showed a clear path-directionality. In 2022, the ELI among counties significantly increased (Figure 7), with the total volume rising from 7,074 to 16,663. The pattern exhibits radial expansion, forming a “multi-core” economic linkage with the Jiangxi Section of SH-KM HSR and BJ-HK HSR as the main axes. The overall pattern revealed clear distance attenuation characteristics, strengthening the core radiation role and weakening marginalization characteristics.
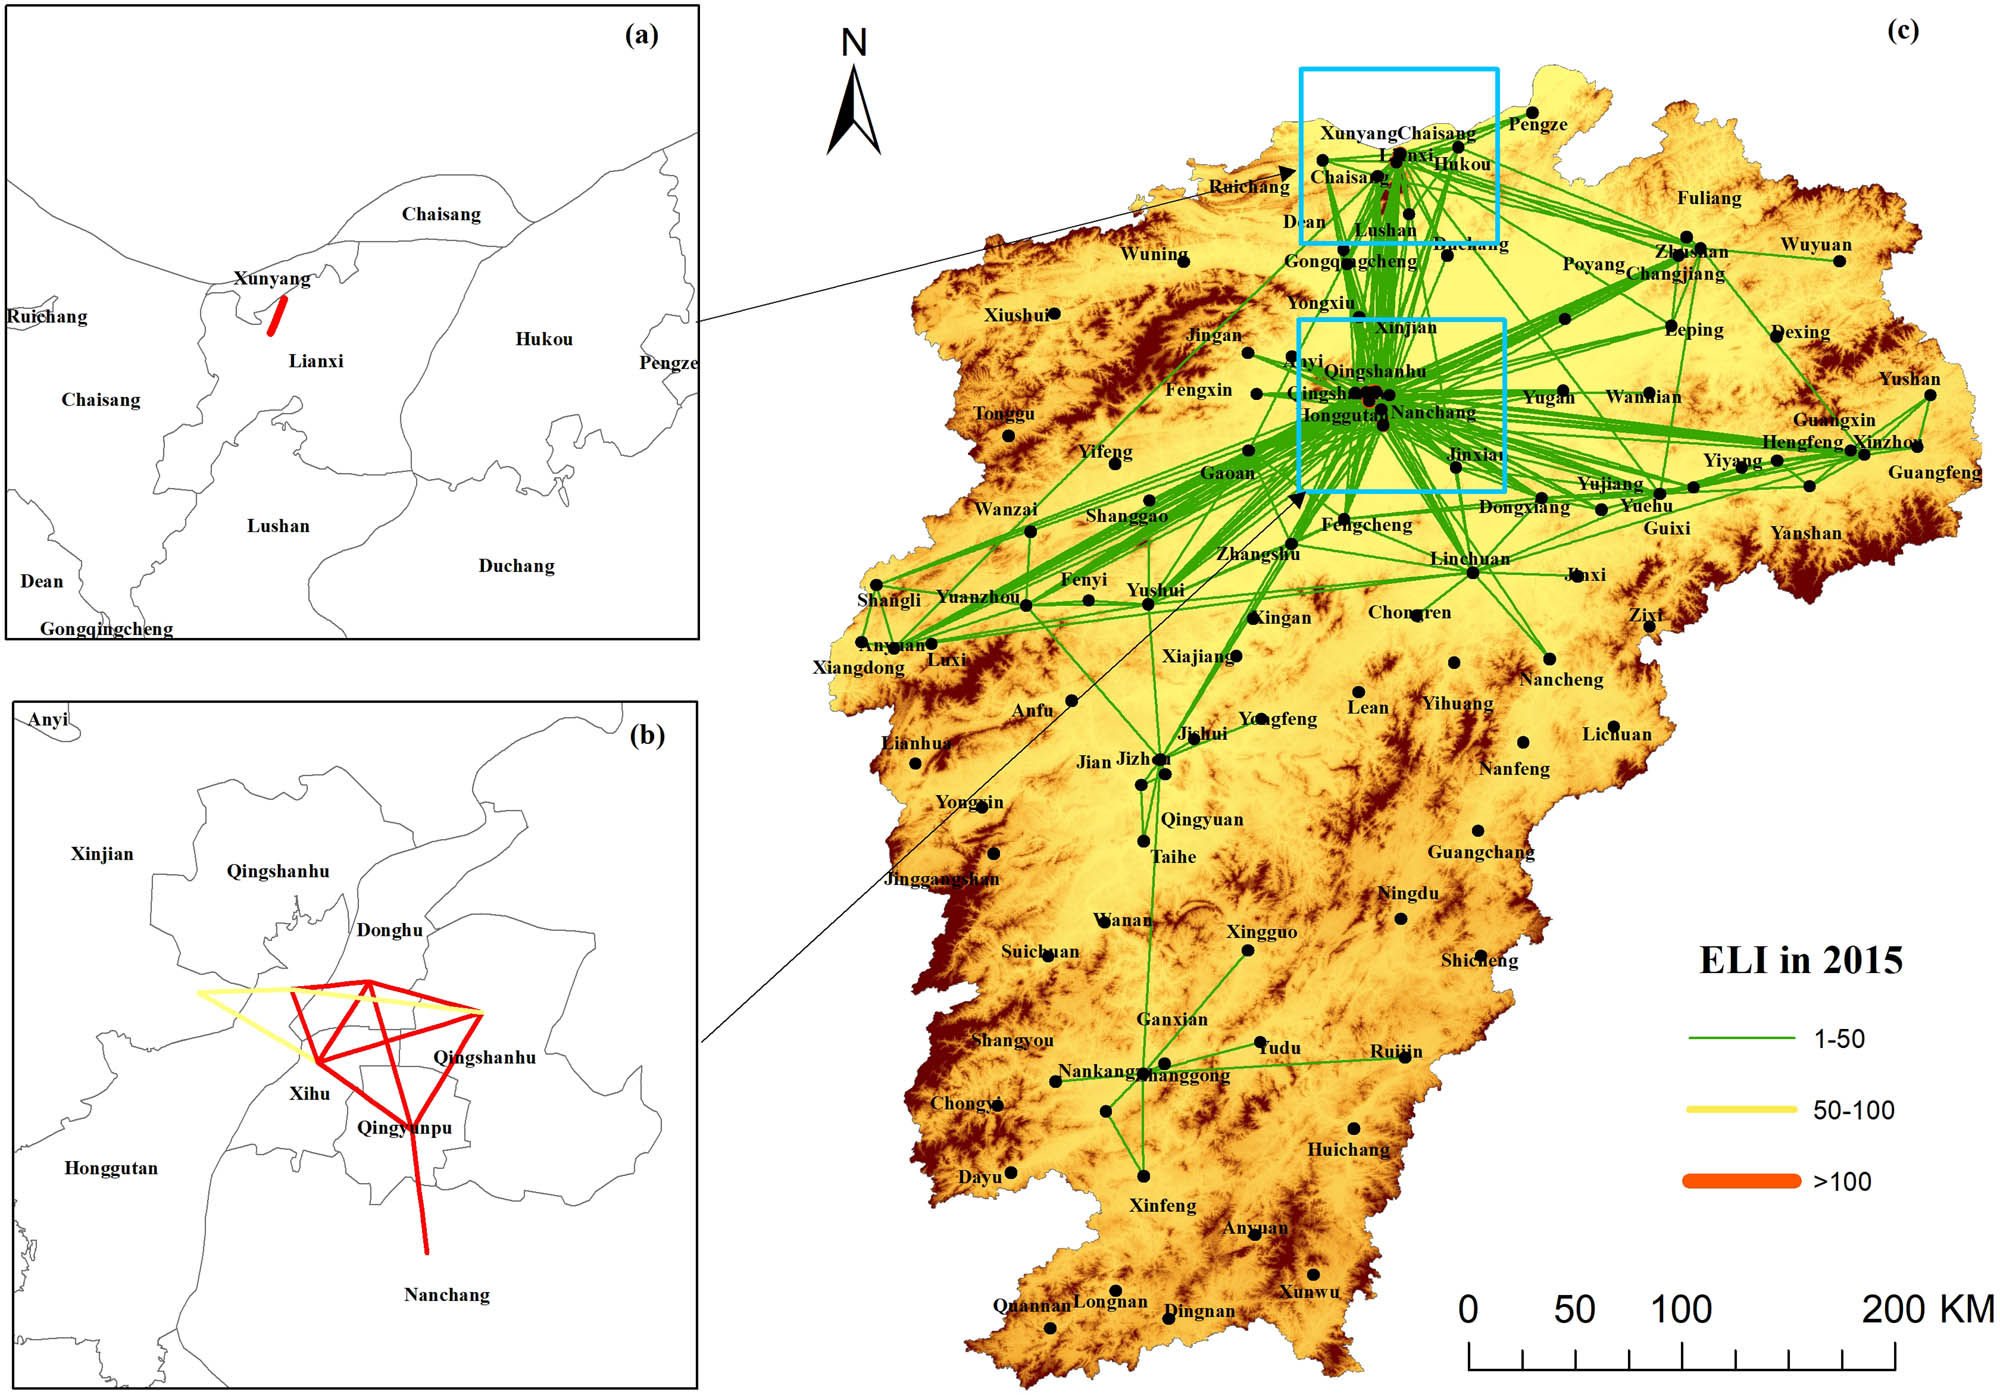
ELI among counties in Jiangxi Province in 2015. (a) Distribution of Dominant Links (>100) and Minor Links (50–100) within Jiujiang in 2015, (b) Distribution of Dominant Links (>100) and Minor Links (50–100) within Nanchang in 2015, and (c) Overall distribution of ELI across Jiangxi Province in 2015. (Unit: DN* million people/h).

ELI among counties in Jiangxi Province in 2022. (a) Distribution of Dominant Links (>100) and Minor Links (50–100) within Jiujiang in 2022, (b) Distribution of Dominant Links (>100) and Minor Links (50–100) within Nanchang in 2022, (c) Distribution of Dominant Links (>100) and Minor Links (50–100) within Shangrao in 2022, (d) Distribution of Dominant Links (>100) and Minor Links (50–100) within Ganzhou in 2022, and (e) Overall distribution of ELI across Jiangxi Province in 2022. (Unit: DN* million people/h).
The total number of lines with the ELI greater than 1 in 2015 (data with the ELI less than 1 between counties were filtered out in Figures 6 and 7 to reduce map load) was 631. It reached 2,542 lines in 2022, with the number of lines above the mean increasing from 63 to 330 and the standard deviation decreasing from 34.16 to 24.38. This indicates a strengthening of economic linkages between counties, and the polarization of strengths and weaknesses tends to flatten out.
For analysis convenience, the data were categorized into dominant links (>100), minor links (50–100), and general links (1–50). Among them, the number of dominant links increased from 20 to 24, limited to the counties belonging to Nanchang and Jiujiang. This indicates that HSR also exhibits the “Siphon effect,” with resource elements continuing to gather in the core area. The number of minor links increased from 6 to 19, introducing new links such as Zhanggong District– Ganxian District, Xinzhou District–Guangxin District, and Zhushan District–Changjiang District. This illustrates the shift of sub-core areas along the Beijing–Hong Kong Line, Quzhou–Jiujiang Line, and Hefei–Fuzhou Line to southern and northeastern Jiangxi. The number of general links increased from 605 to 2,409, spreading across all regions of the province (Figure 8).
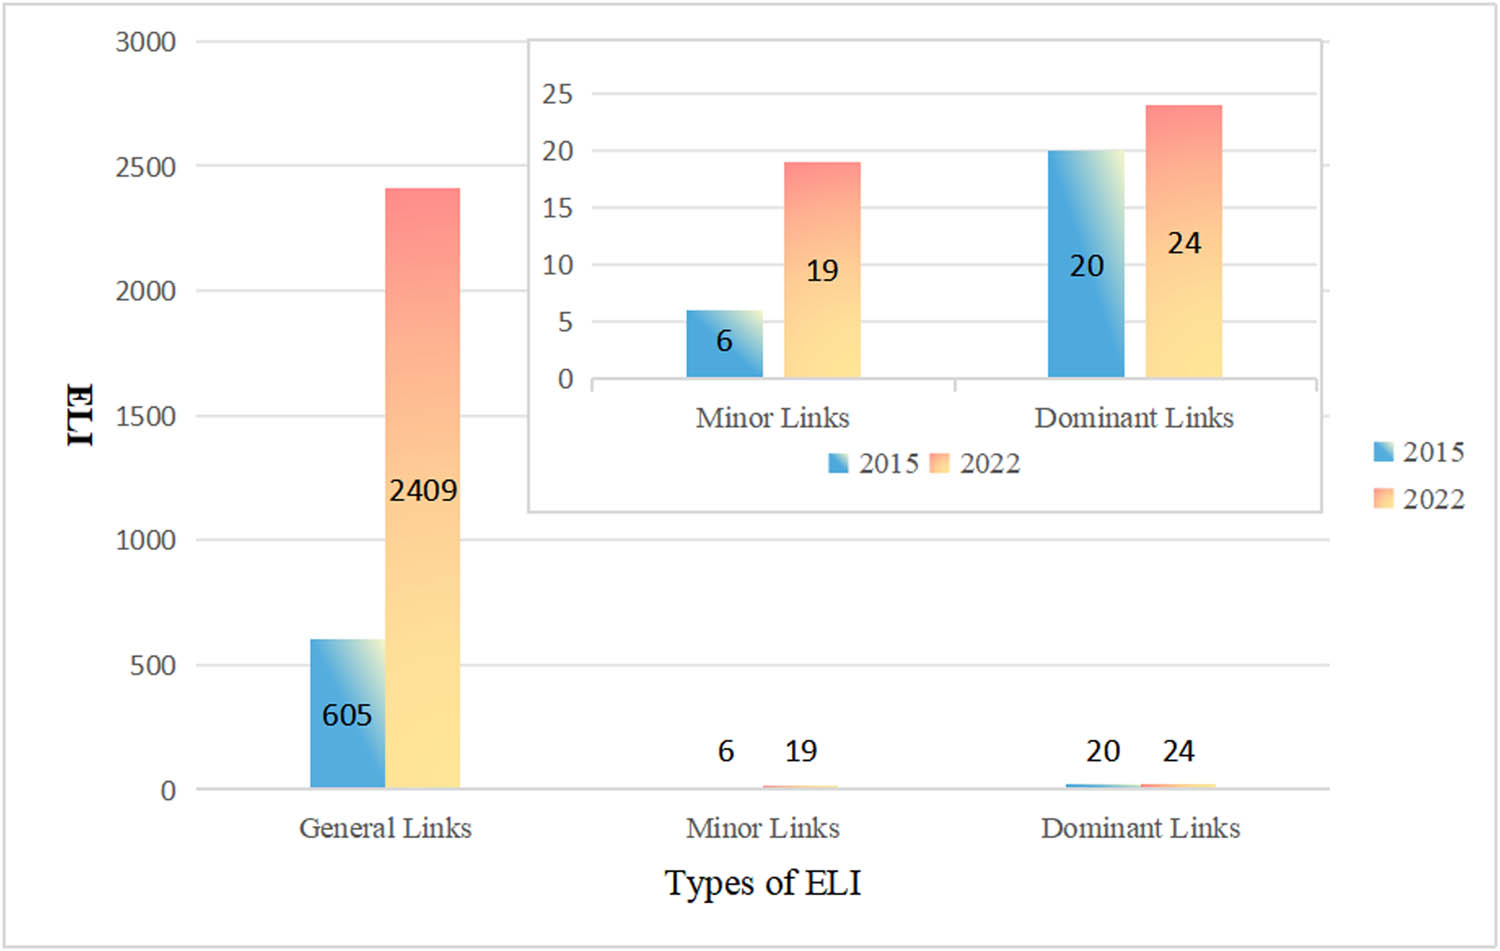
Changes in different types of ELI 2015–2022.
The HSR network in Jiangxi enhances economic connections among locations along the lines, resulting in a polycentric overall pattern and an evident “corridor effect.” This is observed in the strengthened economic interactions and resource exchanges among locations along the lines, forming a more closely knit economic linkage belt. However, it also underscores the “siphoning effect” of HSR, implying that the core area will attract more talent, capital, and resources, causing an outflow from its surrounding areas. This phenomenon may even exacerbate development imbalances in peripheral areas.
3.2.2 Analysis of TAEL
The HSR network has significantly enhanced the level of external economic connections among counties. The TAEL of counties in the province surged from 7074.41 in 2015 to 16663.21 in 2022, marking a 136% increase compared to the pre-HSR network completion period. The number of counties surpassing the average value also rose from 11 to 23. Among the 100 counties in the province, the top 6 in terms of the growth rate of total external economic linkages have all multiplied by more than 10 times, including Suichuan County (10.56 times), Xingguo County (10.85 times), Xunwu County (11.00 times), Anyuan County (11.11 times), Quannan County (14.92 times), and Wan’an County (16.64 times). These counties, all part of the former China Central Soviet Area with a weak foundation, have experienced leapfrog development in economic scale due to improved accessibility. However, an analysis of data dispersion reveals an increase in the standard deviation from 185.50 in 2015 to 281.50. This indicates a growing imbalance in the overall level of TAEL among counties, with the extreme difference rising from 1,108 to 1,746, and polarization gradually intensifying. This suggests that the HSR network not only enhances the overall economy along the lines but also concentrates effective resources and elements in core locations, leading to the emergence of the “Siphon effect.”
In this study, the TAEL was classified into central locations (>200), secondary locations (50–200), and general locations (<50). In 2015, there were nine central locations (Figure 9a), including six districts and one county in Nanchang, and two districts in Jiujiang. This number increased to 16 in 2022 (Figure 9b), with additional locations in 7 districts (cities), namely, Zhanggong, Jizhou, Linchuan, Fengcheng, Xinzhou, Chaisang, and Zhushan districts. These new locations are all situated along the HSR lines (Beijing–Hong Kong Line, Quzhou–Jiujiang Line, and Hefei–Fuzhou Line) that opened after 2015, indicating a positive impact of the HSR network improvement on the economic development of locations along the lines. Over the 7 year period, secondary locations increased from 10 to 53, while general locations decreased from 81 to 31 (Figure 10), demonstrating a comprehensive enhancement in the TAEL across Jiangxi counties.
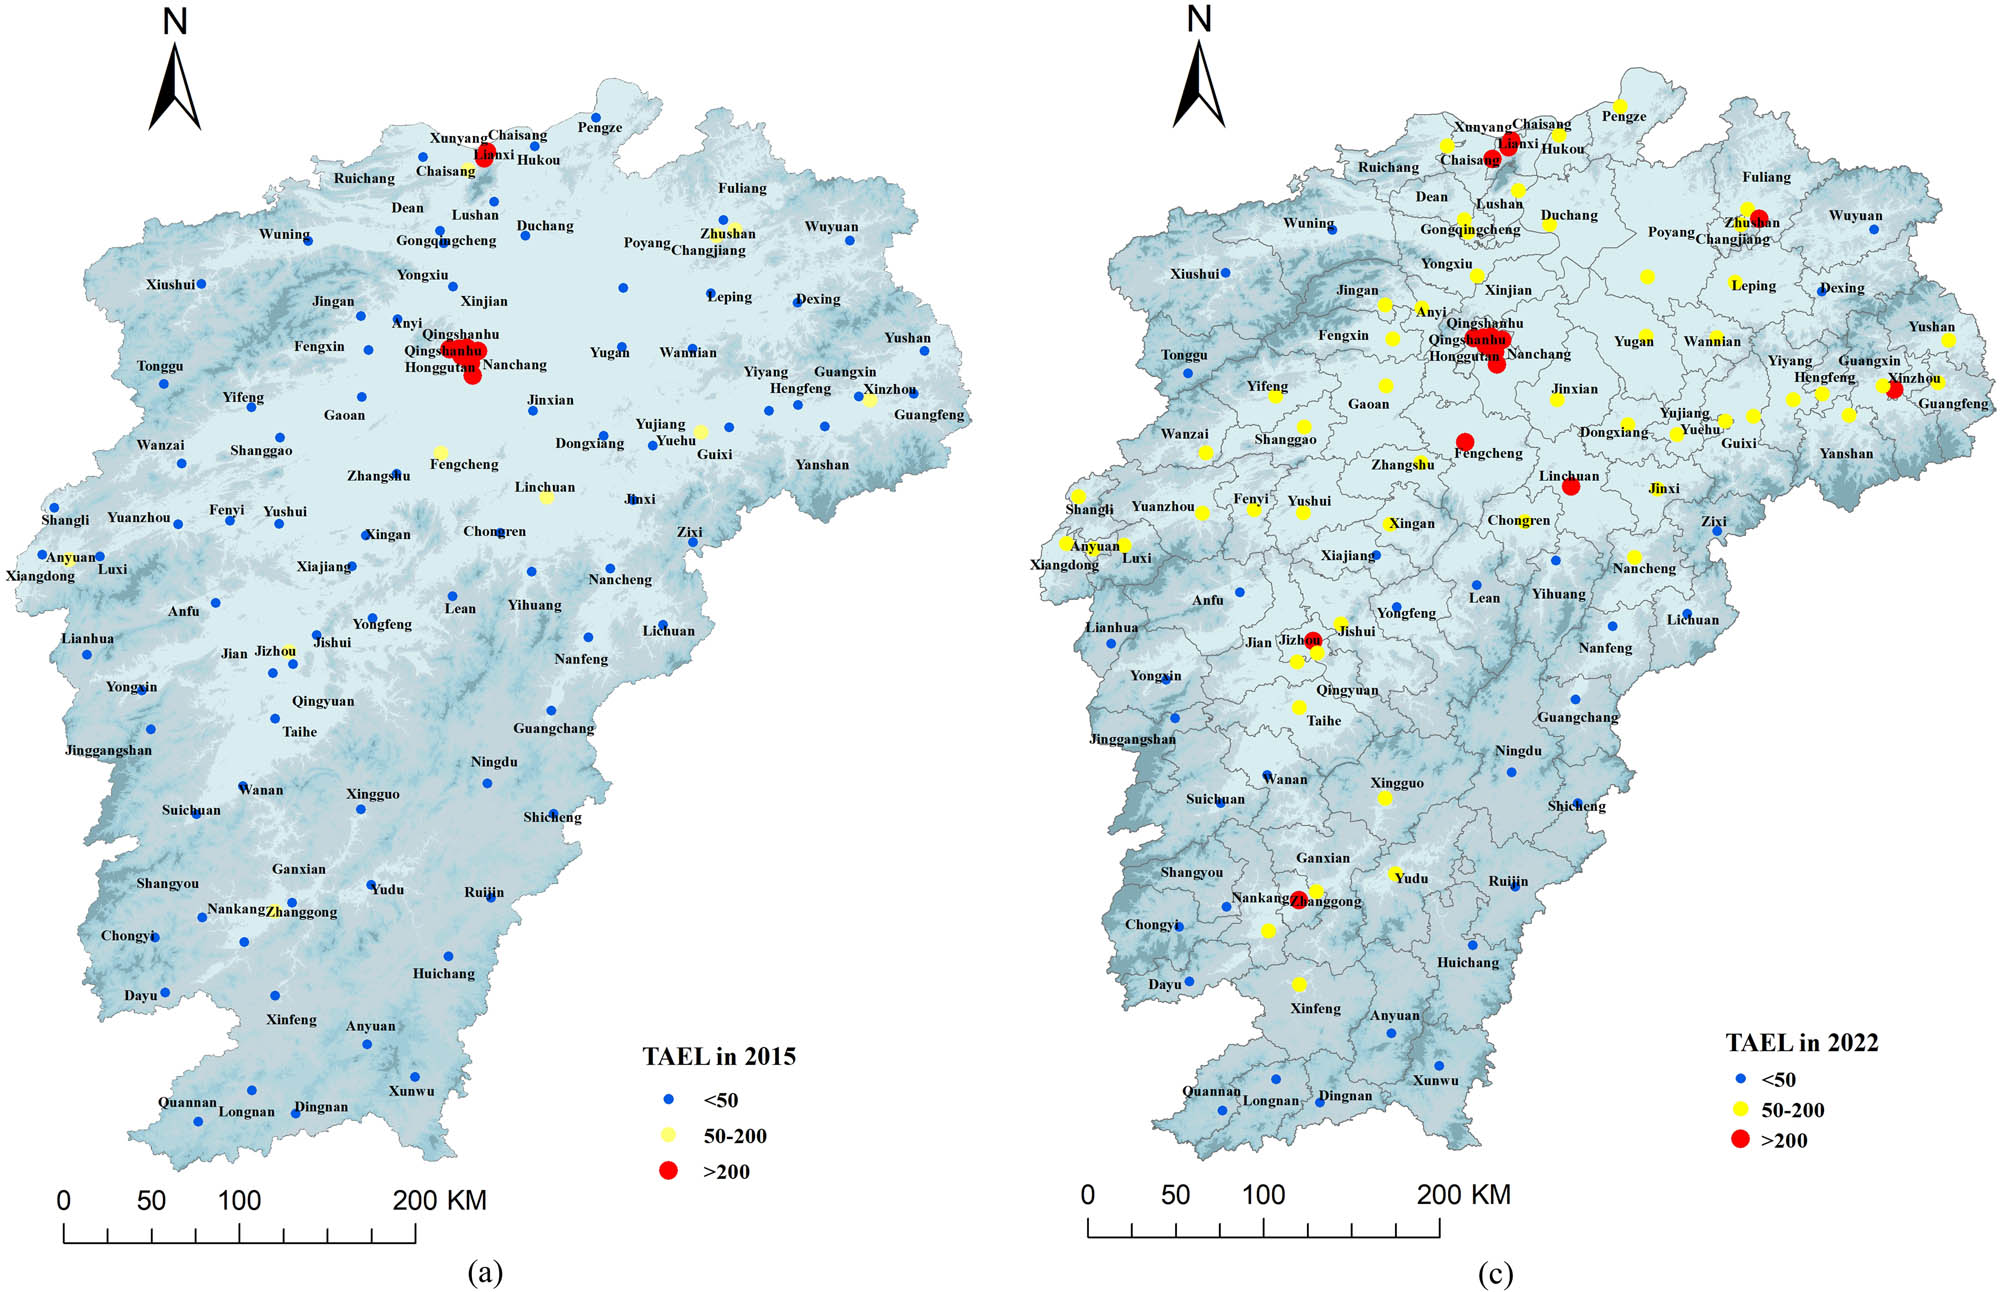
Counties with TAEL in Jiangxi Province (Unit: DN* million people/h): (a) TAEL in 2015 and (b) TAEL in 2022.
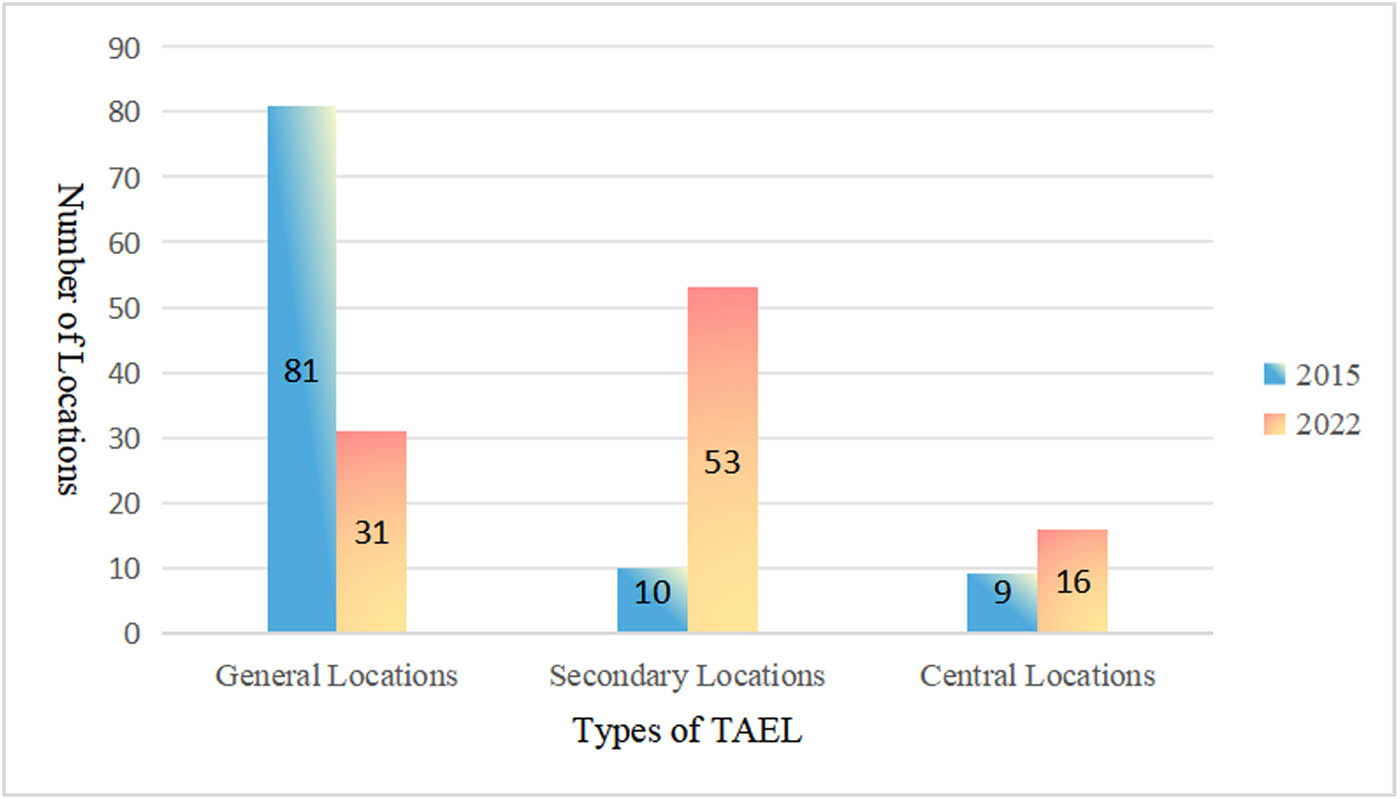
Changes in different types of TAEL 2015–2022.
In 2015, only Xihu District (1109.33) exceeded the level of 1,000, while Qingyunpu District (1021.77), Donghu District (1188.79), Qingshanhu District (1046.91), and Honggutan District (1311.70) were added in 2022. However, all these districts belong to Nanchang, and the combined external economic output of the five districts is significantly higher than that of other urban districts. This indicates that the improvement of the HSR network further solidifies the position of Nanchang West Railway Station as the unique national railroad hub in Jiangxi Province.
4 Conclusions and recommendations
4.1 Conclusions
Leveraging spatio-temporal data, this study assesses indicators such as WATT, DA, AC, ELI, and total amount for counties in Jiangxi Province. This article analyzes the similarities and differences in the impacts of operating a single HSR line versus an HSR network in Jiangxi Province on the pattern of inter-county accessibility and economic linkages, drawing the following conclusions:
The formation of HSR network triggers a more obvious and balanced spatial and temporal convergence effect, and the accessibility level of each county has been substantially improved, the gap between locations is constantly narrowing, and a significant “corridor effect” is manifested. Compared with a single HSR line, networking has led to the expansion and extension of high-accessibility areas both horizontally and vertically, further optimizing the accessibility of the traditional core areas, while the magnitude of change in the edge areas is more significant. The 3 h DA radiation ability is stronger, the high radiation index urban districts are spreading from “dual core” to “multiple core,” the gap of DA index between the central urban districts is gradually narrowing, and the development potential of the sub-urban districts is continuously improving.
The formation of the HSR network has further strengthened the economic linkages between counties and comprehensively enhanced the total external economic volume of each location. HSR lines gather production factors spatially to the locations along the lines, triggering the “corridor effect” that decays with distance, forming a high-level economic linkage belt with Jiangxi Section SH-KM HSR and Jiangxi Section BJ-HK HSR as the main axes, with obvious transportation directionality. At the same time, the HSR network has significantly improved the level of external economic linkages of counties, especially in edge areas, and the total amount of increase far exceeds that of the core areas.
The formation of the HSR network has made the “Siphon effect” increasingly pronounced. This effect refers to the attraction of resources from surrounding areas to core areas. It is particularly evident in counties in the southern and northeastern parts of Jiangxi Province that are non-connected or distant from HSR lines. Core areas have attracted significant investment and talent, which further solidifies their dominant position.
The “Matthew effect” is also at play, highlighting disparities in economic growth between hub counties and non-hub counties. The standard deviation of the TAEL across the 100 counties increased from 185.50 in 2015 to 281.50 in 2022. This highlights the growing inequality in the TAEL among counties. The extreme deviation rose from 1,108 to 1,746, indicating a gradual but significant increase in economic polarization. These effects show how a single HSR line cannot match the comprehensive HSR network. The gap between connected and non-connected regions widens, leading to a more significant polarization of economic strengths and weaknesses.
In conclusion, HSR network has significantly influenced accessibility and economic linkages in Jiangxi Province. The network has improved access across counties, expanding high-accessibility regions and transforming the pattern of connectivity from “dual core” to “multiple core,” enhancing both central and edge areas. The network has also strengthened economic linkages, creating a high-level economic belt along its main lines. This trend emphasizes the directional flow of resources toward these lines, benefiting edge counties economically even more than core areas.
However, the HSR network has intensified the “Siphon effect,” drawing resources to core hubs and leaving counties further from HSR lines at a disadvantage. The “Matthew effect” has widened disparities between hub and non-hub counties. This polarization emphasizes the need for targeted policies to reduce disparities and promote balanced development in Jiangxi Province.
4.2 Recommendations
Building upon the aforementioned analysis and conclusions, this research recommends focusing on the HSR-driven axis. Suggestions are provided for HSR construction planning, fostering economic synergy and integration, and aligning with neighboring town clusters. The goal is to enhance economic exchanges and linkages between counties, fostering the creation of a high-level economic belt characterized by distinct features, complementary advantages, and coordinated development.
Filling in HSR depressions and facilitating a crisscrossed and rationally laid-out HSR network, so that the convenience brought by rapid transportation can be extended to the whole region. First of all, local government departments should expedite the feasibility study for the construction of the Xianyang–Xiushui–Ji’an HSR, connecting Wuning County, Xiushui County, and Tonggu County in the northwest area of Jiangxi Province without an existing HSR line. This established a new route for the “Northward” initiative. Second, it was necessary to expedite the approval process for the Changsha–Ganzhou HSR and strive for the early commencement of full-scale construction. This connected Lianhua County, Yongxin County, and Jinggangshan City in the west-central of Jiangxi Province, where HSR accessibility was currently inferior. The aim was to establish a new corridor for the “Westward” initiative. Third, this research suggested promoting the construction of the Nanfeng–Ruijin Intercity Railway, enhancing accessibility to Nanfeng City, Guangchang County, Ningdu County, Shicheng County, and Ruijin City in the southeastern area of Jiangxi Province. This aimed to establish a new transportation route for the “Southward” initiative. In addition, the Nanchang–Jingdezhen–Huangshan HSR would commence acceptance and opening operations to optimize travel times for Yugan County, Poyang County, Leping City, and Fuliang County in northeast area of Jiangxi Province. This aimed to establish a new route for the “Eastward” initiative.
Based on the HSR-driven axis, enhancing economic exchanges and linkages among counties, forming a high-level economic belt with distinct characteristics, complementary advantages, and coordinated development. First, relying on Nanchang–Jiujiang and Nanchang–Fuzhou Intercity Railway, accelerated the integration process of Nanchang–Jiujiang and Nanchang–Fuzhou. Promoting the integration of Fengcheng City, Zhangshu City, Gaoan City, and Poyang County, Yugan County, Wannian County into the Greater Nanchang Metropolitan Area. This created the core “Growth Pole” of Jiangxi’s county economy. And then, based on Jiangxi Section SH-KM HSR, linking the counties along the line, promoting free flow of factors and efficient allocation, and building a “support belt” for the economic development of counties in the province. Additionally, taking Jiangxi Section BJ-HK HSR as the link, combining the revitalization of the former China Central Soviet Area and the High-Quality Development of southern regions in Jiangxi, it established a “connecting belt” of synergistic and interactive economy in Jiangxi’s counties.
Indeed, expanding HSR in Jiangxi has significantly enhanced transportation and spurred economic growth across its counties. This enhanced connectivity has streamlined the movement of goods, services, and people, and improved access to remote areas, boosting investment and tourism opportunities and integrating these regions more closely with the broader economy. However, expanding the HSR network also brought challenges to edge regions. Improved accessibility to core hubs could trigger “Siphon effect,” where people migrate for better prospects, exacerbating the gap between core areas and edge regions. Additionally, infrastructure projects of this magnitude are resource-intensive and, if poorly managed, could lead to underused infrastructure and economic inefficiency, especially in sparsely populated areas.
To address these challenges, local governments should develop targeted policies. First, enhancing transportation and living conditions in remote areas through infrastructure investments can attract and retain talent. Second, implementing economic incentives to encourage business investment in these regions will create jobs and help reduce brain drain. Additionally, the government can collaborate with counties along the HSR to promote coordinated regional development, ensuring that the benefits of the HSR reach more regions and foster shared growth.
Despite these challenges, the overall benefits of expanding the HSR coverage outweigh the drawbacks. Evidence shows that more equitable accessibility is achieved following the introduction of more HSR lines [59,60,61]. A strategic approach to HSR corridor development can stimulate regional economic growth and integration. By capitalizing on the “corridor effect” and carefully planning expansions, Jiangxi Province can ensure equitable and inclusive economic development through HSR infrastructure. This requires robust planning and policy frameworks to minimize negative impacts and maximize regional benefits while reducing drawbacks.
The strategic HSR expansion initiatives in Jiangxi offer a flexible blueprint that can inform similar infrastructure development efforts worldwide, serving as an effective framework for enhancing regional connectivity and economic growth. Strengthening HSR connectivity can boost economic activities worldwide, especially by seamlessly integrating remote areas into larger economic networks. More local governments can consider Jiangxi’s strategic infrastructure investments to improve transportation and living conditions, attract talent, and promote regional development. By applying Jiangxi’s strategic infrastructure investments globally, this study provides an adaptable model for regions facing similar developmental challenges, ensuring the benefits of HSR promote equitable growth. These investments can be tailored to meet specific local conditions, making them versatile tools for global infrastructure development.
5 Discussion
This study has investigated changes in county accessibility and economic linkages in Jiangxi Province before and after the establishment of the HSR network, utilizing spatio-temporal data from 2015 and 2022. It offers recommendations for HSR planning and regional–economic integration in Jiangxi Province. Reflecting on previous research, it becomes evident that while many studies have explored the effects of HSR, few have systematically examined the integration of spatio-temporal data to assess both accessibility and economic linkages at the county level as thoroughly as this study has.
Recent studies, such as Hong et al., highlight that HSR accessibility depends not only on station-to-station travel time but also on entry and exit times, which can significantly impact total travel time [62]. The travel time of connecting transportation may constitute 35–55% of the door-to-door HSR travel time [63]. Therefore, our study has expanded the scope by including these factors in the analysis, providing a more comprehensive model of HSR impact.
The study focused primarily on the impacts of the HSR network, using automobiles as the connecting mode. It is noted that 21 locations have a connection time of over 1 h to the nearest HSR station. Unlike earlier studies that overlooked the integration of road and rail networks [64], such as the work of Li et al., this research underscores the need to consider these factors as crucial to understanding the full impact of HSR on regional development. Moreover, most of these 21 locations are situated far from city centers, potentially offsetting the time saved by the establishment of the HSR network due to their distance from HSR stations. Hence, optimizing the road network for these locations is essential to achieve efficient HSR station–location connections and reduce travel time.
Overall, this study has certain limitations primarily in the following areas: (1) it does not account for transportation and economic connections with other provinces and regions, which could be influenced by similar infrastructure developments; (2) the impact of changes in the integrated transportation network (including roads, aviation, and ordinary trains) on accessibility was not considered, a factor that could significantly alter the outcomes; (3) the method of determining the proportion of HSR passengers in the weighted accessibility calculation is not clearly defined, which could affect the accuracy of the findings; and (4) the calculation results were not effectively validated against empirical data, which is a critical step for future research.
In future research, we plan to expand the scope of the study, focusing on investigating the connection time of HSR stations while considering changes in the integrated transportation network. We will also identify different traveler preferences through surveys and validate the differences between calculated and actual data to enhance the robustness of our conclusions and provide more actionable insights for policymakers.
Acknowledgements
The authors would like to thank the reviewers for their constructive comments. This study was supported by the Humanities and Social Sciences Planning Project of Jiangxi Colleges and Universities (Project No. GL20118) and the Jiangxi Provincial Natural Science Foundation Program (Project No. 2012ZBAB201002).
-
Funding information: This study was supported by the Humanities and Social Sciences Planning Project of Jiangxi Colleges and Universities (Project No. GL20118) and the Jiangxi Provincial Natural Science Foundation Program (Project No. 2012ZBAB201002).
-
Author contributions: Data curation: Lei Wu. Formal analysis: Lei Wu, Feng Yin. Funding acquisition: Lei Wu, Xiaodan Song. Investigation: Xiaodan Song. Methodology: Lei Wu, Feng Yin. Resources: Lei Wu. Software: Lei Wu.
-
Conflict of interest: The authors state no conflict of interest.
-
Data availability statement: All data rights are owned by the authors. For access to the manuscript's data, please contact the corresponding author (Lei Wu).
Prefecture cities belonging to 100 counties (cities) and districts in Jiangxi Province
| No. | County/county-level city/urban district | Prefecture-City | No. | County/county-level city/urban district | Prefecture-City | No. | County/county-level city/urban district | Prefecture-City | No. | County/county-level city/urban district | Prefecture-City |
|---|---|---|---|---|---|---|---|---|---|---|---|
| 1 | Guangchang | Fuzhou | 26 | Chongyi | Ganzhou | 51 | Chaisang | Jiujiang | 76 | Yushan | Shangrao |
| 2 | Nanfeng | Fuzhou | 27 | Dayu | Ganzhou | 52 | Lianxi | Jiujiang | 77 | Yiyang | Shangrao |
| 3 | Linchuan | Fuzhou | 28 | Xunwu | Ganzhou | 53 | Xiushui | Jiujiang | 78 | Hengfeng | Shangrao |
| 4 | Yihuang | Fuzhou | 29 | Longnan | Ganzhou | 54 | Hukou | Jiujiang | 79 | Yanshan | Shangrao |
| 5 | Nancheng | Fuzhou | 30 | Jinggangshan | Ji’an | 55 | Pengze | Jiujiang | 80 | Guangfeng | Shangrao |
| 6 | Chongren | Fuzhou | 31 | Yongxin | Ji’an | 56 | Lushan | Jiujiang | 81 | Xinzhou | Shangrao |
| 7 | Zixi | Fuzhou | 32 | Suichuan | Ji’an | 57 | Duchang | Jiujiang | 82 | Guangxin | Shangrao |
| 8 | Lichuan | Fuzhou | 33 | Wan’an | Ji’an | 58 | Gongqingcheng | Jiujiang | 83 | Poyang | Shangrao |
| 9 | Jinxi | Fuzhou | 34 | Jizhou | Ji’an | 59 | Xunyang | Jiujiang | 84 | Yugan | Shangrao |
| 10 | Dongxiang | Fuzhou | 35 | Taihe | Ji’an | 60 | Jinxian | Nanchang | 85 | Wannian | Shangrao |
| 11 | Le’an | Fuzhou | 36 | Qingyuan | Ji’an | 61 | Nanchang | Nanchang | 86 | Yushui | Xinyu |
| 12 | Shicheng | Ganzhou | 37 | Xiajiang | Ji’an | 62 | Xihu | Nanchang | 87 | Fenyi | Xinyu |
| 13 | Anyuan | Ganzhou | 38 | Xingan | Ji’an | 63 | Qingyunpu | Nanchang | 88 | Fengcheng | Yichun |
| 14 | Zhanggong | Ganzhou | 39 | Yongfeng | Ji’an | 64 | Anyi | Nanchang | 89 | Zhangshu | Yichun |
| 15 | Ganxian | Ganzhou | 40 | Anfu | Ji’an | 65 | Donghu | Nanchang | 90 | Wanzai | Yichun |
| 16 | Xinfeng | Ganzhou | 41 | Jishui | Ji’an | 66 | Xinjian | Nanchang | 91 | Yifeng | Yichun |
| 17 | Huichang | Ganzhou | 42 | Ji’an | Ji’an | 67 | Qingshanhu | Nanchang | 92 | Tonggu | Yichun |
| 18 | Dingnan | Ganzhou | 43 | Leping | Jingdezhen | 68 | Honggutan | Nanchang | 93 | Yuanzhou | Yichun |
| 19 | Xingguo | Ganzhou | 44 | Fuliang | Jingdezhen | 69 | Lianhua | Pingxiang | 94 | Jing’an | Yichun |
| 20 | Yudu | Ganzhou | 45 | Changjiang | Jingdezhen | 70 | Anyuan | Pingxiang | 95 | Fengxin | Yichun |
| 21 | Ruijin | Ganzhou | 46 | Zhushan | Jingdezhen | 71 | Xiangdong | Pingxiang | 96 | Shanggao | Yichun |
| 22 | Ningdu | Ganzhou | 47 | Wuning | Jiujiang | 72 | Luxi | Pingxiang | 97 | Gao’an | Yichun |
| 23 | Quannan | Ganzhou | 48 | Yongxiu | Jiujiang | 73 | Shangli | Pingxiang | 98 | Yuehu | Yingtan |
| 24 | Nankang | Ganzhou | 49 | De’an | Jiujiang | 74 | Wuyuan | Shangrao | 99 | Guixi | Yingtan |
| 25 | Shangyou | Ganzhou | 50 | Ruichang | Jiujiang | 75 | Dexing | Shangrao | 100 | Yujiang | Yingtan |
References
[1] Huang Y, Xu W. Spatial and temporal heterogeneity of the impact of high-speed railway on urban economy: empirical study of Chinese Cities. J Transp Geogr. 2021;91:102972. 10.1016/j.jtrangeo.2021.102972.Search in Google Scholar
[2] Cheng YS, Loo BPY, Vickerman R. High-speed rail networks, economic integration and regional specialisation in China and Europe. Travel Behav Soc. 2015;2(1):1–14. 10.1016/j.tbs.2014.07.002.Search in Google Scholar
[3] Miller EJ. Accessibility: Measurement and application in transportation planning. Transp Rev. 2018;38(5):551–5. 10.1080/01441647.2018.1492778.Search in Google Scholar
[4] Hong W, Su M. Influence of rapid transit on accessibility pattern and economic linkage at urban agglomeration scale in China. Open Geosci. 2019;11(1):804–14. 10.1515/geo-2019-0062.Search in Google Scholar
[5] Jiao J, Wang J, Zhang F, Jin F, Liu W. Roles of accessibility, connectivity and spatial interdependence in realizing the economic impact of high-speed rail: Evidence from China. Transp Policy. 2020;91(6):1–15. 10.1016/j.tranpol.2020.03.001.Search in Google Scholar
[6] Gutiérrez J. Location, economic potential and daily accessibility: An analysis of the accessibility impact of the high- speed line Madrid-Barcelona-French border. J Transp Geogr. 2001;9(4):229–42. 10.1016/j.tbs.2014.07.002.Search in Google Scholar
[7] Chang JS, Lee JH. Accessibility analysis of Korean high‐speed rail: a case study of the seoul metropolitan area. Transp Rev. 2008;28(1):87–103. 10.1080/01441640701421495.Search in Google Scholar
[8] Han J, Hayashi Y, Jia P, Yuan Q. Economic effect of high-speed rail: empirical analysis of Shinkansen’s impact on industrial location. J Transp Eng. 2012;138(12):1551–7. 10.1061/(asce)te.1943-5436.0000467.Search in Google Scholar
[9] Levinson DM. Accessibility impacts of high-speed rail. J Transp Geogr. 2012;22:288–91. 10.1016/j.jtrangeo.2012.01.029.Search in Google Scholar
[10] Ortega E, López E, Monzón A. Territorial cohesion impacts of high-speed rail at different planning levels. J Transp Geogr. 2012;24:130–41. 10.1016/j.jtrangeo.2011.10.008.Search in Google Scholar
[11] Monzón A, Ortega E, López E. Efficiency and spatial equity impacts of high-speed rail extensions in urban areas. Cities. 2013;30:18–30. 10.1016/j.cities.2011.11.002.Search in Google Scholar
[12] Gutiérrez J, González R, Gómez G. The European high-speed train network: Predicted effects on accessibility patterns. J Transp Geogr. 1996;4(4):227–38. 10.1016/S0966-6923(96)00033-6.Search in Google Scholar
[13] Chen G, Silva JAE. Estimating the provincial economic impacts of high-speed rail in Spain: An application of structural equation modeling. Procedia – Soc Behav Sci. 2014;111:157–65. 10.1016/J.SBSPRO.2014.01.048.Search in Google Scholar
[14] Peng B, Xia B, Liu ZL. High speed rail: Review on the regional impact and economy development. Adv Mater Res. 2011;213:107–10. 10.4028/www.scientific.net/AMR.213.107.Search in Google Scholar
[15] Martín JC, Reggiani A. Recent methodological developments to measure spatial interaction: synthetic accessibility indices applied to high‐speed train investments. Transp Rev. 2007;27(5):551–71. 10.1080/01441640701322610.Search in Google Scholar
[16] Melibaeva S, Sussman J, Dunn T. Comparative study of high-speed passenger rail deployment in megaregion corridors: Current experiences and future opportunities. In ASME/IEEE Joint Rail Conference; 2011. p. 541–61. 10.1115/JRC2011-56115.Search in Google Scholar
[17] Chen C-L, Hall P. The wider spatial-economic impacts of high-speed trains: A comparative case study of Manchester and Lille sub-regions. J Transp Geogr. 2012;24:89–110. 10.1016/J.JTRANGEO.2011.09.002.Search in Google Scholar
[18] Ureña JM, Menerault P, Garmendia M. The high-speed rail challenge for big intermediate cities: A national, regional and local perspective. Cities. 2009;26(5):266–79. 10.1016/j.cities.2009.07.001.Search in Google Scholar
[19] Wang L, Acheampong RA, He S. High-speed rail network development effects on the growth and spatial dynamics of knowledge-intensive economy in major cities of China. Cities. 2020;105:10. 10.1016/j.cities.2020.102772.Search in Google Scholar
[20] Wang C, Chen J, Li B, Chen N, Wang W. Impact of high-speed railway construction on spatial patterns of regional economic development along the route: A case study of the Shanghai–Kunming high-speed railway. Socio-Econ Plan Sci. 2023;87:101583. 10.1016/j.seps.2023.101583.Search in Google Scholar
[21] Yang H, Tong Q, Zhao P. Study on the impact of the Beijing–Shanghai high-speed railway on regional economic equity based on economic performance. Ann Reg Sci. 2021;68(1):229–53. 10.1007/s00168-021-01077-8.Search in Google Scholar
[22] Li X, Huang B, Li R, Zhang Y. Exploring the impact of high speed railways on the spatial redistribution of economic activities – Yangtze River Delta urban agglomeration as a case study. J Transp Geogr. 2016;57(12):194–206. 10.1016/j.jtrangeo.2016.10.011.Search in Google Scholar
[23] Ding Y, Zhang L. The impact of high-speed railways on urban development in the great pearl river delta of China. Proceedings of the Asia-Pacific Conference on Intelligent Medical 2018 & International Conference on Transportation and Traffic Engineering; 2018. p. 20–6. 10.1145/3321619.3321633.Search in Google Scholar
[24] Zhu Y, Diao M, Fu G. The evolution of accessibility surface of China in the high-speed-rail era. Env Plan A Econ Space. 2016;48(11):2108–11. 10.1177/0308518x15619935.Search in Google Scholar
[25] Wang L, Liu Y, Sun C, Liu Y. Accessibility impact of the present and future high-speed rail network: A case study of Jiangsu Province, China. J Transp Geogr. 2016;54:161–72. 10.1016/j.jtrangeo.2016.05.015.Search in Google Scholar
[26] Zou M, Li C, Xiong Y. Analysis of coupling coordination relationship between the accessibility and economic linkage of a high-speed railway network case study in Hunan, China. Sustainability. 2022;14:7550. 10.3390/su14137550.Search in Google Scholar
[27] He S, Mei L, Wang L. The dynamic influence of high-speed rail on the spatial structure of economic networks and the underlying mechanisms in Northeastern China. ISPRS Int J Geo-Inf. 2021;10(11):776. 10.3390/ijgi10110776.Search in Google Scholar
[28] Fan J, Kato H, Yang Z, Li Y. Effects from expanding high-speed railway network on regional accessibility and economic productivity in China. Transp Res Rec. 2021;2676(4):145–60. 10.1177/03611981211057533.Search in Google Scholar
[29] Zheng H, Cao X. Impact of high-speed railway construction on spatial relationships in the Guanzhong Plain urban agglomeration. Reg Sustain. 2021;2(1):47–59. 10.1016/j.regsus.2021.01.001.Search in Google Scholar
[30] He D, Chen Z, Pei T, Zhou J. The regional and local scale evolution of the spatial structure of high-speed railway networks – A case study focused on Beijing-Tianjin-Hebei Urban Agglomeration. ISPRS Int J Geo-Inf. 2021;10(8):543. 10.3390/ijgi10080543.Search in Google Scholar
[31] Luo H, Zhao S. Impacts of high-speed rail on the inequality of intercity accessibility: A case study of Liaoning Province, China. J Transp Geogr. 2021;90(1):102920. 10.1016/j.jtrangeo.2020.102920.Search in Google Scholar
[32] Weng J, Zhu X, Li X. Impact of high-speed rail on destination accessibility: a case study of China. J China Tour Res. 2020;16(4):494–509. 10.1080/19388160.2019.1709937.Search in Google Scholar
[33] Yang J, Guo A, Li X, Huang T. Study of the impact of a high-speed railway opening on China’s accessibility pattern and spatial equality. Sustainability. 2018;10(8):2943. 10.3390/su10082943.Search in Google Scholar
[34] Ma G, Hu J, Zhang R. Spatial-temporal distribution and coupling relationship of high-speed railway and economic networks in metropolitan areas of China. Land. 2023;12(6):1193. 10.3390/land12061193.Search in Google Scholar
[35] Dong L. Does the high-speed rail promote the medium and small cities innovation output? Fourth Int Conf Econ Bus Manag. 2019;106(1):110–3. 10.2991/febm-19.2019.32.Search in Google Scholar
[36] Yu N, Cui T, Lv S. Does the high-speed rail improve employment in peripheral cities? Evidence from China’s Beijing–Shanghai HSR line. SAGE Open. 2023;13(4):1–15. 10.1177/21582440231219351.Search in Google Scholar
[37] Liu L, Zhang M. High-speed rail impacts on travel times, accessibility, and economic productivity: A benchmarking analysis in city-cluster regions of China. J Transp Geogr. 2018;73:25–40. 10.1016/j.jtrangeo.2018.09.013.Search in Google Scholar
[38] Jing L, Yayun S, Minmin D. Small city development in the era of high-speed rail: A study based on population hollowing-out. J Financ Econ. 2021;47(9):401. 10.16538/j.cnki.jfe.20210606.401.Search in Google Scholar
[39] Tang E, Zhang M. Urban rail accessibility and interurban spatial effects on the background of high-speed rail in Jiangxi Province. Resour Env Yangtze Basin. 2018;27(10):2241–9. 10.11870/cjlyzyyhj201810010.Search in Google Scholar
[40] Zhong Y, Guo W, Mao W, Wang X, Feng X. Urban railway network and accessibility evolution research of the “Min Xin Axis Belt”. Resour Env Yangtze Basin. 2019;28(5):1015–24. 10.11870/cjlyzyyhj201905002.Search in Google Scholar
[41] Chi F, Han H. The impact of high-speed rail on economic development: A county-level analysis. Land. 2023;12(4):874. 10.3390/land12040874.Search in Google Scholar
[42] Ye C, Zheng Y, Lin S, Zhao Z. The impact of high-speed railway opening on regional economic growth: the case of the Wuhan–Guangzhou high-speed railway line. Sustainability. 2022;14(18):11390. 10.3390/su141811390.Search in Google Scholar
[43] Wang C, Meng W, Hou X. The impact of high-speed rails on urban economy: An investigation using night lighting data of Chinese cities. Res Transp Econ. 2020;80(5):100819. 10.1016/j.retrec.2020.100819.Search in Google Scholar
[44] Liang Y, Zhou K, Li X, Zhou Z, Sun W, Zeng J. Effectiveness of high-speed railway on regional economic growth for less developed areas. J Transp Geogr. 2020;82(1):102621. 10.1016/j.jtrangeo.2019.102621.Search in Google Scholar
[45] Wu Y, Shi K, Chen Z, Liu S, Chang Z. Developing improved time-series DMSP-OLS-like data (1992–2019) in China by integrating DMSP-OLS and SNPP-VIIRS. IEEE Trans Geosci Remote Sens. 2022;60(12):1–14. 10.1109/tgrs.2021.3135333.Search in Google Scholar
[46] Cai J, Huang C, Deng Z, Li L. Transport accessibility and poverty alleviation in Guizhou Province of China: Spatiotemporal pattern and impact analysis. Sustainability. 2023;15(4):3143. 10.3390/su15043143.Search in Google Scholar
[47] Yin M, Bertolini L, Duan J. The effects of the high-speed railway on urban development: International experience and potential implications for China. Prog Plann. 2015;98(5):1–52. 10.1016/j.progress.2013.11.001.Search in Google Scholar
[48] Wang L, Liu Y, Mao L, Sun C. Potential impacts of China 2030 high-speed rail network on ground transportation accessibility. Sustainability. 2018;10(4):1270. 10.3390/su10041270.Search in Google Scholar
[49] Salonen M, Toivonen T. Modelling travel time in urban networks: comparable measures for private car and public transport. J Transp Geogr. 2013;31(6):143–53. 10.1016/j.jtrangeo.2013.06.011.Search in Google Scholar
[50] Yu M, Fan W. Accessibility impact of future high speed rail corridor on the piedmont Atlantic megaregion. J Transp Geogr. 2018;73(12):1–12. 10.1016/j.jtrangeo.2018.09.014.Search in Google Scholar
[51] Cao J, Liu XC, Wang Y, Li Q. Accessibility impacts of China’s high-speed rail network. J Transp Geogr. 2013;28(4):12–21. 10.1016/j.jtrangeo.2012.10.008.Search in Google Scholar
[52] Jiang B, Chu N. Comprehensive evaluation of accessibility in China’s high-speed rail network based on the perspective of time, economy, and frequency. J Urban Plan Dev. 2017;143(3):395. 10.1061/(asce)up.1943-5444.0000395.Search in Google Scholar
[53] Zhou Y, Zhao M, Tang S, Lam WHK, Chen A, Sze NN, et al. Assessing the relationship between access travel time estimation and the accessibility to high speed railway station by different travel modes. Sustainability. 2020;12(18):7827. 10.3390/su12187827.Search in Google Scholar
[54] Huang Y, Zong H. Has high-speed railway promoted spatial equity at different levels? A case study of inland mountainous area of China. Cities. 2021;110(3):103076. 10.1016/j.cities.2020.103076.Search in Google Scholar
[55] Wang S, Wang J, Liu X. How do urban spatial structures evolution in the high-speed rail era? Case study of Yangtze River Delta, China. Habitat Int. 2019;93(11):102051. 10.1016/j.habitatint.2019.102051.Search in Google Scholar
[56] Zhang P, Zhao Y, Zhu X, Cai Z, Xu J, Shi S. Spatial structure of urban agglomeration under the impact of high-speed railway construction: Based on the social network analysis. Sustain Cities Soc. 2020;62(11):102404. 10.1016/j.scs.2020.102404.Search in Google Scholar
[57] Yue Y, Cao W, Yao Z, Zhang D, Yu H, Ren Y. Study on influence of Lanzhou-Xinjiang high-speed railway on Accessibility and economic contact in northwest area. Hum Geogr. 2019;34(1):131–9. 10.13959/j.issn.1003-2398.2019.01.017.Search in Google Scholar
[58] Yang J, Shi K, Wang J, Liu X, Zhao X. Impact of high-speed rail on tourism in China. PLoS One. 2022;17(12):0276403. 10.1371/journal.pone.0276403.Search in Google Scholar PubMed PubMed Central
[59] Zhang F, Yang Z, Jiao J, Liu W, Wu W. The effects of high-speed rail development on regional equity in China. Transp Res Part Policy Pract. 2020;141:180–202. 10.1016/j.tra.2020.09.013.Search in Google Scholar
[60] Xu G, Yang H, Liu W, Shi F. Itinerary choice and advance ticket booking for high-speed-railway network services. Transp Res Part C Emerg Technol. 2018;95:82–104. 10.1016/j.trc.2018.07.010.Search in Google Scholar
[61] Liu S, Wan Y, Zhang A. Does China’s high-speed rail development lead to regional disparities? A network perspective. Transp Res Part Policy Pract. 2020;138:299–321. 10.1016/j.tra.2020.06.010.Search in Google Scholar PubMed PubMed Central
[62] Hong L, Ouyang M, Xu M, Hu P. Time-varied accessibility and vulnerability analysis of integrated metro and high-speed rail systems. Reliab Eng Syst Saf. 2020;193(1):106622. 10.1016/j.ress.2019.106622.Search in Google Scholar
[63] Xu M, Shuai B, Wang X, Liu H, Zhou H. Analysis of the accessibility of connecting transport at High-speed rail stations from the perspective of departing passengers. Transp Res Part A Policy Pract. 2023;173(7):103714. 10.1016/j.tra.2023.103714.Search in Google Scholar
[64] Li Q, Zhang T, Wang H, Zeng Z. Dynamic accessibility mapping using floating car data: A network-constrained density estimation approach. J Transp Geogr. 2011;19(3):379–93. 10.1016/j.jtrangeo.2010.07.003.Search in Google Scholar
© 2024 the author(s), published by De Gruyter
This work is licensed under the Creative Commons Attribution 4.0 International License.
Articles in the same Issue
- Regular Articles
- Theoretical magnetotelluric response of stratiform earth consisting of alternative homogeneous and transitional layers
- The research of common drought indexes for the application to the drought monitoring in the region of Jin Sha river
- Evolutionary game analysis of government, businesses, and consumers in high-standard farmland low-carbon construction
- On the use of low-frequency passive seismic as a direct hydrocarbon indicator: A case study at Banyubang oil field, Indonesia
- Water transportation planning in connection with extreme weather conditions; case study – Port of Novi Sad, Serbia
- Zircon U–Pb ages of the Paleozoic volcaniclastic strata in the Junggar Basin, NW China
- Monitoring of mangrove forests vegetation based on optical versus microwave data: A case study western coast of Saudi Arabia
- Microfacies analysis of marine shale: A case study of the shales of the Wufeng–Longmaxi formation in the western Chongqing, Sichuan Basin, China
- Multisource remote sensing image fusion processing in plateau seismic region feature information extraction and application analysis – An example of the Menyuan Ms6.9 earthquake on January 8, 2022
- Identification of magnetic mineralogy and paleo-flow direction of the Miocene-quaternary volcanic products in the north of Lake Van, Eastern Turkey
- Impact of fully rotating steel casing bored pile on adjacent tunnels
- Adolescents’ consumption intentions toward leisure tourism in high-risk leisure environments in riverine areas
- Petrogenesis of Jurassic granitic rocks in South China Block: Implications for events related to subduction of Paleo-Pacific plate
- Differences in urban daytime and night block vitality based on mobile phone signaling data: A case study of Kunming’s urban district
- Random forest and artificial neural network-based tsunami forests classification using data fusion of Sentinel-2 and Airbus Vision-1 satellites: A case study of Garhi Chandan, Pakistan
- Integrated geophysical approach for detection and size-geometry characterization of a multiscale karst system in carbonate units, semiarid Brazil
- Spatial and temporal changes in ecosystem services value and analysis of driving factors in the Yangtze River Delta Region
- Deep fault sliding rates for Ka-Ping block of Xinjiang based on repeating earthquakes
- Improved deep learning segmentation of outdoor point clouds with different sampling strategies and using intensities
- Platform margin belt structure and sedimentation characteristics of Changxing Formation reefs on both sides of the Kaijiang-Liangping trough, eastern Sichuan Basin, China
- Enhancing attapulgite and cement-modified loess for effective landfill lining: A study on seepage prevention and Cu/Pb ion adsorption
- Flood risk assessment, a case study in an arid environment of Southeast Morocco
- Lower limits of physical properties and classification evaluation criteria of the tight reservoir in the Ahe Formation in the Dibei Area of the Kuqa depression
- Evaluation of Viaducts’ contribution to road network accessibility in the Yunnan–Guizhou area based on the node deletion method
- Permian tectonic switch of the southern Central Asian Orogenic Belt: Constraints from magmatism in the southern Alxa region, NW China
- Element geochemical differences in lower Cambrian black shales with hydrothermal sedimentation in the Yangtze block, South China
- Three-dimensional finite-memory quasi-Newton inversion of the magnetotelluric based on unstructured grids
- Obliquity-paced summer monsoon from the Shilou red clay section on the eastern Chinese Loess Plateau
- Classification and logging identification of reservoir space near the upper Ordovician pinch-out line in Tahe Oilfield
- Ultra-deep channel sand body target recognition method based on improved deep learning under UAV cluster
- New formula to determine flyrock distance on sedimentary rocks with low strength
- Assessing the ecological security of tourism in Northeast China
- Effective reservoir identification and sweet spot prediction in Chang 8 Member tight oil reservoirs in Huanjiang area, Ordos Basin
- Detecting heterogeneity of spatial accessibility to sports facilities for adolescents at fine scale: A case study in Changsha, China
- Effects of freeze–thaw cycles on soil nutrients by soft rock and sand remodeling
- Vibration prediction with a method based on the absorption property of blast-induced seismic waves: A case study
- A new look at the geodynamic development of the Ediacaran–early Cambrian forearc basalts of the Tannuola-Khamsara Island Arc (Central Asia, Russia): Conclusions from geological, geochemical, and Nd-isotope data
- Spatio-temporal analysis of the driving factors of urban land use expansion in China: A study of the Yangtze River Delta region
- Selection of Euler deconvolution solutions using the enhanced horizontal gradient and stable vertical differentiation
- Phase change of the Ordovician hydrocarbon in the Tarim Basin: A case study from the Halahatang–Shunbei area
- Using interpretative structure model and analytical network process for optimum site selection of airport locations in Delta Egypt
- Geochemistry of magnetite from Fe-skarn deposits along the central Loei Fold Belt, Thailand
- Functional typology of settlements in the Srem region, Serbia
- Hunger Games Search for the elucidation of gravity anomalies with application to geothermal energy investigations and volcanic activity studies
- Addressing incomplete tile phenomena in image tiling: Introducing the grid six-intersection model
- Evaluation and control model for resilience of water resource building system based on fuzzy comprehensive evaluation method and its application
- MIF and AHP methods for delineation of groundwater potential zones using remote sensing and GIS techniques in Tirunelveli, Tenkasi District, India
- New database for the estimation of dynamic coefficient of friction of snow
- Measuring urban growth dynamics: A study in Hue city, Vietnam
- Comparative models of support-vector machine, multilayer perceptron, and decision tree predication approaches for landslide susceptibility analysis
- Experimental study on the influence of clay content on the shear strength of silty soil and mechanism analysis
- Geosite assessment as a contribution to the sustainable development of Babušnica, Serbia
- Using fuzzy analytical hierarchy process for road transportation services management based on remote sensing and GIS technology
- Accumulation mechanism of multi-type unconventional oil and gas reservoirs in Northern China: Taking Hari Sag of the Yin’e Basin as an example
- TOC prediction of source rocks based on the convolutional neural network and logging curves – A case study of Pinghu Formation in Xihu Sag
- A method for fast detection of wind farms from remote sensing images using deep learning and geospatial analysis
- Spatial distribution and driving factors of karst rocky desertification in Southwest China based on GIS and geodetector
- Physicochemical and mineralogical composition studies of clays from Share and Tshonga areas, Northern Bida Basin, Nigeria: Implications for Geophagia
- Geochemical sedimentary records of eutrophication and environmental change in Chaohu Lake, East China
- Research progress of freeze–thaw rock using bibliometric analysis
- Mixed irrigation affects the composition and diversity of the soil bacterial community
- Examining the swelling potential of cohesive soils with high plasticity according to their index properties using GIS
- Geological genesis and identification of high-porosity and low-permeability sandstones in the Cretaceous Bashkirchik Formation, northern Tarim Basin
- Usability of PPGIS tools exemplified by geodiscussion – a tool for public participation in shaping public space
- Efficient development technology of Upper Paleozoic Lower Shihezi tight sandstone gas reservoir in northeastern Ordos Basin
- Assessment of soil resources of agricultural landscapes in Turkestan region of the Republic of Kazakhstan based on agrochemical indexes
- Evaluating the impact of DEM interpolation algorithms on relief index for soil resource management
- Petrogenetic relationship between plutonic and subvolcanic rocks in the Jurassic Shuikoushan complex, South China
- A novel workflow for shale lithology identification – A case study in the Gulong Depression, Songliao Basin, China
- Characteristics and main controlling factors of dolomite reservoirs in Fei-3 Member of Feixianguan Formation of Lower Triassic, Puguang area
- Impact of high-speed railway network on county-level accessibility and economic linkage in Jiangxi Province, China: A spatio-temporal data analysis
- Estimation model of wild fractional vegetation cover based on RGB vegetation index and its application
- Lithofacies, petrography, and geochemistry of the Lamphun oceanic plate stratigraphy: As a record of the subduction history of Paleo-Tethys in Chiang Mai-Chiang Rai Suture Zone of Thailand
- Structural features and tectonic activity of the Weihe Fault, central China
- Application of the wavelet transform and Hilbert–Huang transform in stratigraphic sequence division of Jurassic Shaximiao Formation in Southwest Sichuan Basin
- Structural detachment influences the shale gas preservation in the Wufeng-Longmaxi Formation, Northern Guizhou Province
- Distribution law of Chang 7 Member tight oil in the western Ordos Basin based on geological, logging and numerical simulation techniques
- Evaluation of alteration in the geothermal province west of Cappadocia, Türkiye: Mineralogical, petrographical, geochemical, and remote sensing data
- Numerical modeling of site response at large strains with simplified nonlinear models: Application to Lotung seismic array
- Quantitative characterization of granite failure intensity under dynamic disturbance from energy standpoint
- Characteristics of debris flow dynamics and prediction of the hazardous area in Bangou Village, Yanqing District, Beijing, China
- Rockfall mapping and susceptibility evaluation based on UAV high-resolution imagery and support vector machine method
- Statistical comparison analysis of different real-time kinematic methods for the development of photogrammetric products: CORS-RTK, CORS-RTK + PPK, RTK-DRTK2, and RTK + DRTK2 + GCP
- Hydrogeological mapping of fracture networks using earth observation data to improve rainfall–runoff modeling in arid mountains, Saudi Arabia
- Petrography and geochemistry of pegmatite and leucogranite of Ntega-Marangara area, Burundi, in relation to rare metal mineralisation
- Prediction of formation fracture pressure based on reinforcement learning and XGBoost
- Hazard zonation for potential earthquake-induced landslide in the eastern East Kunlun fault zone
- Monitoring water infiltration in multiple layers of sandstone coal mining model with cracks using ERT
- Study of the patterns of ice lake variation and the factors influencing these changes in the western Nyingchi area
- Productive conservation at the landslide prone area under the threat of rapid land cover changes
- Sedimentary processes and patterns in deposits corresponding to freshwater lake-facies of hyperpycnal flow – An experimental study based on flume depositional simulations
- Study on time-dependent injectability evaluation of mudstone considering the self-healing effect
- Detection of objects with diverse geometric shapes in GPR images using deep-learning methods
- Behavior of trace metals in sedimentary cores from marine and lacustrine environments in Algeria
- Spatiotemporal variation pattern and spatial coupling relationship between NDVI and LST in Mu Us Sandy Land
- Formation mechanism and oil-bearing properties of gravity flow sand body of Chang 63 sub-member of Yanchang Formation in Huaqing area, Ordos Basin
- Diagenesis of marine-continental transitional shale from the Upper Permian Longtan Formation in southern Sichuan Basin, China
- Vertical high-velocity structures and seismic activity in western Shandong Rise, China: Case study inspired by double-difference seismic tomography
- Spatial coupling relationship between metamorphic core complex and gold deposits: Constraints from geophysical electromagnetics
- Disparities in the geospatial allocation of public facilities from the perspective of living circles
- Research on spatial correlation structure of war heritage based on field theory. A case study of Jinzhai County, China
- Formation mechanisms of Qiaoba-Zhongdu Danxia landforms in southwestern Sichuan Province, China
- Magnetic data interpretation: Implication for structure and hydrocarbon potentiality at Delta Wadi Diit, Southeastern Egypt
- Deeply buried clastic rock diagenesis evolution mechanism of Dongdaohaizi sag in the center of Junggar fault basin, Northwest China
- Application of LS-RAPID to simulate the motion of two contrasting landslides triggered by earthquakes
- The new insight of tectonic setting in Sunda–Banda transition zone using tomography seismic. Case study: 7.1 M deep earthquake 29 August 2023
- The critical role of c and φ in ensuring stability: A study on rockfill dams
- Evidence of late quaternary activity of the Weining-Shuicheng Fault in Guizhou, China
- Extreme hydroclimatic events and response of vegetation in the eastern QTP since 10 ka
- Spatial–temporal effect of sea–land gradient on landscape pattern and ecological risk in the coastal zone: A case study of Dalian City
- Study on the influence mechanism of land use on carbon storage under multiple scenarios: A case study of Wenzhou
- A new method for identifying reservoir fluid properties based on well logging data: A case study from PL block of Bohai Bay Basin, North China
- Comparison between thermal models across the Middle Magdalena Valley, Eastern Cordillera, and Eastern Llanos basins in Colombia
- Mineralogical and elemental analysis of Kazakh coals from three mines: Preliminary insights from mode of occurrence to environmental impacts
- Chlorite-induced porosity evolution in multi-source tight sandstone reservoirs: A case study of the Shaximiao Formation in western Sichuan Basin
- Predicting stability factors for rotational failures in earth slopes and embankments using artificial intelligence techniques
- Origin of Late Cretaceous A-type granitoids in South China: Response to the rollback and retreat of the Paleo-Pacific plate
- Modification of dolomitization on reservoir spaces in reef–shoal complex: A case study of Permian Changxing Formation, Sichuan Basin, SW China
- Geological characteristics of the Daduhe gold belt, western Sichuan, China: Implications for exploration
- Rock physics model for deep coal-bed methane reservoir based on equivalent medium theory: A case study of Carboniferous-Permian in Eastern Ordos Basin
- Enhancing the total-field magnetic anomaly using the normalized source strength
- Shear wave velocity profiling of Riyadh City, Saudi Arabia, utilizing the multi-channel analysis of surface waves method
- Effect of coal facies on pore structure heterogeneity of coal measures: Quantitative characterization and comparative study
- Inversion method of organic matter content of different types of soils in black soil area based on hyperspectral indices
- Detection of seepage zones in artificial levees: A case study at the Körös River, Hungary
- Tight sandstone fluid detection technology based on multi-wave seismic data
- Characteristics and control techniques of soft rock tunnel lining cracks in high geo-stress environments: Case study of Wushaoling tunnel group
- Influence of pore structure characteristics on the Permian Shan-1 reservoir in Longdong, Southwest Ordos Basin, China
- Study on sedimentary model of Shanxi Formation – Lower Shihezi Formation in Da 17 well area of Daniudi gas field, Ordos Basin
- Multi-scenario territorial spatial simulation and dynamic changes: A case study of Jilin Province in China from 1985 to 2030
- Review Articles
- Major ascidian species with negative impacts on bivalve aquaculture: Current knowledge and future research aims
- Prediction and assessment of meteorological drought in southwest China using long short-term memory model
- Communication
- Essential questions in earth and geosciences according to large language models
- Erratum
- Erratum to “Random forest and artificial neural network-based tsunami forests classification using data fusion of Sentinel-2 and Airbus Vision-1 satellites: A case study of Garhi Chandan, Pakistan”
- Special Issue: Natural Resources and Environmental Risks: Towards a Sustainable Future - Part I
- Spatial-temporal and trend analysis of traffic accidents in AP Vojvodina (North Serbia)
- Exploring environmental awareness, knowledge, and safety: A comparative study among students in Montenegro and North Macedonia
- Determinants influencing tourists’ willingness to visit Türkiye – Impact of earthquake hazards on Serbian visitors’ preferences
- Application of remote sensing in monitoring land degradation: A case study of Stanari municipality (Bosnia and Herzegovina)
- Optimizing agricultural land use: A GIS-based assessment of suitability in the Sana River Basin, Bosnia and Herzegovina
- Assessing risk-prone areas in the Kratovska Reka catchment (North Macedonia) by integrating advanced geospatial analytics and flash flood potential index
- Analysis of the intensity of erosive processes and state of vegetation cover in the zone of influence of the Kolubara Mining Basin
- GIS-based spatial modeling of landslide susceptibility using BWM-LSI: A case study – city of Smederevo (Serbia)
- Geospatial modeling of wildfire susceptibility on a national scale in Montenegro: A comparative evaluation of F-AHP and FR methodologies
- Geosite assessment as the first step for the development of canyoning activities in North Montenegro
- Urban geoheritage and degradation risk assessment of the Sokograd fortress (Sokobanja, Eastern Serbia)
- Multi-hazard modeling of erosion and landslide susceptibility at the national scale in the example of North Macedonia
- Understanding seismic hazard resilience in Montenegro: A qualitative analysis of community preparedness and response capabilities
- Forest soil CO2 emission in Quercus robur level II monitoring site
- Characterization of glomalin proteins in soil: A potential indicator of erosion intensity
- Power of Terroir: Case study of Grašac at the Fruška Gora wine region (North Serbia)
- Special Issue: Geospatial and Environmental Dynamics - Part I
- Qualitative insights into cultural heritage protection in Serbia: Addressing legal and institutional gaps for disaster risk resilience