Effect of alkali bases on the synthesis of ZnO quantum dots
-
Xilian Zhang


Abstract
The surface-modified zinc oxide quantum dots (ZnO QDs) have broad application prospects in the field of biomedicine because of their good water solubility, dispersibility, and high fluorescence stability. The alkali bases play important roles in controlling the morphology, size distribution, dispersity, and fluorescence intensity of the synthesized ZnO QDs. In this article, ZnO QDs were synthesized to induce hydrolysis–condensation reaction. The influences of alkali bases (LiOH, NaOH, and KOH) and the ratio of n(Zn2+):n(OH−) on the properties of synthesized ZnO QDs were investigated. The results show that the particle size of the ZnO QDs prepared using LiOH and NaOH as raw materials are smaller than that using KOH. ZnO QDs prepared at the ratio of n(Zn2+):n(LiOH) = 1:1 have the best fluorescence performance and dispersibility.
1 Introduction
Quantum dots (QDs) are semiconductor materials with a particle size close to or smaller than the de Broglie wave or the mean free path of electrons. During the past few decades, QDs have been widely studied because of their adjustable size and luminescent properties that make them promising agents for biomedicine [1,2], information encryption [3], and optoelectronic devices. Applications in the biomedical field require ZnO QDs to have good water solubility, dispersion, and fluorescence stability.
The fluorescence color of the QDs is related to their size. In the range of 2.5–7 nm, as the particle size increases, the fluorescence color is blue-violet, blue, green, yellow, orange, and red [4,5]. In 1991, Lubomir and Marc [6] prepared ZnO QDs with a size of 3–6 nm for the first time using zinc acetate and LiOH as the starting materials through a sol–gel method. Also, various methods have been used to prepare ZnO QDs, including the sol–gel method [7,8,9], the microemulsion method [10,11,12], the hydrothermal method [13,14], and so on. The sol–gel method is widely used in the laboratory research for its convenience of doping and controllability of reaction conditions. However, colloidal ZnO QDs are easy to aggregate or undergo Ostwald ripening because of their high surface energy. As a result, ZnO QDs are unstable in the aqueous dispersion used for storage. [15]. To stabilize ZnO QDs, various capping agents have been used, i.e., polyvinylpyrrolidone, 3-aminopropyltrimethoxysilane (APTES), amines, mercaptocarboxylic acid, etc. [16,17]. The alkoxyl groups in APTES hydrolyze and react with the –OH group on the surface of the ZnO to form a silica capping layer. In addition to being a biocompatible molecule, silica serves two more important functions, namely, controlling the particle size by limiting the growth of ZnO and acting as a side group on the surface that can be further conjugated with biomolecules [18]. In the sol–gel method, various factors, including doping, the concentration of precursor, the reaction temperature, and the molar ratio of the reactants, affect the final performance of the synthesized ZnO QDs. A small amount of Mg2+ doping (<10%) can significantly improve the fluorescence performance [19] and prevent the agglomeration of ZnO QDs [20]. A high concentration of zinc acetate and prolonged reaction time are beneficial for the growth of the ZnO particles [21].
Various research studies have been reported on the synthesis of ZnO nanomaterials with the controlled crystal size and the surface structure to improve their properties for a potential application. Few studies have focused on the influence of the alkali base types on the size and morphology tunability of ZnO nanomaterials [22,23]. However, there is no report on the effect of alkali base types on the dispersibility of water-soluble ZnO QDs as far as we know. Moreover, the results over the ratio of hydroxide to zinc ions on the fluorescence properties of QDs are controversial [21,24]. In this study, ZnO QDs were prepared by the sol–gel method, and their surface was modified by APTES to make them water soluble. The effects of the different alkali bases (LiOH, NaOH, and KOH) and R Zn−OH, which is the ratio of n(Zn2+):n(OH−), on the size, dispersibility, and fluorescence properties of ZnO QDs were studied.
2 Materials and methods
2.1 Materials
Zinc acetate dihydrate, magnesium acetate tetrahydrate, potassium hydroxide (Shanghai Titan Technology Co., Ltd.), sodium hydroxide (Guangdong West Long Science Co., Ltd.), lithium hydroxide (Shanghai Aladdin Biochemical Technology Co., Ltd.), 3-aminopropyltriethoxysilane (Shanghai Yien Chemical Technology Co., Ltd.), ethanol, and n-hexane (China National Pharmaceutical Group Shanghai Chemical Reagent Company) were used in this study. All the reagents used in this study are of analytical grade and were used without further purification.
2.2 Preparation of ZnO QDs
The water-soluble ZnO QDs were prepared according to the sol–gel method [19] with a small modification. A typical two-step synthesis route is shown in Figure 1 and described as follows: in the first step, 2.20 g zinc acetate dihydrate and 0.214 g magnesium acetate tetrahydrate were dissolved in 100 mL of anhydrous ethanol, and then, the solution was refluxed and stirred for 150 min at 80°C in a water bath until the solution became colorless and transparent. Then, the solution was placed in an ice bath. LiOH, NaOH, or KOH was weighed and dissolved in 150 mL of absolute ethanol, according to R Zn−OH = 1:1 and 1:2, and then heated and stirred at 85°C until the solution became colorless and transparent, and then the solution is cooled to room temperature and added to the ethanol solution of zinc acetate in an ice bath and reacted for 4 h. The solution quickly turned white and then gradually became clear, indicating that ZnO QDs were formed. In the second step, 400 µL of APTES solution was mixed with 2 mL of ultrapure water, and then, the mixed solution was added dropwise to the aforementioned ZnO QD solution, and the mixed solution was stirred at 60°C for 3 h. APTES undergoes hydrolysis to form silica-coated ZnO QDs. As the reaction completed, white ZnO QD precipitates were centrifuged at 4,500 rpm for 5 min, followed by washing twice with ethanol to remove unreacted impurities and finally vacuum dried at 60°C to obtain ZnO QD powders.
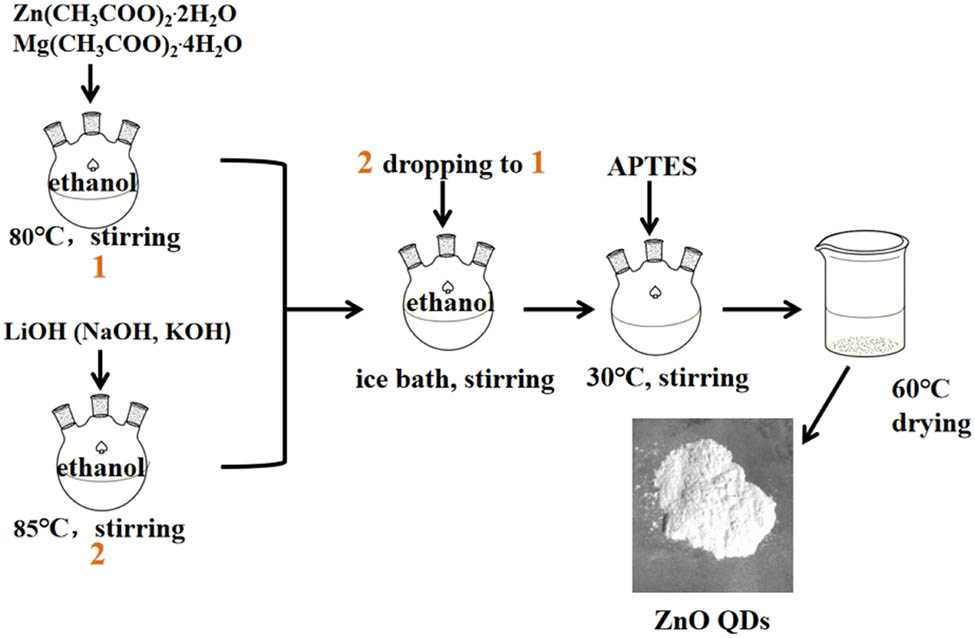
A typical routing of preparing ZnO QDs by the sol–gel method.
2.3 Characteristics
The crystal structure and composition were measured through an X-ray powder diffractometer (Shimadzu, Japan, XRD-6100). The morphology and particle size were observed using a field emission transmission electron microscope (FEI Company, USA). Surface functional groups were determined using a Fourier transform infrared spectrometer (IR-960, Tianjin Rui’an Technology Co., Ltd.). The fluorescence performance was tested by a UV spectrophotometer (model UV-2550, Shimadzu, Japan), a PL fluorescence spectroscopy (Beijing Zhuoli Hanguang Instrument Co., Ltd.), and a fluorescence spectrometer (Hitachi High-Tech Co., Ltd., Japan).
-
Ethical approval: The conducted research is not related to either human or animal use.
3 Results and discussion
In the XRD spectrum of ZnO QDs (as shown in Figure 2), the characteristic peaks of ZnO (100), (002), (101), (102), (110), (103), and (112) are all consistent with the standard card JCPDS (99-0111), indicating that the crystal structure of the synthesized ZnO QDs is wurtzite. Because of the small particle size of ZnO QDs, the half-width of the diffraction peak is broadened. The half-width of the diffraction peak of the sample with R Zn−OH = 1:2 is larger than that of the sample with R Zn−OH = 1:1, which indicates that the particle size of the QDs prepared at R Zn−OH = 1:2 is smaller than that prepared at R Zn−OH = 1:1. When R Zn−OH is fixed at 1:1, the ZnO QDs synthesized with LiOH are the smallest.
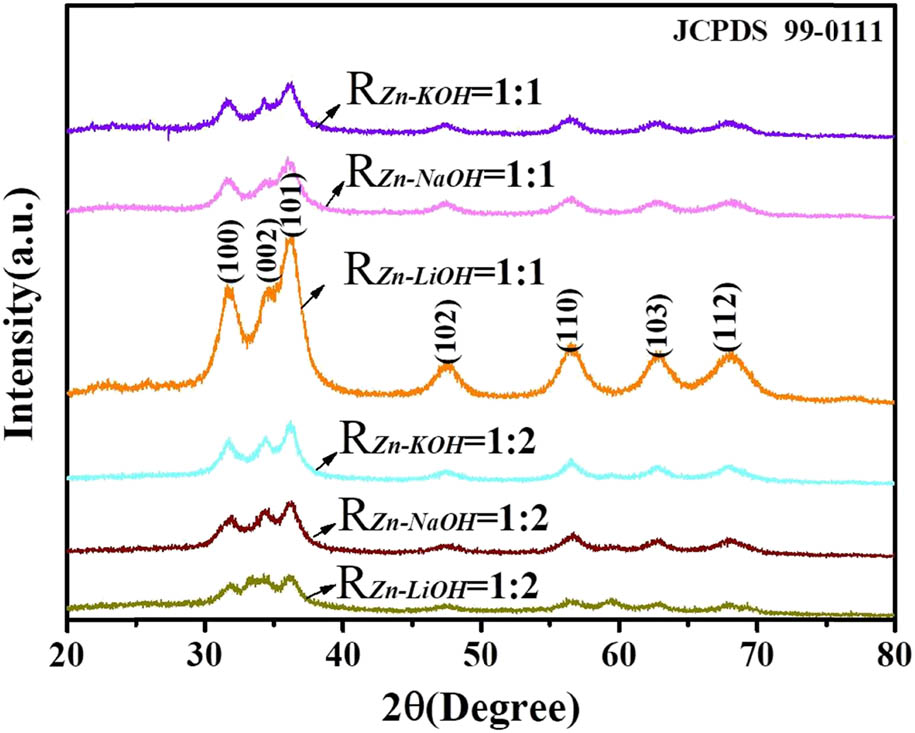
XRD pattern of ZnO QDs synthesized under different alkali bases and R Zn−OH values.
Figure 3 shows the TEM results of each sample. The particle size of the ZnO QDs prepared at R
Zn−OH = 1:2 is smaller than that prepared at R
Zn−OH = 1:1. The morphology of the QDs with R
Zn−OH = 1:1 shows better uniformity. Regardless of R
Zn−OH, the dispersion of ZnO QDs prepared with LiOH as the alkali base is better than that prepared with NaOH and KOH. This may be due to the different dissociation constants of the alkali base (
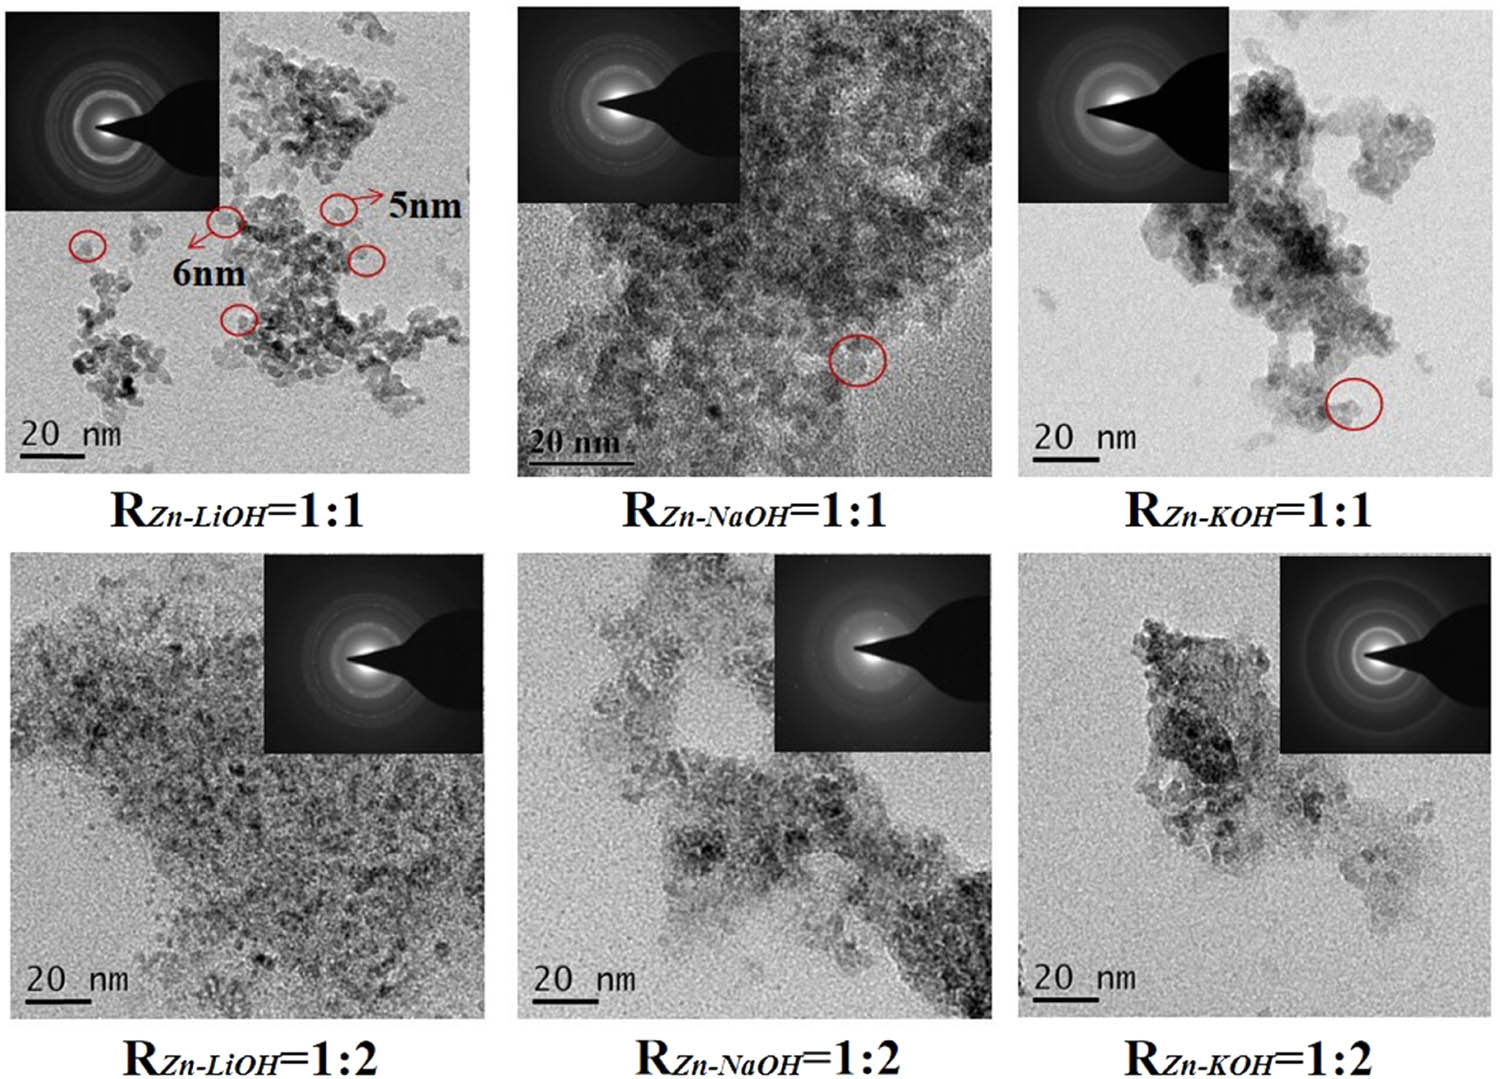
TEM image and SAED image of ZnO QDs synthesized with different alkali bases and R Zn−OH values.
Figure 4 shows the HRTEM and diffraction ring of ZnO QDs prepared with R Zn−OH = 1:1 using LiOH as the alkali base. Each crystal plane corresponds to the crystal plane in the XRD diagram, and the average particle size is about 5.5 nm, with a uniform distribution.
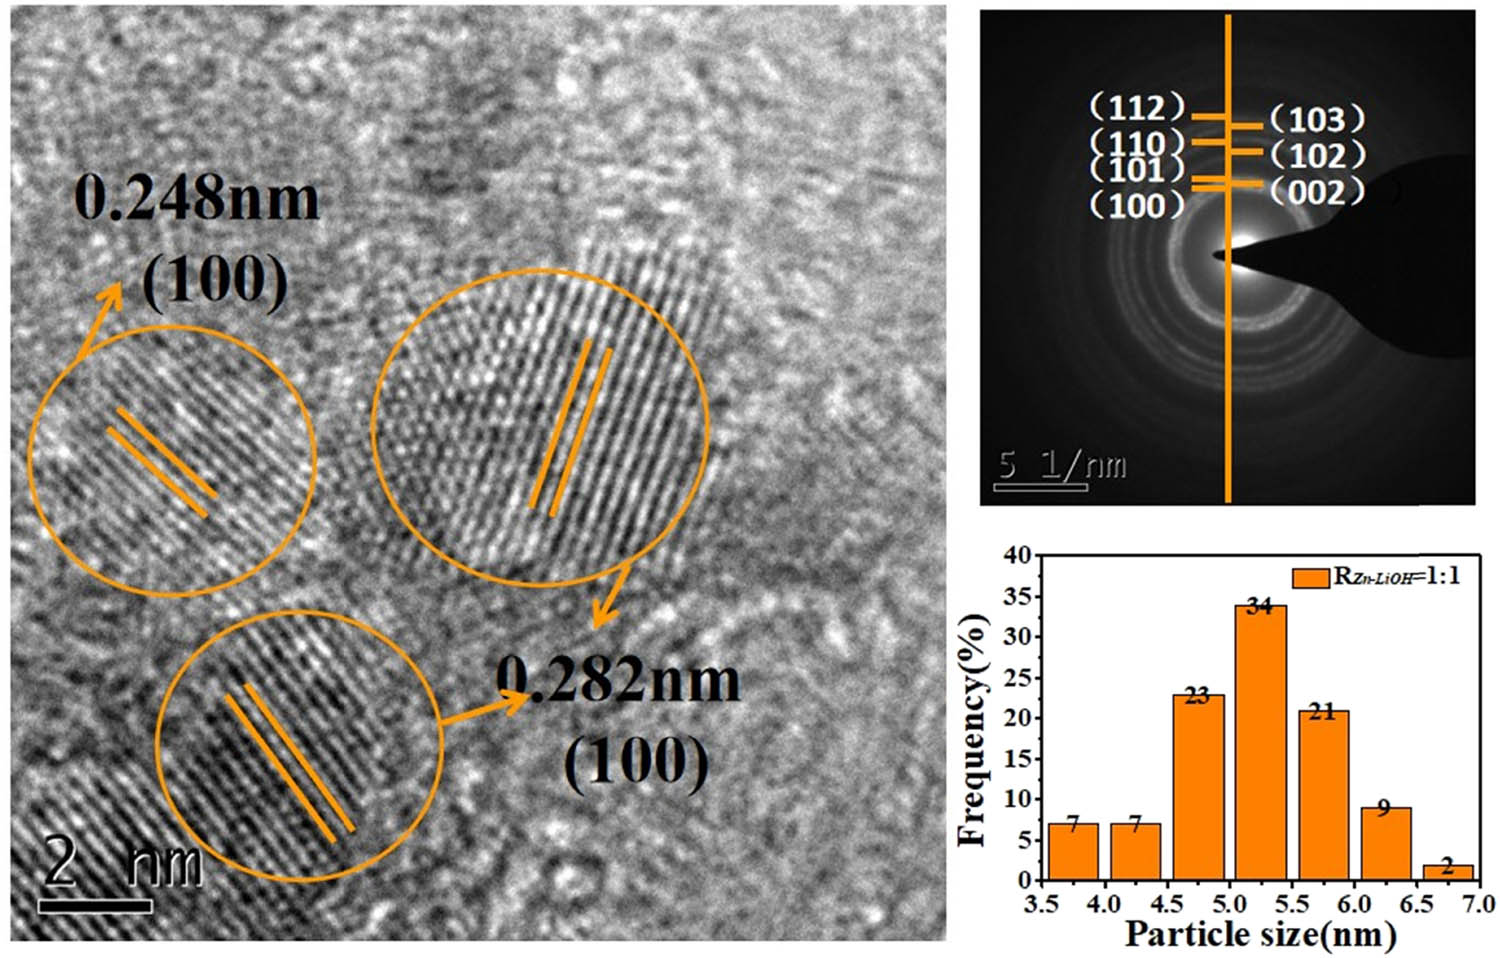
HRTEM image, SAED image, and particle size distribution image of ZnO QDs synthesized at R Zn−LiOH = 1:1.
The presence of silica capping has been explained from the FTIR studies on the samples. To explore the functional groups on the surface of the ZnO QDs, infrared characterization was used as shown in Figure 5. The observation of an absorption peak at 900 cm−1, corresponding to Si–O vibration, suggests the presence of silica in the capped ZnO QDs. The sketch of the silanization method is shown in Figure 6. In the sample of uncapped ZnO QDs, an absorption peak is observed at 470 cm−1, corresponding to the Zn–O stretching vibrations. Furthermore, this peak is found to be shifted to the lower wave number 456, 450, and 443 cm−1 for samples. The shift of Zn–O peak in all the capped samples has been found unidirectional toward the lower wave number side, which is indicative of an increase in the effective mass of the Zn–O system [18]. The absorption peak at 3,420 cm−1 is because of the O–H stretching vibrations. However, compared with the samples of R Zn−OH = 1:1, there is no N–H stretching vibration peak in the range of 3,000–3,500 cm−1 with the samples of R Zn−OH = 1:2. They are derived from the N–H and O–H stretching vibration absorption peaks. The peak at 1,420 cm−1 is the flexural vibration absorption peak of C–H, and the peak at 1,580 cm−1 is the flexural vibration absorption peak of the end group –NH2. The IR spectrum proves that there are hydroxyl and amino functional groups on the surface of the ZnO QDs. It shows that the high content of OH− is harmful to the hydrolysis of APTES to form silica, so the content of the modified functional groups on the surface of the ZnO QDs prepared with R Zn−OH = 1:2 is less. The hydroxyl and amino functional groups are hydrophilic groups, which enhance the stability and solubility of the ZnO QDs in water.
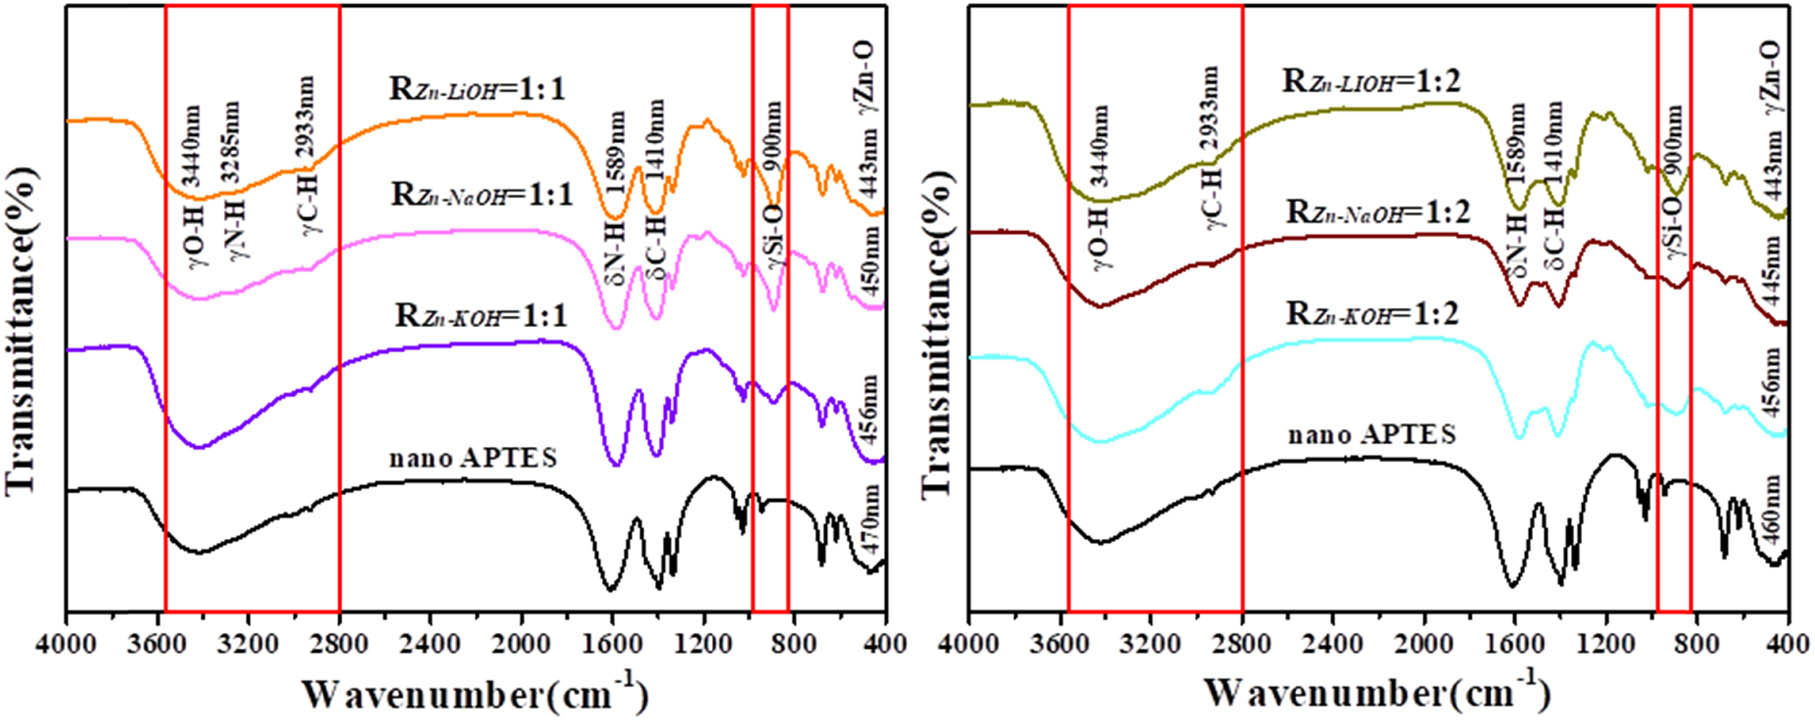
IR spectra of ZnO QDs synthesized with different alkali bases and different R Zn−OH values.
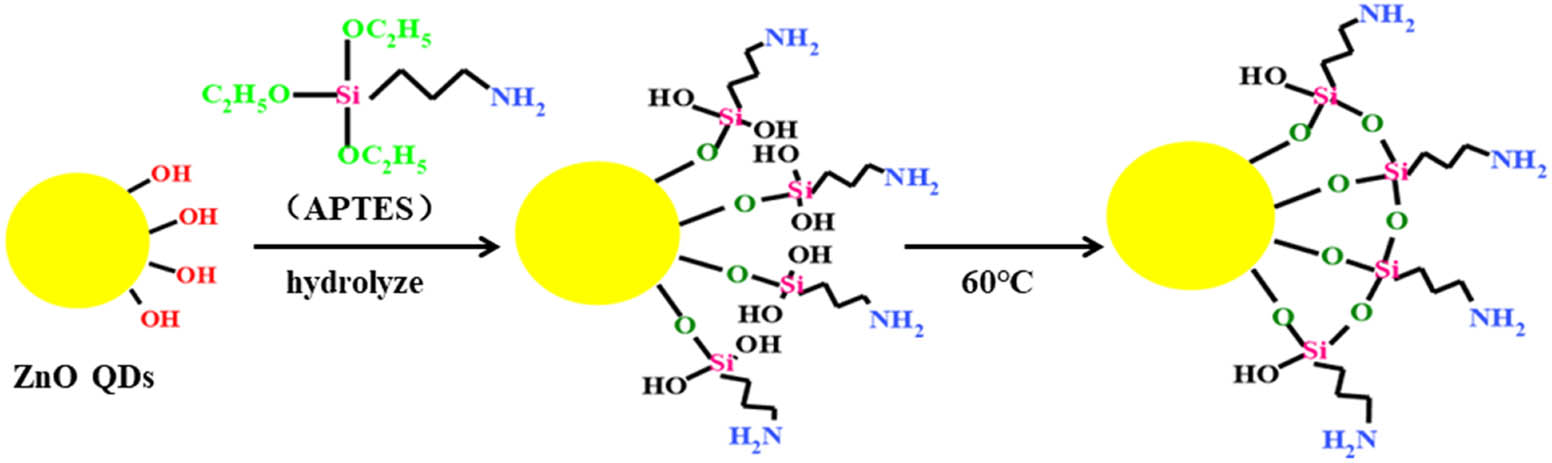
Sketch of the silanization method.
Figure 7 shows the ultraviolet-visible absorption spectrum of ZnO QDs. All the ZnO QDs have exciton absorption peaks because of the relatively larger binding energy of the exciton (60 mV) [26]. The UV absorption edge of the samples of R Zn−OH = 1:2 has a more significant blueshift than the samples of R Zn−OH = 1:1. The blueshift is caused by the quantum size effect. The blueshift is more obvious with a decrease in the particle size. Therefore, it can be inferred that the particle size of the ZnO QDs prepared with R Zn−OH = 1:2 is relatively smaller, which is consistent with the results of XRD and TEM. R Zn−OH has a significant effect on the UV absorption intensity of ZnO QDs. Samples with R Zn−OH = 1:1 has a stronger absorption than those with R Zn−OH = 1:2, which is consistent with the results of the infrared spectrum. The ultraviolet-visible absorption of ZnO QDs is related to the band gap energy. Because of the quantum size effect of ZnO QDs, the band gap energy increases with the decrease in the size, and the absorption edge is blue shifted in the ultraviolet-visible absorption spectrum. The difference in absorbance is because the water solubility of R Zn:OH = 1:1 is better than that of R Zn:OH = 1:2, and the content in the solution is higher, so the absorbance is relatively larger.
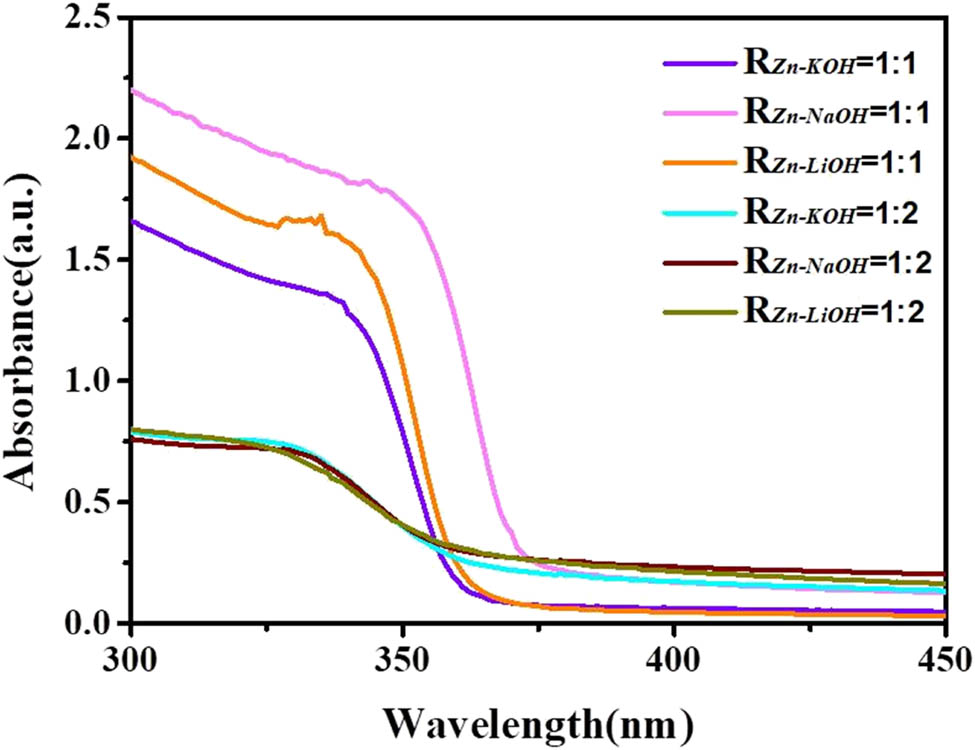
Ultraviolet-visible spectra of ZnO QDs synthesized under different alkali bases and different R Zn−OH values.
Figure 8 shows ZnO QDs (LiOH, R
Zn−OH = 1:1) solid powder under 365 nm UV lighting and visible light, which shows that ZnO QDs emit a strong yellow fluorescence under UV lighting. The solid-state fluorescence spectrum of ZnO QDs (EX = 324 nm) is shown in Figure 8. There are two fluorescence emission peaks in the spectrum, namely, a weak and sharp ultraviolet emission peak (370 nm) and a strong and broad yellow emission peak (530 nm). It is well known that the intensity of emission depends on both size and surface properties of the dots. Silica coated with ZnO QDs usually does not affect the absorption and luminescence properties of the semiconductor nanoparticles, exhibiting good optical transparency [27]. The luminescence peak at 370 nm is generated by exciton recombination [28,29], which is caused by the transition of electrons from the bottom of the conduction band of ZnO to the valence band, which constitutes the inherent fluorescence of the material. Several studies have been reported to explain the origin of broad emission from ZnO in the visible region [30,31,32]. It is reported that this band is an envelope spectrum of multiple emission bands originating from different defect centers such as zinc vacancy (VZn), zinc interstitial (Zni), oxygen vacancy (
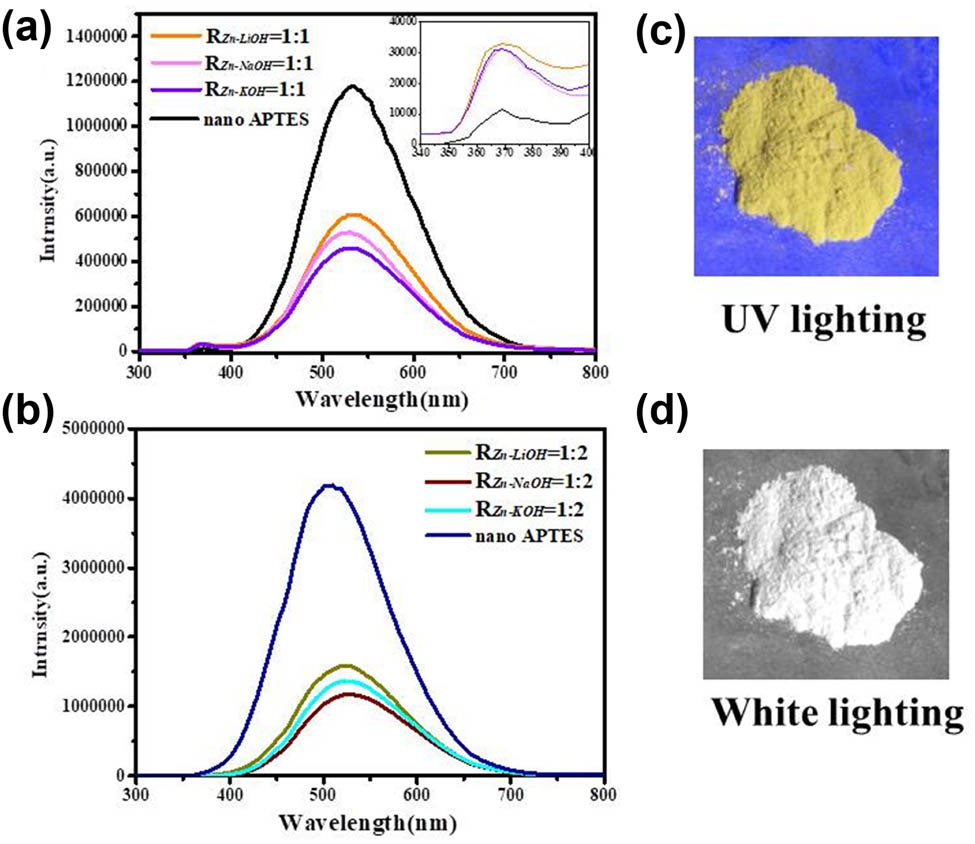
Solid-state fluorescence spectra of ZnO QDs synthesized under different alkali bases and different R Zn−OH = 1:1 (a), R Zn−OH = 1:2 (b), and fluorescence of different alkaline and R Zn−OH ratios under UV irradiation (c and d).
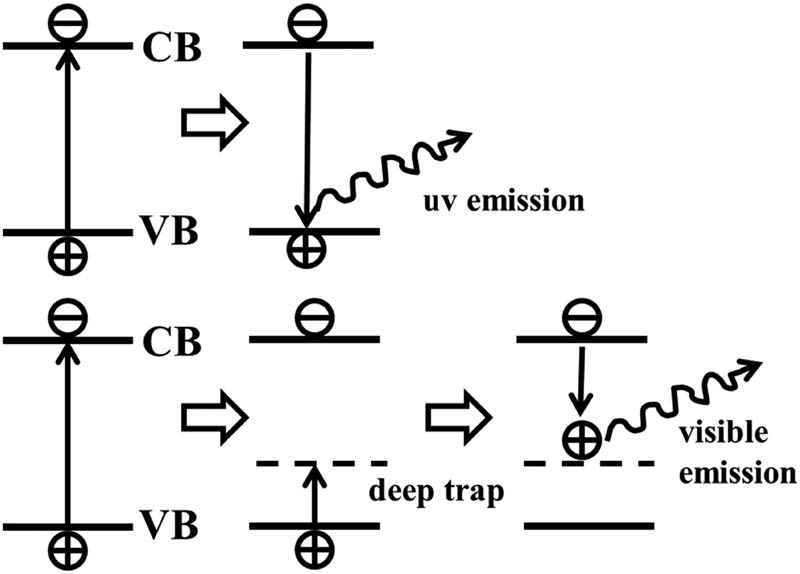
Schematic diagram of luminescence mechanism of QDs.
Figure 10 shows the difference between the liquid fluorescence spectrum of ZnO QDs (EX = 350 nm) and the solid fluorescence spectrum of ZnO QDs (EX = 324 nm). In the aqueous solution, the ZnO QDs prepared with R Zn−OH = 1:2 have almost no fluorescence emission because of its poor water solubility. The ZnO QDs prepared with R Zn−OH = 1:1 show a yellow emission peak at about 570 nm. It is different from the yellow fluorescence emission position measured in solids because aging caused the peak shift [7]. The digital photos are ZnO QDs dispersed in the ultrapure water under 365 nm UV light. It can be seen that the ZnO QDs prepared at R Zn−OH = 1:1 emit very strong yellow light, whereas the samples prepared at R Zn−OH = 1:2 hardly emit light.
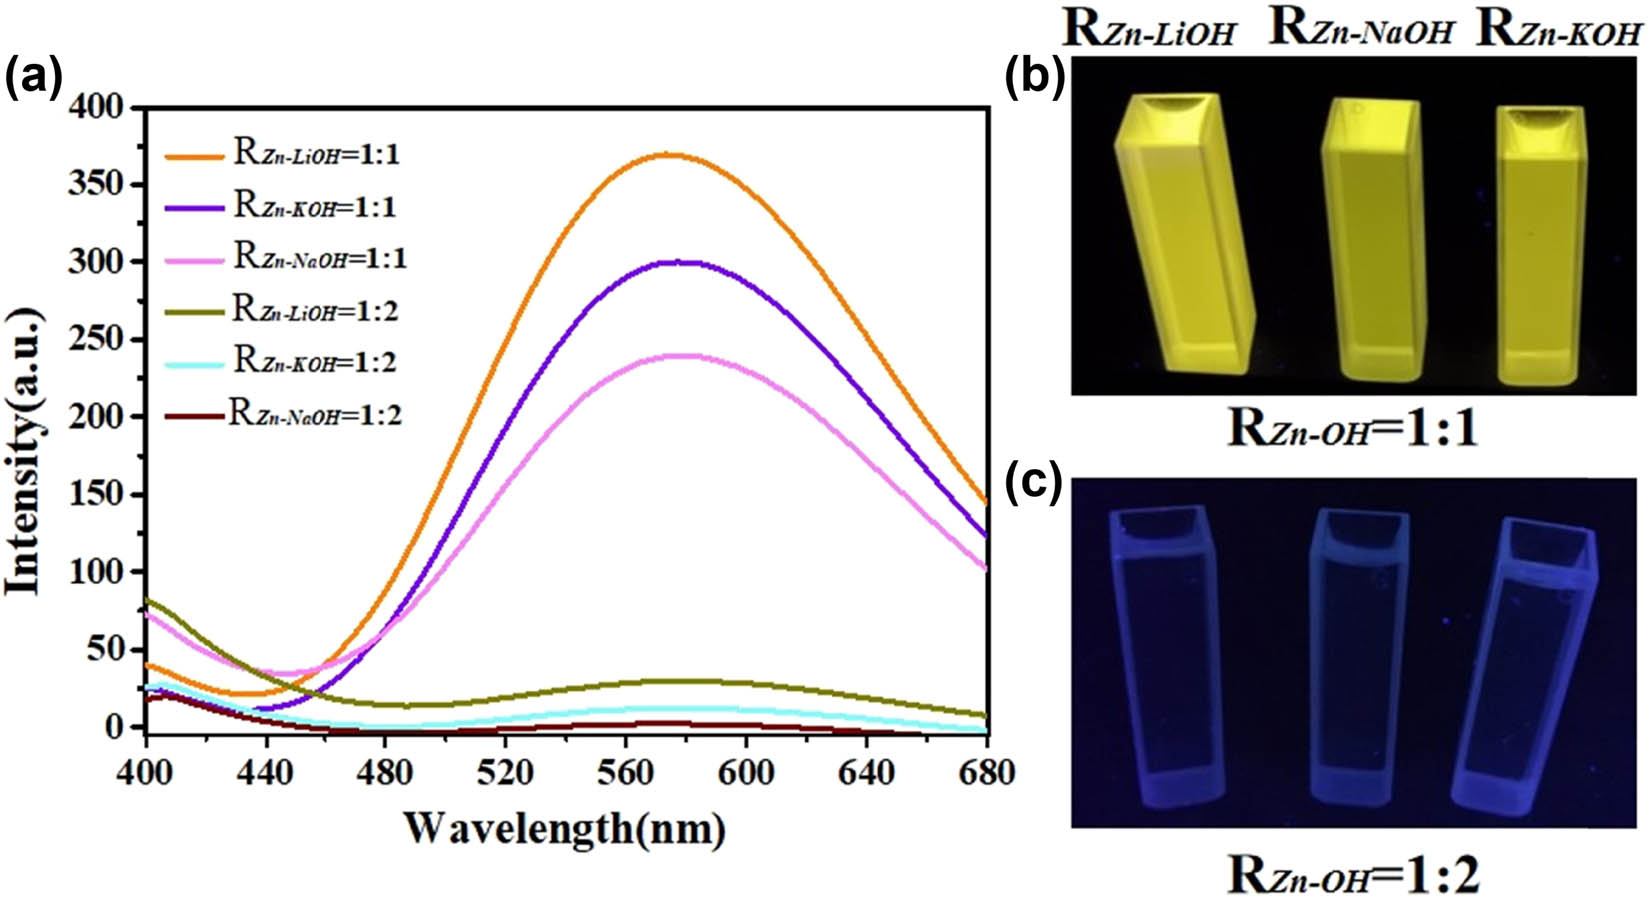
Liquid-state fluorescence spectra of ZnO QDs synthesized under different alkali bases and different R Zn−OH values (a). Images of the ZnO QDs under UV lighting and white lighting conditions (b and c).
The growth of the ZnO QDs is first through the directional attachment and bonding mechanism, and then the maturation and coarsening of Ostwald ripening [33]. But when the alkali base is KOH, it will experience the third type: secondary precipitation of ZnO QDs, which makes the particles larger. Currently, the formation mechanism of ZnO QDs is still unclear, and the different processes have been proposed because of the difference in the intermediate substances [34]. The most common nucleation and growth mechanism of ZnO QDs were proposed by Jun et al. [9]. The specific reaction is as follows:
where (ZnO) n represents the crystal nucleus, and (ZnO) n+k represents the QD grown from the crystal nucleus. Equation (1) indicates that the reaction occurs when Zn2+ and OH− mix, then generating [Zn(OH)]+. Equations (2) and (3) represent nucleation and growth, respectively. Only when the [Zn(OH)]+ concentration reaches a certain value, the reaction in equation (2) can be triggered. Once equation (2) is triggered, the reaction in equation (3) will proceed simultaneously.
The alkali bases have different dissociation constants (
4 Conclusions
ZnO QDs have a potential application in the medical fields, but the preparation of high-quality ZnO QDs is still a challenge. The alkali bases and R Zn−OH are vital factors influencing the morphology and performance of ZnO QDs in the sol–gel method. This article studies the influence of the ratio of different alkali bases (LiOH, NaOH, and KOH) and R Zn−OH on the performance of ZnO QDs. The results show that ZnO QDs can be synthesized successfully using any one of the three alkali bases, and higher OH− concentration is beneficial for forming a smaller particle size, but harmful for the water solubility and the fluorescence intensity. The difference in dissociation constants may be the major reason that influences the reaction process. The particle size of the ZnO QDs prepared using LiOH and NaOH as raw materials is smaller than that prepared using KOH. ZnO QDs prepared at the ratio of n(Zn2+):n(LiOH) = 1:1 have the best fluorescence performance and dispersibility.
-
Funding information: This work was financially supported by the Foundation of Natural Science Foundation of Jiangxi Province (Grant No. 20202BABL203041), the Research Project of Jiangxi Provincial Department of Education (GJJ190600), and the Open Fund of Pharmacy department, Jiangxi Science & Technology Normal University (Grant No. JFCEC-KF-1902).
-
Author contributions: Xilian Zhang and Shanshan Luo: data curation and original draft. Xiaodan Wu: review and editing. Minghui Feng: investigation. Yingying Li: methodology. Haoyun Han: visualization. Wenkui Li: conceptualization, review, and editing.
-
Competing interests: The authors have declared that no competing interests exist.
-
Data availability statement: The datasets generated during and/or analyzed during the current study are available from the corresponding author on reasonable request.
References
[1] Dai-Xin Y, Ying-Ying M, Wei Z, Hong-Mei C, Ji-Lie K, Huan-Ming X, et al. ZnO-based nanoplatforms for labeling and treatment of mouse tumors without detectable toxic side effects. ACS Nano. 2016;10(4):4294–300. 10.1021/acsnano.5b07846.Search in Google Scholar PubMed
[2] Chuan X, Yan Z, Peng W, Bo Z, Yukun Z. Novel surface modification of ZnO QDs for paclitaxel-targeted drug delivery for lung cancer treatment. Dose-Response. 2020;18(2):1–7. 10.1177/1559325820926739.Search in Google Scholar PubMed PubMed Central
[3] Tsukazaki A, Ohtomo A, Onuma T, Ohtani M, Makino T, Sumiya M, et al. Repeated temperature modulation epitaxy for p-type doping and light-emitting diode based on ZnO. Nat Mater. 2005;4(1):42–6. 10.1038/nmat1284.Search in Google Scholar
[4] Bruchez M, Moronne M, Gin P, Weiss S, Alivisatos AP. Semiconductor nanocrystals as fluorescent biological labels. Science. 1998;281(5385):2013–6. 10.1126/science.281.5385.2013.Search in Google Scholar PubMed
[5] Xiaosheng T, Eugene GC, Ling L, Jun D, Junmin X. Synthesis of ZnO nanoparticles with tunable emission colors and their cell labeling applications synthesis of ZnO nanoparticles with tunable emission colors and their cell labeling applications. Chem Mater. 2010;22(11):3383–8. 10.1021/cm903869r.Search in Google Scholar
[6] Lubomir S, Marc AA. Semiconductor clusters in the sol–gel process: quantized aggregation, gelation, and crystal growth in concentrated ZnO colloids. J Am Chem Soc. 1991;113(8):2826–33. 10.1021/ja00008a004.Search in Google Scholar
[7] Zhong C, XiaoXia L, Guoping D, Nan C, Andy YS. A sol–gel method for preparing ZnO quantum dots with strong blue emission. J Lumines. 2011;131(10):2072–7. 10.1016/j.jlumin.2011.05.009.Search in Google Scholar
[8] Li-Li H, Lan C, WeiHua W, JiangLong W, XiWen D. On the origin of blue emission from ZnO quantum dots synthesized by a sol–gel route. Semicond Sci Technol. 2012;27(6):065020–7.10.1088/0268-1242/27/6/065020Search in Google Scholar
[9] Jun Z, Suqing Z, Kun Z, Jianqing Z, Yanfei C. A study of photoluminescence properties and performance improvement of Cd-doped ZnO quantum dots prepared by the sol–gel method. Nanoscale Res Lett. 2012;7:1–7. 10.1186/1556-276X-7-405.Search in Google Scholar PubMed PubMed Central
[10] Panigrahi S, Bera A, Basak D. Ordered dispersion of ZnO quantum dots in SiO2 matrix and its strong emission properties. J Colloid Interface Sci. 2011;353(1):30–8. 10.1016/j.jcis.2010.09.055.Search in Google Scholar PubMed
[11] Ensafi AA, Zakery M, Rezaei B. An optical sensor with specific binding sites for the detection of thioridazine hydrochloride based on ZnO-QDs coated with molecularly imprinted polymer. Spectrochim Acta A Mol Biomol Spectrosc. 2019;206:460–5. 10.1016/j.saa.2018.08.040.Search in Google Scholar PubMed
[12] Haghani SH, Ensafi AA, Kazemifard N, Rezaei B. Development of a selective and sensitive chlorogenic acid fluorimetric sensor using molecularly imprinted polymer ZnO quantum dots. IEEE Sens J. 2020;20(11):5691–7.10.1109/JSEN.2020.2972040Search in Google Scholar
[13] Ali F, Mona A, Shiva T. Degradation of toxin via ultraviolet and sunlight photocatalysis using ZnO quantum dots/CuO nanosheets composites: preparation and characterization studies. J Mater Sci-Mater Electron. 2017;28(21):16397402. 10.1007/s10854-017-7550-x.Search in Google Scholar
[14] Lei S, Zhixian L, Xiongtu Z, Yongai Z, Tailiang G. Synthesis of Cu-doped ZnO quantum dots and their applications in field emission. J Alloy Compd. 2016;671:473–8. 10.1016/j.jallcom.2016.02.136.Search in Google Scholar
[15] Talapin DV, Rogach AL, Shevchenko EV. Dynamic distribution of growth rates within the ensembles of colloidal II–VI and III–V semiconductor nanocrystals as a factor governing their photoluminescence efficiency. J Am Chem. 2002;124(20):5782–90. 10.1021/ja0123599.Search in Google Scholar PubMed
[16] Zhang J, Zhang R, Zhao L-H, Sun S-Q. Synthesis of water-soluble γ-aminopropyl triethoxysilane-capped ZnO:MgO nanocrystals with biocompatibility. Cryst Eng Comm. 2012;14:613–9. 10.1039/C1CE05941F.Search in Google Scholar
[17] Karakoti A-S, Shukla R, Shanker R. Surface functionalization of quantum dots for biological applications. Adv Colloid Interface. 2015;215:28–45. 10.1016/j.cis.2014.11.004.Search in Google Scholar PubMed
[18] Patra MK, Manoth M, Singh VK, Siddaramana Gowd G, Choudhry VS, Vadera SR, et al. Synthesis of stable dispersion of ZnO quantum dots in aqueous medium showing visible emission from bluish green to yellow. J Lumines. 2009;129(3):320–4. 10.1016/j.jlumin.2008.10.014.Search in Google Scholar
[19] Zhao L, Zhang R, Zhang J, Sun S-Q. Synthesis and characterization of biocompatible ZnO nanoparticles. CrystEngComm. 2012;14(3):945–50. 10.1039/C1CE05621B.Search in Google Scholar
[20] Park WI, Yi GC, Kim MY, Pennycook SJ. Quantum confinement observed in ZnO/ZnMgO nanorod heterostructures. Adv Mater. 2003;15(6):526–9. 10.1002/adma.200390122.Search in Google Scholar
[21] Ye YF. Photoluminescence property adjustment of ZnO quantum dots synthesized via sol–gel method. J Mater Sci-Mater Electron. 2018;29(6):4967–74.10.1007/s10854-017-8457-2Search in Google Scholar
[22] Singh J, Bhartimittu D, Chauhan A, Singla ML. Role of alkali metal hydroxide in controlling the size of ZnO nanoparticles in non-aqueous medium. Int J Fundam Appl Sci. 2012;1(4):91–3.Search in Google Scholar
[23] Anzlovar A, Kogej K, Orel Z-C. Impact of inorganic hydroxides on ZnO nanoparticle formation and morphology. Cryst Growth Des. 2014;14(9):4262–9. 10.1021/cg401870e.Search in Google Scholar
[24] Huang WL, Lv XW, Tan JL, Huang QM, Cheng H, Feng J, et al. Regulable preparation of the oxygen vacancy of ZnO QDs and their fluorescence performance. J Mol Structure. 2019;1195:653–8. 10.1016/j.molstruc.2019.05.105.Search in Google Scholar
[25] Caetano BL, Silva MN, Santili CV, Briois V, Pulcinelli SH. Unified ZnO Q-dot growth mechanism from simultaneous UV–Vis and EXAFS monitoring of sol–gel reactions induced by different alkali base. Opt Mater. 2016;61:92–7. 10.1016/j.optmat.2016.06.038.Search in Google Scholar
[26] Tang ZK, Wong GKL, Yu P, Kawasaki M, Ohtomo A. Room-temperature ultraviolet laser emission from self-assembled ZnO microcrystallite thin films. Appl Phys Lett. 1998;72(25):3270–2. 10.1063/1.121620.Search in Google Scholar
[27] Lu Y, Yin Y, Li Z-Y, Xia Y. Synthesis and self-assembly of Au@SiO2 core−shell colloids. Nano Lett. 2002;2(7):785–8. 10.1021/nl025598i.Search in Google Scholar
[28] Yu SH, Oshimura MY, Calderon-Moreno JM, Fujiwara T, Fujino T, Teranishi R. In situ fabrication and optical properties of a novel polystyrene/semiconductor nanocomposite embedded with CdS nanowires by a soft solution processing route. Langmuir. 2001;17(5):1700–7. 10.1021/la000941p.Search in Google Scholar
[29] Wang X, Yang S, Wang J, Li M, Jiang X, Du G, et al. Structural and optical properties of ZnO film by plasma-assisted MOCVD. Opt Quantum Electron. 2002;34(9):883. 10.1023/A:1019956323462.Search in Google Scholar
[30] Mohanta A, Thareja RK. Photoluminescence study of ZnO nanowires grown by thermal evaporation on pulsed laser deposited ZnO buffer layer. J Appl Phys. 2008;104(4):044906. 10.1063/1.2969908.Search in Google Scholar
[31] Lin B, Fu Z, Jia Y. Green luminescent center in undoped zinc oxide films deposited on silicon substrates. J Appl Phys. 2001;79(7):943–5. 10.1063/1.1394173.Search in Google Scholar
[32] van Dijken A, Meulenkamp EA, Vanmaekelbergh D, Meijerink A. The luminescence of nanocrystalline ZnO particles: the mechanism of the ultraviolet and visible emission. J Lumines. 2004;87–89:454–6. 10.1016/S0022-2313(99)00482-2.Search in Google Scholar
[33] Pesika NS, Setbe KJ, Searson PC. Relationship between absorbance spectra and particle size distributions for quantum-sized nanocrystals. J Phys Chem B. 2003;107:10412–5. 10.1021/jp0303218.Search in Google Scholar
[34] Patra MK, Manzoor K, Manoth M, Choudhry VS, Vadera SR, Kumar N. Optically transparent colloidal suspensions of single crystalline ZnO quantum dots prepared by simple wet-chemistry. J Optoelectron Adv Mater. 2008;10(10):2588–91. 10.1021/ja028416v.Search in Google Scholar PubMed
© 2021 Xilian Zhang et al., published by De Gruyter
This work is licensed under the Creative Commons Attribution 4.0 International License.
Articles in the same Issue
- Regular Articles
- Qualitative and semi-quantitative assessment of anthocyanins in Tibetan hulless barley from different geographical locations by UPLC-QTOF-MS and their antioxidant capacities
- Effect of sodium chloride on the expression of genes involved in the salt tolerance of Bacillus sp. strain “SX4” isolated from salinized greenhouse soil
- GC-MS analysis of mango stem bark extracts (Mangifera indica L.), Haden variety. Possible contribution of volatile compounds to its health effects
- Influence of nanoscale-modified apatite-type calcium phosphates on the biofilm formation by pathogenic microorganisms
- Removal of paracetamol from aqueous solution by containment composites
- Investigating a human pesticide intoxication incident: The importance of robust analytical approaches
- Induction of apoptosis and cell cycle arrest by chloroform fraction of Juniperus phoenicea and chemical constituents analysis
- Recovery of γ-Fe2O3 from copper ore tailings by magnetization roasting and magnetic separation
- Effects of different extraction methods on antioxidant properties of blueberry anthocyanins
- Modeling the removal of methylene blue dye using a graphene oxide/TiO2/SiO2 nanocomposite under sunlight irradiation by intelligent system
- Antimicrobial and antioxidant activities of Cinnamomum cassia essential oil and its application in food preservation
- Full spectrum and genetic algorithm-selected spectrum-based chemometric methods for simultaneous determination of azilsartan medoxomil, chlorthalidone, and azilsartan: Development, validation, and application on commercial dosage form
- Evaluation of the performance of immunoblot and immunodot techniques used to identify autoantibodies in patients with autoimmune diseases
- Computational studies by molecular docking of some antiviral drugs with COVID-19 receptors are an approach to medication for COVID-19
- Synthesis of amides and esters containing furan rings under microwave-assisted conditions
- Simultaneous removal efficiency of H2S and CO2 by high-gravity rotating packed bed: Experiments and simulation
- Design, synthesis, and biological activities of novel thiophene, pyrimidine, pyrazole, pyridine, coumarin and isoxazole: Dydrogesterone derivatives as antitumor agents
- Content and composition analysis of polysaccharides from Blaps rynchopetera and its macrophage phagocytic activity
- A new series of 2,4-thiazolidinediones endowed with potent aldose reductase inhibitory activity
- Assessing encapsulation of curcumin in cocoliposome: In vitro study
- Rare norisodinosterol derivatives from Xenia umbellata: Isolation and anti-proliferative activity
- Comparative study of antioxidant and anticancer activities and HPTLC quantification of rutin in white radish (Raphanus sativus L.) leaves and root extracts grown in Saudi Arabia
- Comparison of adsorption properties of commercial silica and rice husk ash (RHA) silica: A study by NIR spectroscopy
- Sodium borohydride (NaBH4) as a high-capacity material for next-generation sodium-ion capacitors
- Aroma components of tobacco powder from different producing areas based on gas chromatography ion mobility spectrometry
- The effects of salinity on changes in characteristics of soils collected in a saline region of the Mekong Delta, Vietnam
- Synthesis, properties, and activity of MoVTeNbO catalysts modified by zirconia-pillared clays in oxidative dehydrogenation of ethane
- Synthesis and crystal structure of N,N′-bis(4-chlorophenyl)thiourea N,N-dimethylformamide
- Quantitative analysis of volatile compounds of four Chinese traditional liquors by SPME-GC-MS and determination of total phenolic contents and antioxidant activities
- A novel separation method of the valuable components for activated clay production wastewater
- On ve-degree- and ev-degree-based topological properties of crystallographic structure of cuprite Cu2O
- Antihyperglycemic effect and phytochemical investigation of Rubia cordifolia (Indian Madder) leaves extract
- Microsphere molecularly imprinted solid-phase extraction for diazepam analysis using itaconic acid as a monomer in propanol
- A nitric oxide-releasing prodrug promotes apoptosis in human renal carcinoma cells: Involvement of reactive oxygen species
- Machine vision-based driving and feedback scheme for digital microfluidics system
- Study on the application of a steam-foam drive profile modification technology for heavy oil reservoir development
- Ni–Ru-containing mixed oxide-based composites as precursors for ethanol steam reforming catalysts: Effect of the synthesis methods on the structural and catalytic properties
- Preparation of composite soybean straw-based materials by LDHs modifying as a solid sorbent for removal of Pb(ii) from water samples
- Synthesis and spectral characterizations of vanadyl(ii) and chromium(iii) mixed ligand complexes containing metformin drug and glycine amino acid
- In vitro evaluation of lactic acid bacteria with probiotic activity isolated from local pickled leaf mustard from Wuwei in Anhui as substitutes for chemical synthetic additives
- Utilization and simulation of innovative new binuclear Co(ii), Ni(ii), Cu(ii), and Zn(ii) diimine Schiff base complexes in sterilization and coronavirus resistance (Covid-19)
- Phosphorylation of Pit-1 by cyclin-dependent kinase 5 at serine 126 is associated with cell proliferation and poor prognosis in prolactinomas
- Molecularly imprinted membrane for transport of urea, creatinine, and vitamin B12 as a hemodialysis candidate membrane
- Optimization of Murrayafoline A ethanol extraction process from the roots of Glycosmis stenocarpa, and evaluation of its Tumorigenesis inhibition activity on Hep-G2 cells
- Highly sensitive determination of α-lipoic acid in pharmaceuticals on a boron-doped diamond electrode
- Synthesis, chemo-informatics, and anticancer evaluation of fluorophenyl-isoxazole derivatives
- In vitro and in vivo investigation of polypharmacology of propolis extract as anticancer, antibacterial, anti-inflammatory, and chemical properties
- Topological indices of bipolar fuzzy incidence graph
- Preparation of Fe3O4@SiO2–ZnO catalyst and its catalytic synthesis of rosin glycol ester
- Construction of a new luminescent Cd(ii) compound for the detection of Fe3+ and treatment of Hepatitis B
- Investigation of bovine serum albumin aggregation upon exposure to silver(i) and copper(ii) metal ions using Zetasizer
- Discoloration of methylene blue at neutral pH by heterogeneous photo-Fenton-like reactions using crystalline and amorphous iron oxides
- Optimized extraction of polyphenols from leaves of Rosemary (Rosmarinus officinalis L.) grown in Lam Dong province, Vietnam, and evaluation of their antioxidant capacity
- Synthesis of novel thiourea-/urea-benzimidazole derivatives as anticancer agents
- Potency and selectivity indices of Myristica fragrans Houtt. mace chloroform extract against non-clinical and clinical human pathogens
- Simple modifications of nicotinic, isonicotinic, and 2,6-dichloroisonicotinic acids toward new weapons against plant diseases
- Synthesis, optical and structural characterisation of ZnS nanoparticles derived from Zn(ii) dithiocarbamate complexes
- Presence of short and cyclic peptides in Acacia and Ziziphus honeys may potentiate their medicinal values
- The role of vitamin D deficiency and elevated inflammatory biomarkers as risk factors for the progression of diabetic nephropathy in patients with type 2 diabetes mellitus
- Quantitative structure–activity relationship study on prolonged anticonvulsant activity of terpene derivatives in pentylenetetrazole test
- GADD45B induced the enhancing of cell viability and proliferation in radiotherapy and increased the radioresistance of HONE1 cells
- Cannabis sativa L. chemical compositions as potential plasmodium falciparum dihydrofolate reductase-thymidinesynthase enzyme inhibitors: An in silico study for drug development
- Dynamics of λ-cyhalothrin disappearance and expression of selected P450 genes in bees depending on the ambient temperature
- Identification of synthetic cannabinoid methyl 2-{[1-(cyclohexylmethyl)-1H-indol-3-yl] formamido}-3-methylbutanoate using modern mass spectrometry and nuclear magnetic resonance techniques
- Study on the speciation of arsenic in the genuine medicinal material honeysuckle
- Two Cu(ii)-based coordination polymers: Crystal structures and treatment activity on periodontitis
- Conversion of furfuryl alcohol to ethyl levulinate in the presence of mesoporous aluminosilicate catalyst
- Review Articles
- Hsien Wu and his major contributions to the chemical era of immunology
- Overview of the major classes of new psychoactive substances, psychoactive effects, analytical determination and conformational analysis of selected illegal drugs
- An overview of persistent organic pollutants along the coastal environment of Kuwait
- Mechanism underlying sevoflurane-induced protection in cerebral ischemia–reperfusion injury
- COVID-19 and SARS-CoV-2: Everything we know so far – A comprehensive review
- Challenge of diabetes mellitus and researchers’ contributions to its control
- Advances in the design and application of transition metal oxide-based supercapacitors
- Color and composition of beauty products formulated with lemongrass essential oil: Cosmetics formulation with lemongrass essential oil
- The structural chemistry of zinc(ii) and nickel(ii) dithiocarbamate complexes
- Bioprospecting for antituberculosis natural products – A review
- Recent progress in direct urea fuel cell
- Rapid Communications
- A comparative morphological study of titanium dioxide surface layer dental implants
- Changes in the antioxidative properties of honeys during their fermentation
- Erratum
- Erratum to “Corrosion study of copper in aqueous sulfuric acid solution in the presence of (2E,5E)-2,5-dibenzylidenecyclopentanone and (2E,5E)-bis[(4-dimethylamino)benzylidene]cyclopentanone: Experimental and theoretical study”
- Erratum to “Modified TDAE petroleum plasticiser”
- Corrigendum
- Corrigendum to “A nitric oxide-releasing prodrug promotes apoptosis in human renal carcinoma cells: Involvement of reactive oxygen species”
- Special Issue on 3rd IC3PE 2020
- Visible light-responsive photocatalyst of SnO2/rGO prepared using Pometia pinnata leaf extract
- Antihyperglycemic activity of Centella asiatica (L.) Urb. leaf ethanol extract SNEDDS in zebrafish (Danio rerio)
- Selection of oil extraction process from Chlorella species of microalgae by using multi-criteria decision analysis technique for biodiesel production
- Special Issue on the 14th Joint Conference of Chemistry (14JCC)
- Synthesis and in vitro cytotoxicity evaluation of isatin-pyrrole derivatives against HepG2 cell line
- CO2 gas separation using mixed matrix membranes based on polyethersulfone/MIL-100(Al)
- Effect of synthesis and activation methods on the character of CoMo/ultrastable Y-zeolite catalysts
- Special Issue on Electrochemical Amplified Sensors
- Enhancement of graphene oxide through β-cyclodextrin composite to sensitive analysis of an antidepressant: Sulpiride
- Investigation of the spectroelectrochemical behavior of quercetin isolated from Zanthoxylum bungeanum
- An electrochemical sensor for high sensitive determination of lysozyme based on the aptamer competition approach
- An improved non-enzymatic electrochemical sensor amplified with CuO nanostructures for sensitive determination of uric acid
- Special Issue on Applied Biochemistry and Biotechnology 2020
- Fast discrimination of avocado oil for different extracted methods using headspace-gas chromatography-ion mobility spectroscopy with PCA based on volatile organic compounds
- Effect of alkali bases on the synthesis of ZnO quantum dots
- Quality evaluation of Cabernet Sauvignon wines in different vintages by 1H nuclear magnetic resonance-based metabolomics
- Special Issue on the Joint Science Congress of Materials and Polymers (ISCMP 2019)
- Diatomaceous Earth: Characterization, thermal modification, and application
- Electrochemical determination of atenolol and propranolol using a carbon paste sensor modified with natural ilmenite
- Special Issue on the Conference of Energy, Fuels, Environment 2020
- Assessment of the mercury contamination of landfilled and recovered foundry waste – a case study
- Primary energy consumption in selected EU Countries compared to global trends
- Modified TDAE petroleum plasticiser
- Use of glycerol waste in lactic acid bacteria metabolism for the production of lactic acid: State of the art in Poland
- Topical Issue on Applications of Mathematics in Chemistry
- Theoretical study of energy, inertia and nullity of phenylene and anthracene
- Banhatti, revan and hyper-indices of silicon carbide Si2C3-III[n,m]
- Topical Issue on Agriculture
- Occurrence of mycotoxins in selected agricultural and commercial products available in eastern Poland
- Special Issue on Ethnobotanical, Phytochemical and Biological Investigation of Medicinal Plants
- Acute and repeated dose 60-day oral toxicity assessment of chemically characterized Berberis hispanica Boiss. and Reut in Wistar rats
- Phytochemical profile, in vitro antioxidant, and anti-protein denaturation activities of Curcuma longa L. rhizome and leaves
- Antiplasmodial potential of Eucalyptus obliqua leaf methanolic extract against Plasmodium vivax: An in vitro study
- Prunus padus L. bark as a functional promoting component in functional herbal infusions – cyclooxygenase-2 inhibitory, antioxidant, and antimicrobial effects
- Molecular and docking studies of tetramethoxy hydroxyflavone compound from Artemisia absinthium against carcinogens found in cigarette smoke
- Special Issue on the Joint Science Congress of Materials and Polymers (ISCMP 2020)
- Preparation of cypress (Cupressus sempervirens L.) essential oil loaded poly(lactic acid) nanofibers
- Influence of mica mineral on flame retardancy and mechanical properties of intumescent flame retardant polypropylene composites
- Production and characterization of thermoplastic elastomer foams based on the styrene–ethylene–butylene–styrene (SEBS) rubber and thermoplastic material
- Special Issue on Applied Chemistry in Agriculture and Food Science
- Impact of essential oils on the development of pathogens of the Fusarium genus and germination parameters of selected crops
- Yield, volume, quality, and reduction of biotic stress influenced by titanium application in oilseed rape, winter wheat, and maize cultivations
- Influence of potato variety on polyphenol profile composition and glycoalcaloid contents of potato juice
- Carryover effect of direct-fed microbial supplementation and early weaning on the growth performance and carcass characteristics of growing Najdi lambs
- Special Issue on Applied Biochemistry and Biotechnology (ABB 2021)
- The electrochemical redox mechanism and antioxidant activity of polyphenolic compounds based on inlaid multi-walled carbon nanotubes-modified graphite electrode
- Study of an adsorption method for trace mercury based on Bacillus subtilis
- Special Issue on The 1st Malaysia International Conference on Nanotechnology & Catalysis (MICNC2021)
- Mitigating membrane biofouling in biofuel cell system – A review
- Mechanical properties of polymeric biomaterials: Modified ePTFE using gamma irradiation