
Simultaneous removal efficiency of H2S and CO2 by high-gravity rotating packed bed: Experiments and simulation
-
Lien Thi Tran
 and
Manh Van Do
and
Manh Van Do

Abstract
This study explores the possibility of applying high-gravity rotating packed bed (HGRPB) in removing H2S and CO2 from biogas. Ca(OH)2 aqueous solution was used as the absorbent in this study. Different experimental conditions including solution pH, rotating speed (R S) of HGRPB, gas flow rate (Q G), and liquid flow rate (Q L) were investigated with respect to the removal efficiency (E) of H2S and CO2. The experimental and simulated results show that the optimal removal efficiency of H2S and CO2 using HGRPB achieved nearly the same as 99.38 and 99.56% for removal efficiency of H2S and 77.28 and 77.86% for removal efficiency of CO2, respectively. Such efficiencies corresponded with the following optimal conditions: a solution pH of 12.26, HGRPB reactor with the rotating speed of 1,200 rpm, the gas flow rate of 2.46 (L/min), and the liquid flow rate of 0.134 (L/min).
1 Introduction
The current trend of energy production is shifting toward environmentally friendly forms of green energy due to the scarcity and depleting status of fossil fuel sources. Of which, biogas fuels have been attracting research attention from scientists in recent years. Biogas is a mixture of many different gases generated from the decomposition of organic compounds in an anaerobic process with the main participation of methane-producing bacteria (methanogen) or anaerobic digestion organisms [1]. The usable materials in biogas production are diverse, ranging from agricultural waste, manure, municipal waste, wastewater, food waste, to sludge from the wastewater treatment plant. Biogas is primarily composed of methane (CH4), carbon dioxide (CO2), hydrogen sulfide (H2S), moisture, and siloxane [2]. A large proportion of biogas components belong to hydrogen sulfide (H2S) and CO2; however, they are responsible for a number of drawbacks. At high concentrations, H2S is a toxic gas and could cause erosion at metal contact surfaces [3,4,5]. Although CO2 is not as corrosive as H2S, it could reduce the calorific value of biogas fuel when existing in large amounts. To improve the applicability of biogas, especially for electricity generation, the purification of biogas to biomethane is considered as a crucial process. Two main steps to convert biogas to biomethane are as follows: (1) cleaning process to remove polluting components such as H2S, CO2, H2O, and NH3 and (2) upgrading process to improve the thermoelectric response of the gas for power generation [2].
Recent studies involving the removal of contaminants such as H2S, CO2, H2O, NH3, or siloxanes in biogas often adopt diverse methods. The biological process is commonly used to utilize living organisms in the conversion of contaminants into less harmful forms. Another popular pathway is to use physicochemical techniques that include reactive and nonreactive absorption [6,7,8,9]. The latter has been attracting more attention due to its advantage in terms of removal efficiency and applicability in larger-scale implementations. Water and organic solvent are frequently used in physicochemical processes to eliminate CO2 and H2S. Water has been referred as a popular absorbent [10]; other publications presented that CO2 and H2S can be removed from using absorption processes that rely on binding force difference between more polar CO2 or H2S and nonpolar methane [11,12,13]. Previous results presented another technique that involves high-pressure water scrubbing technology to remove CO2 and H2S [14,15]. The aqueous absorbents that were frequently used to reduce the contaminants include mono ethanolamine (MEA), di-methyl ethanolamine (DMEA), KOH, K2CO3, NaOH, Fe(OH)3, and FeCl2 [16,17]. On another aspect, specialized microorganisms might also be considered to use biological methods to reduce H2S in biogas via converting it to elemental sulfur and some sulfates [18,19].
Among three operating modes of gas–liquid flow: forward, backflow, and cross-flow, backflow mode has the largest mass transfer force but requires a higher gas pressure to push gas from the bottom to the top of the device. Crossflow mode is rarely used in practical applications due to the complex device equipment. High-gravity rotating packed bed (HGRPB) has been the typical process that enhances contact and mass transfer between phases [20]. In this technique, the flow of gas–liquid into the device forms a centrifugal eddy current between the gas and liquid phases, which greatly aids the process of transferring the mass between the gas and liquid phases. The gas–liquid contacting inside HGRPB creates thinner film membranes (1–10 µm) or smaller droplets (10–100 µm) that increase the contact surface between the liquid and gas phases [20,21]. This process has been widely applied in several fields such as nanoparticle fabrication [22,23], extract separation process [24,25], and reaction acceleration [26,27]. In the field of environmental engineering, HGRPB is used in the wastewater treatment [28,29], CO2 capturing [30,31,32], and NO2 and H2S removal [33,34,35,36,37]. Therefore, the HGRPB reactor is applied in this study to enhance removal efficiency of CO2 and H2S in biogas production. The results are expected to contribute to the process intensification of biogas-based power generation and demonstrate the feasibility of HGRPG in real-scale applications.
In this study, the main objective was to investigate the performance of the HGRPB used for upgrading the simultaneous removal of CO2 and H2S from biogas using Ca(OH)2 solution as an absorbent. Effects of pH correlated to Ca(OH)2 concentration added, rotating speed (R S) of HGRPB reactor, gas flow rate (Q G), and liquid flow rate (Q L) on removal efficiency (E) of H2S and CO2 in raw biogas production were evaluated and simulated through absorption experiments in a pilot-scale HGRPB system. The optimal obtained results were simulated and calculated by modeling. The experimental and simulated results are expected to contribute to the process intensification of biogas-based power generation and demonstrate the feasibility of HGRPG in real-scale applications.
2 Materials and methods
2.1 Materials and experimental apparatus
The raw biogas used for this study was obtained from an anaerobic sludge system of a brewery wastewater treatment facility, and the composition of the gas was illustrated in Table 1. The composition of the input biogas was setup for all experiments with a CO2 concentration of 19.44–28.01%, H2S concentration of 800–900 ppm, and CH4 concentration of 40.3–55.5%. The organic sludge, after being collected from the thickening tank, was pumped into the equalization tank for pH, organic, and nutrient control. Afterward, the sludge was transferred into the anaerobic system with the real pilot operation parameters as follows: digestion tank volume of 80 m3, sludge rotating speed of 20 rpm, sludge retention time of 25 days, and digested temperature of around 32–35°C (Figure 1). The digested sludge has been composted to produce organic composting, and the electricity is used to supply for the wastewater system. In each experiment setup for the removal of hydrogen sulfide (H2S) and carbon dioxide (CO2), raw biogas is introduced from the bottom of the HGRPB device at the confirmed initial concentration of CO2 and H2S through the HGRPB instrument containing absorbents.
Composition of input biogas
| Parameter | Unit | Concentration |
|---|---|---|
| CO2 | (%) | 19.44–28.01 |
| H2S | (ppm) | 800–900 |
| CH4 | (%) | 40.3–55.5 |
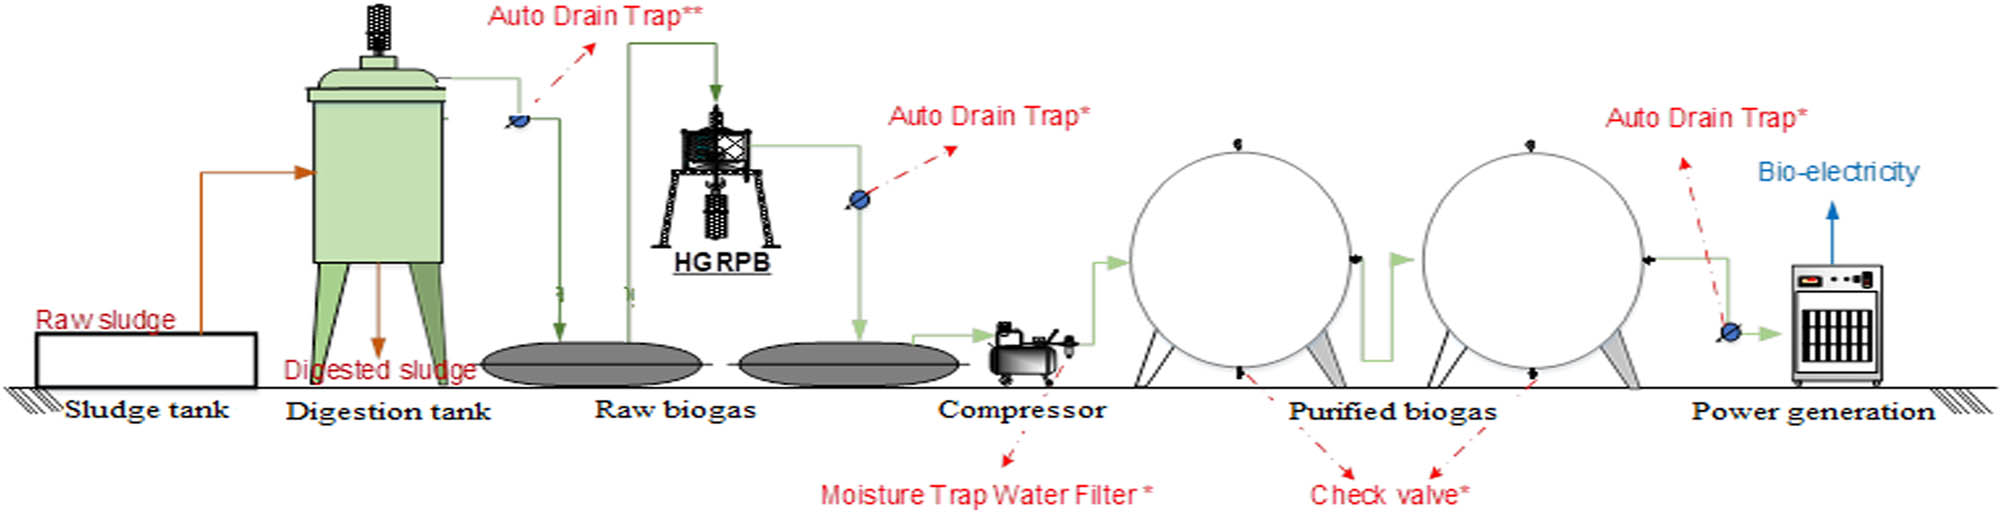
Scheme of a pilot-scale process to generate raw biogas from sludge anaerobic digestion system and purification by HGRPB for generation.
In this study, the high-gravity rotating packed bed instrument is made from stainless steel with a body height of 6 cm, an internal diameter of 21 cm, an outer diameter of 38 cm, a porosity of 97, and a total specific surface area of 50 m2/m3 (Figure 2). The HGRPB instrument is motorized by a centrifugal rotary motor with adjustable rotating speed ranging from 50 to 1,700 rpm.
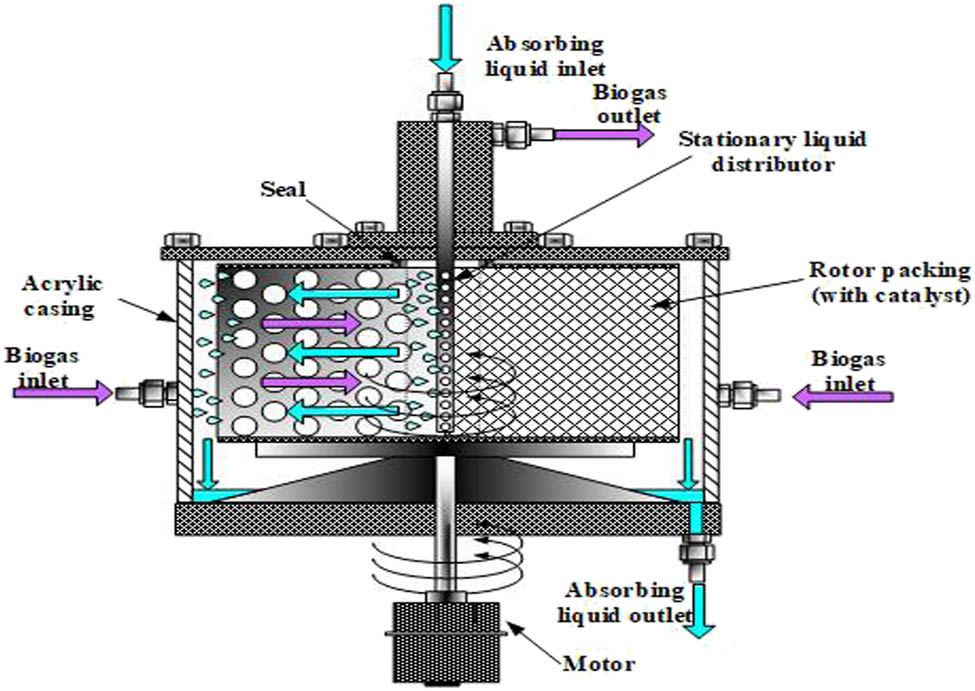
Principle of operation of the HGRPB for biogas purification.
2.2 Experimental procedure
The raw biogas mixture is introduced from the bottom of the HGRPB device. The Ca(OH)2 absorbent (M = 315.47, 98% purity; Merck, Darmstadt, Germany) solution with different initial concentrations (0.01 and 0.1 M) enters from the top of the device and is evenly sprayed inside by centrifugal force and a mesh distribution system. It is ensured that the process of mass transfer from the gas phase to the liquid phase takes place steadily. After the process, the purified biogas flow is released from the top of the HGRPB device and the adsorbed solution is removed below the HGRPB device (Figure 2). All the experiments were carried out in triplicate for each condition setup. The feed gas and the treated gas of H2S and CO2 were sampled for the analysis of H2S and CO2 concentration for removal efficiencies.
2.3 Methods of analysis
The concentrations of H2S and CO2 in the input and treated gas stream are determined according to the method of ASTM D 5504-12 by gas chromatography. A chromatography (GC 2010 Shimadzu, Japan) with a thermal con;ductivity detector (TCD) was introduced. Samples were injected using a gas-tight syringe (Hamilton, USA). The pH value of the solution is measured according to the method of ISO 10523:2008 by Horiba U-52G multi-parameter water quality meter.
The removal efficiency (E) of H2S and CO2 is calculated by the following equation:
where C 0 is the initial concentration of H2S (ppm) or CO2 (%) and C 1 is the concentration of H2S (ppm) or CO2 (%) after purification.
All the experiments were carried out in triplicate to produce mean values and standard deviations. Microsoft Excel was used to analyze the data.
2.4 Response surface methodology (RSM) optimization and its experimental design
The response surface methodology, in conjunction with the Box–Behnken design, was used to estimate the effect of four parameters (rotating speed, liquid flow rate, gas flow rate, and effect of pH correlated to Ca(OH)2 concentration added) on removal efficiency (E) of H2S and CO2 in raw biogas production. The procedure for the construction of 29 experiments – designed matrix with the mathematical-statistical treatments and the determination of optimal conditions were executed using Design-Expert 7.0 software.
To optimize four experimental parameters (rotating speed, liquid flow rate, gas flow rate, and pH correlated to Ca(OH)2 concentration added) with respect to removal efficiency (E) of H2S and CO2 in raw biogas production, a response surface methodology routine was used in combination with Box–Behnken experimental design. Based on single-factor investigation results, 29 combinations of parameters were produced using the experimental design, and these parameters were attempted in actual experimental runs to generate the data for model estimation. Then, ANOVA analysis was employed to test model validity. From the estimated model, optimal conditions were calculated. Final optimized parameters were then verified by another actual experiment. The generation of experiment design and estimation of model parameters was performed in Design-Expert software. The second-order equation representing the influence of variables and their interaction on the response is shown as follows:
where
-
Ethical approval: The conducted research is not related to either human or animal use.
3 Results and discussion
3.1 Effect of pH on H2S and CO2 removal
A solution of Ca(OH)2 was used as an absorbent and controlled the desired pH value for evaluation of the removal efficiency of H2S and CO2. Initial aqueous solutions of Ca(OH)2 0.01 and 0.1 M are used to control pH for experiments in the investigation of CO2 and H2S removal. However, experiments of pH 13 are difficult to obtain as desire; thus, NaOH solution 1 M is added into the reactor to evaluate compared experiments. The input gases including CO2 concentration of 19.44–28.01%, H2S concentration of 800–900 ppm, and CH4 concentration of 40.3–55.5% were setup in the device of the HGRPB with a rotating speed of 900 rpm, gas flow rate of 2.5 (L/min), Ca(OH)2 solution – liquid flow rate of 0.125 (L/min). Experiments with pH 10, 11, 12, and 13 in the HGRPB reactor were investigated. The obtained results of H2S and CO2 removal by the HGRPB are shown in Figure 3.
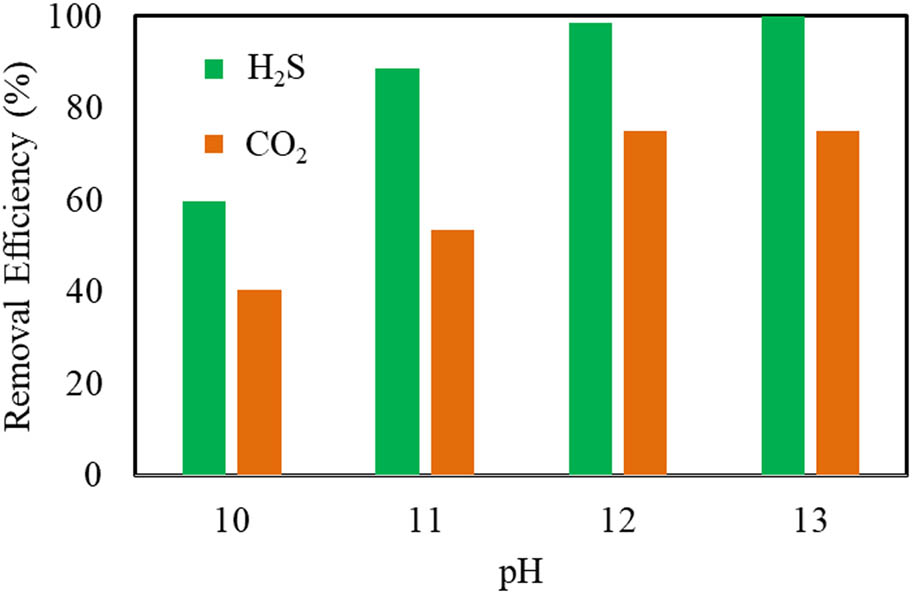
Effect of pH on the removal efficiency of H2S and CO2.
Generally, increasing the pH of the solution led to improved removal efficiencies of both CO2 and H2S in biogas. This is explained by the greater number of OH– ions per unit volume caused by higher Ca(OH)2 concentrations, which promote the absorption of H2S and CO2. Moreover, the movement of H2S and CO2 from gas to gas–liquid interface and eventually to the liquid phase in the Ca(OH)2 solution in HGRPB could accelerate the reactions. It was also indicated that the removal efficiency increases rapidly when increasing the pH from 10 to 12, corresponding to the fast increase efficiency from 59.67 to 98.62% for H2S, and from 40.45 to 76.23% for CO2. However, increasing the pH from 12 to 13 did not cause the removal performances to change significantly. Referring to several previous works, it was shown that one study reported CO2 removal of only 47% [4] while another also used HGRPB to eliminate H2S content and H2S was reduced less than 100 ppm after purification [35]. Almost all of the above previous works showed positive results; however, complicated techniques were applied to purify contaminant compounds. The significant results in this step indicated that HGRPB with Ca(OH)2 solution of pH = 12 is highly effective and beneficial, which serves biogas purification for generation. Therefore, Ca(OH)2 solution of 0.01 M added at pH = 12 was selected for subsequent investigations.
3.2 Effect of the rotating speed (R S) of HGRPB on the removal efficiency of H2S and CO2
Figure 4 shows the variation of removal efficiency of H2S and CO2, corresponding to test conditions of rotating speed of HGRPB at 600, 900, 1,200, and 1,500 rpm. In this experiment, a concentration of 0.01 M Ca(OH)2 solution was used to maintain pH 12 of the solution, Q G of 2.5 (L/min), and Q L of 0.125 (L/min).
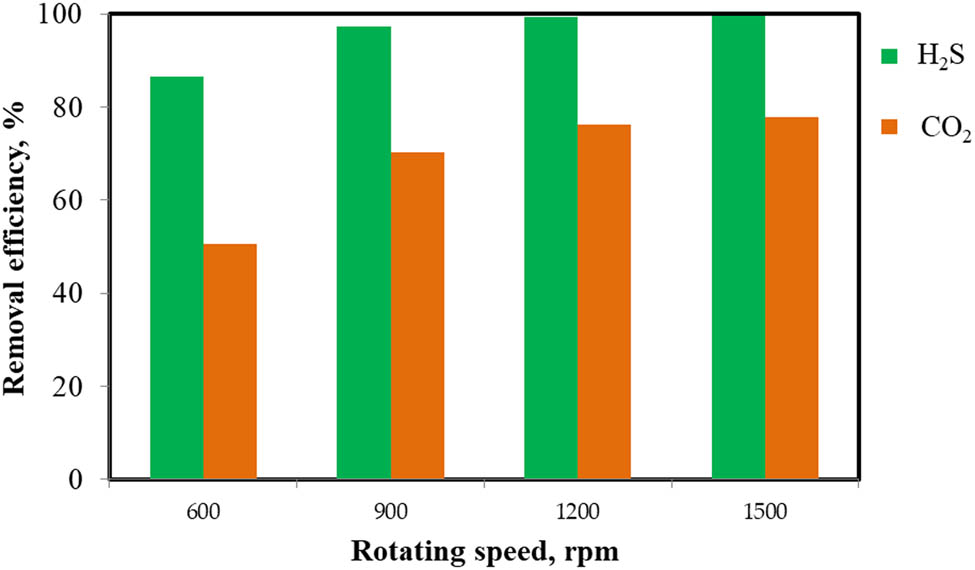
Effect of rotating speed (R S) on the removal efficiency of H2S and CO2.
Data in Figure 4 indicated that the removal efficiency of H2S and CO2 increases with increasing R S of HGRPB from 600 to 1,200 rpm. This result is due to the fact that when increasing the rotation speed of the device, the liquid solution produces a thinner film or smaller droplets. This causes the mass transfer process between the gas and the liquid phases, and in turn, the absorbing process to occur thoroughly. Particularly, when R S accelerates from 600 to 1,200 rpm, the removal efficiency of H2S and CO2 increases rapidly from 86.63 to 99.81% and from 50.56 to 76.23%, respectively. As the R S exceeds 1,500 rpm, improvement in efficiencies was not significant, achieving the maximum efficiency of 77.74% for CO2 and 99.68% for H2S. The obtained efficiencies in this work are similar to that where optimal removal efficiency of H2S achieved 99.8% at R S of 1,100 rpm and higher than that in literature where the R S of 1,200 rpm gave optimal SO2 removal [35,36]. Thus, the rotating speed at 1,200 rpm was selected for all next experiments.
3.3 Effect of Q G on H2S and CO2 removal
Effects of Q G on the removal efficiency of H2S and CO2 were tested under varying Q G of 1.25, 2.5, 3.75, 5, and 7.5 L/min. The pH of solutions, R S, and Q L were kept constant at 12, 1,200 (rpm), and 0.125 (L/min), respectively. The obtained values are shown in Figure 5.
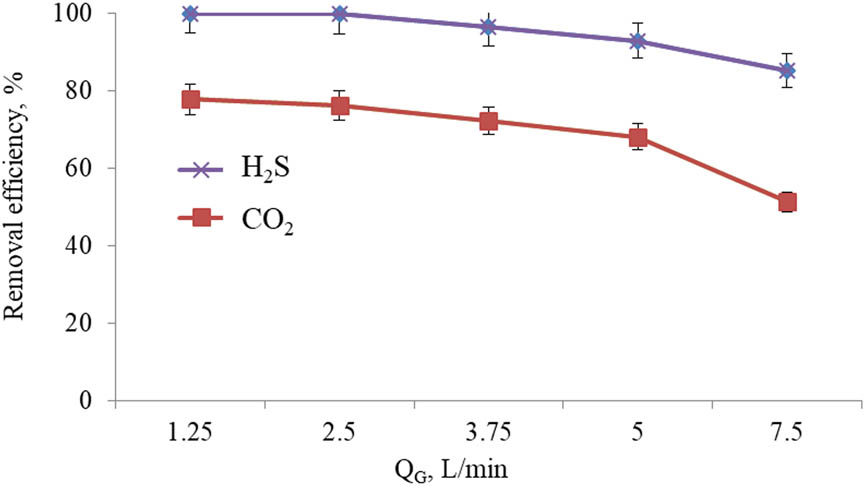
Effect of Q G on the removal efficiency of H2S and CO2.
It was indicated that the removal efficiency of H2S and CO2 decreases when increasing Q G speed while keeping the velocity of fluid flow and R S constant. Accelerating the gas flow from 1.25 to 7.5 L/min seemed to reduce the removal efficiency of H2S and CO2 from 99.86 to 73.09% and from 77.85 to 51.33%, respectively. The trend could be explained by the greater amount of H2S and CO2 and reduced contact time between gas and liquid, thus leading to the lowered removal of H2S and CO2. This trend is similar to that of literature [35,36]. From the experimental results shown in Figure 5, Q G of 2.5 L/min was selected as the basic condition for subsequent experiments.
3.4 Effect of the Q L on the removal efficiency of H2S and CO2
The dependence of removal efficiency of H2S and CO2 on the liquid flow rate is shown in Figure 6. Parameters in this experiment included concentration of Ca(OH)2 of 0.01 M, pH of the solution of 12, R S of the HGRPB of 1,200 rpm, and Q G of 2.5 L/min. Q L was allowed to vary at 0.05, 0.083, 0.125, 0.167, and 0.25 L/min.
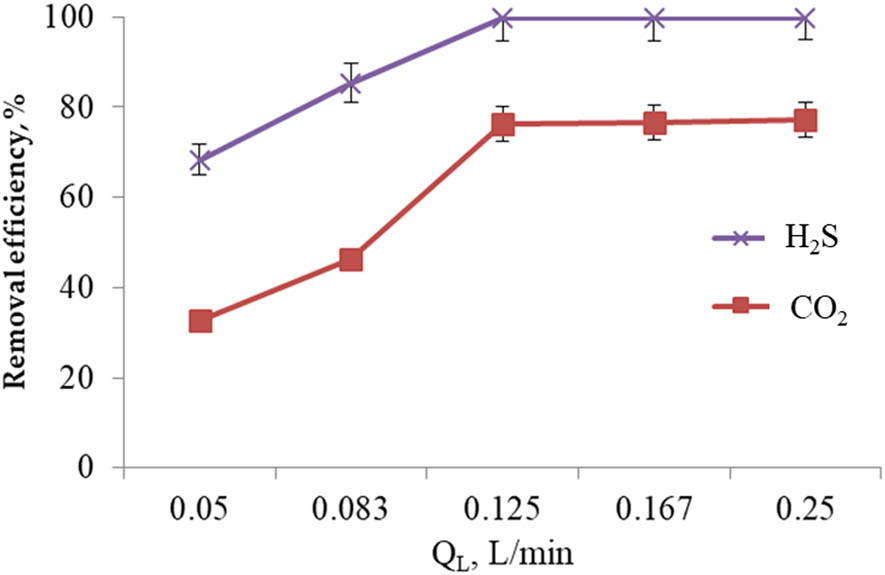
The effect of Q L on the removal efficiency of H2S and CO2.
Rising the Ca(OH)2 flow rate improved the removal efficiency of CO2. The maximum removal efficiency of CO2 was 77.15%, reached at the flow rate of 0.125 (L/min). Regarding the H2S elimination, the gas was almost eliminated (remaining amount of lower than 0.1 ppm) even at the liquid flow rate of 0.125 (L/min). This is explained by the increase in the flow of the absorbent solution in a given interaction period and volume of gas, which in turn improves the volume of passing solution and the purification process. However, rising the flow rate to very high levels (Q L of 0.25 L/min) did not improve the removal efficiency of H2S and CO2 significantly. Comparing with the results in the literature to explore the effects of Q G and Q L on the removal efficiency of H2S, current results obtained the same trend [35]. Therefore, Q L of 0.125 (L/min) was selected as the appropriate Ca(OH)2 flow rate value for obtained efficiency of H2S and CO2 removal.
Hence, removal of H2S and CO2 in biogas by absorption mechanism of Ca(OH)2 solution into the reactor gives high efficiencies with optimal conditions: pH of 12, rotating speed of HGRPB of 1,200 (rpm), gas flow rate of 2.5 (L/min), and liquid flow rate of 0.125 (L/min), and it is explained by reactions as follows [38,39]:
In the high alkaline at pH 12:
With a higher concentration of H2S in the gas, reactions then occur as
Reactions (5) and (6) simultaneously happened; thus, it is difficult to form precipitation of CaCO3 in the reactor due to HGRPB apparatus with its performance and all reactions happened continually in the solution. Therefore, H2S and CO2 concentrations were removed simultaneously.
3.5 Predicted model and statistical analysis
From the experimental data of the effect of univariate technological parameters to the objective functions Y1 and Y2, experiments were planned according to the Box–Behnken’s description. The original (0), low (−1), and high (+1) levels of the factors (with k = 4) and the variable interval are listed in Table 2.
The experimental levels of technological variables
| Real variable | Varied code | Variable range (Δ) | Research level | ||
|---|---|---|---|---|---|
| −1 | 0 | 1 | |||
| Rotating speed (rpm) | A | 300 | 900 | 1,200 | 1,500 |
| Liquid flow rate Q L (L/min) | B | 0.042 | 0.083 | 0.125 | 0.167 |
| Gas flow rate Q G (L/min) | C | 1.25 | 1.25 | 2.5 | 3.75 |
| pH | D | 1 | 11 | 12 | 13 |
The Design-Expert 7.0.0 software was used to build an experimental matrix with 29 experiments. The objective functions are Y1 (%) and Y2 (%) of the removal efficiency of H2S and CO2, respectively. Experimental results are listed in Table 3.
Experimental planning matrix of the removal efficiency of H2S and CO2
| No. | Varied code | Objective functions | ||||
|---|---|---|---|---|---|---|
| A | B | C | D | Y1 (%) | Y2 (%) | |
| 1 | −1 | −1 | 0 | 0 | 72.70 ± 0.17 | 54.31 ± 0.14 |
| 2 | +1 | −1 | 0 | 0 | 74.71 ± 0.15 | 60.51 ± 0.15 |
| 3 | −1 | +1 | 0 | 0 | 83.53 ± 0.18 | 66.69 ± 0.14 |
| 4 | +1 | +1 | 0 | 0 | 82.64 ± 0.21 | 62.74 ± 0.18 |
| 5 | 0 | 0 | −1 | −1 | 81.04 ± 0.11 | 63.43 ± 0.19 |
| 6 | 0 | 0 | +1 | −1 | 63.52 ± 0.16 | 49.01 ± 0.15 |
| 7 | 0 | 0 | −1 | +1 | 79.85 ± 0.15 | 62.77 ± 0.17 |
| 8 | 0 | 0 | +1 | +1 | 81.69 ± 0.22 | 64.46 ± 0.11 |
| 9 | −1 | 0 | 0 | −1 | 79.11 ± 0.19 | 60.80 ± 0.17 |
| 10 | +1 | 0 | 0 | −1 | 78.78 ± 0.13 | 60.91 ± 0.21 |
| 11 | −1 | 0 | 0 | +1 | 86.68 ± 0.14 | 67.40 ± 0.12 |
| 12 | +1 | 0 | 0 | +1 | 86.97 ± 0.25 | 71.44 ± 0.14 |
| 13 | 0 | −1 | −1 | 0 | 76.88 ± 0.14 | 62.02 ± 0.21 |
| 14 | 0 | +1 | −1 | 0 | 75.99 ± 0.22 | 64.60 ± 0.18 |
| 15 | 0 | −1 | +1 | 0 | 58.18 ± 0.21 | 40.84 ± 0.21 |
| 16 | 0 | +1 | +1 | 0 | 77.48 ± 0.11 | 59.16 ± 0.21 |
| 17 | −1 | 0 | −1 | 0 | 73.62 ± 0.12 | 57.33 ± 0.18 |
| 18 | +1 | 0 | −1 | 0 | 83.56 ± 0.15 | 65.07 ± 0.11 |
| 19 | −1 | 0 | +1 | 0 | 82.31 ± 0.17 | 64.10 ± 0.15 |
| 20 | +1 | 0 | +1 | 0 | 74.21 ± 0.17 | 57.79 ± 0.19 |
| 21 | 0 | −1 | 0 | −1 | 78.28 ± 0.14 | 60.97 ± 0.13 |
| 22 | 0 | +1 | 0 | −1 | 68.96 ± 0.18 | 53.70 ± 0.12 |
| 23 | 0 | −1 | 0 | +1 | 66.73 ±± 0.22 | 51.98 ± 0.14 |
| 24 | 0 | +1 | 0 | +1 | 87.00 ± 0.13 | 67.76 ± 0.16 |
| 25 | 0 | 0 | 0 | 0 | 94.40 ± 0.23 | 73.53 ± 0.19 |
| 26 | 0 | 0 | 0 | 0 | 99.80 ± 0.19 | 77.72 ± 0.13 |
| 27 | 0 | 0 | 0 | 0 | 99.74 ± 0.25 | 77.68 ± 0.25 |
| 28 | 0 | 0 | 0 | 0 | 99.68 ± 0.23 | 77.62 ± 0.17 |
| 29 | 0 | 0 | 0 | 0 | 99.86 ± 0.22 | 77.86 ± 0.18 |
The statistical model and the factors conducted by an analysis of variance (ANOVA) are listed in Table 4.
Regression analysis of the objective functions Y1 and Y2
| Source | Y1 (%) | Y2 (%) | ||
|---|---|---|---|---|
| F-value | P-value | F-value | P-value | |
| Model | 32.74 | <0.0001* | 14.06 | <0.0001* |
| A | 0.11 | 0.7480NS | 0.5 | 0.4932NS |
| B | 28.79 | <0.0001* | 15.62 | 0.0014* |
| C | 13.99 | 0.0022* | 12.82 | 0.003* |
| D | 19.15 | 0.0006* | 11.04 | 0.005* |
| AB | 0.32 | 0.5831NS | 2.49 | 0.1366NS |
| AC | 12.15 | 0.0036* | 4.78 | 0.0463* |
| AD | 0.014 | 0.9059NS | 0.37 | 0.5505NS |
| BC | 15.20 | 0.0016* | 6.0 | 0.0281* |
| BD | 32.67 | <0.0001* | 12.85 | 0.003* |
| CD | 13.97 | 0.0022* | 6.28 | 0.0252* |
| A2 | 44.25 | <0.0001* | 17.05 | 0.0010* |
| B2 | 182.44 | <0.0001* | 71.73 | <0.0001* |
| C2 | 165.41 | <0.0001* | 63.13 | <0.0001* |
| D2 | 83.50 | <0.0001* | 30.93 | <0.0001* |
| R 2 | 0.9704 | 0.9336 | ||
| Adj-R 2 | 0.9407 | 0.8972 | ||
| Adeq. precision | 20.761 | 13.688 | ||
*P < 0.05: meaningful values; NS P > 0.05: non-meaningful values.
The analysis results listed in Table 4 show that this model is completely compatible with practical experiments; thus, the model is convergent. This is proved with the standard F (Fisher) of a valuable model with Y1 (32.74) and Y2 (14.06). This model is statistically significant with high reliability with all P values (<0.0001).
The fitting of the experimental modeling is also verified by the multiple correlation coefficient R 2. The closer R 2 value is 1, the nearer the experimental value is the predicted value of the model. According to the analysis in shown in Table 4, the multiple correlation coefficients of the two models Y1 and Y2 are 0.9704 (97.04%) and 0.333 (93.36%), respectively. Besides, adj-R 2 values of Y1 and Y2 are 0.9407 (94.07%) and 0.8972 (89.72%), respectively. Adeq. precision values are 20.761 and 13,688, respectively, and both of all are higher than 4. This shows that the value of the objective functions depends largely on the influential variables, and this model is compatible with the real experiments.
After eliminating the nonsignificant variables (P > 0.05), the objective functions Y1, Y2 and model are also identified and presented by the second-order regression equation as follows:
The influence of linear factors (A, B, C, D) on the value of the objective function is greatest, followed by the influence of convolution factors (AB, AC, AD, BC, BD, CD), and the least effect on the objective function value is the square factor (A2, B2, C2, D2).
From the regression equation (7), the influence of the factors on the objective function Y1 (removal efficiency of H2S) is seen. The three factors including B, C, and D affect the Y1 function. Factor A shows a weaker level of influence through convolutional and squared interactions (AC, A2). In which, the level of influence of three technological factors in descending order is B > D > C. Two factors B and D positively affect (positive interaction) Y1 and factor C inversely affects (negative interactions) Y1 corresponding to their coefficients in the regression equation (7).
The regression equation (8) also shows impacts of experimental parameters on the objective function Y2 (removal efficiency of CO2). Specially, parameters that influence the removal efficiency of CO2 are AC and A2. The indirect influence of factor A into the response is also weak, demonstrated by the low magnitude of AC and A2. Based on the coefficients of the linear terms, the order of magnitude of experimental factors is as follows B > C > D. Similar to the previous function, the two factors B and D showed positive interactions with Y2 while factor C has a negative impact on the response.
The effect of the double-factor technology interaction on the objective functions is expressed through the response surfaces in Figure 7.
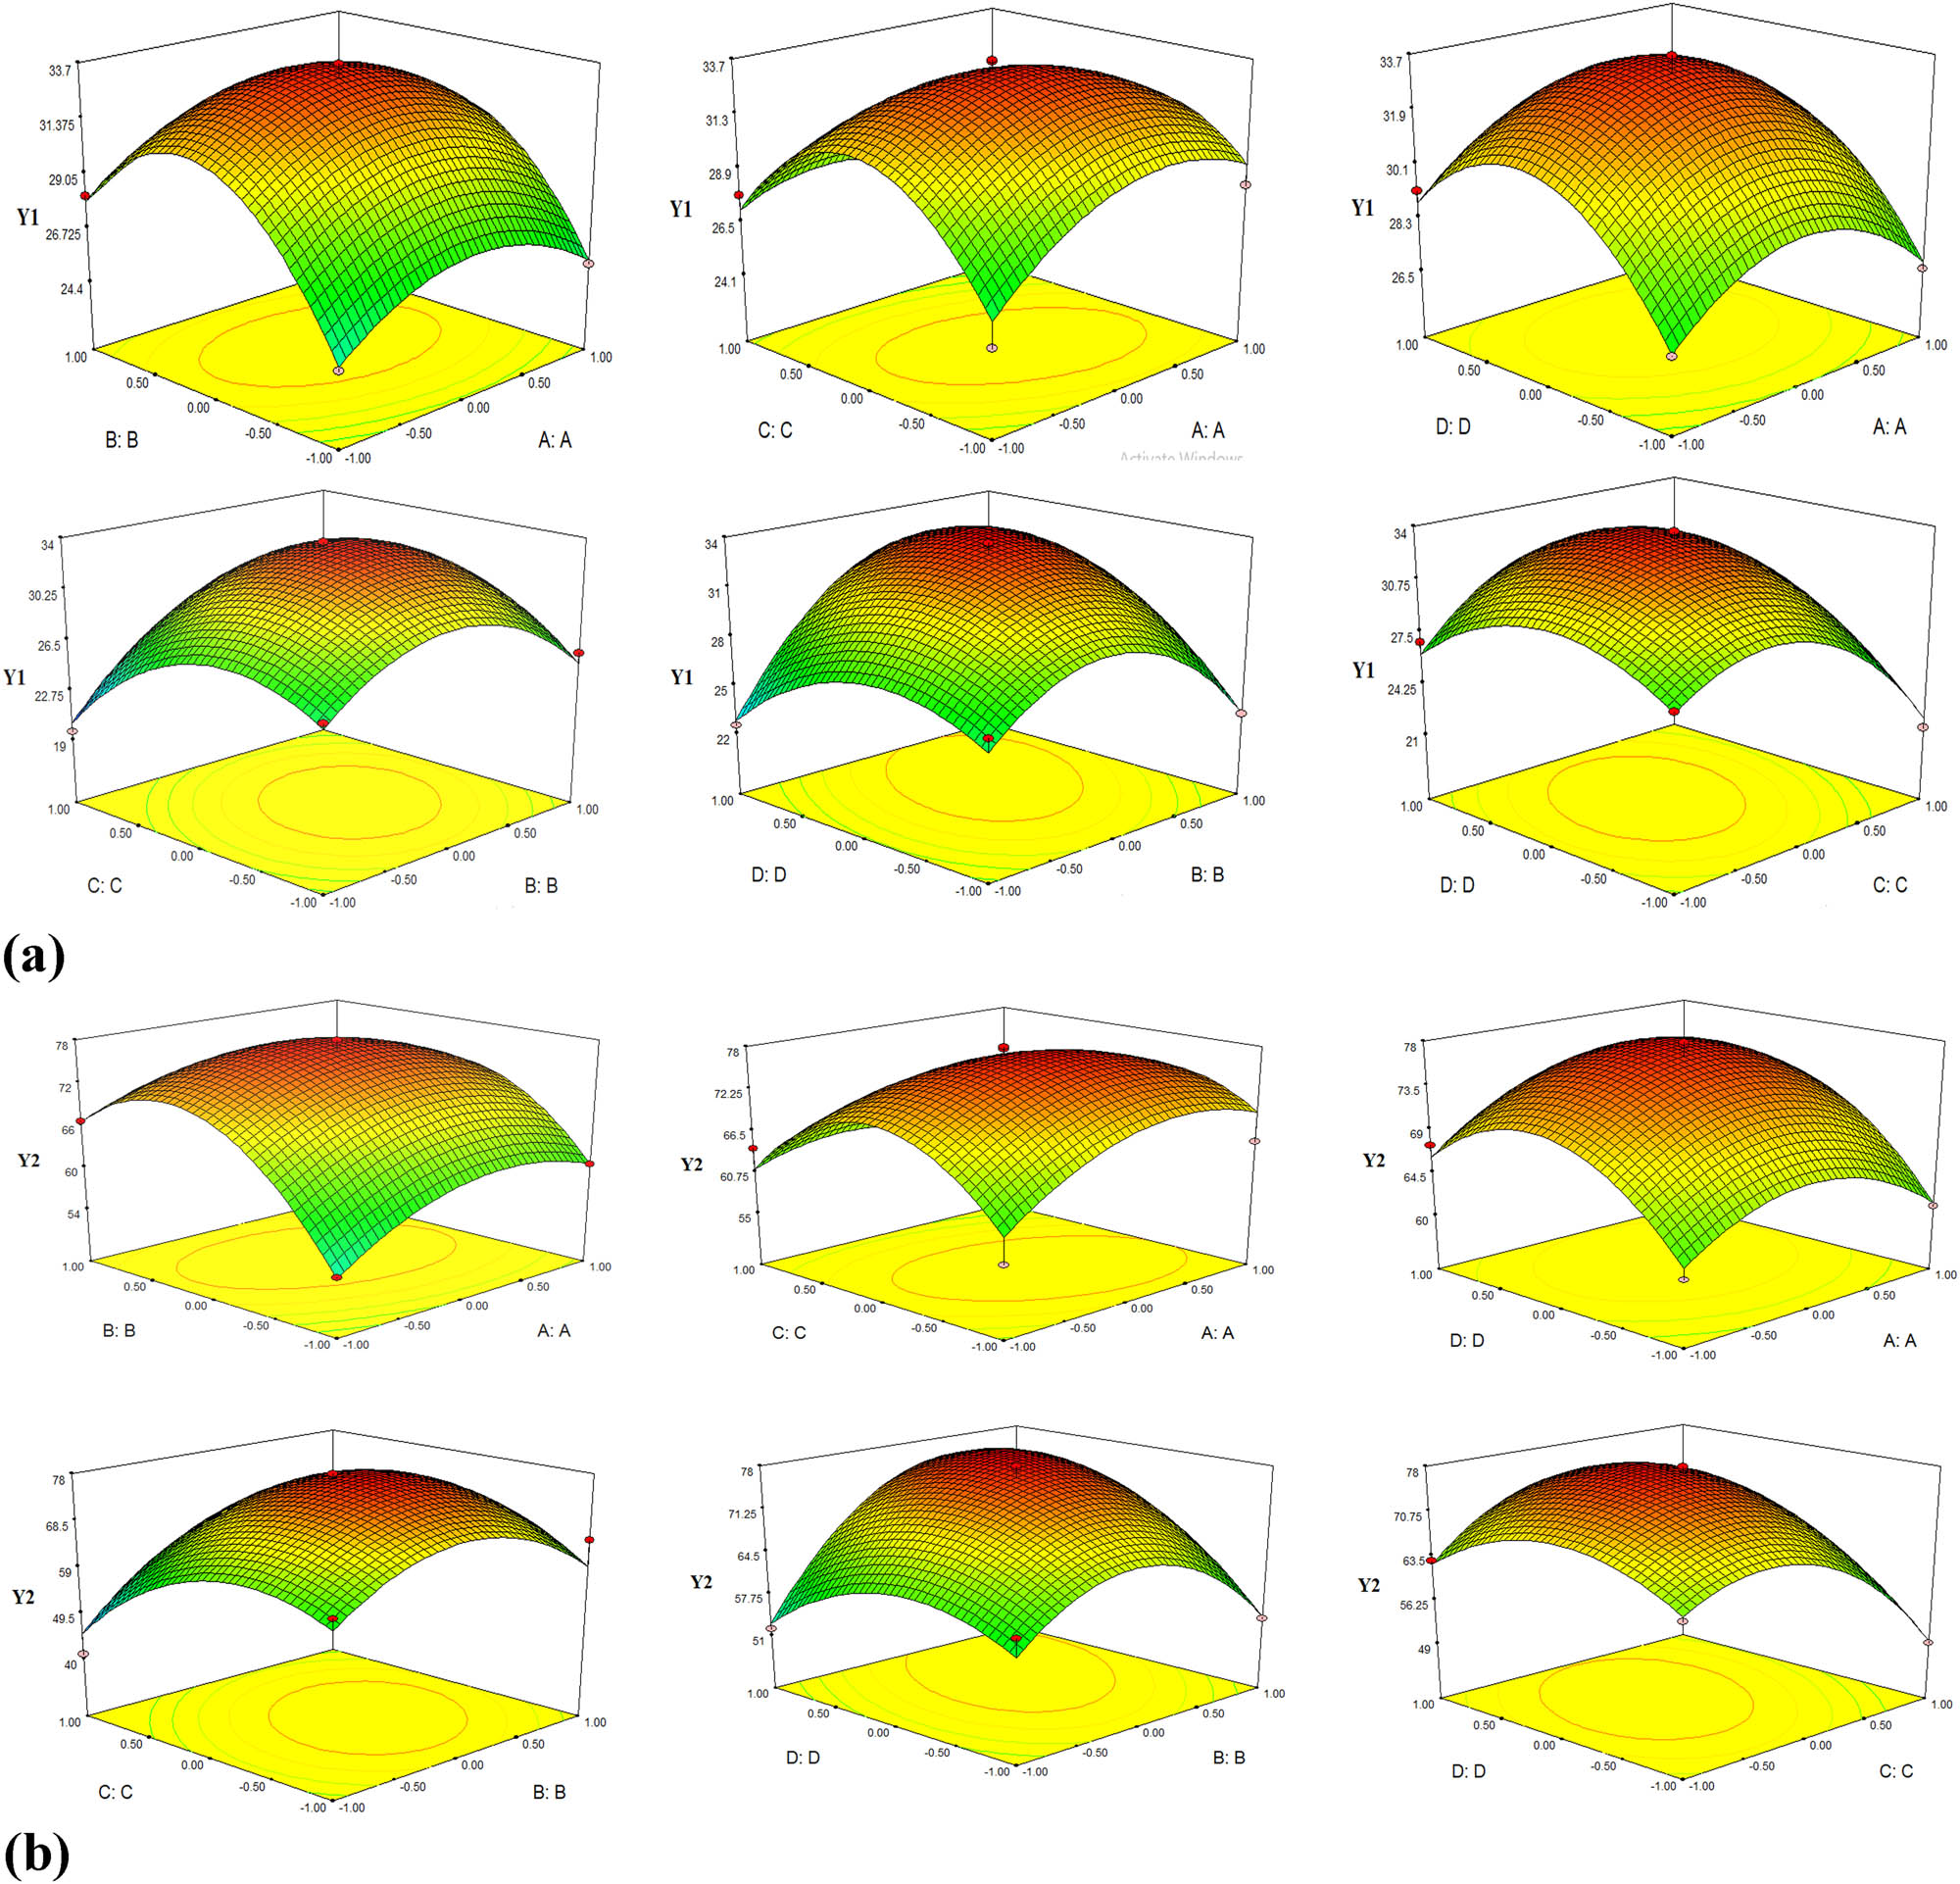
The response surfaces of the objective functions: (a) Y1 corresponding surface and (b) Y2 corresponding surface.
On response surfaces, the dark red zone is the optimal area. Therefore, the objective function values Y1 and Y2 are in the largest value region. From the response surfaces in Figure 7, there are some observations as follows:
With the expressed response surfaces for the function Y1: three pairs of interactive factors (BC, BD, CD) have a greater influence on the objective function than the other three pairs of factors (AB, AC, AD). In three pairs of factors (BC, BD, CD), the order of strong effect on the objective function Y1 is BD > CD > BC. This is consistent with the results shown in the regression equation (1).
Similar to the Y1 function, the response surfaces for the function Y2 show that three pairs of interaction factors (BC, BD, CD) have a greater influence on the objective function than the three remaining pairs of factors (AB, AC, AD). In three pairs of elements (BC, BD, CD), the order of strong impact on the objective function Y2 is BD > CD > BC. This is fitted with the results shown in the regression equation (2).
3.6 Optimization and model verification
The highest removal efficiency of H2S and CO2 is expected to be optimized, so both the objective functions Y1 and Y2 need to reach the maximum values. This is solved by using Design-Expert 7.0.0 software for resolution according to the method of aspiration with priority levels (from 1 to 5). In this way, with the goals, the priority levels for the objective functions are selected as follows:
Objective function Y1 (level 5)
Objective function Y2 (level 5)
The optimized results by Design-Expert 7.0.0 software gives out a resolution corresponding to a set of technological data. The optimal data of real experimental variables are shown in Table 5 and Figure 8. In terms of real variables, the predicted values of the objective functions are Y1 = 99.56 (%) and Y2 = 77.86 (%) by modeling (Table 6).
Optimization of real experimental variables
| Independent variables | Real variables | ||||||
|---|---|---|---|---|---|---|---|
| A | B | C | D | Rotating speed (rpm) | Q L (L/min) | Q G (L/min) | pH |
| 0.02 | 0.21 | −0.03 | 0.26 | 1,200 | 0.134 | 2.46 | 12.26 |
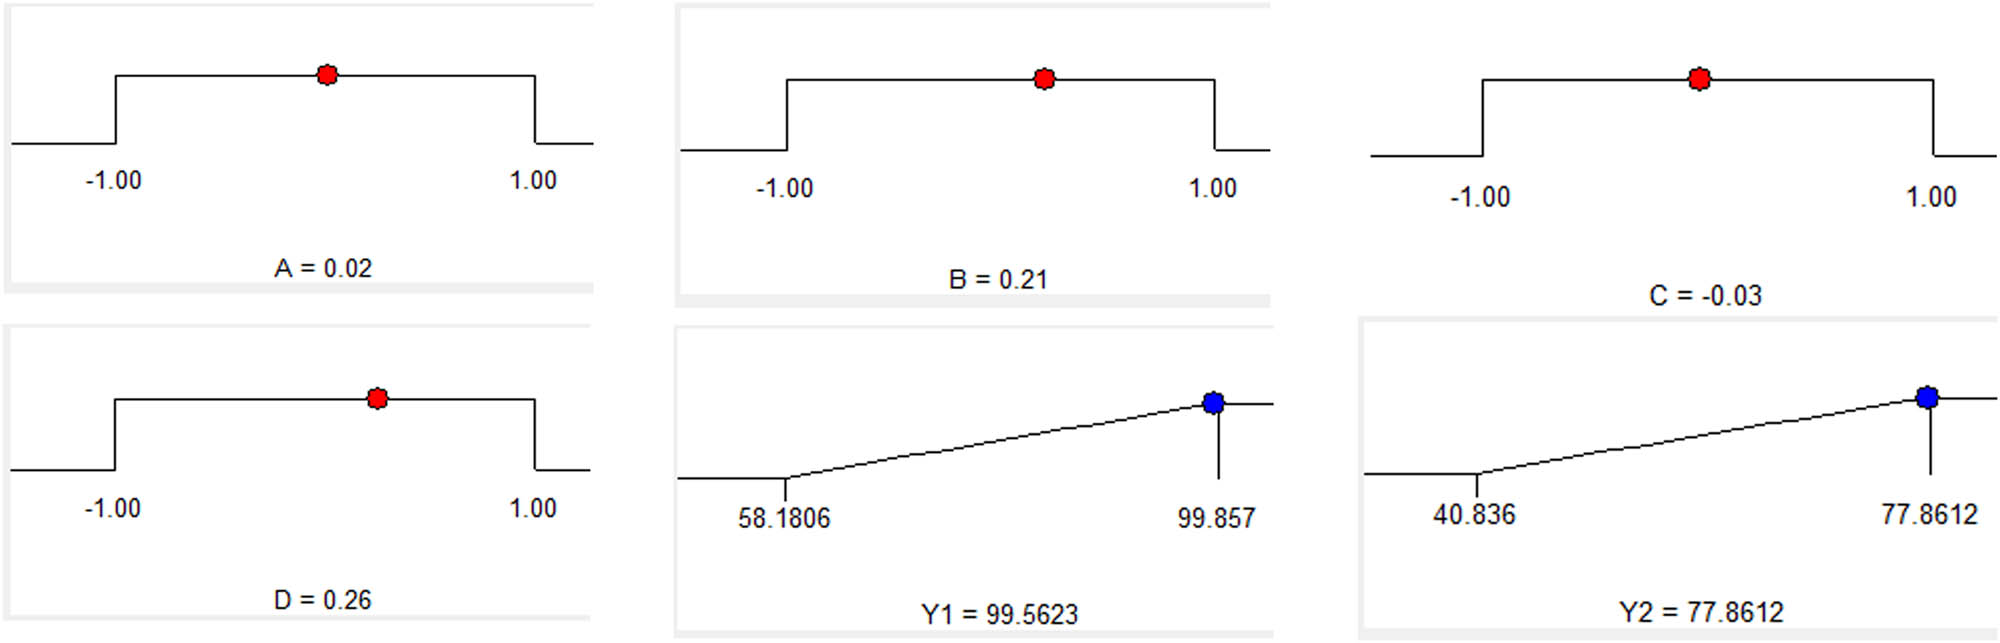
Optimum conditions by the solution of ramps.
Comparison in experimental and modeling data at the optimal conditions
| Experimental factors | The objective function | Result | ||||
|---|---|---|---|---|---|---|
| Rotating speed (rpm) | Q L (L/min) | Q G (L/min) | pH | Experiment | Predicted | |
| 1,200 | 0.134 | 2.46 | 12.26 | Y1 (%) | 99.38 ± 0.56 | 99.56 |
| Y2 (%) | 77.28 ± 0.41 | 77.86 | ||||
Experiments are repeated thrice with the set of the technological factors at the optimal conditions including rotating speed 1,200 (rpm), Q L 0.134 (L/min), Q G 2.46 (L/min), and solution pH of 12.26. The test results are given in Table 6.
The results in Table 6 show that the experimental results at optimal conditions are nearly equal to the predicted values of the objective function in the predicted result. Therefore, the model of optimal calculation is consistent with the experimental factors.
4 Conclusions
This work applied high-gravity rotating packed bed, a novel apparatus, to eliminate H2S and CO2 in biogas and investigated the effects of some parameters including absorbent solution pH, rotating speed, and gas–liquid flow rate on the removal efficiencies. The obtained experimental results indicated that the optimal removal efficiencies of H2S and CO2 could be achieved at a pH of 12.26 for Ca(OH)2 absorbent solution, rotating speed of HGRPB of 1,200 (rpm), gas flow rate of 2.46 (L/min), and liquid flow rate of 0.134 (L/min). Referring to some previous works, current removal efficiencies are relatively higher, which suggest the potential of the high-gravity rotating packed bed reactor for the removal of H2S and CO2 in biogas. Results are approved by the optimal conditions in experiments and simulation with calculated modeling.
Acknowledgments
The authors would like to thank the Vietnam Academy of Science and Technology and the Institute of Environmental Technology provided financial support with project code TN18/C07 and other supports.
-
Funding: Vietnam Academy of Science and Technology and Institute of Environmental Technology – project code TN18/C07
-
Author contributions: Investigation, Lien Tran Thi, Tuan Minh Le, Tuan Minh Nguyen, and Quoc Toan Tran; supervision, Van Tan Lam and Manh Van Do; writing – original draft, Lien Tran Thi.
-
Conflict of interest: The authors declare no conflict of interest.
-
Data availability statement: The datasets generated during and/or analysed during the current study are available from the corresponding author on reasonable request.
References
[1] Khan IU, Othman MHD, Hashim H, Matsuura T, Ismail AF, Rezaei-DashtArzhandi M, et al. Biogas as a renewable energy fuel – a review of biogas upgrading, utilisation and storage. Energy Convers Manag. 2017;150(Oct):277–94. 10.1016/j.enconman.2017.08.035.Search in Google Scholar
[2] Ryckebosch E, Drouillon M, Vervaeren H. Techniques for transformation of biogas to biomethane. Biomass Bioenergy. 2011;35(5):1633–45. 10.1016/j.biombioe.2011.02.033.Search in Google Scholar
[3] Lee TH, Huang SR, Chen CH. The experimental study on biogas power generation enhanced by using waste heat to preheat inlet gases. Renew Energy. 2013;50(Feb):342–47. 10.1016/j.renene.2012.06.032.Search in Google Scholar
[4] Tippayawong N, Thanompongchart P. Biogas quality upgrade by simultaneous removal of CO2 and H2S in a packed column reactor. Energy. The 3rd international conference on sustainable energy and environmental protection, SEEP 2009. 2010;35(12):4531–35. 10.1016/j.energy.2010.04.014.Search in Google Scholar
[5] Osorio F, Torres JC. Biogas purification from anaerobic digestion in a wastewater treatment plant for biofuel production. Renew Energy. 2009;34(10):2164–71. 10.1016/j.renene.2009.02.023.Search in Google Scholar
[6] Ramaraj R, Dussadee N. Biological purification processes for biogas using algae cultures: a review. Int J Sustain Green Energy. 2015;4(1):20–32, 10.11648/j.ijrse.s.2015040101.14.Search in Google Scholar
[7] Holladay JD, Hu J, King DL, Wang Y. An overview of hydrogen production technologies science direct; 2009. https://www.sciencedirect.com/science/article/abs/pii/S0920586108004100Search in Google Scholar
[8] López ME, Rene ER, Veiga MC, Kennes C. Biogas technologies and cleaning techniques. In: Lichtfouse E, Schwarzbauer J, Robert D, (Eds.). Environmental chemistry for a sustainable world: vol 2: remediation of air and water pollution [internet]. Dordrecht: Springer Netherlands; 2012. p. 347–77. Environmental Chemistry for a Sustainable World. 10.1007/978-94-007-2439-6_9.Search in Google Scholar
[9] Kao CY, Chiu SY, Huang TT, Dai L, Wang GH, Tseng CP, et al. A mutant strain of microalga chlorella Sp. for the carbon dioxide capture from biogas. Biomass Bioenergy. 2012;36(Jan):132–40. 10.1016/j.biombioe.2011.10.046.Search in Google Scholar
[10] Yan S, He Q, Zhao S, Wang Y, Ai. P. Biogas upgrading by CO2 removal with a highly selective natural amino acid salt in gas–liquid membrane contactor. Chem Eng Process Process Intensif. 2014;85(Nov):125–35. 10.1016/j.cep.2014.08.009.Search in Google Scholar
[11] Huertas JI, Giraldo N, Izquierdo S. Removal of H2S and CO2 from biogas by amine absorption. Mass transfer in chemical engineering processes. London, UK: IntechOpen Limited; 2011. 10.5772/20039.Search in Google Scholar
[12] Dubois L, Thomas D. Comparison of various alkaline solutions for H2S/CO2-selective absorption applied to biogas purification. Chem Eng Technol. 2010;33(10):1601–9.10.1002/ceat.201000171Search in Google Scholar
[13] Rongwong W, Boributh S, Assabumrungrat S, Laosiripojana N, Jiraratananon R. Simultaneous absorption of CO2 and H2S from biogas by capillary membrane contactor. J Membr Sci. 2012;392–3(Mar):38–47. 10.1016/j.memsci.2011.11.050.Search in Google Scholar
[14] Cozma P, Wukovits W, Mămăligă I, Friedl A, Gavrilescu M. Modeling and simulation of high pressure water scrubbing technology applied for biogas upgrading. Clean Technol Environ Policy. 2015 Feb 1;17(2):373–91.10.1007/s10098-014-0787-7Search in Google Scholar
[15] Nock WJ, Walker M, Kapoor R, Heaven S. Modeling the water scrubbing process and energy requirements for CO2 capture to upgrade biogas to biomethane. Ind Eng Chem Res. 2014 Aug 13;53(32):12783–92.10.1021/ie501280pSearch in Google Scholar
[16] Gawel RA. Design simulations for a biogas purification process using aqueous amine solutions. Chem Pap. 2012 Nov 1;66(11):1010–8.10.2478/s11696-012-0211-xSearch in Google Scholar
[17] Lasocki J, Kołodziejczyk K, Matuszewska A. Laboratory-scale investigation of biogas treatment by removal of hydrogen sulfide and carbon dioxide. Pol J Environ Stud. 2015;24:1427–34.10.15244/pjoes/35283Search in Google Scholar
[18] Mora M, Fernández M, Gómez JM, Cantero D, Lafuente J, Gamisans X, et al. Kinetic and stoichiometric characterization of anoxic sulfide oxidation by SO-NR mixed cultures from anoxic biotrickling filters. Appl Microbiol Biotechnol. 2015 Jan 1;99(1):77–87.10.1007/s00253-014-5688-5Search in Google Scholar PubMed
[19] Iovane P, Nanna F, Ding Y, Bikson B, Molino A. Experimental test with polymeric membrane for the biogas purification from CO2 and H2S. Fuel. 2014 Nov 1;135:352–8.10.1016/j.fuel.2014.06.060Search in Google Scholar
[20] Ramshaw C, Mallinson RH. U.S. Patent No. 4,283,255. Washington, DC: U.S. Patent and Trademark Office; 1981.Search in Google Scholar
[21] Lu X, Xie P, Ingham DB, Ma L, Pourkashanian M. A porous media model for CFD simulations of gas-liquid two-phase flow in rotating packed beds. Chem Eng Sci. 2018 Nov 2;189:123–34.10.1016/j.ces.2018.04.074Search in Google Scholar
[22] Chen J-F, Wang Y-H, Guo F, Wang X-M, Zheng C. Synthesis of nanoparticles with novel technology: high-gravity reactive precipitation. Ind Eng Chem Res. 2000 Apr;39(4):948–54.10.1021/ie990549aSearch in Google Scholar
[23] Chen J, Shao L. Mass production of nanoparticles by high gravity reactive precipitation technology with low cost. China Particuol. 2003 Jun 1;1(2):64–9.10.1016/S1672-2515(07)60110-9Search in Google Scholar
[24] Mondal A, Pramanik A, Bhowal A, Datta S. Distillation studies in rotating packed bed with split packing. Chem Eng Res Des. 2012 Apr 1;90(4):453–7.10.1016/j.cherd.2011.08.008Search in Google Scholar
[25] Peel J, Howarth CR, Ramshaw C. Process intensification: higee seawater deaeration. Chem Eng Res Des. 1998 Jul 1;76(5):585–93.10.1205/026387698525261Search in Google Scholar
[26] Zhang D, Zhang P-Y, Zou H-K, Chu G-W, Wu W, Zhu Z-W, et al. Application of HIGEE process intensification technology in synthesis of petroleum sulfonate surfactant. Chem Eng Process Process Intensif. 2010 May 1;49(5):508–13.10.1016/j.cep.2010.03.018Search in Google Scholar
[27] Zhang D, Zhang P, Zou H, Chu G, Wu W, Zhu Z, et al. Synthesis of petroleum sulfonate surfactant by different sulfonating agent with application of higee technology. Chin J Chem Eng. 2010 Oct 1;18(5):848–55.10.1016/S1004-9541(09)60138-5Search in Google Scholar
[28] Gudena K, Rangaiah GP, Lakshminarayanan S. Optimal design of a rotating packed bed for voc stripping from contaminated groundwater. Ind Eng Chem Res. 2012 Jan 18;51(2):835–47.10.1021/ie201218wSearch in Google Scholar
[29] Panda M, Bhowal A, Datta S. Removal of hexavalent chromium by biosorption process in rotating packed bed. Env Sci Technol. 2011 Oct 1;45(19):8460–6.10.1021/es2015346Search in Google Scholar PubMed
[30] Zhang L-L, Wang J-X, Xiang Y, Zeng X-F, Chen J-F. Absorption of carbon dioxide with ionic liquid in a rotating packed bed contactor: mass transfer study. Ind Eng Chem Res. 2011 Jun 1;50(11):6957–64.10.1021/ie1025979Search in Google Scholar
[31] Pan S-Y, Chiang P-C, Chen Y-H, Tan C-S, Chang E-E. Ex situ CO2 capture by carbonation of steelmaking slag coupled with metalworking wastewater in a rotating packed bed. Environ Sci Technol. 2013 Apr 2;47(7):3308–15.10.1021/es304975ySearch in Google Scholar PubMed
[32] Zhang L-L, Wang J-X, Liu Z-P, Lu Y, Chu G-W, Wang W-C, et al. Efficient capture of carbon dioxide with novel mass-transfer intensification device using ionic liquids. AIChE J. 2013;59(8):2957–65.10.1002/aic.14072Search in Google Scholar
[33] Zhang L-L, Wang J-X, Sun Q, Zeng X-F, Chen J-F. Removal of nitric oxide in rotating packed bed by ferrous chelate solution. Chem Eng J. 2012 Feb 1;181–2:624–9.10.1016/j.cej.2011.12.027Search in Google Scholar
[34] Qian Z, Li Z-H, Guo K. Industrial applied and modeling research on selective H2S removal using a rotating packed bed. Ind Eng Chem Res. 2012 Jun 13;51(23):8108–16.10.1021/ie2027266Search in Google Scholar
[35] Guo K, Wen J, Zhao Y, Wang Y, Zhang Z, Li Z, et al. Optimal packing of a rotating packed bed for H2S removal. Env Sci Technol. 2014 Jun 17;48(12):6844–9.10.1021/es404913eSearch in Google Scholar PubMed
[36] Chu G-W, Fei J, Cai Y, Liu Y, Gao Y, Luo Y, et al. Removal of SO2 with sodium sulfite solution in a rotating packed bed. Ind Eng Chem Res. 2018 Feb 14;57(6):2329–35.10.1021/acs.iecr.7b04993Search in Google Scholar
[37] Qian Z, Chen Q, Grossmann IE. Optimal synthesis of rotating packed bed reactor. Comput Chem Eng. 2017 Oct 4;105:152–60.10.1016/j.compchemeng.2017.02.026Search in Google Scholar
[38] Robinson SP, Okla B. Phillips petroleum company. Patented 1949 Aug 23, Serial No. 613756. United States Patent Office; 1949.Search in Google Scholar
[39] Shah DR, Nagarsheth HJ, Acharya P. Purification of biogas using chemical scrubbing and application of purified biogas as fuel for automotive engines. Res J Recent Sci. 2016;5(ISC-2015):1–7.Search in Google Scholar
© 2021 Lien Thi Tran et al., published by De Gruyter
This work is licensed under the Creative Commons Attribution 4.0 International License.
Articles in the same Issue
- Regular Articles
- Qualitative and semi-quantitative assessment of anthocyanins in Tibetan hulless barley from different geographical locations by UPLC-QTOF-MS and their antioxidant capacities
- Effect of sodium chloride on the expression of genes involved in the salt tolerance of Bacillus sp. strain “SX4” isolated from salinized greenhouse soil
- GC-MS analysis of mango stem bark extracts (Mangifera indica L.), Haden variety. Possible contribution of volatile compounds to its health effects
- Influence of nanoscale-modified apatite-type calcium phosphates on the biofilm formation by pathogenic microorganisms
- Removal of paracetamol from aqueous solution by containment composites
- Investigating a human pesticide intoxication incident: The importance of robust analytical approaches
- Induction of apoptosis and cell cycle arrest by chloroform fraction of Juniperus phoenicea and chemical constituents analysis
- Recovery of γ-Fe2O3 from copper ore tailings by magnetization roasting and magnetic separation
- Effects of different extraction methods on antioxidant properties of blueberry anthocyanins
- Modeling the removal of methylene blue dye using a graphene oxide/TiO2/SiO2 nanocomposite under sunlight irradiation by intelligent system
- Antimicrobial and antioxidant activities of Cinnamomum cassia essential oil and its application in food preservation
- Full spectrum and genetic algorithm-selected spectrum-based chemometric methods for simultaneous determination of azilsartan medoxomil, chlorthalidone, and azilsartan: Development, validation, and application on commercial dosage form
- Evaluation of the performance of immunoblot and immunodot techniques used to identify autoantibodies in patients with autoimmune diseases
- Computational studies by molecular docking of some antiviral drugs with COVID-19 receptors are an approach to medication for COVID-19
- Synthesis of amides and esters containing furan rings under microwave-assisted conditions
- Simultaneous removal efficiency of H2S and CO2 by high-gravity rotating packed bed: Experiments and simulation
- Design, synthesis, and biological activities of novel thiophene, pyrimidine, pyrazole, pyridine, coumarin and isoxazole: Dydrogesterone derivatives as antitumor agents
- Content and composition analysis of polysaccharides from Blaps rynchopetera and its macrophage phagocytic activity
- A new series of 2,4-thiazolidinediones endowed with potent aldose reductase inhibitory activity
- Assessing encapsulation of curcumin in cocoliposome: In vitro study
- Rare norisodinosterol derivatives from Xenia umbellata: Isolation and anti-proliferative activity
- Comparative study of antioxidant and anticancer activities and HPTLC quantification of rutin in white radish (Raphanus sativus L.) leaves and root extracts grown in Saudi Arabia
- Comparison of adsorption properties of commercial silica and rice husk ash (RHA) silica: A study by NIR spectroscopy
- Sodium borohydride (NaBH4) as a high-capacity material for next-generation sodium-ion capacitors
- Aroma components of tobacco powder from different producing areas based on gas chromatography ion mobility spectrometry
- The effects of salinity on changes in characteristics of soils collected in a saline region of the Mekong Delta, Vietnam
- Synthesis, properties, and activity of MoVTeNbO catalysts modified by zirconia-pillared clays in oxidative dehydrogenation of ethane
- Synthesis and crystal structure of N,N′-bis(4-chlorophenyl)thiourea N,N-dimethylformamide
- Quantitative analysis of volatile compounds of four Chinese traditional liquors by SPME-GC-MS and determination of total phenolic contents and antioxidant activities
- A novel separation method of the valuable components for activated clay production wastewater
- On ve-degree- and ev-degree-based topological properties of crystallographic structure of cuprite Cu2O
- Antihyperglycemic effect and phytochemical investigation of Rubia cordifolia (Indian Madder) leaves extract
- Microsphere molecularly imprinted solid-phase extraction for diazepam analysis using itaconic acid as a monomer in propanol
- A nitric oxide-releasing prodrug promotes apoptosis in human renal carcinoma cells: Involvement of reactive oxygen species
- Machine vision-based driving and feedback scheme for digital microfluidics system
- Study on the application of a steam-foam drive profile modification technology for heavy oil reservoir development
- Ni–Ru-containing mixed oxide-based composites as precursors for ethanol steam reforming catalysts: Effect of the synthesis methods on the structural and catalytic properties
- Preparation of composite soybean straw-based materials by LDHs modifying as a solid sorbent for removal of Pb(ii) from water samples
- Synthesis and spectral characterizations of vanadyl(ii) and chromium(iii) mixed ligand complexes containing metformin drug and glycine amino acid
- In vitro evaluation of lactic acid bacteria with probiotic activity isolated from local pickled leaf mustard from Wuwei in Anhui as substitutes for chemical synthetic additives
- Utilization and simulation of innovative new binuclear Co(ii), Ni(ii), Cu(ii), and Zn(ii) diimine Schiff base complexes in sterilization and coronavirus resistance (Covid-19)
- Phosphorylation of Pit-1 by cyclin-dependent kinase 5 at serine 126 is associated with cell proliferation and poor prognosis in prolactinomas
- Molecularly imprinted membrane for transport of urea, creatinine, and vitamin B12 as a hemodialysis candidate membrane
- Optimization of Murrayafoline A ethanol extraction process from the roots of Glycosmis stenocarpa, and evaluation of its Tumorigenesis inhibition activity on Hep-G2 cells
- Highly sensitive determination of α-lipoic acid in pharmaceuticals on a boron-doped diamond electrode
- Synthesis, chemo-informatics, and anticancer evaluation of fluorophenyl-isoxazole derivatives
- In vitro and in vivo investigation of polypharmacology of propolis extract as anticancer, antibacterial, anti-inflammatory, and chemical properties
- Topological indices of bipolar fuzzy incidence graph
- Preparation of Fe3O4@SiO2–ZnO catalyst and its catalytic synthesis of rosin glycol ester
- Construction of a new luminescent Cd(ii) compound for the detection of Fe3+ and treatment of Hepatitis B
- Investigation of bovine serum albumin aggregation upon exposure to silver(i) and copper(ii) metal ions using Zetasizer
- Discoloration of methylene blue at neutral pH by heterogeneous photo-Fenton-like reactions using crystalline and amorphous iron oxides
- Optimized extraction of polyphenols from leaves of Rosemary (Rosmarinus officinalis L.) grown in Lam Dong province, Vietnam, and evaluation of their antioxidant capacity
- Synthesis of novel thiourea-/urea-benzimidazole derivatives as anticancer agents
- Potency and selectivity indices of Myristica fragrans Houtt. mace chloroform extract against non-clinical and clinical human pathogens
- Simple modifications of nicotinic, isonicotinic, and 2,6-dichloroisonicotinic acids toward new weapons against plant diseases
- Synthesis, optical and structural characterisation of ZnS nanoparticles derived from Zn(ii) dithiocarbamate complexes
- Presence of short and cyclic peptides in Acacia and Ziziphus honeys may potentiate their medicinal values
- The role of vitamin D deficiency and elevated inflammatory biomarkers as risk factors for the progression of diabetic nephropathy in patients with type 2 diabetes mellitus
- Quantitative structure–activity relationship study on prolonged anticonvulsant activity of terpene derivatives in pentylenetetrazole test
- GADD45B induced the enhancing of cell viability and proliferation in radiotherapy and increased the radioresistance of HONE1 cells
- Cannabis sativa L. chemical compositions as potential plasmodium falciparum dihydrofolate reductase-thymidinesynthase enzyme inhibitors: An in silico study for drug development
- Dynamics of λ-cyhalothrin disappearance and expression of selected P450 genes in bees depending on the ambient temperature
- Identification of synthetic cannabinoid methyl 2-{[1-(cyclohexylmethyl)-1H-indol-3-yl] formamido}-3-methylbutanoate using modern mass spectrometry and nuclear magnetic resonance techniques
- Study on the speciation of arsenic in the genuine medicinal material honeysuckle
- Two Cu(ii)-based coordination polymers: Crystal structures and treatment activity on periodontitis
- Conversion of furfuryl alcohol to ethyl levulinate in the presence of mesoporous aluminosilicate catalyst
- Review Articles
- Hsien Wu and his major contributions to the chemical era of immunology
- Overview of the major classes of new psychoactive substances, psychoactive effects, analytical determination and conformational analysis of selected illegal drugs
- An overview of persistent organic pollutants along the coastal environment of Kuwait
- Mechanism underlying sevoflurane-induced protection in cerebral ischemia–reperfusion injury
- COVID-19 and SARS-CoV-2: Everything we know so far – A comprehensive review
- Challenge of diabetes mellitus and researchers’ contributions to its control
- Advances in the design and application of transition metal oxide-based supercapacitors
- Color and composition of beauty products formulated with lemongrass essential oil: Cosmetics formulation with lemongrass essential oil
- The structural chemistry of zinc(ii) and nickel(ii) dithiocarbamate complexes
- Bioprospecting for antituberculosis natural products – A review
- Recent progress in direct urea fuel cell
- Rapid Communications
- A comparative morphological study of titanium dioxide surface layer dental implants
- Changes in the antioxidative properties of honeys during their fermentation
- Erratum
- Erratum to “Corrosion study of copper in aqueous sulfuric acid solution in the presence of (2E,5E)-2,5-dibenzylidenecyclopentanone and (2E,5E)-bis[(4-dimethylamino)benzylidene]cyclopentanone: Experimental and theoretical study”
- Erratum to “Modified TDAE petroleum plasticiser”
- Corrigendum
- Corrigendum to “A nitric oxide-releasing prodrug promotes apoptosis in human renal carcinoma cells: Involvement of reactive oxygen species”
- Special Issue on 3rd IC3PE 2020
- Visible light-responsive photocatalyst of SnO2/rGO prepared using Pometia pinnata leaf extract
- Antihyperglycemic activity of Centella asiatica (L.) Urb. leaf ethanol extract SNEDDS in zebrafish (Danio rerio)
- Selection of oil extraction process from Chlorella species of microalgae by using multi-criteria decision analysis technique for biodiesel production
- Special Issue on the 14th Joint Conference of Chemistry (14JCC)
- Synthesis and in vitro cytotoxicity evaluation of isatin-pyrrole derivatives against HepG2 cell line
- CO2 gas separation using mixed matrix membranes based on polyethersulfone/MIL-100(Al)
- Effect of synthesis and activation methods on the character of CoMo/ultrastable Y-zeolite catalysts
- Special Issue on Electrochemical Amplified Sensors
- Enhancement of graphene oxide through β-cyclodextrin composite to sensitive analysis of an antidepressant: Sulpiride
- Investigation of the spectroelectrochemical behavior of quercetin isolated from Zanthoxylum bungeanum
- An electrochemical sensor for high sensitive determination of lysozyme based on the aptamer competition approach
- An improved non-enzymatic electrochemical sensor amplified with CuO nanostructures for sensitive determination of uric acid
- Special Issue on Applied Biochemistry and Biotechnology 2020
- Fast discrimination of avocado oil for different extracted methods using headspace-gas chromatography-ion mobility spectroscopy with PCA based on volatile organic compounds
- Effect of alkali bases on the synthesis of ZnO quantum dots
- Quality evaluation of Cabernet Sauvignon wines in different vintages by 1H nuclear magnetic resonance-based metabolomics
- Special Issue on the Joint Science Congress of Materials and Polymers (ISCMP 2019)
- Diatomaceous Earth: Characterization, thermal modification, and application
- Electrochemical determination of atenolol and propranolol using a carbon paste sensor modified with natural ilmenite
- Special Issue on the Conference of Energy, Fuels, Environment 2020
- Assessment of the mercury contamination of landfilled and recovered foundry waste – a case study
- Primary energy consumption in selected EU Countries compared to global trends
- Modified TDAE petroleum plasticiser
- Use of glycerol waste in lactic acid bacteria metabolism for the production of lactic acid: State of the art in Poland
- Topical Issue on Applications of Mathematics in Chemistry
- Theoretical study of energy, inertia and nullity of phenylene and anthracene
- Banhatti, revan and hyper-indices of silicon carbide Si2C3-III[n,m]
- Topical Issue on Agriculture
- Occurrence of mycotoxins in selected agricultural and commercial products available in eastern Poland
- Special Issue on Ethnobotanical, Phytochemical and Biological Investigation of Medicinal Plants
- Acute and repeated dose 60-day oral toxicity assessment of chemically characterized Berberis hispanica Boiss. and Reut in Wistar rats
- Phytochemical profile, in vitro antioxidant, and anti-protein denaturation activities of Curcuma longa L. rhizome and leaves
- Antiplasmodial potential of Eucalyptus obliqua leaf methanolic extract against Plasmodium vivax: An in vitro study
- Prunus padus L. bark as a functional promoting component in functional herbal infusions – cyclooxygenase-2 inhibitory, antioxidant, and antimicrobial effects
- Molecular and docking studies of tetramethoxy hydroxyflavone compound from Artemisia absinthium against carcinogens found in cigarette smoke
- Special Issue on the Joint Science Congress of Materials and Polymers (ISCMP 2020)
- Preparation of cypress (Cupressus sempervirens L.) essential oil loaded poly(lactic acid) nanofibers
- Influence of mica mineral on flame retardancy and mechanical properties of intumescent flame retardant polypropylene composites
- Production and characterization of thermoplastic elastomer foams based on the styrene–ethylene–butylene–styrene (SEBS) rubber and thermoplastic material
- Special Issue on Applied Chemistry in Agriculture and Food Science
- Impact of essential oils on the development of pathogens of the Fusarium genus and germination parameters of selected crops
- Yield, volume, quality, and reduction of biotic stress influenced by titanium application in oilseed rape, winter wheat, and maize cultivations
- Influence of potato variety on polyphenol profile composition and glycoalcaloid contents of potato juice
- Carryover effect of direct-fed microbial supplementation and early weaning on the growth performance and carcass characteristics of growing Najdi lambs
- Special Issue on Applied Biochemistry and Biotechnology (ABB 2021)
- The electrochemical redox mechanism and antioxidant activity of polyphenolic compounds based on inlaid multi-walled carbon nanotubes-modified graphite electrode
- Study of an adsorption method for trace mercury based on Bacillus subtilis
- Special Issue on The 1st Malaysia International Conference on Nanotechnology & Catalysis (MICNC2021)
- Mitigating membrane biofouling in biofuel cell system – A review
- Mechanical properties of polymeric biomaterials: Modified ePTFE using gamma irradiation