Effects of exogenous 2,4-epibrassinolide on photosynthetic traits of 53 cowpea varieties under NaCl stress
-
Zhihui Hu
 ,
Xiaoping Liang
,
Xiaoping Liang

Abstract
This study examined the effects of exogenous 2,4-epibrassinolide (EBR) on photosynthetic traits of 53 cowpea varieties under NaCl stress. The results of different analysis and correlation analysis showed that these 53 germplasm resources had rich genetic diversity, and significant correlations existed among various photosynthetic traits. Under NaCl stress, Pn was highly significantly positively correlated with Gs and Tr and extremely significantly negatively correlated with Ci. Under EBR treatment, Pn was extremely significantly positively correlated with Gs, Ci, Tr and it was significantly negatively correlated with Chla, Chlb, Chl(a + b), and Y(II). Under EBR treatment and NaCl stress, Pn was extremely significantly positively correlated with Tr, and significantly positively correlated with Gs and carotenoid reflectance index. Principal component analysis shows that in CK group and EBR treatment group, cowpea photosynthesis traits can be summarized as six principal components, contributing 82.298 and 83.046%, respectively, can replace 19 photosynthetic traits to evaluate 53 cowpea varieties; under NaCl stress group and EBR + NaCl stress group, photosynthesis traits can be summarized as seven principal components, with cumulative contribution rate of 84.564 and 85.742%, respectively. In the untreated case, the cluster analysis was used to screen 32 cowpea varieties exhibiting the strongest photosynthetic capacity. Under salt stress, six of these varieties were classified as salt-tolerant. Under EBR spraying + salt stress, all four varieties showed strong photosynthetic capacity, and EBR showed the best relief of salt stress. The results of this study will provide a theoretical basis for the application of exogenous EBR to alleviate cowpea salt stress damage.
1 Introduction
Cowpea (Vigna unguiculata Linn.) is vigna species of cowpea, papilionoid of legume. There are about 150 species of Vigna plants distributed in tropical regions [1]. Under short-term salt stress conditions, cowpea itself will form a defense mechanism in response to waterlogging, drought, and salt stress, and produce enzymatic and non-enzymatic antioxidant defense systems (antioxidant enzymes, antioxidants, and others) and osmoprotective substances (such as soluble sugar and soluble proteins) to alleviate the oxidative damage caused by salt stress [2,3]. However, with the prolongation of salt stress, cells will accumulate a large amount of reactive oxygen species (ROS) and break ROS metabolic system balance, thus aggravating membrane lipid peroxidation and inactivating biological macromolecules such as proteins and enzymes in cells, further resulting in the damage to the structure and function of cell membranes, the decreased photosynthetic capacity, and the hindered carbohydrate synthesis, eventually affecting the morphogenesis of crop reproductive development [4,5].
The natural plant hormone 2,4-epibrassinolide (EBR) is involved in plant cell division and elongation, photomorphogenesis, flowering, and the formation of yield and quality [6]. A large number of studies have shown that EBR can effectively remove excess ROS, prevent excessive oxidation of cells, and effectively alleviate abiotic stress damage caused by adversity stress in crops. EBR can improve the electron transfer rate of optical system and assign photosynthetic energy to photochemical reaction by improving the antioxidant system of plants [7,8]. However, there are few reports on the effects of exogenous EBR on physiological indicators of cowpea under salt stress. In this study, using 53 cowpea varieties as materials, a hydroponic experiment was carried out to investigate the effects of EBR pretreatment on physiological parameters such as photosynthetic parameters (net photosynthetic rate [Pn], intercellular CO2 concentration [Ci], stomatal conductance [Gs], and transpiration rate [Tr]), photosynthetic pigments (chlorophyll a [Chla], chlorophyll b [Chlb], and carotenoids [Car]), spectral parameters (actual photosynthetic efficiency [Y(II)], photochemical quenching [qP], non-photochemical quenching [NPQ], and variable/maximal fluorescence intensity [Fv/Fm]), fluorescence parameters (anthocyanin reflectance index [ARI1], carotenoid reflectance index [CRI1], photochemical reflectance index [PRI], and vegetation senescence reflectance index [PSRI]), and photosynthetic enzyme (ribulose 1,5-biphosphate carboxylase [Rubisco]) of cowpea seedlings under salt stress. This study also examined the differences in the physiological responses of different cowpea varieties to EBR and explored the physiological regulation function of EBR on cowpea plants under salt stress. Our findings will provide theoretical support for the use of EBR to relieve cowpea salt stress damage.
2 Materials and methods
2.1 Experiment materials
The 53 varieties of cowpea were used as the experiment materials (Table 1), all of which were provided by Hubei Province Engineering Research Center for Legume Plants.
Fifty-three cowpea varieties
| Variety number | Variety name | Geographical origin | Variety characteristics | Variety number | Variety name | Geographical origin | Variety characteristics |
|---|---|---|---|---|---|---|---|
| 1 | Qingtiao | Liaoning | Ramble, mid-ripe | 28 | Chaonenglinghang | Jiangxi | Ramble, precocity |
| 2 | Baiziqingtiao | Liaoling | Ramble, precocity | 29 | Sanjiang 100 | Guangdong | Ramble, precocity |
| 3 | Chunqiuhong | Hubei | Ramble, precocity | 30 | Sanmei 8 | Guangdong | Ramble, precocity |
| 4 | Yinyan | Hubei | Ramble, precocity | 31 | ID-0613 | Hubei | Ramble, mid-ripe |
| 5 | Jiang Da Zi Jiang 1 | Hubei | Ramble, precocity | 32 | WJ-60 | Hubei | Ramble, mid-ripe |
| 6 | Bailongzaoshuai | Jiangxi | Ramble, precocity | 33 | Baidoujiao | Guangdong | Ramble, mid-ripe |
| 7 | Didou | America | Dwarf, late-maturing | 34 | Hongdoujiao | Guangdong | Ramble, mid-ripe |
| 8 | Ejiangdou 7 | Hubei | Dwarf, late-maturing | 35 | Huadoujiao | Guangdong | Ramble, precocity |
| 9 | Liucui | Hubei | Ramble, mid-ripe | 36 | Ziqiujiang 6 | Jiangxi | Ramble, mid-ripe |
| 10 | Huaguliang | Sichuan | Dwarf, mid-ripe | 37 | JD-0835 | Hubei | Ramble, precocity |
| 11 | Xinwujia | Hubei | Ramble, late-maturing | 38 | Yuanzhongwujiadu | America | Dwarf, late-maturing |
| 12 | Baijinchanglong | Jiangxi | Ramble, precocity | 39 | Baipiduanjiang | Fujian | Ramble, late-maturing |
| 13 | Wufeng1 | Hubei | Ramble, precocity | 40 | Didoujiao 0213 | Ningxia | Ramble, precocity |
| 14 | Yibashuz | Hubei | Ramble, late-maturing | 41 | Hongshanyugu 2-13 | Hubei | Ramble, late-maturing |
| 15 | Baiyulong | Shandong | Ramble, precocity | 42 | Wujiachunqiuhong | Jiangxi | Dwarf, mid-ripe |
| 16 | Sanchibaiyu | Shandong | Ramble, late-maturing | 43 | Cqingjiachang | Hubei | Ramble, mid-ripe |
| 17 | Yuanzhongguanjun | Shandong | Ramble, mid-ripe | 44 | A287-1 | Hubei | Ramble, precocity |
| 18 | Yinjiangwang | Shandong | Ramble, precocity | 45 | A298 hong | Guangdong | Ramble, precocity |
| 19 | Huanglei | Liaoling | Ramble, mid-ripe | 46 | A298 hei | Guangdong | Ramble, precocity |
| 20 | 901 | Liaoling | Ramble, late-maturing | 47 | Zhanyanbaidoujiao | Fujian | Ramble, mid-ripe |
| 21 | Tiande 1 | Sichuan | Ramble, late-maturing | 48 | Baipi | Fujian | Ramble, mid-ripe |
| 22 | 902 | Liaoling | Ramble, late-maturing | 49 | Huarong | Hubei | Ramble, mid-ripe |
| 23 | Yellow of qingtiao | Liaoling | Ramble, late-maturing | 50 | Huangjia | Hubei | Ramble, late-maturing |
| 24 | 668 | Liaoling | Ramble, mid-ripe | 51 | Lvguan | Jiangsu | Ramble, precocity |
| 25 | Chenbao 4 | Hubei | Ramble, precocity | 52 | Yidianhong | Hong Kong | Ramble, precocity |
| 26 | Yipinduxiu | Jiangxi | Ramble, precocity | 53 | Changde cowpea | Hunan | Ramble, late-maturing |
| 27 | Zhecui 4 | Zhejiang | Ramble, late-maturing |
2.2 Experiment design
The experiment was carried out in the plant incubator of Hubei Province Bean (Vegetable) Plant Engineering Technology Research Center from March to June 2022. Cowpea seeds were soaked at 45°C for 30 min, sown in plug trays with two cowpea seeds sown in each hole, and cultured at 28°C without light throughout the day. The culture conditions are shown in Table 2. After germination, when the seedlings grew to the stage of three leaves and one core, healthy seedlings with consistent growth status were selected and transplanted into hydroponic tanks. The hydroponic tank was 9 cm in diameter and10 cm in height. Three seedlings were cultured in each tank, and the culture medium was 1/2 Hoagland nutrient solution. After continuous culture for 7 days, EBR (0.1 μmol L−1, purchased from Sigma Company) was sprayed onto the seedlings once in the morning and once in the evening for 2 days. Immediately after EBR spraying, salt stress treatment was carried out. There were four treatments for each variety including CK treatment, 150 mmol L−1 NaCl treatment, 0.1 μmol L−1 EBR treatment, and 0.1 μmol L−1 EBR + 150 mmol L−1 NaCl treatment (Table 3).
Incubator setting conditions
| Time (h) | 1 | 2 | 3 | 4 | 5 | 6 |
| Temperature (℃) | 16 | 16 | 16 | 16 | 17 | 18 |
| Light intensity (lux) | 0 | 0 | 0 | 0 | 0 | 3,000 |
| Time (h) | 7 | 8 | 9 | 10 | 11 | 12 |
| Temperature (℃) | 19 | 20 | 21 | 22 | 23 | 24 |
| Light intensity (lux) | 3,000 | 3,000 | 3,000 | 3,000 | 6,000 | 6,000 |
| Time (h) | 13 | 14 | 15 | 16 | 17 | 18 |
| Temperature (℃) | 25 | 24 | 23 | 22 | 21 | 20 |
| Light intensity (lux) | 6,000 | 6,000 | 3,000 | 3,000 | 3,000 | 3,000 |
| Time (h) | 19 | 20 | 21 | 22 | 23 | 24 |
| Temperature (℃) | 19 | 18 | 17 | 16 | 16 | 16 |
| Light intensity (lux) | 3,000 | 0 | 0 | 0 | 0 | 0 |
Treatment
| Number | Treatment |
|---|---|
| C | CK |
| N | 150 mmol L−1 NaCl |
| E | 0.1 μmol L−1 EBR |
| EN | 0.1 μmol L−1 EBR + 150 mmol L−1 NaCl |
2.3 Determination method
2.3.1 Determination of photosynthetic parameters
Photosynthetic parameters were determined at 9:00–12:00 3 days after the NaCl stress. The light intensity was set at 1,200 μmol m−2 s−1, the CO2 volume fraction was set as 0.04%, and the temperature was set at 25°C. We measured the Pn (CO2 μmol m−2 s−1), Tr (H2O mmol m−2 s−1), Gs (H2O mol m−2 s−1), Ci (CO2 μmol mol−1), and other parameters of the functional leaves of each cowpea variety with LI-6400 portable plant photosynthesis instrument [9]. The measures were repeated three times, and the average value of three replicates was calculated.
2.3.2 Fluorescence parameter measurement
Fluorescence parameter was measured at 9:00–12:00 3 days after the stress, the multi-channel continuous monitoring fluorescence instrument Monitoring-PAM (WALZ, Germany) was used to measure the chlorophyll fluorescence parameters excited by the laser after 15 min of dark adaptation. Y(II), qP, NPQ, and maximum photochemical quantum yield Fv/Fm were measured with three replicates, and the average was calculated [10].
2.3.3 Measurement of spectral parameters
Spectral parameters were measured at 9:00–12:00 3 days after the stress, accompanied by the measurement of fluorescence parameters. The spectral reflectance of leaves of different varieties was measured using a plant leaf spectrometer (CI-710, United States). During the measurement, the leaves were placed flat, and the direction of the measured leaves was consistent. Three leaves were measured each time, and the average value was taken as the measured value of the reflectance spectrum parameters of the leaf. CRI1, ARI1, PRI, and PSRI were measured with three replicates, and the average value of three replicates was calculated [11].
2.3.4 Determination of botanical traits
Botanical traits were determined 3 days after the stress, accompanied by the determination of photosynthetic parameters. The length and width of the leaves were measured with three replicates, and the average value was taken.
2.3.5 Determination of photosynthetic pigments
The photosynthetic pigments of leaves were determined 3 days after the stress according to the method reported by Li et al. [12] with three replicates, and the average value was taken.
2.3.6 Determination of photosynthetic enzyme
The photosynthetic enzyme was measured 3 days after the stress. Rubisco in leaves was measured according to the instruction in plant ribulose 1,5-biphosphate carboxylase kit (Nanjing Jiancheng) with three replicates. The average value of three replicates was taken.
2.4 Data processing
IBM SPSS Statistics 20 software was used to calculate the mean value and standard deviation and performed the principal component analysis (PCA) and the cluster analysis. The coefficient of variation (CV) was calculated by Excel 2016 software, and the correlation analysis was conducted with the Origin 2022 software. Hierarchical clustering method was adopted to classify cowpeas and the Euclidean distance was calculated.
3 Results
3.1 Performance and difference of exogenous EBR on photosynthetic traits of 53 cowpea varieties under NaCl stress
Table 4 shows that in CK, in 53 cowpea varieties, the average Pn was CO2 μmol m−2 s−1, the average of Gs was 0.469 H2O mol m−2 s−1, the average of Ci was 324.000 CO2 μmol mol−1, the average of Tr was 3.234 H2O mmol m−2 s−1, the average of Rubisco was 24.108 mg/g, the average of Chla was 0.558 mg/g, the average of Chlb was 0.199 mg/g, the average of Car was 0.113 mg/g, the average of total chlorophyll (Chl(a + b)) was 0.757 mg/g, the average leaf length was 7.509 cm, the average leaf width was 4.758 cm, the Y(II) was 0.623, the average of qP was 0.896, the average of NPQ was 0.044, the average of Fv/Fm was 0.703, the average ARI1 was 0.015, the average of CRI1 was 0.035, the average of PRI was 0.023, and the average of PSRI was 0.027. The CV of 19 photosynthetic traits of different varieties of cowpea was relatively large, ranging from 7.235 to 76.483%. Among them, the CV of NPQ was the largest, which was 76.483%, and that of qP was the smallest, which was 7.235%. The three CVs were ≤10%, and they were CV of Ci, qP, and Fv/Fm. Six CVs were between 10 and 20%, and they were CV of Pn, leaf length, leaf width, Y(II), ARI1, and CRI1. Twelve CVs were >20%, namely, CV of Gs, Tr, Rubisco, Chla, Chlb, Car, Chl(a + b), NPQ, PRI, and PSRI.
Performance and difference of photosynthetic characters of cowpea varieties under CK
| Properties | Mean value | Standard deviation | Maximum value | Minimum value | CV (%) |
|---|---|---|---|---|---|
| Pn (CO2 μmol m−2 s−1) | 11.260 | 2.022 | 15.854 | 6.027 | 17.958 |
| Gs (H2O mol m−2 s−1) | 0.469 | 0.259 | 1.138 | 0.084 | 55.166 |
| Ci (CO2 μmol mol−1) | 324.000 | 24.920 | 361.118 | 259.374 | 7.691 |
| Tr (H2O mmol m−2 s−1) | 3.234 | 0.889 | 4.634 | 1.030 | 27.487 |
| Rubisco (mg/g) | 24.108 | 7.728 | 46.340 | 11.354 | 32.056 |
| Chla (mg/g) | 0.558 | 0.113 | 0.751 | 0.302 | 20.246 |
| Chlb (mg/g) | 0.199 | 0.042 | 0.281 | 0.109 | 20.945 |
| Car (mg/g) | 0.113 | 0.025 | 0.163 | 0.055 | 22.297 |
| Chl(a + b) (mg/g) | 0.757 | 0.153 | 1.031 | 0.411 | 20.272 |
| Leaf length (cm) | 7.509 | 0.752 | 10.100 | 5.867 | 10.018 |
| Leaf width (cm) | 4.758 | 0.559 | 6.367 | 3.733 | 11.739 |
| Y(II) | 0.623 | 0.072 | 0.745 | 0.421 | 11.587 |
| qP | 0.896 | 0.065 | 0.975 | 0.737 | 7.235 |
| NPQ | 0.044 | 0.034 | 0.182 | 0.009 | 76.483 |
| Fv/Fm | 0.703 | 0.061 | 0.819 | 0.506 | 8.647 |
| ARI1 | 0.015 | 0.002 | 0.019 | 0.012 | 10.251 |
| CRI1 | 0.035 | 0.006 | 0.046 | 0.018 | 16.918 |
| PRI | 0.023 | 0.008 | 0.046 | 0.004 | 36.383 |
| PSRI | 0.027 | 0.015 | 0.089 | 0.011 | 53.381 |
As shown in Table 5, under NaCl stress, in 53 cowpea varieties, the average Pn was 0.801 CO2 μmol m−2 s−1, the average Gs was 0.016 H2O mol m−2 s−1, the average Ci was 458.226 CO2 μmol mol−1, the average Tr was 0.203 H2O mmol m−2 s−1, the average Rubisco was 18.715 mg/g, the average Chla was 0.459 mg/g, the average Chlb was 0.168 mg/g, the average Car was 0.105 mg/g, the average Chl(a + b) was 0.627 mg/g, the average leaf length was 7.011 cm, the average leaf width was 4.558 cm, the average Y(II) was 0.690, the average qP was 0.918, the average NPQ was 0.043, the average Fv/Fm was 0.760, the average ARI1 was 0.015, the average CRI1 was 0.033, the average PRI was 0.029, and the average PSRI was 0.031. The CV of the 19 photosynthetic traits of different varieties of cowpea was relatively large, ranging from 5.503 to 86.645%. Pn exhibited the largest CV (86.645%), while qP displayed the smallest CV (5.503%). Three CVs were ≤10%, and they were CV of qP, Fv/Fm, and Y(II). Four CVs were between 10 and 20%, and they were CV of leaf length, leaf width, ARI1, and CRI1. Twelve CVs were >20%, namely, CV of Pn, Gs, Ci, Tr, Rubisco, Chla, Chlb, Car, Chl(a + b), NPQ, PRI, and PSRI.
Performance and difference of photosynthetic characters of cowpea varieties under NaCl stress
| Properties | Mean value | Standard deviation | Maximum value | Minimum value | CV (%) |
|---|---|---|---|---|---|
| Pn (CO2 μmol m−2 s−1) | 0.801 | 0.694 | 3.419 | 0.024 | 86.645 |
| Gs (H2O mol m−2 s−1) | 0.016 | 0.013 | 0.065 | 0.000 | 77.915 |
| Ci (CO2 μmol mol−1) | 458.226 | 180.937 | 953.432 | 263.141 | 39.486 |
| Tr (H2O mmol m−2 s−1) | 0.203 | 0.149 | 0.769 | 0.005 | 73.511 |
| Rubisco (mg/g) | 18.715 | 7.410 | 40.972 | 6.007 | 39.593 |
| Chla (mg/g) | 0.459 | 0.117 | 1.023 | 0.299 | 25.488 |
| Chlb (mg/g) | 0.168 | 0.044 | 0.390 | 0.108 | 26.103 |
| Car (mg/g) | 0.105 | 0.022 | 0.206 | 0.064 | 20.814 |
| Chl(a + b) (mg/g) | 0.627 | 0.160 | 1.413 | 0.407 | 25.525 |
| Leaf length (cm) | 7.011 | 0.851 | 8.833 | 5.233 | 12.132 |
| Leaf width (cm) | 4.558 | 0.547 | 6.367 | 3.400 | 11.992 |
| Y(II) | 0.690 | 0.047 | 0.782 | 0.520 | 6.755 |
| qP | 0.918 | 0.051 | 0.983 | 0.749 | 5.503 |
| NPQ | 0.043 | 0.032 | 0.188 | 0.014 | 74.637 |
| Fv/Fm | 0.760 | 0.053 | 0.936 | 0.609 | 7.001 |
| ARI1 | 0.015 | 0.002 | 0.019 | 0.012 | 10.357 |
| CRI1 | 0.033 | 0.005 | 0.043 | 0.018 | 16.140 |
| PRI | 0.029 | 0.008 | 0.048 | 0.013 | 29.043 |
| PSRI | 0.031 | 0.014 | 0.076 | 0.005 | 45.553 |
As shown in Table 6, under EBR treatment, in 53 cowpea varieties, the average Pn was 10.909 μmol m−2 s−1, the average Gs was 0.453 H2O mol m−2 s−1, the average Ci was 321.971 CO2 μmol mol−1, the average Tr was 3.105 H2O mmol m−2 s−1, the average Rubisco was 29.137 mg/g, the average Chla was 0.577 mg/g, the average Chlb was 0.208 mg/g, the average Car was 0.114 mg/g, the average Chl(a + b) was 0.785 mg/g, the average leaf length was 7.289 cm, the average leaf width was 4.733 cm, the average Y(II) was 0.623, the average qP was 0.899, the average NPQ was 0.050, the average Fv/Fm was 0.704, the average ARI1 was 0.015, the average CRI1 was 0.034, the average PRI was 0.025, and the average PSRI was 0.027. The CVs of the 19 photosynthetic traits of different varieties of cowpea were relatively large, ranging from 5.805 to 103.782%. Among them, the CV of NPQ was the highest (103.782%), while the CV of qP was the smallest (5.805%). Four CVs were ≤10%, and they were CV of Ci, qP, Y(II), and Fv/Fm. Six CVs were between 10 and 20%, and they were CV of Pn, Chla, leaf length, leaf width, ARI1, and CRI1. Nine CVs were >20%, namely, CV of Gs, Tr, Rubisco, Chlb, Car, Chl(a + b), NPQ, PRI, and PSRI.
Performance and difference of photosynthetic characters of cowpea varieties under EBR treatment
| Properties | Mean value | Standard deviation | Maximum value | Minimum value | CV (%) |
|---|---|---|---|---|---|
| Pn (CO2 μmol m−2 s−1) | 10.909 | 1.439 | 14.352 | 7.797 | 13.193 |
| Gs (H2O mol m−2 s−1) | 0.453 | 0.262 | 1.097 | 0.074 | 57.679 |
| Ci (CO2 μmol mol−1) | 321.971 | 28.595 | 361.450 | 249.686 | 8.881 |
| Tr (H2O mmol m−2 s−1) | 3.105 | 0.909 | 4.670 | 0.767 | 29.272 |
| Rubisco (mg/g) | 29.137 | 8.663 | 55.212 | 14.105 | 29.733 |
| Chla (mg/g) | 0.577 | 0.115 | 0.786 | 0.343 | 19.995 |
| Chlb (mg/g) | 0.208 | 0.048 | 0.338 | 0.126 | 23.337 |
| Car (mg/g) | 0.114 | 0.024 | 0.164 | 0.065 | 21.478 |
| Chl(a + b) (mg/g) | 0.785 | 0.162 | 1.089 | 0.468 | 20.665 |
| Leaf length (cm) | 7.289 | 0.735 | 8.900 | 5.400 | 10.077 |
| Leaf width (cm) | 4.733 | 0.528 | 6.200 | 3.800 | 11.159 |
| Y(II) | 0.623 | 0.044 | 0.692 | 0.511 | 7.113 |
| qP | 0.899 | 0.052 | 0.981 | 0.772 | 5.805 |
| NPQ | 0.050 | 0.052 | 0.361 | 0.014 | 103.782 |
| Fv/Fm | 0.704 | 0.053 | 0.795 | 0.543 | 7.468 |
| ARI1 | 0.015 | 0.002 | 0.019 | 0.012 | 11.296 |
| CRI1 | 0.034 | 0.006 | 0.049 | 0.017 | 16.138 |
| PRI | 0.025 | 0.010 | 0.060 | 0.006 | 39.963 |
| PSRI | 0.027 | 0.015 | 0.092 | 0.011 | 57.264 |
It can be seen from Table 7, under EBR treatment and NaCl stress, in 53 cowpea varieties that the average Pn was 0.870 CO2 μmol m−2 s−1, the average Gs was 0.015 H2O mol m−2 s−1, the average Ci was 435.247 CO2 μmol mol−1, the average Tr was 0.186 H2O mmol m−2 s−1, the average Rubisco was 21.785 mg/g, the average Chla was 0.431 mg/g, the average Chlb was 0.159 mg/g, the average Car was 0.099 mg/g, the average Chl(a + b) was 0.590 mg/g, the average leaf length was 7.194 cm, the average leaf width was 4.587 cm, the average Y(II) was 0.696, the average qP was 0.922, the average NPQ was 0.035, the average Fv/Fm was 0.761, the average ARI1 was 0.015, the average CRI1 was 0.034, the average PRI was 0.029, and the average PSRI was 0.025. The CVs of the 19 photosynthetic traits of different varieties of cowpea were relatively large, ranging from 5.745 to 71.130%. Among them, the CV of NPQ was the largest, which was 71.130%, while the CV of qP was the smallest, which was 5.745%. Three CVs were ≤10%, and they were CV of Y(II), qP, and Fv/Fm. Five CVs were between 10 and 20%, which were CV of Car, leaf length, leaf width, ARI1, and CRI1. Eleven CVs were >20%, namely, CV of Pn, Ci, Gs, Tr, Rubisco, Chla, Chlb, Chl(a + b), NPQ, PRI, and PSRI.
Performance and difference of photosynthetic characters of cowpea varieties under EBR treatment and NaCl stress
| Properties | Mean value | Standard deviation | Maximum value | Minimum value | CV (%) |
|---|---|---|---|---|---|
| Pn (CO2 μmol m−2 s−1) | 0.870 | 0.600 | 3.096 | 0.015 | 69.021 |
| Gs (H2O mol m−2 s−1) | 0.015 | 0.009 | 0.035 | 0.001 | 58.429 |
| Ci (CO2 μmol mol−1) | 435.247 | 176.305 | 992.758 | 222.016 | 40.507 |
| Tr (H2O mmol m−2 s−1) | 0.186 | 0.098 | 0.416 | 0.017 | 52.684 |
| Rubisco (mg/g) | 21.785 | 7.585 | 40.250 | 8.941 | 34.817 |
| Chla (mg/g) | 0.431 | 0.089 | 0.723 | 0.272 | 20.703 |
| Chlb (mg/g) | 0.159 | 0.034 | 0.266 | 0.095 | 21.699 |
| Car (mg/g) | 0.099 | 0.018 | 0.136 | 0.067 | 18.552 |
| Chl(a + b) (mg/g) | 0.590 | 0.123 | 0.989 | 0.367 | 20.768 |
| Leaf length (cm) | 7.194 | 0.782 | 9.367 | 5.467 | 10.875 |
| Leaf width (cm) | 4.587 | 0.548 | 5.867 | 2.933 | 11.953 |
| Y(II) | 0.696 | 0.064 | 0.774 | 0.447 | 9.236 |
| qP | 0.922 | 0.053 | 0.978 | 0.766 | 5.745 |
| NPQ | 0.035 | 0.025 | 0.162 | 0.010 | 71.130 |
| Fv/Fm | 0.761 | 0.054 | 0.866 | 0.590 | 7.095 |
| ARI1 | 0.015 | 0.002 | 0.019 | 0.011 | 12.444 |
| CRI1 | 0.034 | 0.005 | 0.046 | 0.017 | 15.841 |
| PRI | 0.029 | 0.009 | 0.046 | 0.007 | 29.744 |
| PSRI | 0.025 | 0.014 | 0.093 | 0.004 | 57.535 |
3.2 Correlation analysis of exogenous EBR on photosynthetic traits of 53 cowpea varieties under NaCl stress
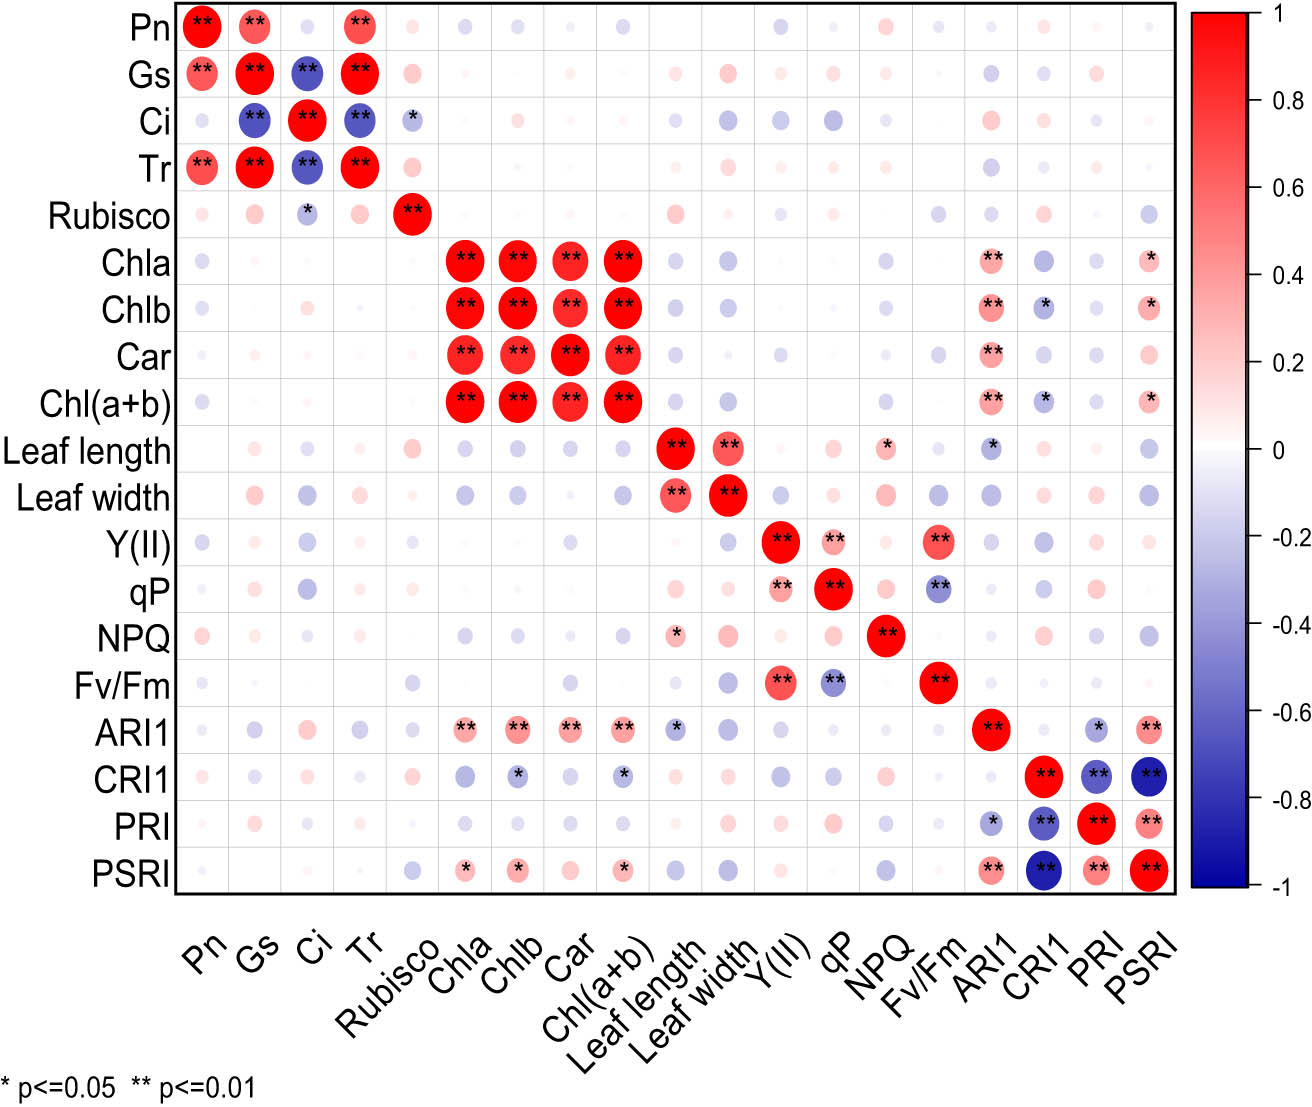
Figure 1 shows that in CK, significant differences in the correlation were observed among 19 photosynthetic traits of cowpea varieties. Pn was extremely significantly positively correlated with Gs, Ci, Tr, and significantly positively correlated with leaf width, but extremely significantly negatively correlated with Fv/Fm, and significantly negatively correlated with Chla, Chlb, and Chl(a + b). Gs was significantly positively correlated with Rubisco, but extremely significantly negatively correlated with Chla, Chlb, Chl(a + b), and significantly negatively correlated with Car. Ci was extremely significantly negatively correlated with Chla, Chlb, Chl(a + b), Y(II), Fv/Fm, and significantly negatively correlated with Car. Tr exhibited an extremely significant negative correlation with Fv/Fm, and significant negative correlation with Y(II). Rubisco displayed a significant negative correlation with Fv/Fm. Chla showed an extremely significant positive correlation with Chlb, Car, Chl(a + b), Fv/Fm, and ARI1. Chlb was extremely significantly positively correlated with Car, Chl(a + b), Fv/Fm, and ARI1. Car exhibited an extremely significant positive correlation with Chl(a + b) and ARI1. Chl(a + b) showed an extremely significant positive correlation with Fv/Fm and ARI1. Leaf length was extremely significantly positively correlated with leaf width, and significantly positively correlated with PRI, but significantly negatively correlated with ARI1. Leaf width was significantly negatively correlated with ARI1. Y(II) was extremely significantly positively correlated with qP and Fv/Fm. NPQ exhibited a significant negative correlation with ARI1. ARI1 displayed a highly significant positive correlation with PSRI. CRI1 presented a significant negative correlation with PRI and PSRI. There was a very significant positive correlation between PRI and PSRI. Under CK treatment, Pn displayed an extremely significant positive correlation with Gs, Ci, Tr, and significant positive correlation with leaf width, but an extremely significant negative correlation with Fv/Fm, and significant negative correlation with Chla, Chlb, and Chl(a + b).

Correlation analysis of photosynthetic characters of cowpea varieties under CK. ** Indicates significant correlation at 0.01 level, while * indicates significant correlation at 0.05 level. The red balls in the graph represent a positive correlation between two indicators, while the blue balls represent a negative correlation. The deeper color or larger size of the balls represents a stronger correlation.
It can be seen from Figure 2 that under NaCl stress, there were significant differences in the correlation of 19 photosynthetic traits of cowpea varieties. Pn exhibited highly significant positive correlation with Gs and Tr. Gs was extremely significantly positively correlated with Tr, but extremely significantly negatively correlated with Ci. Ci was extremely significantly negatively correlated with Tr, and significantly negatively correlated with rubisco. Chla was highly significantly positively correlated with Chlb, Car, Chl(a + b), and ARI1, and it was significantly positively correlated with PSRI. Chlb exhibited an extremely significant positive correlation with Car, Chl(a + b), and ARI1, a significant positive correlation with PSRI, but a significant negative correlation with CRI1. Car displayed a significant positive correlation with Chl(a + b) and ARI1. Chl(a + b) presented a highly significant positive correlation with ARI1, and a significant positive correlation with PSRI, but a significant negative correlation with CRI1. Leaf length was extremely significantly positively correlated with leaf width, significantly positively correlated with NPQ, and significantly negatively correlated with ARI1. Y(II) was extremely significantly positively correlated with qP and Fv/Fm. qP was extremely significantly negatively correlated with Fv/Fm. ARI1 was highly significantly positively correlated with PSRI, but significantly negatively correlated with PRI. CRI1 was significantly negatively correlated with PRI and PSRI. There was a very significant positive correlation between PRI and PSRI. Under NaCl stress, Pn was highly significantly positively correlated with Gs and Tr, but extremely significantly negatively correlated with Ci.
Correlation analysis of photosynthetic characters of cowpea varieties under NaCl stress. ** Indicates significant correlation at 0.01 level, while * indicates significant correlation at 0.05 level. The red balls in the graph represent a positive correlation between two indicators, while the blue balls represent a negative correlation. The deeper color or larger size of the balls represents a stronger correlation.
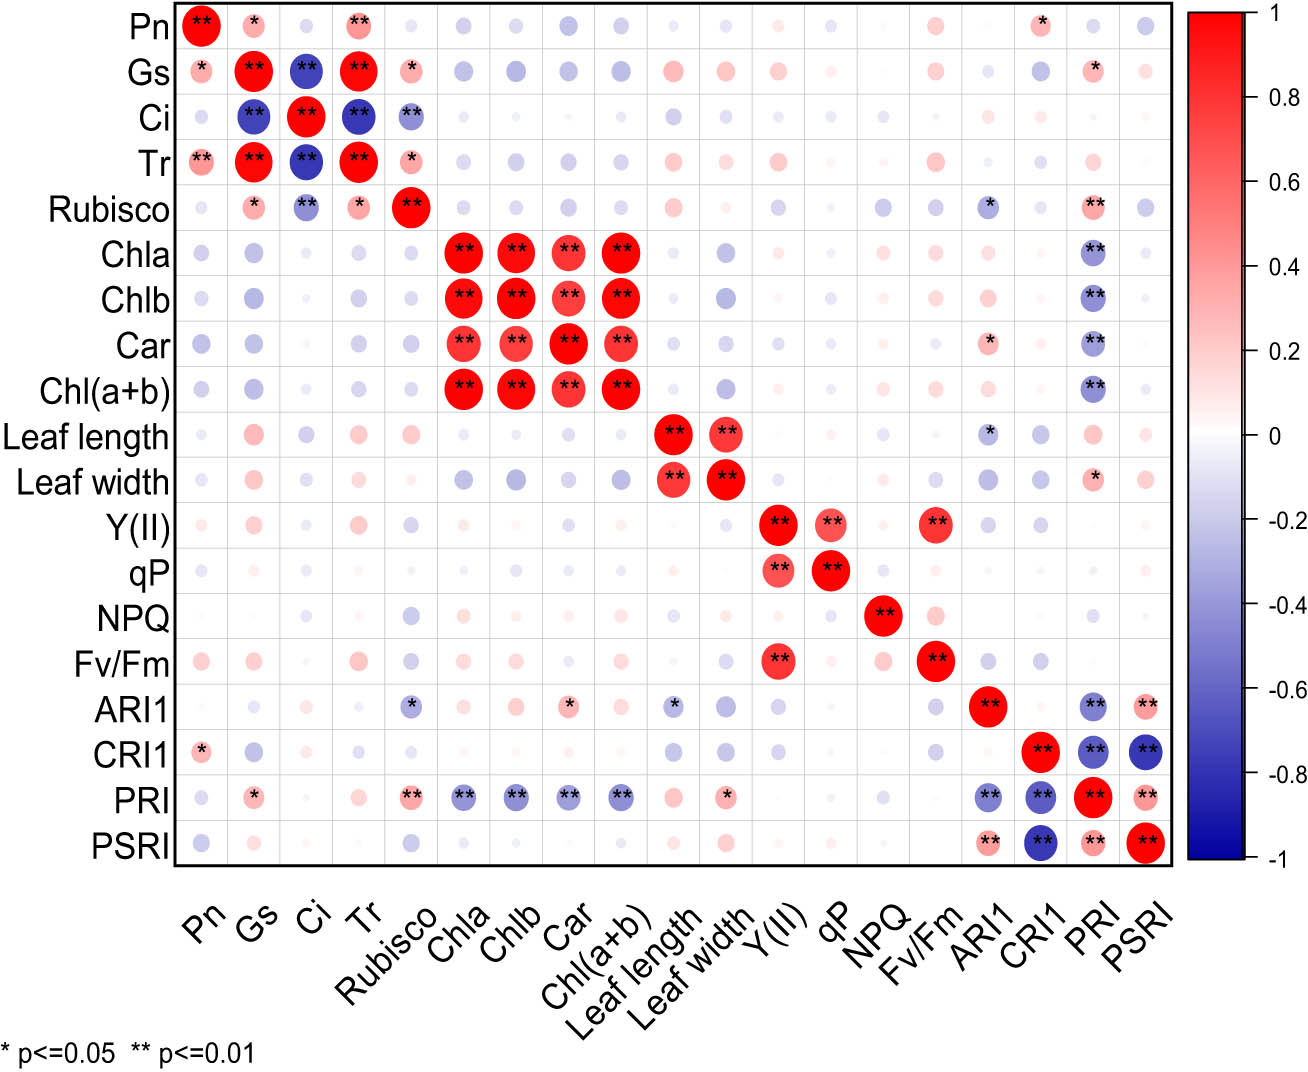
As shown in Figure 3, under the EBR treatment, there were significant differences in the correlation of 19 photosynthetic traits of cowpea varieties. Pn was highly significantly positively correlated with Gs, Ci, and Tr, but significantly negatively correlated with Chla, Chlb, Chl(a + b), and Y(II). Gs was extremely significantly positively correlated with Ci and Tr, but extremely significantly negatively correlated with Chla, Chlb, Chl(a + b), and significantly negatively correlated with Fv/Fm. There was a highly significant positive correlation between Ci and Tr, and a significant positive correlation between Ci and PRI, but a highly significant negative correlation between Ci and Chla, Chlb, Chl(a + b), or Y(II), and a significant negative correlation between Ci and Fv/Fm or CRI1. Tr was significantly negatively correlated with Chla, Chl(a + b), Fv/Fm, and Y(II). Rubisco was significantly positively correlated with leaf length, but significantly negatively correlated with Fv/Fm. A highly significant positive correlation was observed between Chla and Chlb, Car, Chl(a + b), or ARI1, and a significant positive correlation between Chla and Fv/Fm, Y(II), or NPQ, but an extremely significant negative correlation between Chla and PRI. Chlb was highly significantly positively correlated with Car, Chl(a + b), and ARI1, and significantly positively correlated with Y(II), but extremely significantly negatively correlated with PRI. Car displayed a highly significant positive correlation with Chl(a + b) and ARI1, a significant positive correlation with NPQ, and an extremely significant negative correlation with PRI. Chl(a + b) exhibited a highly significant positive correlation with ARI1, a significant positive correlation with Fv/Fm, Y(II), and NPQ, but a highly significant negative correlation with PRI. Leaf length was highly significantly positively correlated with leaf width, and significantly negatively correlated with ARI1. Leaf width was significantly negatively correlated with ARI1. Y(II) was highly significantly positively correlated with Fv/Fm and significantly positively correlated with qP. There was a significant positive correlation between qP and CRI1, and an extremely significant negative correlation with Fv/Fm, but a significant negative correlation with PSRI. A significant positive correlation was observed between NPQ and Fv/Fm, between Fv/Fm and ARI1, between ARI1 and PSRI, whereas an extremely significant negative correlation between ARI1and PRI. A significant negative correlation was found between CRI1 and PRI or PSRI. There was a very significant positive correlation between PRI and PSRI. Under EBR treatment, Pn was extremely significantly positively correlated with Gs, Ci, Tr, and significantly negatively correlated with Chla, Chlb, Chl(a + b), and Y(II).

Correlation analysis of photosynthetic characters of cowpea varieties under EBR treatment. ** Indicates significant correlation at 0.01 level, while * indicates significant correlation at 0.05 level. The red balls in the graph represent a positive correlation between two indicators, while the blue balls represent a negative correlation. The deeper color or larger size of the balls represents a stronger correlation.
It can be seen from Figure 4 that there were significant differences in the correlation among 19 photosynthetic traits of cowpea varieties under EBR treatment and NaCl stress. Pn was extremely significantly positively correlated with Tr, and significantly positively correlated with Gs and CRI1. Gs was extremely significantly positively correlated with Tr, significantly positively correlated with rubisco and PRI, and extremely significantly negatively correlated with Ci. There was an extremely significant negative correlation between Ci and Tr or rubisco, but a significant positive correlation between Tr and rubisco. A highly significant positive correlation was observed between rubisco and PRI, but a significant negative correlation between rubisco and ARI1. Chla was highly significantly positively correlated with Chlb, Car, Chl(a + b), and extremely significantly negatively correlated with PRI. Chlb was highly significantly positively correlated with Car and Chl(a + b), and extremely significantly negatively correlated with PRI. Car displayed an extremely significant positive correlation with Chl(a + b), and a significant positive correlation with ARI1, but an extremely significant negative correlation with PRI. Chl(a + b) exhibited an extremely significant negative correlation with PRI. Leaf length was highly significantly positively correlated with leaf width, and significantly negatively correlated with ARI1. Leaf width and PRI were significantly positively correlated. There was a highly significant positive correlation between Y(II) and qP or Fv/Fm, between ARI1and PSRI, but an extremely significant negative correlation between ARI1 and PRI. CRI1 displayed a significant negative correlation with PRI and PSRI. There was an extremely significant positive correlation between PRI and PSRI. Under EBR treatment and NaCl stress, Pn was extremely significantly positively correlated with Tr, but significantly positively correlated with Gs and CRI1.
Correlation analysis of photosynthetic characters of cowpea varieties under EBR treatment and NaCl stress. ** Indicates significant correlation at 0.01 level, while * indicates significant correlation at 0.05 level. The red balls in the graph represent a positive correlation between two indicators, while the blue balls represent a negative correlation. The deeper color or larger size of the balls represents a stronger correlation.
The above correlation analysis results of the 19 photosynthetic traits of cowpea under four treatments revealed that Pn and Tr were extremely significantly positively correlated under all treatments, and Pn and Gs were significantly positively correlated. Pn and Ci were extremely significantly positively correlated under C and E treatments in the control group, whereas they were negatively correlated under N and EN treatments, but not significantly. Pn was significantly negatively correlated with Chla, Chlb, Chl(a + b) in the control group under C and E treatments, but they were negatively correlated under N and EN treatments without significance.
3.3 PCA of photosynthetic traits of 53 cowpea varieties after applying exogenous EBR under NaCl stress
As can be seen from Figure 5, with the increase in the number of principal components, the eigenvalues gradually decrease. The eigenvalues of the first six principal components are all greater than 1, and the connecting lines are steeper, indicating that the first six principal components contribute the most to explaining the variables. Therefore, the first six principal components are extracted.

Scree plot of PCA of photosynthetic characteristics of cowpea varieties under CK.
In CK, based on 19 photosynthetic traits of 53 cowpea varieties, the eigenvectors and contribution rates of each principal component were calculated (Table 8). As for the first principal component (PC1), its eigenvalue was 5.613, and the contribution rate was 29.543%. With Pn, Gs, Ci, Chla, Chlb, Car, Chl(a + b), and Fv/Fm serving as the main indicators, the eigenvectors were −0.592, −0.742, −0.690, 0.881, 0.869, 0.749, 0.885, and 0.622, respectively. The PC1 mainly reflected photosynthetic factors. The eigenvalue of the second principal component (PC2) was 2.956, and its contribution rate was 15.558%. With Tr and ARI1 as the main indicators, the eigenvectors were 0.658 and 0.559, respectively, and the vectors were 0.658 and 0.559. The PC2 mainly reflected the transpiration factor. The eigenvalue of the third principal component (PC3) was 2.776, and the contribution rate was 14.611%. With PRI, PSRI, and CRI1 as the main indicators, the eigenvectors were 0.759, 0.922, and −0.855, and this principal component mainly reflected the photochemical reflection factor. The eigenvalue of the fourth principal component (PC4) was 1.759, and the contribution rate was 9.259%. With qP and Y(II) as the main indicators, the eigenvectors were 0.711 and 0.554, respectively, and the PC4 mainly reflected qP factor. The eigenvalue of the fifth principal component (PC5) was 1.508, and its contribution rate was 7.938%. With the leaf length and leaf width as the main indicators, the eigenvectors were 0.653 and 0.561, respectively. The PC5 mainly reflected the leaf length and width factor. The eigenvalue of the six principal components was 1.024, and its contribution rate was 5.390%. With NPQ and Rubisco as the main indicators, the eigenvectors were 0.419 and 0.507, respectively, this principal component mainly reflected the photosynthetic enzyme factor. In CK treatment, the photosynthetic traits of cowpea varieties were mainly assigned into six principal components with a contribution rate of 82.298%, and these six principle components could replace 19 photosynthetic traits to evaluate 53 cowpea varieties.
PCA of photosynthetic characters of cowpea varieties under CK
| Properties | PC1 | PC2 | PC3 | PC4 | PC5 | PC6 |
|---|---|---|---|---|---|---|
| Pn | −0.592 | 0.256 | 0.165 | 0.581 | 0.014 | 0.011 |
| Gs | −0.742 | 0.470 | 0.291 | 0.121 | −0.058 | 0.063 |
| Ci | −0.690 | 0.471 | 0.323 | 0.014 | −0.126 | −0.043 |
| Tr | −0.520 | 0.658 | 0.168 | 0.271 | −0.161 | −0.119 |
| Rubisco | −0.259 | 0.269 | −0.083 | 0.186 | 0.397 | 0.507 |
| Chla | 0.881 | 0.342 | 0.104 | 0.139 | 0.206 | 0.037 |
| Chlb | 0.869 | 0.337 | 0.184 | 0.100 | 0.167 | −0.001 |
| Car | 0.749 | 0.407 | 0.113 | 0.164 | 0.259 | 0.212 |
| Chl(a + b) | 0.885 | 0.343 | 0.126 | 0.130 | 0.197 | 0.028 |
| Leaf length | −0.179 | −0.337 | 0.234 | 0.205 | 0.653 | −0.249 |
| Leaf width | −0.304 | −0.259 | 0.116 | 0.284 | 0.561 | −0.438 |
| Y(II) | 0.483 | −0.516 | 0.167 | 0.554 | −0.359 | 0.013 |
| qP | −0.024 | −0.389 | 0.018 | 0.711 | −0.213 | 0.372 |
| NPQ | −0.118 | −0.333 | −0.266 | −0.321 | 0.194 | 0.419 |
| Fv/Fm | 0.622 | −0.409 | 0.184 | 0.134 | −0.296 | −0.242 |
| ARI1 | 0.434 | 0.559 | 0.304 | −0.124 | −0.277 | −0.128 |
| CRI1 | 0.037 | 0.208 | −0.855 | 0.318 | −0.097 | −0.147 |
| PRI | −0.253 | −0.435 | 0.759 | −0.009 | 0.016 | 0.176 |
| PSRI | 0.106 | −0.086 | 0.922 | −0.232 | −0.054 | 0.066 |
| Characteristic value | 5.613 | 2.956 | 2.776 | 1.759 | 1.508 | 1.024 |
| Percentage | 29.543 | 15.558 | 14.611 | 9.259 | 7.938 | 5.390 |
| Cumulative contribution rate (%) | 29.543 | 45.101 | 59.711 | 68.970 | 76.908 | 82.298 |
As can be seen from Figure 6, with the increase in the number of principal components, the eigenvalues gradually decrease. The eigenvalues of the first seven principal components are all greater than 1, and the connecting lines are steeper, indicating that the first seven principal components contribute the most to explaining the variables. Therefore, the first seven principal components are extracted.

Scree plot of PCA of photosynthetic characteristics of cowpea varieties under NaCl stress.
Under NaCl stress, based on 19 photosynthetic traits of 53 cowpea varieties, the eigenvectors and contribution rates of each principal component were calculated (Table 9). The eigenvalue of the PC1 was 4.505, and the contribution rate was 23.713%. With Chla, Chlb, Car, Chl(a + b), and ARI1 as the main indicators, the eigenvectors were 0.904, 0.919, 0.796, 0.913, and 0.575, respectively. The PC1 mainly reflected the photosynthetic pigment factor. The eigenvalue of the PC2 was 3.240, and its contribution rate was 17.051%. With Pn, Gs, Ci, and Tr as the main indicators, the eigenvectors were 0.543, 0.922, −0.707, and 0.893, respectively. PC2 mainly reflected the photosynthesis factor. The eigenvalue of the PC3 was 2.474, and its contribution rate was 13.02%. Taking PRI, PSRI, and CRI1 as the main indicators, the eigenvectors were −0.704, −0.674, and 0.759, respectively, and PC3 mainly reflected the photochemical reflection factor. The eigenvalue of the PC4 was 1.899, and its contribution rate was 9.994%. With the leaf length, leaf width, and Fv/Fm as the main indicators, the eigenvectors were 0.521, 0.577, −0.628, and PC4 mainly reflected the leaf length and width factor. The eigenvalue of the PC5 was 1.692, and the contribution rate was 8.907%. Taking Y(II) as the main index, the eigenvector was 0.762, PC5 mainly represented the Y(II) factor. The eigenvalue of the sixth principal component (PC6) was 1.137, and its contribution rate was 5.984%. Taking qP as the main index, the eigenvector was −0.669, and PC6 mainly indicated the qP factor. The eigenvalue of the seventh principal component (PC7) was 1.12, and its contribution rate was 5.894%, taking NPQ and Rubisco as the main indicators, and the eigenvectors were 0.555 and −0.577, respectively, and PC7 mainly represented the photosynthetic enzyme factor. Under NaCl stress, the photosynthetic traits of cowpea varieties were mainly assigned into seven principal components with a cumulative contribution rate of 84.564%.
PCA of photosynthetic characters of cowpea varieties under NaCl stress
| Properties | PC1 | PC2 | PC3 | PC4 | PC5 | PC6 | PC7 |
|---|---|---|---|---|---|---|---|
| Pn | −0.242 | 0.543 | 0.156 | −0.375 | −0.394 | −0.079 | 0.298 |
| Gs | −0.180 | 0.922 | 0.049 | −0.255 | −0.108 | 0.007 | 0.058 |
| Ci | 0.233 | −0.707 | 0.035 | 0.061 | −0.166 | 0.063 | 0.270 |
| Tr | −0.205 | 0.893 | 0.072 | −0.326 | −0.117 | 0.007 | 0.044 |
| Rubisco | −0.114 | 0.310 | 0.319 | 0.093 | 0.016 | 0.061 | −0.577 |
| Chla | 0.904 | 0.246 | 0.223 | 0.046 | 0.185 | 0.087 | −0.043 |
| Chlb | 0.919 | 0.198 | 0.213 | 0.053 | 0.131 | 0.108 | 0.042 |
| Car | 0.796 | 0.259 | 0.344 | 0.130 | 0.053 | 0.053 | 0.039 |
| Chl(a + b) | 0.913 | 0.234 | 0.221 | 0.048 | 0.171 | 0.093 | −0.020 |
| Leaf length | −0.381 | 0.205 | 0.195 | 0.521 | 0.325 | 0.311 | 0.220 |
| Leaf width | −0.402 | 0.256 | 0.245 | 0.577 | 0.088 | 0.344 | 0.286 |
| Y(II) | −0.008 | 0.152 | −0.506 | −0.209 | 0.762 | −0.176 | −0.043 |
| qP | −0.058 | 0.316 | −0.147 | 0.526 | 0.248 | −0.669 | −0.162 |
| NPQ | −0.286 | 0.128 | 0.236 | 0.115 | 0.368 | −0.323 | 0.555 |
| Fv/Fm | 0.017 | −0.109 | −0.327 | −0.628 | 0.574 | 0.323 | 0.144 |
| ARI1 | 0.575 | −0.158 | 0.117 | −0.099 | −0.223 | −0.362 | 0.290 |
| CRI1 | −0.416 | −0.304 | 0.759 | −0.213 | 0.116 | −0.062 | −0.053 |
| PRI | −0.074 | 0.282 | −0.704 | 0.388 | −0.195 | 0.236 | −0.019 |
| PSRI | 0.524 | 0.153 | −0.674 | 0.107 | −0.280 | −0.019 | 0.201 |
| Characteristic value | 4.505 | 3.240 | 2.474 | 1.899 | 1.692 | 1.137 | 1.120 |
| Percentage | 23.713 | 17.051 | 13.02 | 9.994 | 8.907 | 5.984 | 5.894 |
| Cumulative contribution rate (%) | 23.713 | 40.764 | 53.784 | 63.778 | 72.685 | 78.669 | 84.564 |
As shown in Figure 7, with the increase in the number of principal components, the eigenvalues gradually decrease. The eigenvalues of the first six principal components are all greater than 1, and the connecting line is relatively steep, indicating that the first six principal components contribute the most to explaining the variables. Therefore, the first six principal components are extracted.

Scree plot of PCA of photosynthetic characteristics of cowpea varieties under EBR treatment.
Under the EBR treatment, based on 19 photosynthetic traits of 53 cowpea varieties, the eigenvectors and contribution rates of each principal component were calculated (Table 10). The eigenvalue of the PC1 was 5.964, and its contribution rate was 31.391%. With Pn, Gs, Ci, Tr, Chla, Chlb, Car, Chl(a + b), and ARI1 as the main indicators, the eigenvectors were −0.545, −0.694, −0.732, −0.557, 0.889, 0.875, 0.752, 0.894, and 0.612, and PC1 mainly reflected the photosynthesis factor. The eigenvalue of the PC2 was 2.763, and its contribution rate was 14.544%. With PSRI and CRI1 as the main indicators, the eigenvectors were 0.812 and −0.744, PC2 mainly reflected the photochemical reflection factor. The eigenvalue of the PC3 was 2.641, and the contribution rate was 13.901%. With PRI and Tr as the main indicators, the eigenvectors were −0.587 and 0.666, and PC3 mainly represented the transpiration factor. The eigenvalue of the PC4 was 1.671, and its contribution rate was 8.796%. With the leaf length and leaf width as the main indicators, the eigenvectors were 0.761 and 0.632, respectively, and PC4 mainly represented the leaf length and width factor. The eigenvalue of the PC5 was 1.493, and its contribution rate was 7.856%. With Fv/Fm as the main index, the eigenvector was 0.714, and PC5 mainly reflected the maximum photochemical yield factor. The eigenvalue of the PC6 was 1.246, and its contribution rate was 6.558%. With NPQ, qP, Y(II), and Rubisco as the main indicators, the eigenvectors were −0.415, 0.526, 0.525, and −0.576, respectively, and PC6 mainly represented the photosynthetic enzyme factor. Under EBR treatment, the photosynthetic traits of cowpea varieties were summarized into six principal components, with a cumulative contribution rate of 83.046%.
PCA of photosynthetic characters of cowpea varieties under EBR treatment
| Properties | PC1 | PC2 | PC3 | PC4 | PC5 | PC6 |
|---|---|---|---|---|---|---|
| Pn | −0.545 | 0.318 | 0.491 | 0.112 | 0.162 | −0.049 |
| Gs | −0.694 | 0.377 | 0.47 | 0.143 | 0.069 | 0.137 |
| Ci | −0.732 | 0.443 | 0.379 | 0.109 | 0.096 | 0.147 |
| Tr | −0.557 | 0.242 | 0.666 | 0.134 | 0.129 | 0.243 |
| Rubisco | −0.206 | −0.243 | 0.046 | 0.336 | −0.332 | −0.576 |
| Chla | 0.889 | 0.28 | 0.184 | 0.223 | −0.085 | −0.063 |
| Chlb | 0.875 | 0.271 | 0.157 | 0.216 | −0.14 | 0.063 |
| Car | 0.752 | 0.321 | 0.334 | 0.235 | −0.146 | −0.076 |
| Chl(a + b) | 0.894 | 0.28 | 0.178 | 0.223 | −0.102 | −0.026 |
| Leaf length | −0.222 | 0.037 | −0.41 | 0.761 | 0.104 | −0.135 |
| Leaf width | −0.343 | 0.095 | −0.337 | 0.632 | 0.274 | −0.098 |
| Y(II) | 0.492 | −0.16 | −0.308 | 0.233 | 0.421 | 0.525 |
| qP | 0.067 | −0.479 | 0.154 | 0.458 | −0.35 | 0.526 |
| NPQ | 0.26 | 0.263 | 0.285 | 0.026 | 0.413 | −0.415 |
| Fv/Fm | 0.449 | 0.269 | −0.354 | −0.124 | 0.714 | 0.004 |
| ARI1 | 0.612 | 0.369 | 0.209 | −0.172 | −0.121 | 0.149 |
| CRI1 | 0.273 | −0.744 | 0.476 | 0.057 | 0.253 | −0.025 |
| PRI | −0.492 | 0.341 | −0.587 | 0.003 | −0.23 | 0.116 |
| PSRI | −0.03 | 0.812 | −0.41 | −0.06 | −0.264 | 0.095 |
| Characteristic value | 5.964 | 2.763 | 2.641 | 1.671 | 1.493 | 1.246 |
| Percentage | 31.391 | 14.544 | 13.901 | 8.796 | 7.856 | 6.558 |
| Cumulative contribution rate (%) | 31.391 | 45.936 | 59.837 | 68.632 | 76.488 | 83.046 |
As shown in Figure 8, with the increase in the number of principal components, the eigenvalues gradually decrease. The eigenvalues of the first seven principal components are all greater than 1, and the connecting line is relatively steep, indicating that the first seven principal components contribute the most to explaining the variables. Therefore, the first seven principal components are extracted.

Scree plot of PCA of photosynthetic characteristics of cowpea varieties under EBR treatment and NaCl stress.
Under EBR treatment and NaCl stress, the eigenvectors and contribution rates of each principal component were calculated, based on 19 photosynthetic traits of 53 cowpea varieties (Table 11). The eigenvalue of PC1 was 4.639, and its contribution rate was 24.418%. With Chla, Chlb, Car, Chl(a + b), and PRI as the main indicators, the eigenvectors were 0.824, 0.828, 0.760, 0.833, −0.664, respectively, and PC1 mainly represented the photosynthetic pigment factor. The eigenvalue of PC2 was 2.948, and its contribution rate was 15.517%. With Gs, Ci, and Tr as the main indicators, the eigenvectors were 0.659, −0.719, 0.714, respectively, PC2 mainly reflected the transpiration factor. The eigenvalue of PC3 was 2.360, and its contribution rate was 12.419%. With Pn, PSRI, and CRI1 as the main indicators, the eigenvectors were −0.621, 0.705, and −0.760, respectively, PC3 mainly represented the photosynthetic rate factor. The eigenvalue of PC4 was 2.131, and its contribution rate was 11.215%. With Y(II) and Fv/Fm as the main indicators, the eigenvectors were 0.783 and 0.638, respectively, and PC4 mainly represented the Y(II) factor. The eigenvalue of PC5 was 1.655, and the contribution rate was 8.709%. With ARI1 as the main index, the eigenvectors were −0.767, and PC5 mainly reflected the anthocyanin reflection factor. The eigenvalue of PC6 was 1.320, and its contribution rate was 6.945%. With the leaf length, leaf width, and Rubisco as the main indicators, the eigenvectors were 0.471, 0.621, −0.511, respectively, and PC6 mainly represented the leaf length and width factor. The eigenvalue of the PC7 was 1.239, and the contribution rate was 6.519%. With NPQ and qP as the main indicators, the eigenvectors were −0.466 and 0.691, respectively, and PC7 mainly reflected the qP factor. Under EBR treatment and NaCl stress, the photosynthetic traits of cowpea varieties could be assigned into seven principal components, with a cumulative contribution rate of 85.742%.
PCA of photosynthetic characters of cowpea varieties under EBR treatment and NaCl stress
| Properties | PC1 | PC2 | PC3 | PC4 | PC5 | PC6 | PC7 |
|---|---|---|---|---|---|---|---|
| Pn | −0.187 | 0.168 | −0.621 | 0.034 | −0.231 | 0.251 | −0.160 |
| Gs | −0.618 | 0.659 | −0.154 | −0.155 | −0.265 | 0.013 | 0.039 |
| Ci | 0.294 | −0.719 | 0.152 | 0.381 | 0.135 | 0.101 | −0.106 |
| Tr | −0.518 | 0.714 | −0.278 | −0.185 | −0.267 | 0.027 | 0.016 |
| Rubisco | −0.391 | 0.214 | 0.016 | −0.504 | 0.220 | −0.511 | 0.021 |
| Chla | 0.824 | 0.473 | 0.177 | −0.121 | 0.117 | −0.030 | −0.047 |
| Chlb | 0.828 | 0.434 | 0.182 | −0.123 | 0.081 | −0.043 | −0.054 |
| Car | 0.760 | 0.291 | 0.241 | −0.219 | −0.08 | 0.026 | 0.092 |
| Chl(a + b) | 0.833 | 0.466 | 0.180 | −0.123 | 0.109 | −0.034 | −0.049 |
| Leaf length | −0.374 | 0.235 | 0.395 | −0.254 | 0.389 | 0.471 | 0.241 |
| Leaf width | −0.453 | 0.055 | 0.426 | −0.235 | 0.275 | 0.621 | 0.120 |
| Y(II) | −0.065 | 0.501 | −0.125 | 0.783 | 0.275 | −0.039 | 0.162 |
| qP | −0.104 | 0.205 | −0.033 | 0.513 | 0.224 | −0.106 | 0.691 |
| NPQ | 0.119 | 0.168 | −0.076 | 0.115 | −0.030 | 0.466 | −0.466 |
| Fv/Fm | 0.006 | 0.502 | −0.143 | 0.638 | 0.174 | 0.043 | −0.385 |
| ARI1 | 0.374 | −0.083 | −0.011 | 0.065 | −0.767 | 0.161 | 0.326 |
| CRI1 | 0.311 | −0.234 | −0.760 | −0.250 | 0.236 | 0.183 | 0.179 |
| PRI | −0.664 | −0.008 | 0.49 | 0.051 | 0.090 | −0.281 | −0.319 |
| PSRI | −0.168 | 0.08 | 0.705 | 0.306 | −0.565 | 0.046 | 0.048 |
| Characteristic value | 4.639 | 2.948 | 2.360 | 2.131 | 1.655 | 1.320 | 1.239 |
| Percentage | 24.418 | 15.517 | 12.419 | 11.215 | 8.709 | 6.945 | 6.519 |
| Cumulative contribution rate (%) | 24.418 | 39.934 | 52.354 | 63.569 | 72.278 | 79.223 | 85.742 |
3.4 Cluster analysis of photosynthetic traits of 53 cowpea cultivars under NaCl stress by exogenous EBR
As shown in Figure 9 and Table 12, when the genetic distance is 14, the 53 cowpea varieties were clustered into three categories under no treatment. Category I consisted of 32 varieties in total, their variety serial number was 5, 6, 7, 8, 10, 11, 15, 17, 18, 24, 25, 26, 27, 32, 33, 36, 37, 38, 39, 40, 41, 42, 43, 44, 45, 46, 47, 49, 50, 51, 52, and 53, respectively. In Category I, Pn, Gs, Ci, and Tr had the maximum values, and Chla, Chlb, Car, Chl(a + b), and Fv/Fm had the minimum values. The variety serial numbers of category II were 1, 2, 3, 9, 12, 13, 16, 19, 21, 22, 30, 31, and 48, consisting of a total of 13 varieties. Pn, Gs, Ci, Tr, Chla, Chlb, Car, Chl(a + b), and Fv/Fm were at medium level. The variety serial numbers of category III were 4, 14, 20, 23, 28, 29, 34, and 35, consisting of a total of eight varieties. Pn, Gs, Ci, and Tr in this category had the minimum values, and Chla, Chlb, Car, Chl (a + b), and Fv/Fm had the largest values.
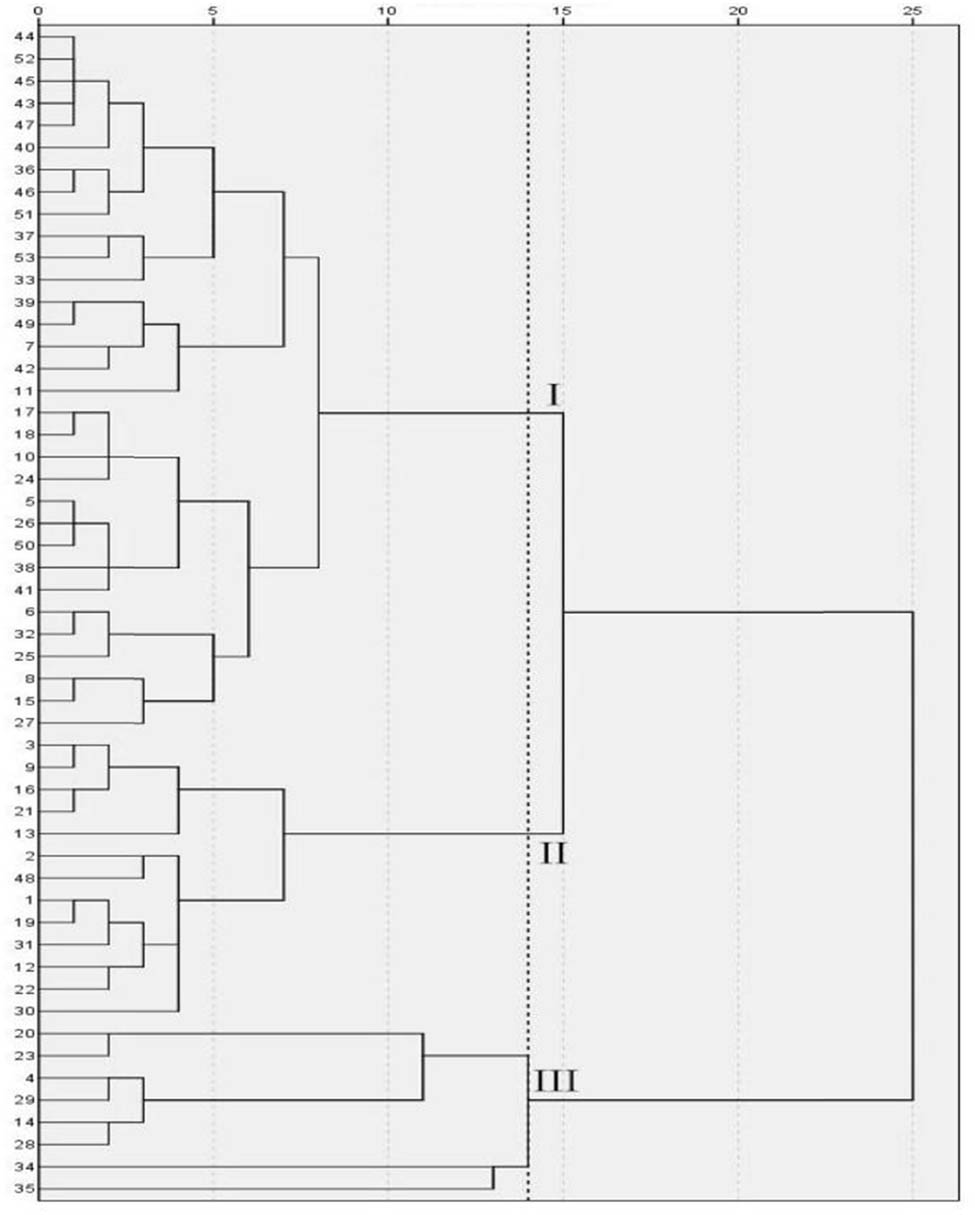
Cluster diagram of cowpea varieties under CK. The vertical axis is the variety number of cowpea, and the horizontal axis is the Euclidean distance. When the genetic distance is 14, the 53 cowpea varieties were clustered into three categories under no treatment.
Average values of three groups of cowpea varieties under CK
| Properties\groups | Ⅰ | Ⅱ | Ⅲ |
|---|---|---|---|
| Pn (CO2 μmol m−2 s−1) | 11.804 | 11.297 | 8.696 |
| Gs (H2O mol m−2 s−1) | 0.620 | 0.289 | 0.137 |
| Ci (CO2 μmol mol−1) | 340.985 | 308.909 | 276.533 |
| Tr (H2O mmol m−2 s−1) | 3.723 | 2.883 | 1.697 |
| Rubisco (mg/g) | 25.503 | 22.529 | 20.885 |
| Chla (mg/g) | 0.523 | 0.597 | 0.639 |
| Chlb (mg/g) | 0.187 | 0.211 | 0.228 |
| Car (mg/g) | 0.106 | 0.119 | 0.129 |
| Chl(a + b) (mg/g) | 0.710 | 0.808 | 0.866 |
| Leaf length (cm) | 7.553 | 7.395 | 7.538 |
| Leaf width (cm) | 4.775 | 4.829 | 4.543 |
| Y(II) | 0.597 | 0.663 | 0.663 |
| qP | 0.888 | 0.910 | 0.904 |
| NPQ | 0.042 | 0.050 | 0.040 |
| Fv/Fm | 0.680 | 0.735 | 0.741 |
| ARI1 | 0.015 | 0.015 | 0.015 |
| CRI1 | 0.034 | 0.037 | 0.034 |
| PRI | 0.024 | 0.023 | 0.020 |
| PSRI | 0.029 | 0.025 | 0.025 |
Figure 10 and Table 13 show that under the treatment of salt stress, when the genetic distance was 7, the 53 cowpea varieties were clustered into three categories. The variety serial numbers of category I were 3, 5, 6, 7, 8, 10, 11, 21, 22, 23, 24, 25, 26, 27, 28, 29, 30, 31, 32, 33, 34, 35, 36, 37, 38, 39, 40, 41, 42, 43, 44, 45, 46, 47, 49, 50, 51, 52, 53, consisting of a total of 40 varieties. Pn, Gs, Ci, Tr, Chla, Chlb, Car, Chl(a + b), and ARI1 were at medium levels. The variety serial numbers of the second major category were 1, 9, 12, 13, 14, 17, and 20, respectively, composed of a total of seven varieties. Pn, Gs, Ci, and Tr of this category had the maximum values, and Chla, Chlb, Car and Chl(a + b) had the minimum values. The variety serial numbers of the third category were 2, 4, 15, 16, 18, and 19, composed of a total of six varieties. Pn, Gs, Ci, Tr, Chla, Chlb, Car, Chl (a + b), and ARI1 of this category exhibited the maximum values.

Cluster diagram of cowpea varieties under NaCl stress. The vertical axis is the variety number of cowpea, and the horizontal axis is the Euclidean distance. When the genetic distance was 7, the 53 cowpea varieties were clustered into three categories.
Average values of three groups of cowpea varieties under NaCl stress
| Properties\groups | Ⅰ | Ⅱ | Ⅲ |
|---|---|---|---|
| Pn (CO2 μmol m−2 s−1) | 0.8349 | 0.6694 | 0.9252 |
| Gs (H2O mol m−2 s−1) | 0.0226 | 0.0069 | 0.0030 |
| Ci (CO2 μmol mol−1) | 349.0479 | 534.5957 | 880.5083 |
| Tr (H2O mmol m−2 s−1) | 0.2765 | 0.0931 | 0.0563 |
| Rubisco (mg/g) | 20.209 | 16.0734 | 16.6605 |
| Chla (mg/g) | 0.4673 | 0.4309 | 0.482 |
| Chlb (mg/g) | 0.1687 | 0.1564 | 0.1877 |
| Car (mg/g) | 0.1056 | 0.1001 | 0.1095 |
| Chl(a + b) (mg/g) | 0.6359 | 0.5873 | 0.6695 |
| Leaf length (cm) | 7.0818 | 6.8881 | 6.9112 |
| Leaf width (cm) | 4.6668 | 4.3761 | 4.3833 |
| Y(II) | 0.6937 | 0.6941 | 0.6577 |
| qP | 0.9245 | 0.9215 | 0.8775 |
| NPQ | 0.0472 | 0.0332 | 0.0439 |
| Fv/Fm | 0.7600 | 0.7599 | 0.7605 |
| ARI1 | 0.0149 | 0.0149 | 0.0159 |
| CRI1 | 0.0322 | 0.0329 | 0.0363 |
| PRI | 0.0289 | 0.0297 | 0.0254 |
| PSRI | 0.0304 | 0.0320 | 0.0274 |
It can be seen from Figure 11 and Table 14 that under the treatment of EBR spraying, when the genetic distance was 13, 53 cowpea varieties were clustered into three categories. The variety serial numbers of category I were 1, 5, 6, 7, 8, 9, 10, 11, 12, 13, 18, 21, 24, 25, 26, 27, 28, 30, 31, 34, 36, 37, 38, 39, 40, 41, 42, 43, 44, 45, 46, 47, 49, 50, 51, 52, 53, composed of 37 varieties in total. Pn, Gs, Ci, Tr, and PSRI of this category exhibited the largest values, and Chla, Chlb, Car, Chl(a + b), ARI1, and CRI1 displayed the smallest values. The variety serial numbers of category II were 3, 4, 14, 15, 16, 17, 19, 20, 22, 23, 29, 32, 33, and 34, consisting of a total of 14 varieties. Pn, Gs, Ci, Tr, Chla, Chlb, Car, Chl(a + b), ARI1, CRI1, and PSRI in this category had medium values. The variety serial numbers of category III were 2 and 35, consisting of a total of two varieties. Pn, Gs, Ci, Tr, and PSRI of category III exhibited the minimum values, and Chla, Chlb, Car, Chl(a + b), ARI1, and CRI1 displayed the largest values.

Cluster diagram of cowpea varieties under EBR treatment. The vertical axis is the variety number of cowpea, and the horizontal axis is the Euclidean distance. When the genetic distance was 13, 53 cowpea varieties were clustered into three categories.
Average values of three groups of cowpea varieties under EBR treatment
| Properties\groups | Ⅰ | Ⅱ | Ⅲ |
|---|---|---|---|
| Pn (CO2CO2 μmol m−2 s−1) | 11.7143 | 10.1909 | 9.0969 |
| Gs (H2O mol m−2 s−1) | 0.6444 | 0.2379 | 0.1279 |
| Ci (CO2 μmol mol−1) | 343.468 | 303.9756 | 270.9729 |
| Tr (H2O mmol m−2 s−1) | 3.6915 | 2.6167 | 1.7050 |
| Rubisco (mg/g) | 29.6558 | 28.0188 | 29.4683 |
| Chla (mg/g) | 0.5365 | 0.6151 | 0.6627 |
| Chlb (mg/g) | 0.1895 | 0.2278 | 0.2403 |
| Car (mg/g) | 0.1100 | 0.1165 | 0.1254 |
| Chl(a + b) (mg/g) | 0.7258 | 0.843 | 0.9027 |
| Leaf length (cm) | 7.3022 | 7.3249 | 7.1523 |
| Leaf width (cm) | 4.7778 | 4.7501 | 4.5049 |
| Y(II) | 0.6050 | 0.6426 | 0.6540 |
| qP | 0.8963 | 0.8957 | 0.9193 |
| NPQ | 0.0529 | 0.0529 | 0.0343 |
| Fv/Fm | 0.6868 | 0.7293 | 0.7184 |
| ARI1 | 0.0150 | 0.0155 | 0.0161 |
| CRI1 | 0.0334 | 0.0337 | 0.0387 |
| PRI | 0.0258 | 0.0262 | 0.0183 |
| PSRI | 0.0281 | 0.0273 | 0.0208 |
Figure 12 and Table 15 show that under the treatment of EBR spraying and salt stress, when the genetic distance was 7, 53 cowpea varieties were clustered into three categories. The variety serial numbers of category I were 2, 3, 4, 5, 7, 8, 10, 11, 17, 18, 30, 33, 34, 35, 36, 37, 38, 39, 40, 41, 43, 44, 45, 46, 47, 48, 49, 50, 51, 52, and 53, consisting of 31 varieties in total. Pn, Ci, Gs, Tr, Chla, Chlb, Car, and Chl(a + b) of category I showed the medium values. The variety serial numbers of category II were 1, 6, 9, 14, 15, 16, 21, 22, 23, 24, 25, 26, 27, 28, 29, 31, 32, and 42, composed of a total of 18 varieties. Pn, Ci, Gs, and Tr of category II exhibited the smallest values, and Chla, Chlb, Car, and Chl(a + b) showed the largest values. The variety serial numbers of category III were 12, 13, 19, and 20, comprised a total of four varieties. Pn, Ci, Gs, and Tr of this category were the largest, and Chla, Chlb, Car, and Chl(a + b) were the smallest.

Cluster diagram of cowpea varieties under EBR treatment and NaCl stress. The vertical axis is the variety number of cowpea, and the horizontal axis is the Euclidean distance. When the genetic distance was 7, the 53 cowpea varieties were clustered into three categories.
Average values of three groups of cowpea varieties under EBR treatment and NaCl stress
| Properties\groups | Ⅰ | Ⅱ | Ⅲ |
|---|---|---|---|
| Pn (CO2 μmol m−2 s−1) | 0.9055 | 0.7683 | 1.0488 |
| Gs (H2O mol m−2 s−1) | 0.0196 | 0.0092 | 0.0020 |
| Ci (CO2 μmol mol−1) | 326.1435 | 513.6056 | 928.1825 |
| Tr (H2O mmol m−2 s−1) | 0.2441 | 0.1197 | 0.0408 |
| Rubisco (mg/g) | 25.2989 | 17.1284 | 15.5033 |
| Chla (mg/g) | 0.4270 | 0.4475 | 0.3920 |
| Chlb (mg/g) | 0.1574 | 0.1638 | 0.1453 |
| Car (g/g) | 0.0984 | 0.1006 | 0.0945 |
| Chl(a + b) (mg/g) | 0.5843 | 0.6113 | 0.5373 |
| Leaf length (cm) | 7.3258 | 7.0722 | 6.7165 |
| Leaf width (cm) | 4.6473 | 4.5166 | 4.4335 |
| Y(II) | 0.6922 | 0.7073 | 0.6788 |
| qP | 0.9189 | 0.9353 | 0.888 |
| NPQ | 0.0344 | 0.0356 | 0.0347 |
| Fv/Fm | 0.7588 | 0.7616 | 0.7720 |
| ARI1 | 0.0149 | 0.0146 | 0.0160 |
| CRI1 | 0.0340 | 0.0344 | 0.0372 |
| PRI | 0.0304 | 0.0272 | 0.0297 |
| PSRI | 0.0254 | 0.0243 | 0.0262 |
4 Discussion
Germplasm resources are the basis for breeding new varieties. The diversity of germplasm resources includes the species diversity and genetic diversity, and genetic diversity is the core of biological diversity. The research on genetic diversity of germplasm resources includes four aspects: phenotype, cytology, biochemistry, and molecular level. Phenotypic traits are the external characteristics of plants during growth and development, which are morphologically marked by visual observation or instrumental measurement [13–15]. The results of the different analysis in this study showed that in CK, the largest one of CVs of 19 photosynthetic physiological traits reached up to 76.483% and the smallest one was 7.235%, CVs of 16 out of 19 traits exceeded 10%, indicating that most of the 53 cowpea varieties exhibited significantly different photosynthetic physiological traits, with relatively rich genetic diversity. Under NaCl stress, the largest one of CVs of the 19 photosynthetic physiological traits was 86.645%, and the smallest one was 5.503%, of which CVs of 16 traits exceeded 10%, suggesting that under NaCl stress, most of the photosynthetic physiological traits of these 53 cowpea varieties were significantly different. Through the examination of photosynthetic response, salt tolerance, and other indicators of cowpeas under salt stress, Praxedes et al. [16] found that different cowpea varieties also exhibited different degrees of variability under salt stress, consistent with the results of this article that showed variations in photosynthetic characteristics among different cowpea varieties under NaCl stress. Under the EBR treatment, the largest one of CVs of 19 photosynthetic physiological traits reached up to 103.782%, and the smallest one was 5.805%, and the CVs of 15 out of 19 traits exceeded 10%, implying that the effects of EBR on most of the photosynthetic physiological traits of these 53 cowpea varieties were significantly different. Under the EBR treatment and NaCl stress, the largest one of CVs of 19 photosynthetic physiological traits was up to 71.130%, and the smallest one was 5.745%. Of 19 traits, CVs of 16 traits exceeded 10%, indicating that the alleviation effects of EBR on most photosynthetic physiological traits of these 53 cowpea varieties under NaCl stress were significantly different. Sousa et al. [17] showed that EBR plays a positive role in plants and can, to some extent, alleviate some of the negative impacts of salt stress on cowpeas, such as enzyme activity and photosynthesis capacity.
Somayyeh et al. [10] have reported that after the pods were removed at the pod stage of cowpea, the flower drop rate was negatively correlated with Fv/Fm, PRI, chlorophyll content, and yield, but not significantly. Yield was negatively correlated with Fv/Fm, PRI, and chlorophyll content, but not significantly. Liu et al. [11] have studied the correlation among chlorophyll fluorescence parameters, spectral parameters, photosynthetic parameters, and yield of vegetable soybean at the flowering stage, and found that Pn was extremely significantly positively correlated with PRI, and that leaf Tr was extremely significantly positively correlated with leaf Gs and PSRI. The results of correlation analysis of photosynthetic traits in this study showed that Pn and Tr were extremely significantly positively correlated, and that Pn and Gs were significantly positively correlated in all treatments. Pn and Ci were extremely significantly positively correlated under C and E treatments in the control group, whereas they were negatively correlated under N and EN treatments, but not significantly. Pn was significantly negatively correlated with Chla, Chlb, and Chl(a + b) under C and E treatments in the control group, whereas they were negatively correlated under N and EN treatments but not significantly.
PCA is a method of condensing information through the dimensionality reduction. After the data transformation, the newly generated variables represent most of the original information, and they can be used for PCA. PCA-based germplasm resource evaluation has been conducted in grape [18], tomato [19], corn [20], wheat [21], lentils [22], cowpea [23,24], and other crops successively. The results of PCA in this study showed that in CK, 19 photosynthetic physiological traits of 53 cowpea varieties were assigned into six principal components with a cumulative contribution rate of 82.298%, reflecting 82.298% of the total amount of information. Under NaCl stress, the 19 photosynthetic physiological traits of 53 cowpea varieties were assigned into seven principal components with a cumulative contribution rate of 84.564%, reflecting 84.564% of the total amount of information. Under EBR treatment, 19 physiological traits were assigned into six principal components with a cumulative contribution rate of 83.046%, reflecting 83.046% of the total amount of information. Under EBR treatment and NaCl stress, 19 photosynthetic physiological traits of 53 cowpea varieties were assigned into seven principal components, with a cumulative contribution rate of 85.742%, reflecting 85.742% of the total amount of information.
Cluster analysis can reflect the genetic differences and genetic relationship among different varieties, and it can provide a certain reference for formulating breeding schemes. Cluster analysis has been used to select target traits accordingly, in chrysanthemum [25], pea [26], cowpea [27], strawberry [28], barley [29], and many other crops. Our cluster analysis results showed that without treatment, the 53 cowpea varieties were clustered into three categories. The category I of cowpea varieties exhibited the strongest photosynthetic ability, which can be used to breed cowpea varieties with high light efficiency. The photosynthetic ability of category II cowpea varieties was at medium level, but its comprehensive ability was better. The photosynthetic ability of category III cowpea varieties was the worst, and thus it should not be recommended being used for breeding high light-efficiency cowpea varieties. Under the treatment of salt stress, the 53 cowpea varieties were clustered into three categories. The photosynthetic ability of category I under salt stress was average, which belonged to moderate salt-tolerant cowpea varieties. The photosynthetic ability of category II was the weakest, which belonged to the salt-sensitive cowpea variety. The photosynthetic ability of category III was the strongest under salt stress, and belonged to the salt-tolerant cowpea variety. Under the treatment of EBR spraying, 53 cowpea varieties can be grouped into three categories. Under the treatment of EBR, the photosynthetic ability of category I was the strongest, which was suitable for EBR fertilization. The photosynthetic ability of category II was average, and the comprehensive ability was better. Under the treatment of EBR, the photosynthetic ability of category Ⅲ cowpea varieties was the worst, which was not suitable for EBR fertilization. Under EBR spraying + salt stress, the 53 cowpea varieties were clustered into three categories. EBR had a moderate mitigation effect on the photosynthesis of category I cowpea varieties under salt stress. EBR exhibited the worst mitigation effect on the photosynthesis of category II cowpea varieties under salt stress, and thus EBR was not suitable to alleviate the salt damage to this category of cowpea varieties. EBR had the strongest mitigation effect on the photosynthesis of category III cowpea variety under salt stress, and thus it was suitable for EBR to mitigate salt damage to this category cowpea variety.
5 Conclusion
In this study, we conducted difference, correlation, principal component, and cluster analyses to investigate the photosynthetic traits of 53 cowpea germplasm resources under salt stress after application of EBR. The results of different analysis and correlation analyses showed that these 53 germplasm resources had rich genetic diversity, and there were correlations among their different agronomic traits to various degrees. The 32 varieties (with variety serial numbers as 5, 6, 7, 8, 10, 11, 15, 17, 18, 24, 25, 26, 27, 32, 33, 36, 37, 38, 39, 40, 41, 42, 43, 44, 45, 46, 47, 49, 50, 51, 52, and 53) were screened by combining PCA and the cluster analysis. They had the strongest photosynthetic ability, and could be used to breed cowpea varieties with high light efficiency. Under the treatment of salt stress, six varieties (2, 4, 15, 16, 18, and 19) belonged to the salt-tolerant cowpea varieties. Under EBR treatment, 31 varieties (2, 3, 4, 5, 7, 8, 10, 11, 17, 18, 30, 33, 34, 35, 36, 37, 38, 39, 40, 41, 43, 44, 45, 46, 47, 48, 49, 50, 51, 52, and 53) exhibited the strongest photosynthetic ability, and thus they were suitable for EBR fertilization. Under the treatment of EBR spraying + salt stress, the four varieties (12, 13, 19, and 20) displayed excellent photosynthetic properties, and the strongest mitigation effect of EBR. Taken together, this study revealed the differences in the physiological responses of different cowpea varieties to exogenous EBR. Our findings will provide a reference for the application of exogenous EBR to alleviate salt stress damage to cowpea.
-
Funding information: This study was funded by the Exemplary project of Hubei Provincial Science and Technology Department (2024BEB010); The industry-university-research project in Wuhan Science and Technology Bureau (2023110201030663); Supported by the Graduate Scientific Research Foundation of Jianghan University (KYCXJJ202447).
-
Author contributions: H.Z.H.: conceptualization, methodology, software, validation, writing – original draft, writing – review & editing, visualization, supervision, project administration, and funding acquisition; L.X.P.: software, investigation, resources, and supervision; G.Z.Y.: formal analysis, software, investigation, resources, data curation, and supervision; W.Y.J.: visualization, investigation, resources, data curation, and supervision; W.C.X.: formal analysis, visualization, investigation, resources, data curation, software, and supervision. The order of authors is based on the size of their contributions.
-
Conflict of interest: Authors state no conflict of interest.
-
Data availability statement: The datasets generated during and/or analyzed during the current study are available from the corresponding author on reasonable request.
References
[1] Aruna OA, Bolajoko BA, Timothy O. Combined lime and biochar application enhances cowpea growth and yield in tropical Alfisol. Sci Rep. 2024;14(1):1389.10.1038/s41598-024-52102-7Search in Google Scholar PubMed PubMed Central
[2] Sousa VQ, Messias WFS, Pereira YC, da Silva BRS, Lobato EMSG, Alyemeni MN, et al. Pretreatment with 24-epibrassinolide synergistically protects root structures and chloroplastic pigments and upregulates antioxidant enzymes and biomass in Na+-stressed tomato plants. J Plant Growth Regul. 2021;41(7):1–17.10.1007/s00344-021-10481-5Search in Google Scholar
[3] Guedes FRCM, Maia CF, Silva BRS, Batista BL, Alyemeni MN, Ahmad P, et al. Exogenous 24-epibrassinolide stimulates root protection, and leaf antioxidant enzymes in rice plants lead stressed: central roles to minimize Pb content and oxidative stress. Environ Pollut. 2021;280:116992.10.1016/j.envpol.2021.116992Search in Google Scholar PubMed
[4] Ling LM, Wei QY, Qin ZW, Lin XQ, Li YZ. The mitigating effect of salicylic acid priming on salt stress in Capsicum frutescens seeds and seedlings. J Gansu Agric Univ. 2023;60:1–12.Search in Google Scholar
[5] Abir D, Sayan P, Nilakshi C, Mirza H, Malay KA. Regulation of reactive oxygen species metabolism and oxidative stress signaling by abscisic acid pretreatment in rice (Oryza sativa L.) seedlings through sub1A QTL under salinity. Plant Stress. 2024;11:100422.10.1016/j.stress.2024.100422Search in Google Scholar
[6] Singh A, Dwivedi P, Kumar V, Kumar PD. Brassinosteroids and their analogs: feedback in plants under in vitro condition. South Afr J Botany. 2021;143:256–65.10.1016/j.sajb.2021.08.008Search in Google Scholar
[7] Nolan Trevor M, Vukašinović N, Liu D, Russinova E, Yin YH. Brassinosteroids: multidimensional regulators of plant growth, development, and stress responses. Plant Cell. 2020;32(2):295–318.10.1105/tpc.19.00335Search in Google Scholar PubMed PubMed Central
[8] Wu CX, Hu ZH, Lu HY, Ke YZ, Wang YJ, Gong ZY. The influence of EBR on photosynthesis and antioxidant system of maize seedlings under salt stress. Jiangsu Agric Sci. 2023;51(13):109–16.Search in Google Scholar
[9] Ferguson John N, Jithesh T, Lawson T, Kromdijk J. Leaf excision introduces limited and species-specific effects on photosynthetic parameters across crop functional types. J Exp Botany. 2023;21(74):6662–76.10.1093/jxb/erad319Search in Google Scholar PubMed PubMed Central
[10] Somayyeh M, Hossein S, Abdollatif G, Leila A, Mahnaz K, Andrea M. Genomics and physiology of chlorophyll fluorescence parameters in Hordeum vulgare L. under drought and salt stresses. Plants. 2023;12(19):3515.10.3390/plants12193515Search in Google Scholar PubMed PubMed Central
[11] Liu BY, Zhang J, Li HY, Wang Y, Kang ZH, Yi BZ. The effect of powdery mildew on the spectral reflectance characteristics and physiological functions of grape leaves. Chin Fruit Trees. 2022;9:55–9.Search in Google Scholar
[12] Li Y, Zhang M, Ning P, Huang XX. Effects of exogenous NO on physiological characteristics of Chinese ivy under salt stress. J Plant Physiol. 2022;58(1):207–13.Search in Google Scholar
[13] Azzam CR, AlTaweel SK, AbdelAziz RM, Rabea KM, AbouSreea AIB, Rady MM, et al. Salinity effects on gene expression, morphological, and physio-biochemical responses of Stevia rebaudiana Bertoni in vitro. Plants. 2021;10(4):820.10.3390/plants10040820Search in Google Scholar PubMed PubMed Central
[14] Shakoor A, Zhao F, Zaib G, Li WY, Lan XC, Esfandani BS. Morphometric analysis and sequence related amplified polymorphism determine genetic diversity in Salvia species. Not Botanicae Horti Agrobotanici Cluj-Napoca. 2021;49(1):12153.10.15835/nbha49112153Search in Google Scholar
[15] Mahmodi N, Sharifi SC, Gholam R, Cheghamirza K. Evaluation of molecular and morphological diversity of caper (Capparis spinosa L.). Genet Resour Crop Evolution. 2022;69(4):1–26.10.1007/s10722-021-01315-0Search in Google Scholar
[16] Praxedes SSC, Ferreira NM, Loiola AT, Santos FJQ, Umbelino BF, Silva L, de A, et al. Photosynthetic responses, growth, production, and tolerance of traditional varieties of cowpea under salt stress. Plants. 2022;11(14):1863.10.3390/plants11141863Search in Google Scholar PubMed PubMed Central
[17] Sousa DJP, Nogueira GAS, Teixeira KBS. Monteiro GGTN, Brito AEA, Nascimento VR, et al. Mitigation of the effects of salt stress in cowpea bean through the exogenous aplication of brassinosteroid. Braz J Biol = Rev brasleira de biologia. 2022;82:e260818.10.1590/1519-6984.260818Search in Google Scholar PubMed
[18] Fahim S, Ghanbari A, Naji AM, Shokohian AA, Lajayer HM, Gohari G, et al. Multivariate discrimination of some grapevine cultivars under drought stress in Iran. Horticulturae. 2022;8(10):871.10.3390/horticulturae8100871Search in Google Scholar
[19] Ene CO, Abtew WG, Oselebe HO, Ozi FU. Ikeogu UNl. Genetic characterization and quantitative trait relationship using multivariate techniques reveal diversity among tomato germplasms. Food Sci Nutr. 2022;10(7):2426–42.10.1002/fsn3.2850Search in Google Scholar PubMed PubMed Central
[20] Khatibi A, Omrani S, Omrani A, Shojaei SH, Mousavi SMN, Illés Árpád, et al. Response of maize hybrids in drought-stress using drought tolerance indices. Water. 2022;14(7):1012.10.3390/w14071012Search in Google Scholar
[21] Belay GA, Zhang Z, Xu P. Physio-morphological and biochemical trait-based evaluation of ethiopian and chinese wheat germplasm for drought tolerance at the seedling stage. Sustainability. 2021;13(9):4605.10.3390/su13094605Search in Google Scholar
[22] Letting FK, Venkataramana PB, Ndakidemi PA. Pre-breeding prospects of lablab (Lablab purpureus (L.) Sweet) accessions in Tanzania: morphological characterization and genetic diversity analysis. Agronomy. 2022;12(10):2272.10.3390/agronomy12102272Search in Google Scholar
[23] Made D, Sara D, François AB, Oumar D, Diaga D. Development of new cowpea (Vigna unguiculata) mutant genotypes, analysis of their agromorphological variation, genetic diversity and population structure. Biocell. 2021;45(2):345–62.10.32604/biocell.2021.013706Search in Google Scholar
[24] Mohammed SB, Burridge JD, Ishiyaku MF, Boukar O, Lynch JP. Phenotyping cowpea for seedling root architecture reveals root phenes important for breeding phosphorus efficient varieties. Crop Sci. 2021;62(1):326–45.10.1002/csc2.20635Search in Google Scholar
[25] Shirin T, Abdollah EN, Hamed K, Hasan M, Mohammad RS. Morphological and genetic variation of thirty Iranian Dendranthema (Dendranthema grandiflorum) cultivars using multivariate analysis. Horticult Environ Biotechnol. 2021;62(3):1–16.10.1007/s13580-021-00342-1Search in Google Scholar
[26] Zhao TY, Quan W, Do ZH, Xie Q, Kang YF, Xue WT. A comprehensive evaluation of pea germplasm resources through cluster and gray relational analyses. Genet Resour Crop Evol. 2022;70(4):1135–49.10.1007/s10722-022-01491-7Search in Google Scholar
[27] Vaggar S, Kumar U, Prasad K, Yadav LM, Pramila, Sinha BM, et al. Study of genetic divergence for yield and quality traits in cowpea [Vigna unguiculata (L.) walp.]. Legume Res – An Int J. 2022;45(4):410–4.Search in Google Scholar
[28] Li HW, Bolarić S, Vokurka A, He J, Wang D, Li XF, et al. Genetic variability and structure of Fragaria nilgerrensis Schlecht. germplasm in Sichuan Province. Horticulturae. 2021;7(10):353.10.3390/horticulturae7100353Search in Google Scholar
[29] Saed MA, Pessarakli M, Mozafari AA, Sohrabi F, Moradi M, Marvasti FB. Screening barley varieties tolerant to drought stress based on tolerant indices. J Plant Nutr. 2022;45(5):739–50.10.1080/01904167.2021.1963773Search in Google Scholar
© 2024 the author(s), published by De Gruyter
This work is licensed under the Creative Commons Attribution 4.0 International License.
Articles in the same Issue
- Biomedical Sciences
- Constitutive and evoked release of ATP in adult mouse olfactory epithelium
- LARP1 knockdown inhibits cultured gastric carcinoma cell cycle progression and metastatic behavior
- PEGylated porcine–human recombinant uricase: A novel fusion protein with improved efficacy and safety for the treatment of hyperuricemia and renal complications
- Research progress on ocular complications caused by type 2 diabetes mellitus and the function of tears and blepharons
- The role and mechanism of esketamine in preventing and treating remifentanil-induced hyperalgesia based on the NMDA receptor–CaMKII pathway
- Brucella infection combined with Nocardia infection: A case report and literature review
- Detection of serum interleukin-18 level and neutrophil/lymphocyte ratio in patients with antineutrophil cytoplasmic antibody-associated vasculitis and its clinical significance
- Ang-1, Ang-2, and Tie2 are diagnostic biomarkers for Henoch-Schönlein purpura and pediatric-onset systemic lupus erythematous
- PTTG1 induces pancreatic cancer cell proliferation and promotes aerobic glycolysis by regulating c-myc
- Role of serum B-cell-activating factor and interleukin-17 as biomarkers in the classification of interstitial pneumonia with autoimmune features
- Effectiveness and safety of a mumps containing vaccine in preventing laboratory-confirmed mumps cases from 2002 to 2017: A meta-analysis
- Low levels of sex hormone-binding globulin predict an increased breast cancer risk and its underlying molecular mechanisms
- A case of Trousseau syndrome: Screening, detection and complication
- Application of the integrated airway humidification device enhances the humidification effect of the rabbit tracheotomy model
- Preparation of Cu2+/TA/HAP composite coating with anti-bacterial and osteogenic potential on 3D-printed porous Ti alloy scaffolds for orthopedic applications
- Aquaporin-8 promotes human dermal fibroblasts to counteract hydrogen peroxide-induced oxidative damage: A novel target for management of skin aging
- Current research and evidence gaps on placental development in iron deficiency anemia
- Single-nucleotide polymorphism rs2910829 in PDE4D is related to stroke susceptibility in Chinese populations: The results of a meta-analysis
- Pheochromocytoma-induced myocardial infarction: A case report
- Kaempferol regulates apoptosis and migration of neural stem cells to attenuate cerebral infarction by O‐GlcNAcylation of β-catenin
- Sirtuin 5 regulates acute myeloid leukemia cell viability and apoptosis by succinylation modification of glycine decarboxylase
- Apigenin 7-glucoside impedes hypoxia-induced malignant phenotypes of cervical cancer cells in a p16-dependent manner
- KAT2A changes the function of endometrial stromal cells via regulating the succinylation of ENO1
- Current state of research on copper complexes in the treatment of breast cancer
- Exploring antioxidant strategies in the pathogenesis of ALS
- Helicobacter pylori causes gastric dysbacteriosis in chronic gastritis patients
- IL-33/soluble ST2 axis is associated with radiation-induced cardiac injury
- The predictive value of serum NLR, SII, and OPNI for lymph node metastasis in breast cancer patients with internal mammary lymph nodes after thoracoscopic surgery
- Carrying SNP rs17506395 (T > G) in TP63 gene and CCR5Δ32 mutation associated with the occurrence of breast cancer in Burkina Faso
- P2X7 receptor: A receptor closely linked with sepsis-associated encephalopathy
- Probiotics for inflammatory bowel disease: Is there sufficient evidence?
- Identification of KDM4C as a gene conferring drug resistance in multiple myeloma
- Microbial perspective on the skin–gut axis and atopic dermatitis
- Thymosin α1 combined with XELOX improves immune function and reduces serum tumor markers in colorectal cancer patients after radical surgery
- Highly specific vaginal microbiome signature for gynecological cancers
- Sample size estimation for AQP4-IgG seropositive optic neuritis: Retinal damage detection by optical coherence tomography
- The effects of SDF-1 combined application with VEGF on femoral distraction osteogenesis in rats
- Fabrication and characterization of gold nanoparticles using alginate: In vitro and in vivo assessment of its administration effects with swimming exercise on diabetic rats
- Mitigating digestive disorders: Action mechanisms of Mediterranean herbal active compounds
- Distribution of CYP2D6 and CYP2C19 gene polymorphisms in Han and Uygur populations with breast cancer in Xinjiang, China
- VSP-2 attenuates secretion of inflammatory cytokines induced by LPS in BV2 cells by mediating the PPARγ/NF-κB signaling pathway
- Factors influencing spontaneous hypothermia after emergency trauma and the construction of a predictive model
- Long-term administration of morphine specifically alters the level of protein expression in different brain regions and affects the redox state
- Application of metagenomic next-generation sequencing technology in the etiological diagnosis of peritoneal dialysis-associated peritonitis
- Clinical diagnosis, prevention, and treatment of neurodyspepsia syndrome using intelligent medicine
- Case report: Successful bronchoscopic interventional treatment of endobronchial leiomyomas
- Preliminary investigation into the genetic etiology of short stature in children through whole exon sequencing of the core family
- Cystic adenomyoma of the uterus: Case report and literature review
- Mesoporous silica nanoparticles as a drug delivery mechanism
- Dynamic changes in autophagy activity in different degrees of pulmonary fibrosis in mice
- Vitamin D deficiency and inflammatory markers in type 2 diabetes: Big data insights
- Lactate-induced IGF1R protein lactylation promotes proliferation and metabolic reprogramming of lung cancer cells
- Meta-analysis on the efficacy of allogeneic hematopoietic stem cell transplantation to treat malignant lymphoma
- Mitochondrial DNA drives neuroinflammation through the cGAS-IFN signaling pathway in the spinal cord of neuropathic pain mice
- Application value of artificial intelligence algorithm-based magnetic resonance multi-sequence imaging in staging diagnosis of cervical cancer
- Embedded monitoring system and teaching of artificial intelligence online drug component recognition
- Investigation into the association of FNDC1 and ADAMTS12 gene expression with plumage coloration in Muscovy ducks
- Yak meat content in feed and its impact on the growth of rats
- A rare case of Richter transformation with breast involvement: A case report and literature review
- First report of Nocardia wallacei infection in an immunocompetent patient in Zhejiang province
- Rhodococcus equi and Brucella pulmonary mass in immunocompetent: A case report and literature review
- Downregulation of RIP3 ameliorates the left ventricular mechanics and function after myocardial infarction via modulating NF-κB/NLRP3 pathway
- Evaluation of the role of some non-enzymatic antioxidants among Iraqi patients with non-alcoholic fatty liver disease
- The role of Phafin proteins in cell signaling pathways and diseases
- Ten-year anemia as initial manifestation of Castleman disease in the abdominal cavity: A case report
- Coexistence of hereditary spherocytosis with SPTB P.Trp1150 gene variant and Gilbert syndrome: A case report and literature review
- Utilization of convolutional neural networks to analyze microscopic images for high-throughput screening of mesenchymal stem cells
- Exploratory evaluation supported by experimental and modeling approaches of Inula viscosa root extract as a potent corrosion inhibitor for mild steel in a 1 M HCl solution
- Imaging manifestations of ductal adenoma of the breast: A case report
- Gut microbiota and sleep: Interaction mechanisms and therapeutic prospects
- Isomangiferin promotes the migration and osteogenic differentiation of rat bone marrow mesenchymal stem cells
- Prognostic value and microenvironmental crosstalk of exosome-related signatures in human epidermal growth factor receptor 2 positive breast cancer
- Circular RNAs as potential biomarkers for male severe sepsis
- Knockdown of Stanniocalcin-1 inhibits growth and glycolysis in oral squamous cell carcinoma cells
- The expression and biological role of complement C1s in esophageal squamous cell carcinoma
- A novel GNAS mutation in pseudohypoparathyroidism type 1a with articular flexion deformity: A case report
- Predictive value of serum magnesium levels for prognosis in patients with non-small cell lung cancer undergoing EGFR-TKI therapy
- HSPB1 alleviates acute-on-chronic liver failure via the P53/Bax pathway
- IgG4-related disease complicated by PLA2R-associated membranous nephropathy: A case report
- Baculovirus-mediated endostatin and angiostatin activation of autophagy through the AMPK/AKT/mTOR pathway inhibits angiogenesis in hepatocellular carcinoma
- Metformin mitigates osteoarthritis progression by modulating the PI3K/AKT/mTOR signaling pathway and enhancing chondrocyte autophagy
- Evaluation of the activity of antimicrobial peptides against bacterial vaginosis
- Atypical presentation of γ/δ mycosis fungoides with an unusual phenotype and SOCS1 mutation
- Analysis of the microecological mechanism of diabetic kidney disease based on the theory of “gut–kidney axis”: A systematic review
- Omega-3 fatty acids prevent gestational diabetes mellitus via modulation of lipid metabolism
- Refractory hypertension complicated with Turner syndrome: A case report
- Interaction of ncRNAs and the PI3K/AKT/mTOR pathway: Implications for osteosarcoma
- Association of low attenuation area scores with pulmonary function and clinical prognosis in patients with chronic obstructive pulmonary disease
- Long non-coding RNAs in bone formation: Key regulators and therapeutic prospects
- The deubiquitinating enzyme USP35 regulates the stability of NRF2 protein
- Neutrophil-to-lymphocyte ratio and platelet-to-lymphocyte ratio as potential diagnostic markers for rebleeding in patients with esophagogastric variceal bleeding
- G protein-coupled receptor 1 participating in the mechanism of mediating gestational diabetes mellitus by phosphorylating the AKT pathway
- LL37-mtDNA regulates viability, apoptosis, inflammation, and autophagy in lipopolysaccharide-treated RLE-6TN cells by targeting Hsp90aa1
- The analgesic effect of paeoniflorin: A focused review
- Chemical composition’s effect on Solanum nigrum Linn.’s antioxidant capacity and erythrocyte protection: Bioactive components and molecular docking analysis
- Knockdown of HCK promotes HREC cell viability and inner blood–retinal barrier integrity by regulating the AMPK signaling pathway
- The role of rapamycin in the PINK1/Parkin signaling pathway in mitophagy in podocytes
- Laryngeal non-Hodgkin lymphoma: Report of four cases and review of the literature
- Clinical value of macrogenome next-generation sequencing on infections
- Overview of dendritic cells and related pathways in autoimmune uveitis
- TAK-242 alleviates diabetic cardiomyopathy via inhibiting pyroptosis and TLR4/CaMKII/NLRP3 pathway
- Hypomethylation in promoters of PGC-1α involved in exercise-driven skeletal muscular alterations in old age
- Profile and antimicrobial susceptibility patterns of bacteria isolated from effluents of Kolladiba and Debark hospitals
- The expression and clinical significance of syncytin-1 in serum exosomes of hepatocellular carcinoma patients
- A histomorphometric study to evaluate the therapeutic effects of biosynthesized silver nanoparticles on the kidneys infected with Plasmodium chabaudi
- PGRMC1 and PAQR4 are promising molecular targets for a rare subtype of ovarian cancer
- Analysis of MDA, SOD, TAOC, MNCV, SNCV, and TSS scores in patients with diabetes peripheral neuropathy
- SLIT3 deficiency promotes non-small cell lung cancer progression by modulating UBE2C/WNT signaling
- The relationship between TMCO1 and CALR in the pathological characteristics of prostate cancer and its effect on the metastasis of prostate cancer cells
- Heterogeneous nuclear ribonucleoprotein K is a potential target for enhancing the chemosensitivity of nasopharyngeal carcinoma
- PHB2 alleviates retinal pigment epithelium cell fibrosis by suppressing the AGE–RAGE pathway
- Anti-γ-aminobutyric acid-B receptor autoimmune encephalitis with syncope as the initial symptom: Case report and literature review
- Comparative analysis of chloroplast genome of Lonicera japonica cv. Damaohua
- Human umbilical cord mesenchymal stem cells regulate glutathione metabolism depending on the ERK–Nrf2–HO-1 signal pathway to repair phosphoramide mustard-induced ovarian cancer cells
- Electroacupuncture on GB acupoints improves osteoporosis via the estradiol–PI3K–Akt signaling pathway
- Renalase protects against podocyte injury by inhibiting oxidative stress and apoptosis in diabetic nephropathy
- Review: Dicranostigma leptopodum: A peculiar plant of Papaveraceae
- Combination effect of flavonoids attenuates lung cancer cell proliferation by inhibiting the STAT3 and FAK signaling pathway
- Renal microangiopathy and immune complex glomerulonephritis induced by anti-tumour agents: A case report
- Correlation analysis of AVPR1a and AVPR2 with abnormal water and sodium and potassium metabolism in rats
- Gastrointestinal health anti-diarrheal mixture relieves spleen deficiency-induced diarrhea through regulating gut microbiota
- Myriad factors and pathways influencing tumor radiotherapy resistance
- Exploring the effects of culture conditions on Yapsin (YPS) gene expression in Nakaseomyces glabratus
- Screening of prognostic core genes based on cell–cell interaction in the peripheral blood of patients with sepsis
- Coagulation factor II thrombin receptor as a promising biomarker in breast cancer management
- Ileocecal mucinous carcinoma misdiagnosed as incarcerated hernia: A case report
- Methyltransferase like 13 promotes malignant behaviors of bladder cancer cells through targeting PI3K/ATK signaling pathway
- The debate between electricity and heat, efficacy and safety of irreversible electroporation and radiofrequency ablation in the treatment of liver cancer: A meta-analysis
- ZAG promotes colorectal cancer cell proliferation and epithelial–mesenchymal transition by promoting lipid synthesis
- Baicalein inhibits NLRP3 inflammasome activation and mitigates placental inflammation and oxidative stress in gestational diabetes mellitus
- Impact of SWCNT-conjugated senna leaf extract on breast cancer cells: A potential apoptotic therapeutic strategy
- MFAP5 inhibits the malignant progression of endometrial cancer cells in vitro
- Major ozonated autohemotherapy promoted functional recovery following spinal cord injury in adult rats via the inhibition of oxidative stress and inflammation
- Axodendritic targeting of TAU and MAP2 and microtubule polarization in iPSC-derived versus SH-SY5Y-derived human neurons
- Differential expression of phosphoinositide 3-kinase/protein kinase B and Toll-like receptor/nuclear factor kappa B signaling pathways in experimental obesity Wistar rat model
- The therapeutic potential of targeting Oncostatin M and the interleukin-6 family in retinal diseases: A comprehensive review
- BA inhibits LPS-stimulated inflammatory response and apoptosis in human middle ear epithelial cells by regulating the Nf-Kb/Iκbα axis
- Role of circRMRP and circRPL27 in chronic obstructive pulmonary disease
- Investigating the role of hyperexpressed HCN1 in inducing myocardial infarction through activation of the NF-κB signaling pathway
- Characterization of phenolic compounds and evaluation of anti-diabetic potential in Cannabis sativa L. seeds: In vivo, in vitro, and in silico studies
- Quantitative immunohistochemistry analysis of breast Ki67 based on artificial intelligence
- Ecology and Environmental Science
- Screening of different growth conditions of Bacillus subtilis isolated from membrane-less microbial fuel cell toward antimicrobial activity profiling
- Degradation of a mixture of 13 polycyclic aromatic hydrocarbons by commercial effective microorganisms
- Evaluation of the impact of two citrus plants on the variation of Panonychus citri (Acari: Tetranychidae) and beneficial phytoseiid mites
- Prediction of present and future distribution areas of Juniperus drupacea Labill and determination of ethnobotany properties in Antalya Province, Türkiye
- Population genetics of Todarodes pacificus (Cephalopoda: Ommastrephidae) in the northwest Pacific Ocean via GBS sequencing
- A comparative analysis of dendrometric, macromorphological, and micromorphological characteristics of Pistacia atlantica subsp. atlantica and Pistacia terebinthus in the middle Atlas region of Morocco
- Macrofungal sporocarp community in the lichen Scots pine forests
- Assessing the proximate compositions of indigenous forage species in Yemen’s pastoral rangelands
- Food Science
- Gut microbiota changes associated with low-carbohydrate diet intervention for obesity
- Reexamination of Aspergillus cristatus phylogeny in dark tea: Characteristics of the mitochondrial genome
- Differences in the flavonoid composition of the leaves, fruits, and branches of mulberry are distinguished based on a plant metabolomics approach
- Investigating the impact of wet rendering (solventless method) on PUFA-rich oil from catfish (Clarias magur) viscera
- Non-linear associations between cardiovascular metabolic indices and metabolic-associated fatty liver disease: A cross-sectional study in the US population (2017–2020)
- Knockdown of USP7 alleviates atherosclerosis in ApoE-deficient mice by regulating EZH2 expression
- Utility of dairy microbiome as a tool for authentication and traceability
- Agriculture
- Enhancing faba bean (Vicia faba L.) productivity through establishing the area-specific fertilizer rate recommendation in southwest Ethiopia
- Impact of novel herbicide based on synthetic auxins and ALS inhibitor on weed control
- Perspectives of pteridophytes microbiome for bioremediation in agricultural applications
- Fertilizer application parameters for drip-irrigated peanut based on the fertilizer effect function established from a “3414” field trial
- Improving the productivity and profitability of maize (Zea mays L.) using optimum blended inorganic fertilization
- Application of leaf multispectral analyzer in comparison to hyperspectral device to assess the diversity of spectral reflectance indices in wheat genotypes
- Animal Sciences
- Knockdown of ANP32E inhibits colorectal cancer cell growth and glycolysis by regulating the AKT/mTOR pathway
- Development of a detection chip for major pathogenic drug-resistant genes and drug targets in bovine respiratory system diseases
- Exploration of the genetic influence of MYOT and MB genes on the plumage coloration of Muscovy ducks
- Transcriptome analysis of adipose tissue in grazing cattle: Identifying key regulators of fat metabolism
- Comparison of nutritional value of the wild and cultivated spiny loaches at three growth stages
- Transcriptomic analysis of liver immune response in Chinese spiny frog (Quasipaa spinosa) infected with Proteus mirabilis
- Disruption of BCAA degradation is a critical characteristic of diabetic cardiomyopathy revealed by integrated transcriptome and metabolome analysis
- Plant Sciences
- Effect of long-term in-row branch covering on soil microorganisms in pear orchards
- Photosynthetic physiological characteristics, growth performance, and element concentrations reveal the calcicole–calcifuge behaviors of three Camellia species
- Transcriptome analysis reveals the mechanism of NaHCO3 promoting tobacco leaf maturation
- Bioinformatics, expression analysis, and functional verification of allene oxide synthase gene HvnAOS1 and HvnAOS2 in qingke
- Water, nitrogen, and phosphorus coupling improves gray jujube fruit quality and yield
- Improving grape fruit quality through soil conditioner: Insights from RNA-seq analysis of Cabernet Sauvignon roots
- Role of Embinin in the reabsorption of nucleus pulposus in lumbar disc herniation: Promotion of nucleus pulposus neovascularization and apoptosis of nucleus pulposus cells
- Revealing the effects of amino acid, organic acid, and phytohormones on the germination of tomato seeds under salinity stress
- Combined effects of nitrogen fertilizer and biochar on the growth, yield, and quality of pepper
- Comprehensive phytochemical and toxicological analysis of Chenopodium ambrosioides (L.) fractions
- Impact of “3414” fertilization on the yield and quality of greenhouse tomatoes
- Exploring the coupling mode of water and fertilizer for improving growth, fruit quality, and yield of the pear in the arid region
- Metagenomic analysis of endophytic bacteria in seed potato (Solanum tuberosum)
- Antibacterial, antifungal, and phytochemical properties of Salsola kali ethanolic extract
- Exploring the hepatoprotective properties of citronellol: In vitro and in silico studies on ethanol-induced damage in HepG2 cells
- Enhanced osmotic dehydration of watermelon rind using honey–sucrose solutions: A study on pre-treatment efficacy and mass transfer kinetics
- Effects of exogenous 2,4-epibrassinolide on photosynthetic traits of 53 cowpea varieties under NaCl stress
- Comparative transcriptome analysis of maize (Zea mays L.) seedlings in response to copper stress
- An optimization method for measuring the stomata in cassava (Manihot esculenta Crantz) under multiple abiotic stresses
- Fosinopril inhibits Ang II-induced VSMC proliferation, phenotype transformation, migration, and oxidative stress through the TGF-β1/Smad signaling pathway
- Antioxidant and antimicrobial activities of Salsola imbricata methanolic extract and its phytochemical characterization
- Bioengineering and Biotechnology
- Absorbable calcium and phosphorus bioactive membranes promote bone marrow mesenchymal stem cells osteogenic differentiation for bone regeneration
- New advances in protein engineering for industrial applications: Key takeaways
- An overview of the production and use of Bacillus thuringiensis toxin
- Research progress of nanoparticles in diagnosis and treatment of hepatocellular carcinoma
- Bioelectrochemical biosensors for water quality assessment and wastewater monitoring
- PEI/MMNs@LNA-542 nanoparticles alleviate ICU-acquired weakness through targeted autophagy inhibition and mitochondrial protection
- Unleashing of cytotoxic effects of thymoquinone-bovine serum albumin nanoparticles on A549 lung cancer cells
- Erratum
- Erratum to “Investigating the association between dietary patterns and glycemic control among children and adolescents with T1DM”
- Erratum to “Activation of hypermethylated P2RY1 mitigates gastric cancer by promoting apoptosis and inhibiting proliferation”
- Retraction
- Retraction to “MiR-223-3p regulates cell viability, migration, invasion, and apoptosis of non-small cell lung cancer cells by targeting RHOB”
- Retraction to “A data mining technique for detecting malignant mesothelioma cancer using multiple regression analysis”
- Special Issue on Advances in Neurodegenerative Disease Research and Treatment
- Transplantation of human neural stem cell prevents symptomatic motor behavior disability in a rat model of Parkinson’s disease
- Special Issue on Multi-omics
- Inflammasome complex genes with clinical relevance suggest potential as therapeutic targets for anti-tumor drugs in clear cell renal cell carcinoma
- Gastroesophageal varices in primary biliary cholangitis with anti-centromere antibody positivity: Early onset?