Enhancing faba bean (Vicia faba L.) productivity through establishing the area-specific fertilizer rate recommendation in southwest Ethiopia
-
Berhanu Bilate Daemo


Abstract
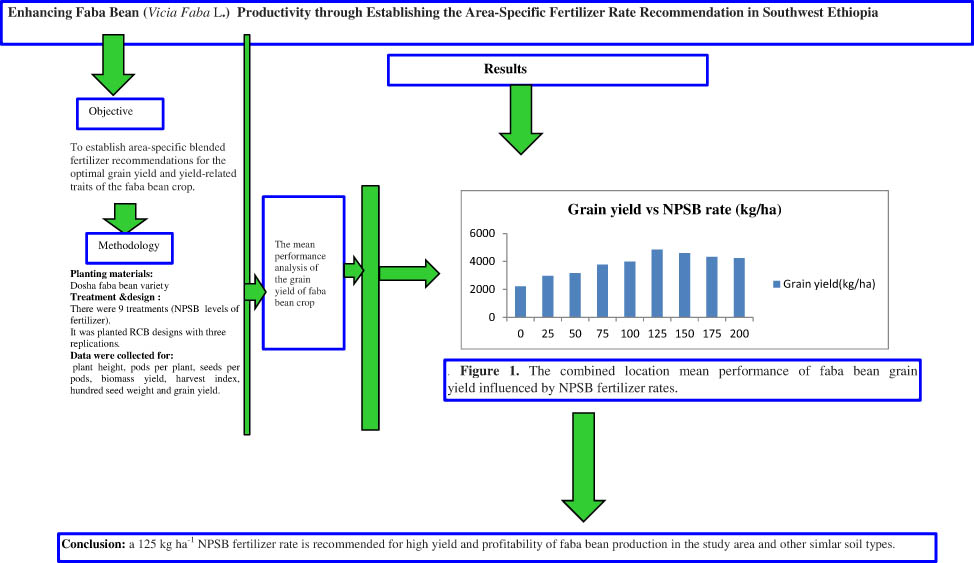
The aim of this study is to establish area-specific NPSB (18.9% N, 37.7% P2O5, 6.95% S, and 0.1% B) fertilizer rate recommendations for the optimal grain yield of faba bean. The field experiment was conducted in two locations in the 2021 and 2022 cropping seasons using a randomized complete block design with three replications. The nine treatments included 0, 25, 50, 75, 100, 125, 150, 175, and 200 kg ha−1 NPSB fertilizer rates. An economic analysis was conducted for grain yield using the International Maize and Wheat Improvement Center procedure. The analysis of variance results showed that blended fertilizer significantly (p < 0.01) affected plant height, number of pods per plant, number of seeds per plant, hundred seeds weight, biomass yield, grain yield (GY), and harvest index. The combined location mean result showed that applying a 125 kg ha−1 NPSB rate produced the highest GY (4857.2 kg ha−1). The result of economic analysis demonstrated that applying a 125 kg ha−1 NPSB rate earned the highest net benefits (212824.0 ETB ha−1) and marginal rate of return (3653.43%). Therefore, a 125 kg ha−1 NPSB fertilizer rate is recommended for high yield and profitability of faba bean production in the study area and other similar soil types.
Graphical abstract
1 Introduction
Faba bean (Vicia faba L.) is rich in protein; it can reach 25.4%, and is ranked second to soybean in protein content [1,2,3]. In the world, it has been cultivated in over 60 different countries, and China is the leading producer of faba beans, followed by Ethiopia, Egypt, and the United Kingdom [1,4,5]. Among pulse crops, in terms of cultivated area and production, the faba bean ranks third behind the soybean and the field pea in the world [6]. Ethiopia accounts for 56% of the total faba bean production in Africa, and it is the most significant source of protein in the diet of the most smallholder farmers in the region [1,4]. In the 2020/2021 cropping season, about 4.5 million smallholder farmers produced 1078265.5 metric ton in total production from an area of 518466.39 ha [7]. However, Ethiopia frequently confronts a severe and ongoing food crisis as a result of its low supply of agricultural production, which is characterized by low productivity per unit area and ineffective agricultural practices [2,3,8]. For example, the present estimated average yield of faba bean on smallholder farmer farms in Ethiopia is 2.1 t ha−1 [7], which is significantly lower than the global average yield of 4.8 t ha−1 [9]. Low yields in Ethiopia are caused by poor soil fertility management, as well as other variables such as soil erosion, poor weeding practices, and the presence of various pests and diseases [4,10].
In tropical Africa, maintaining soil fertility is a serious problem, particularly in countries with rapid population growth like Ethiopia [11,12,13]. Because declining soil fertility is a key issue for faba bean production, an adequate and balanced supply of nutrients is required for optimal faba bean yield [13,14,15]. It is a fact that inorganic fertilizers have proven to be an effective tool for managing soil fertility problems, which have contributed significantly in enhancing food production. Proper utilization of chemical fertilizer can dramatically maximize yield and turn otherwise unproductive soil into productive soil [16,17]. Chemical fertilizers are estimated to contribute one-third to one-half of total agricultural production, and thus, they are an indispensable agricultural input [18]. It is expected that an increase in crop productivity of 40–60% is thought to be attributable to the use of commercial fertilizers [19]. Because of this, increased agricultural production without a balanced application of fertilizers has resulted in soil fertility exhaustion and nutrient imbalance in plants, including problems with macro- and micronutrients [10,20]. Therefore, to optimize crop yield and meet the food needs of families with ever-expanding population growth, growing improved varieties along with chemical fertilizer may need to become an integral part of the farming operation in developing countries [21,22].
According to Ethiopian soil analysis data, the country’s soils were significantly low in most nutrients, including nitrogen (86%), phosphorus (99%), sulfur (92%), boron (65%), zinc (53%), and potassium (7%) [23,24,25]. Due to this, blended multi-nutrient fertilizers have been developed to address area-specific nutrient deficits and thus boost crop production and productivity. Farmers in the study area are currently using a newly released blended NPSB fertilizer with a blanket recommendation of 100 kg ha −1, which contains nutrients (18.9% N, 37.7% P2O5, 6.95% S, and 0.1% B) [23,25]. However, the blanket recommended (100 kg ha−1 NPSB) fertilizer rate was generated based on other soil types elsewhere, and so far, this has not been demonstrated in the study area for the optimum dose for faba bean production. As a result, it is challenging for smallholder farmers and scholars to comprehend the appropriate levels of NPSB fertilizers for faba bean production. Hence, crop yield can be increased more economically and sustainably by better matching fertilizer use to local climate, soil, and management practices [10,25,26,27]. Additionally, Bekele et al. [25] suggested shifting from blanket fertilizer recommendations toward site-specific nutrient management that is based on a thorough understanding of the differences in crop response with respect to soil type, agro-ecology, and suitable soil and plant studies. This indicated that there was a need to develop area-specific NPSB fertilizer rate recommendations to enhance the productivity and production of faba bean for smallholder farmers. Therefore, the study aimed to establish area specific blended fertilizer rate for better faba bean grain yield (GY) and yield related traits.
To achieve this objective, the study conducted soil analysis at the trial sites for two seasons before planting and arranged the nine NPSB fertilizer rates based on 100 kg ha−1 NPSB rate fertilizer as a basis, which is the rate farmers currently apply for faba bean production. Additionally, it used a randomized complete block design to control the two source variations of landscape, and the lottery randomization method was used to assign treatment to each plot. Finally, the research standard procedure involved collecting data from randomly selected individual plants and the net plot area of the whole plant.
2 Materials and methods
2.1 Description of the study area
The field experiment was conducted under rain-fed conduction in the 2021 and 2022 main cropping seasons at the Waka and Kachi trial sites. The detailed description of study areas is presented in Table 1.
Geographical location, climate, and soil type of trial sites
| Description | Waka | Kachi | Reference |
|---|---|---|---|
| Altitude (m a.s.l) | 2,450 | 2,090 | [28,29] |
| Latitude | 7o03′07″N | 7o1′4.11″N | [28,29] |
| Longitude | 37o11′37″E | 37o0’26.56″E | [28,29] |
| Annual rainfall (mm) | 1,550–2,605 | 1,443–2,535 | [28,29] |
| Temperature (min–max) | 9.24–20.85°C | 11.7–23.5°C | [28,29] |
| Soil type | Alisols | Luvisols | [28,29] |
2.2 Soil sampling and analysis
Before planting, surface (0–30 cm depth) soil samples were obtained using an auger from ten randomly selected points across the experimental fields of the Waka and Kachi trial sites and composited into one sample. A 1.0 kg sample was obtained from this mixture, air-dried, crushed, and sieved through a 2 mm sieve. The soil texture was determined using the Bouyoucos hydrometer [30]. The soil pH was measured potentiometrically with a digital pH meter in the supernatant suspension of a 1:2:5 soil-to-water ratio [31]. Total nitrogen was determined using the Kjeldahl method by Bremner [32]. Exchangeable calcium (Ca), potassium (K), magnesium (Mg), sulfur (S), phosphorus (P), and boron (B) were determined by the procedures described by Mehlich [33]. The cation exchange capacity (CEC) was determined using the ammonium acetate method by Chapman [34]. The details of the testing site soil results are presented in Table 2.
Selected physico-chemical properties of soils of experimental sites in 2021 and 2022 cropping season
| Soil properties | Unit | Environment | Rating | Reference | |
|---|---|---|---|---|---|
| Waka | Kachi | ||||
| Sand | % | 28 | 20 | ||
| Clay | % | 30 | 38 | ||
| Silt | % | 42 | 42 | ||
| Textural class | Clay loam | Clay | |||
| pH | — | 4.66 | 5.29 | Strong acid (5.1–5.5) | [35] |
| Total nitrogen | % | 0.20 | 0.24 | Medium (0.15–0.25) | [35] |
| Phosphorous | mg/kg | 4.73 | 2.75 | very low avail. (<15) | [35] |
| Sulfur | mg/kg | 9.71 | 8.25 | Very low (<10) | [35] |
| Calcium | mg/kg | 2312.09 | 2212.11 | High (2,000–4,000) | [35] |
| Magnesium | mg/kg | 206.71 | 210.12 | Moderate (120–360) | [35] |
| Potassium | mg/kg | 269.34 | 275.35 | Optimum (190–600) | [35] |
| CEC | cmol(+)/kg soil | 37.48 | 37.73 | High (25–40) | [35] |
| Boron | mg/kg | 0.48 | 0.02 | Deficiency (<0.5) | [35] |
2.3 Experimental material, treatment, design of experiment, and field management
As a test crop, the faba bean variety Dosha was used. Holata Agricultural Research Centre developed the Dosha variety in 2009, and it is a well-adapted variety in the study area. The farmer’s utilization rate (100 kg ha−1 NPSB) was used as the basis for arranging the treatment. The treatments included nine NPSB fertilizer levels (0, 25, 50, 75, 100, 125, 150, 175, and 200 kg ha−1). At planting time, the whole NPSB fertilizer was administered at the rate specified per plot. The trial sites had two sources of variation (slope and soil fertility), and hence, to control this variation, the study used a randomized complete block design with three replications. Each treatment was assigned to each plot using the lottery randomization method, and then each fertilizer rate was distributed uniformly to each plot. The experimental plot was 4 m in width and 3 m in length, with 0.5 m and 1 m between the experimental unit and block, respectively. The land was ploughed three times before planting, and the seed of the faba bean was sown at a spacing of 0.4 m and 0.1 m between the row and plant, respectively. A starter nitrogen fertilizer was applied at a rate of 18 kg ha−1 in the form of urea during the planting period. Weeding was done two times (35 and 55 days after planting) uniformly. Diseases and pests were monitored and protected until the crops were harvested from the field.
2.4 Data collection
2.4.1 Plant height (PH; cm)
In the middle rows of each plot, ten randomly selected plants were measured from the soil surface to the tip of the stem at 90% physiological maturity.
2.4.2 Number of pods per plant (NPP) and the number of seeds per pod (NSP)
The NPP and NSP were counted from the central rows of ten randomly selected plants per plot at harvest and their mean was used for analysis.
2.4.3 Aboveground dry biomass yield (BY; kg ha−1)
At 90% physiological maturity, ten randomly selected plants per plot from the middle rows were measured after 7 days of sun drying in the field until constant weight and converted from kg per plot to kg per hectare for analysis.
2.4.4 Grain yield (GY; kg ha−1)
From the net plot area (9.6 m2), faba bean was harvested, threshed, cleaned, and weighed. Also, the GY was corrected to a moisture content of 10% using a moisture tester. Then, its value (kg per plot) was converted to kg per hectare for analysis.
2.4.5 Hundred seeds weight (HSW; g)
Hundred seed weight was sampled from cleaned seeds of each plot and counted using an electronic counter. Then, it was measured using a sensitive balance by correcting the moisture content of the seed to 10%.
2.4.6 Harvest index (HI; %)
HI was calculated as follows:
2.5 Agronomic data and economic analysis
SAS statistical software, version 9.4 [36], was used to perform the data analysis of variance, and the mean separation was done using the least significant difference (LSD) at a 5% level of significance. Each location and season agronomic data were subjected to analysis variance (ANOVA), and the normality test was performed using the Shapiro–Wilk W test. Also, an individual location and season data homogeneity test was performed using Bartlett’s test, and then the combined analysis of variances was performed after confirming the homogeneity of the error variances. The combined ANOVA was performed using Generalized linear model procedures for randomized complete block design [37] as follows:
where
A partial budget analysis was calculated for each treatment to consolidate the statistical analysis of the agronomic data. According to the International Maize and Wheat Improvement Center (CIMMYT) procedure [32], farmers would achieve yields 10% lower than the obtained yield in the experiment, and then the mean faba bean GY was adjusted in the economic analysis by subtracting 10% from the actual yield. Economic evaluations were computed for the total variable cost (TVS), gross field benefit, net benefit (NB), and marginal rate of return (MRR) ratios using the method described by CIMMYT [38].
2.6 TVC
The TVC was determined as the sum of all variable costs (the cost of chemical fertilizer and labor costs for the application of the fertilizer), and the other costs remained constant for each treatment. The cost of NPSB fertilizer was 42.20 ETB kg−1 and the cost of application of NPSB fertilizer was 500.00 ETB ha−1. (3)
2.7 Gross field benefits (GFBs)
GFB was obtained by multiplying the adjusted total GY (kg ha−1) for each treatment by the current open market price of kg per Ethiopian birr (50.00 ETB kg−1) for the faba bean. (4)
2.8 Net benefit (NB)
NB was obtained as the difference between the GFB and the TVC. (5)
2.9 MRR (%)
The MRR was computed using the formula:
3 Results and discussion
3.1 PH
Different levels of NPSB fertilizer application had a significant (p < 0.001) effect on the PH of the faba bean (Table 3). The tallest PH of 109.7 cm at Waka and 107.3 cm at the Kachi were recorded by applying a 150 kg ha−1 NPSB blended fertilizer rate (Table 4). In both locations, the unfertilized plot had the smallest PH (Table 4). Also, the combined location mean revealed that applying a 150 kg ha−1 NPSB blended fertilizer rate resulted in the highest PH (108.5 cm), followed by 105.3 cm by applying a 175 kg ha−1 NPSB fertilizer rate (Table 4). The PH of faba bean increased dramatically as the NPSB fertilizer rate increased from 0 to 150 kg ha−1. The study hypothesized that the optimal availability of N, P, S, and B fertilizers could promote vegetative growth and result in increased PH in the faba bean. This study, like Genetu et al. [4] in faba bean and Tadesse et al. [39] in common bean, found that applying inorganic fertilizer significantly boosted the PH.
Combined analysis of variance of locations over seasons for growth, yield, and yield related traits of faba bean grown at Waka and Kachi in 2021 and 2022
| Source of variations | DF | Mean squares | ||||||
|---|---|---|---|---|---|---|---|---|
| PH | NPP | NSP | HSW | BY | GY | HI | ||
| Treatment (T) | 8 | 1012.7** | 21.68** | 3.18** | 601.18** | 15614269.9** | 9385440.94** | 485.68** |
| Location (L) | 1 | 197.3* | 3.34NS | 0.45NS | 948.14** | 374768.9* | 2427300.75** | 396.75** |
| Year (Y) | 1 | 1841.8** | 15.56* | 0.01NS | 186.7* | 13962.8NS | 762888.23* | 118.23* |
| Replication | 2 | 205.7NS | 7.44NS | 0.45NS | 6.37NS | 7155388.1NS | 231109.36 NS | 28.58NS |
| T × L | 8 | 8.49NS | 1.23NS | 0.03NS | 7.96NS | 10551.6NS | 214716.40NS | 31.27NS |
| T × Y | 8 | 13.68NS | 0.46NS | 0.46NS | 38.05NS | 15383.9NS | 50366.38NS | 5.58NS |
| T × Y × L | 8 | 126.25NS | 3.43NS | 0.08NS | 16.05NS | 82989.6NS | 215991.88* | 28.84NS |
| Residual | 70 | 37.23 | 1.89 | 0.35 | 42.94 | 938591.9 | 99492.35 | 23.85 |
Key: NS, *, **, = non-significant at 0.05, significant at 0.05, and highly significant 0.01 level of probability, respectively, PH = plant height (cm), NPP = number of pods per plant, NSP = number of seeds per pod, HSW = hundred seeds weight (g), BY = biomass yield (kg ha−1), GY = grain yield (kg ha−1), HI = harvest index (%).
NPSB fertilizer application influenced the PH (cm), NPP, and NSP of faba bean grown at Waka and Kachi in 2021 and 2022
| NPSB rate (kg ha−1) | PH (cm) | NPP | NSP | ||||||
|---|---|---|---|---|---|---|---|---|---|
| Waka | Kachi | Mean value | Waka | Kachi | Mean value | Waka | Kachi | Mean value | |
| 0 | 83.0d | 75.8e | 79.4f | 8.3c | 6.8d | 7.6d | 2.5c | 2.7cd | 2.6e |
| 25 | 87.0d | 85.2d | 86.1c | 10.2b | 9.7c | 9.9c | 2.3c | 2.3d | 2.3d |
| 50 | 100.5bc | 98.5bc | 99.5cd | 10.3b | 9.8c | 10.1c | 2.5c | 2.5d | 2.5d |
| 75 | 96.8c | 94.8c | 95.8d | 10.2b | 9.7c | 9.9c | 2.7bc | 2.8bcd | 2.8cd |
| 100 | 100.6bc | 98.5bc | 99.6cd | 10.8ab | 10.5bc | 10.6bc | 3.0bc | 3.3abc | 3.2bc |
| 125 | 101.5bc | 104.2ab | 102.9bcn | 12.3a | 11.8ab | 12.1a | 3.8a | 3.6a | 3.7a |
| 150 | 109.7a | 107.3a | 108.5a | 11.3ab | 11.7ab | 11.5ab | 3.7a | 3.8a | 3.8a |
| 175 | 106.5ab | 99.3bc | 102.9bc | 11.3ab | 12.2a | 11.8ab | 3.3ab | 3.5ab | 3.4ab |
| 200 | 102.6abc | 100.3bc | 101.5bc | 10.5b | 10.0c | 10.3c | 3.3ab | 3.3abc | 3.3ab |
| LSD (5%) | 7.7 | 6.7 | 4.9 | 1.6 | 1.6 | 1.1 | 0.7 | 0.7 | 0.5 |
| CV | 7.9 | 9.4 | 8.9. | 13.3 | 13.4 | 13.2 | 19.52 | 18.7 | 18.6 |
Mean values within the same column followed by the same letter or no letters are not significantly different.
3.2 NPP and NSP
The NPP and NSP were significantly influenced by applying an NPSB fertilizer (Table 3). Applying a 125 kg ha−1 NPSB fertilizer rate resulted in the highest NPP (12.3) at the Waka, whereas applying a 175 kg ha−1 NPSB fertilizer rate resulted in the highest NPP (12.2) at the Kachi (Table 4). The combined location mean result showed that the highest NPP (12.1) were produced by the application of 125 kg ha−1 NPSB fertilizer rate, followed by 11.8 pods per plant by the application of 175 kg ha−1 NPSB fertilizer rate, which was statistically similar (Table 4). The result demonstrated that raising the NPSB fertilizer rate from 0 to 125 kg ha−1 would significantly increase the NPP, while increasing the NPSB fertilizer rate from 125 to 200 kg ha−1, a varied value was observed (Table 4). The improved availability of nutrients in the soil solution for plants following the optimal application of NPSB fertilizer may be the cause of the increased NPP.
At the Waka, the highest NSP (3.8) were produced by applying 125 kg ha−1 NPSB fertilizer rate, followed by 3.7 seeds per plant by applying a 150 kg ha−1 NPSB rate, while at the Kachi, the highest NSP (3.8) were produced by the application of the 150 kg ha−1 NPSB fertilizer rate (Table 4). The combined location mean performance result showed that the highest seeds per pod (3.8) were produced by applying a 150 kg ha−1 NPSB fertilizer rate, followed by 3.7 seeds per pod by applying a 125 kg ha−1 NPSB fertilizer rate (Table 4). The study indicates that there is a linear relationship between the NPP and the NSP with NPSB fertilizer application. Hence, the optimum rate of blended fertilizer application can significantly increase the NPP and the NSP in faba beans. The highest NPP and NSP in faba bean were observed in the earlier studies by Nebiyu et al. [40] and Rasul [41] with an application rate of 150 and 125 kg ha−1 NPS fertilizer, respectively. A similar study by Zamukulu et al. [42] reported that NPS fertilizer significantly affected the NPP and the NSP in common beans.
3.3 HSW
The HSW was significantly affected by the application of NPSB fertilizer rates (Table 3). At the Waka, applying a 150 kg ha−1 NPSB fertilizer rate resulted in the highest HSW (104.2 g), followed by 103.5 g and 102.7 g by the application of 125 and 175 kg ha−1 NPSB fertilizer rates, respectively, which were statistically similar, while the lowest HSW (85.3 g) was found in an unfertilized plot (Table 5). Similarly, at Kachi, the highest HSW (98.3 g) was obtained by applying a 125 kg ha−1 NPSB fertilizer rate (Table 5). The pooled location mean result revealed that the highest HSW (100.9 g) was produced by applying a 125 kg ha−1 NPSB fertilizer rate (Table 5). This finding indicates that increasing the fertilizer rate from 0 to 125 kg ha−1 would increase (82–100.9 g) the HSW of the faba bean; beyond that, it shows no increment in the HSW. The observed difference in HSW could be attributed to an increase in the rate of P, which will help balance the utilization of other minerals. This finding is corroborated by earlier research by Mekonnen and Saliha [43], Deresa [44], and Zewide et al. [45], who found a considerable increase in common bean HSW following the application of blended fertilizer.
NPSB fertilizer application influenced the HSW (g) and HI (%) of faba bean grown at Waka and Kachi in 2021 and 2022
| NPSB rate (kg ha−1) | HSW (g) | HI (%) | ||||
|---|---|---|---|---|---|---|
| Waka | Kachi | Mean value | Waka | Kachi | Mean value | |
| 0 | 85.3d | 78.7d | 82.0e | 30.5c | 28.0e | 29.3e |
| 25 | 85.6d | 83.8cd | 84.7e | 45.0ab | 34.8d | 39.8b |
| 50 | 90.0cd | 84.2cd | 87.1de | 34.8c | 37.5cd | 36.2d |
| 75 | 93.6bc | 87.5bc | 90.6cd | 42.8b | 37.8cd | 40.4b |
| 100 | 99.0ab | 92.0ab | 95.5bc | 43.5ab | 40.2abc | 43.8bc |
| 125 | 103.5a | 98.3a | 100.9a | 51.3a | 45.8a | 48.6a |
| 150 | 104.2a | 96.8a | 100.5ab | 47.0ab | 43.5ab | 45.3ab |
| 175 | 102.7a | 96.3a | 99.5ab | 43.0b | 38.3bcd | 40.6bc |
| 200 | 98.3ab | 91.3abc | 94.8bc | 45.8ab | 41.3bcd | 43.6bc |
| LSD (5%) | 7.9 | 7.6 | 5.3 | 6.4 | 5.6 | 4.2 |
| CV | 9.8 | 7.8 | 8.9 | 13.0 | 17.47 | 12.8 |
Mean values within the same column followed by the same letter or no letters are not significantly different.
3.4 HI
Applying an NPSB fertilizer significantly influenced the HI trait in the faba bean (Table 3). Applying a 125 kg ha−1 NPSB rate gave the maximum HI (51.3%) and (45.6%) at the Waka and Kachi locations, respectively (Table 5). The unfertilized plot produced the lowest harvest index (30.5%) at the Waka and (28.0%) at the Kachi (Table 5). Additionally, analysis of the combined location mean separation showed that the highest HI (48.6%) was achieved by applying a 125 kg ha−1 NPSB rate, followed by 45.3 and 43.8% produced by the application of 150 and 100 kg ha−1 NPSB fertilizer rates, respectively (Table 5). This study suggests that an increase in the blended NPSB fertilizer rate leads to an increase in HI. This could be the positive effect of NPSB fertilizer on crop nutrient utilization and photoassimilate movement from vegetative to grain sections of the crop. This conclusion is consistent with Gebeyehu’s [46] observation that the application of NPSB to faba bean caused the HI to significantly increase. Furthermore, Deresa [44] reported that NPS fertilizer application had a considerable effect on the common bean HI, and Debela et al. [47] observed strong NPS effects on the soybean HI.
3.5 BY
The application of various levels of NPSB blended fertilizer had a substantial effect on the aboveground dry BY (Table 3). At the Waka, the application of 175 kg ha−1 NPSB rate resulted in the highest dry BY (10,609 kg ha−1), followed by 10,093 kg ha−1 by applying 150 kg ha−1 NPSB rate, and the lowest dry BY (7245.7 kg ha−1) was recorded by the application of 25 kg ha−1 NPSB blended fertilizer rate (Figure 1). Similarly, at Kachi, applying 175 kg ha−1 NPSB fertilizer rate gave the highest dry BY (10,743 kg ha−1), while the lowest dry BY (7545.3 kg ha−1) was produced from an unfertilized plot (Figure 1). Furthermore, analysis of the combined location mean result indicated that the highest dry biomass yield (10,676 kg ha−1) was produced by applying a 175 kg ha−1 NPSB rate (Figure 1). The results showed that higher NPSB fertilizer rates were related to higher biomass yields. According to this finding, increasing blended NPSB rates leads to enhanced availability of nitrogen, which could increase vegetative growth and raise the yield of aboveground dry biomass. This result is similar to the study by Samago et al. [48], who found that NP fertilizers significantly increased dry BY and dry matter production in common beans, and Tirfessa et al. [49] found NPSB application significantly enhanced common bean BY.

The NPSB fertilizer application influenced the aboveground dry BY (kg ha−1) of faba bean grown at Waka and Kachi in 2021 and 2022.
3.6 GY
Applying various doses of NPSB blended fertilizer considerably influenced the GY of faba beans (Table 3). Applying a 125 kg ha−1 NPSB rate resulted in the highest GYs (5098.8 kg ha−1) and (4615.5 8 kg ha−1) at the Waka and Kachi, respectively (Figure 2). The unfertilized plots produced the lowest GY (2311.3 kg ha−1) at the Waka and (2099.0 kg ha−1) at the Kachi. As a result, at the Waka, the highest GY was exceeded by 120.64 and 23.88% unfertilized plots and blanket recommended fertilizer produced GY, respectively, while at the Kachi, the maximum grain yield was greater than 119.5 and 20.0% unfertilized plots and blanket recommended fertilizer produced GY, respectively. Additionally, the combined location mean performance result showed that the highest grain yield (4857.2 kg ha−1) was produced by the application of 125 kg ha−1 NPSB rate, followed by 4589.8 kg ha−1 GY by the application of 150 kg ha−1 NPSB rate (Figure 2). The findings show that increasing the NPSB fertilizer rate from 0 to 125 kg ha−1 would increase (from 2206.9 to 4857.2 kg ha−1) the GY of the faba bean, beyond which increasing the fertilizer rate would gradually reduce the GY. This implies that a 125 kg ha−1 NPSB fertilizer rate could be the maximum requirement for the faba bean in the current study. The increased GY in faba beans is due to higher S and B fertilizers, their availability accompanied by major nutrients and enhanced crop uptake. This leads to improved chlorophyll absorption and dry matter production, which contribute to the GY increase. The study observed the presence of a linear relationship between GY and NPSB blended fertilizer application. Thus, smallholder farmers can boost faba bean GY using the optimum rate of NPSB fertilizer.
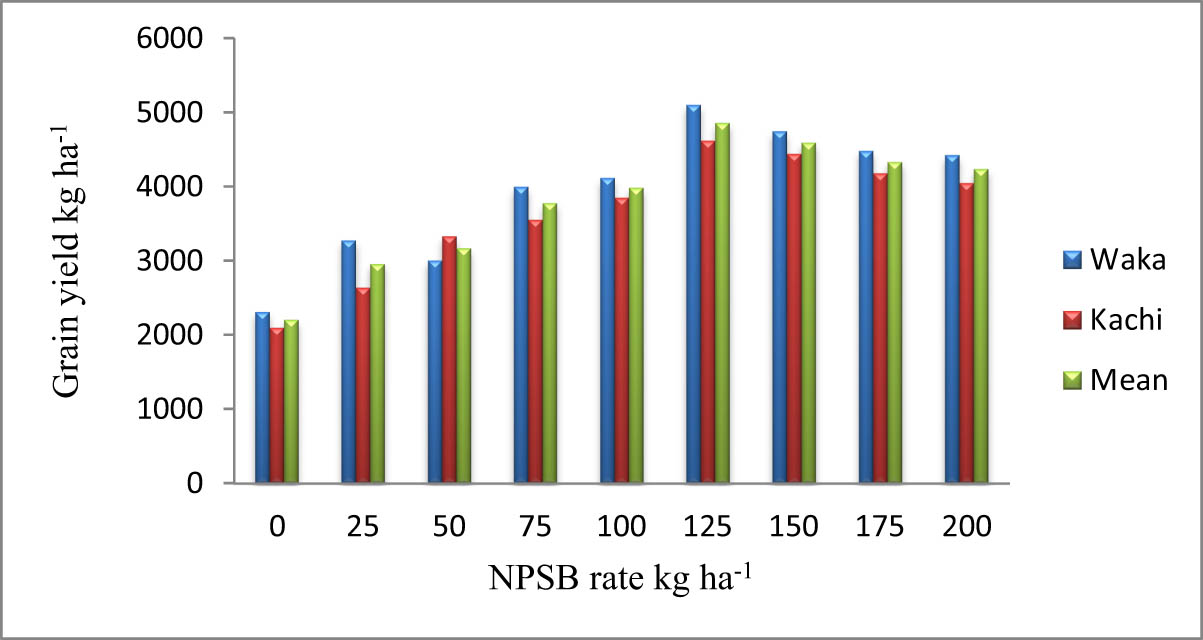
The NPSB fertilizer application influenced the GY (kg ha−1) of faba bean grown at Waka and Kachi in 2021 and 2022.
In an earlier study, Gebeyehu [46] found the highest GY with the application of 150 kg ha−1 NPSB, which increased GY by 154% compared to the unfertilized plot, and Geleta and Bekele [50] reported that the application of 120 NPSB produced the maximum GY in faba bean, where it exceeded that of the unfertilized plot GY by 178%. Similar findings that different rates of blended fertilizer significantly influenced GY were reported by Kaysha et al. [51] in mung bean; Baza et al. [52] in mung bean; Arega and Zenebe [53] in common bean; Debela et al. [47] in soybean.
3.7 Soil acidity
The soil analysis results (Table 2) shows that the pH of the trial sites had a low value ranging from 4.66 to 5.29, and a soil pH less than 5.5 could influence crop yield due to the toxicities of H+, Al3+, Mn2+, and Fe2+ cations, as well as the concomitant in the applied phosphorus (P) could not be fully available to crops [54]. In this case, liming based on soil test findings is crucial to raising the pH of the soil up to the desired level advised for crops [55]. As a result, the study expected that if the trial sites were limed, the linear response of the examined traits to NPSB application would be greater than the observed value of the current finding.
3.8 Economic analysis
The partial budget analysis result is presented in Table 6. The partial budget analysis was determined using the TVCs and the NBs of each treatment, and it was calculated based on the combined location GY mean value. The cost of NPSB fertilizer and the labor associated with applying it varied in the current study, whereas all other expenditures remained the same for each treatment. In terms of GY and NBs, applying NPSB blended fertilizer to faba bean crops was often superior to that of unfertilized plots. As a result, the present study findings showed that the highest NB (212824.0 ETB ha−1) along with the highest MRR (3653.43%) was recorded by applying a 125 kg ha−1 NPSB blended fertilizer rate, followed by NBs of 174463.0 ETB ha−1 with 788% of the MRR by the application of 100 kg ha−1 NPSB blended fertilizer rate (Table 6). The findings indicate that a 125 kg ha−1 blended fertilizer rate is a superior option for smallholder farmers to increase the productivity and production of faba beans in the study area and other similar agro-ecologies and soil types.
Partial budget analysis for NPSB fertilizer rate based on combined location mean GY of faba bean grown at Waka and Kachi in the 2021 and 2022 cropping seasons
| NPSB (kg ha−1) | UGY (kg ha−1) | AGY (kg ha−1) | Fertilizer cost (ETB ha−1) | Fert. app. cost (ETB ha−1) | TVC (ETB ha−1) | GFB (ETB ha−1) | NB (ETB ha−1) | MRR |
|---|---|---|---|---|---|---|---|---|
| 0 | 2206.9 | 1986.21 | 0 | 0 | 0 | 99310.5 | 99310.5 | |
| 25 | 2955 | 2659.5 | 1050.0 | 500.0 | 1550.0 | 132975.0 | 131425.0 | 2071.9 |
| 50 | 3167 | 2850.3 | 2100.0 | 500.0 | 2600.0 | 142515.0 | 139915.0 | 808.57 |
| 75 | 3774.2 | 3396.78 | 3150.0 | 500.0 | 3650.0 | 169839.0 | 166189.0 | 2502.29 |
| 100 | 3981.4 | 3583.26 | 4200.0 | 500.0 | 4700.0 | 179163.0 | 174463.0 | 788.0 |
| 125 | 4857.2 | 4371.48 | 5250.0 | 500.0 | 5750.0 | 218574.0 | 212824.0 | 3653.43 |
| 150 | 4589.8 | 4130.82 | 6300.0 | 500.0 | 6800.0 | 206541.0 | 199741.0 | D |
| 175 | 4327.5 | 3894.75 | 7350.0 | 500.0 | 7850.0 | 194737.5 | 186887.5 | D |
| 200 | 4234.5 | 3811.05 | 8400.0 | 500.0 | 8900.0 | 190552.5 | 181652.5 | D |
Notice: 1US Dollar = 55 ETB current exchanging rate. Key: UGY = unadjusted grain yield kg ha−1, AGY = 10% adjusted gain yield kg ha−1, TVC = total variables costs (ETB), GFB = gross field benefit (ETB), NB = net benefit (ETB), MRR = marginal rate of return (%), and D = dominated.
4 Conclusion
The use of chemical fertilizers is the most common agricultural practice for increasing crop yield. However, their utilization beyond or below optimal levels has resulted in negative effects on the environment and crop yield. Hence, chemical fertilizer rate recommendations need to be improved for economic and environmental reasons. As a result, the present study was conducted to determine the NPSB blended fertilizer rate for the optimal GY and other agronomic traits of the faba bean. The results demonstrated that NPSB fertilizer application had a substantial effect on PH, NPP, NSP, HSW, aboveground BY, GY, and HI traits of the faba bean. The optimal fertilizer rate for faba bean production is 125 kg ha−1 NPSB, resulting in the highest mean GY (4857.2 kg ha−1), NBs (212824.0 ETB ha−1), and MRR (3653.43%). Therefore, a 125 kg ha−1NPSB fertilizer rate is suggested for high yield and profitability of faba bean production in the study area and other similar soil types and agro-ecological zone. The finding could be applied to both acidic and non-acidic soil.
4.1 Limitation of the study
Our findings present the NPSB fertilizer application effect on faba bean GY and yield-related traits research method based on the stated objective. In this study, soil fertility management mainly focused on blended chemical fertilizer to improve faba bean GY and yield-related traits. However, the soil test result indicated that the trial sites had a high acidity level, which required lime treatment. Hence, liming is believed to be able to raise the soil pH optimum level, increase the availability of phosphorus (P), and minimize the toxicities of H+, Al3+, Mn2+, and Fe2+ cations, resulting in a positive effect on crop yield. Therefore, the author is encouraged to take the variable lime into account with NPSB fertilizer in future studies.
Acknowledgements
Wolaita Sodo University is acknowledged by the author for providing funding for the study. The author is also pleased to acknowledge Holata Agricultural Research Center for providing the planting materials used for this study.
-
Funding information: This research work was funded by Wolaita Sodo University.
-
Author contributions: Berhanu Bilate Daemo: conceptualization, data collection, formal analysis, funding acquisition, investigation, methodology, project administration, writing – original draft, writing – review and editing.
-
Conflict of interest: Author states no conflict of interest.
-
Data availability statement: The datasets generated during and/or analyzed during the current study are available from the corresponding author on reasonable request.
References
[1] Hailu E, Getaneh G, Sefera T, Tadesse T, Bitew B, Boydom A, et al. Faba bean gall; a new threat for faba bean (Vicia faba) production in Ethiopia. Adv Crop Sci Technol. 2014;2(4):144–52.Search in Google Scholar
[2] Merga B, Egigu MC, Wakgari M. Reconsidering the economic and nutritional importance of faba bean in Ethiopian context. Cogent Food Agric. 2019;5:1–12.Search in Google Scholar
[3] Adissie S, Adgo E, Feyisa T. Effect of rhizobial inoculants and micronutrients on yield and yield components of faba bean (Vicia faba L.) on vertisol of Wereillu district, South Wollo, Ethiopia. Cogent Food Agric. 2020;6(1):1747854.Search in Google Scholar
[4] Genetu G, Yli-Halla M, Asrat M, Alemayehu M. Rhizobium inoculation and chemical fertilisation improve faba bean yield and yield components in Northwestern Ethiopia. Agriculture. 2021;11(7):678.Search in Google Scholar
[5] Liu Z, Xing Y, Jin D, Liu Y, Lu Y, Chen Y, et al. Improved nitrogen utilization of Faba Bean (Vicia faba L.) roots and plant physiological characteristics under the combined application of organic and inorganic fertilizers. Agriculture. 2022;12(12):1–13.Search in Google Scholar
[6] FAOSTAT. Food and Agriculture Organization of the United Nations databases Agricultural Production. Rome, Italy: FAO Statistics Databases; 2021. http://www. fao. org/faostat/en/(accessed on 20 June, 2023).Search in Google Scholar
[7] CSA. Report on area, production and farm management practice of belg season crops for private peasant holdings, Agricultural Sample Surveys, CSA, Addis Ababa, Ethiopia; 2021Search in Google Scholar
[8] Sigaye MH, Nigussei A, Yacob A. Effects of NPSB blended and urea fertilizer rates on yield and yield components of maize and economic productivity under andisols and chernozems soil types. Int J Res Stud Agric Sci (IJRSAS). 2022;8(3):10–7.Search in Google Scholar
[9] Akibode S, Maredia M. Global and regional trends in production, trade and consumption of food legume crops; department of agricultural. Food and Resource Economics. East Lansing, MI, USA: Michigan State University; 2012.Search in Google Scholar
[10] Kebede E. Grain legumes production and productivity in Ethiopian smallholder agricultural system, contribution to livelihoods and the way forward. Cogent Food Agric. 2020 Jan;6(1):1722353.Search in Google Scholar
[11] Collier P, Dercon S. African agriculture in 50 years: smallholders in a rapidly changing world? World Dev. 2014 Nov;63:92–101.Search in Google Scholar
[12] Hirpa A, Meuwissen MP, Lommen WJ, Lansink AO, Tsegaye A, Struik PC. Improving seed potato quality in Ethiopia: a value chain perspective. InQuality and innovation in food chains: Lessons and insights from Africa. Ethiopia: Wageningen Academic. Publishers; 2016. p. 84–122.Search in Google Scholar
[13] Raimi A, Adeleke R, Roopnarain A. Soil fertility challenges and Biofertiliser as a viable alternative for increasing smallholder farmer crop productivity in sub-Saharan Africa. Cogent Food Agric. 2017 Jan;3(1):1400933.Search in Google Scholar
[14] Ronner E, Franke AC, Vanlauwe B, Dianda M, Edeh E, Ukem B, et al. Understanding variability in soybean yield and response to P-fertilizer and Rhizobium inoculants on farmers’ fields in northern Nigeria. Field Crop Res. 2016 Feb;186:133–45.Search in Google Scholar
[15] Getu A, Gashu K, Mengie Y, Agumas B, Abewa A, Alemayehu A. Optimization of P and K fertilizer recommendation for faba bean in Ethiopia: The case for Sekela District. World Sci N. 2020;142:169–79.Search in Google Scholar
[16] Sharma A, Chetani R. A review on the effect of organic and chemical fertilizers on plants. Int J Res Appl Sci Eng Technol. 2017;5:677–80.Search in Google Scholar
[17] Pahalvi HN, Rafiya L, Rashid S, Nisar B, Kamili AN. Chemical fertilizers and their impact on soil health. Microbiota Biofertil. 2021;2:1–20.Search in Google Scholar
[18] Naher UA, Ahmed MN, Sarkar MI, Biswas JC, Panhwar QA. Fertilizer management strategies for sustainable rice production. Org farming. 2019;251–67.Search in Google Scholar
[19] Stewart WM, Roberts TL. Food security and the role of fertilizer in supporting it. Procedia Eng. 2012;46:76–82.Search in Google Scholar
[20] Yoseph T, Shanko S. Growth Symbiotic and yield response of N-fertilized and Rhizobium inoculated common bean (Phaseolus vulgaris L.). Afr J Plant Sci. 2017;11(6):197–202.Search in Google Scholar
[21] Patra S, Mishra P, Mahapatra SC, Mithun SK. Modelling impacts of chemical fertilizer on agricultural production: a case study on Hooghly district, West Bengal, India. Modeling Earth Syst Environ. 2016;2:1–1.Search in Google Scholar
[22] Abebe TG, Tamtam MR, Abebe AA, Abtemariam KA, Shigut TG, Dejen YA, et al. Growing use and impacts of chemical fertilizers and assessing alternative organic fertilizer sources in Ethiopia. Appl Environ Soil Sci. 2022;2022:1–4.Search in Google Scholar
[23] Mohammed E, Mohammed J, Lewut S, Gizachew S. Evaluation of blended fertilizer rate for better production of maize at Siltie Zone Sankurra Woreda. J Sci Innovative Res. 2022;11(4):80–3.Search in Google Scholar
[24] Abuye F, Haile M, Haile W. Soil fertility status, fertilizer application and nutrient balance in SNNPR, southern Ethiopia in contrasting agro-ecological zones of Ethiopia. Afr J Agric Res. 2021;17(11):1433–52.Search in Google Scholar
[25] Bekele I, Lulie B, Habte M, Boke S, Hailu G, Mariam EH, et al. Response of maize yield to nitrogen, phosphorus, potassium and sulphur rates on Andosols and Nitisols in Ethiopia. Exp Agriculture. 2022;58:e11.Search in Google Scholar
[26] Workayehu T. Legume-based cropping for sustainable production, economic benefit and reducing climate change impacts in southern Ethiopia. J Agric Crop Res. 2014;2(1):11–21.Search in Google Scholar
[27] Chimdessa D. Blended fertilizers effects on maize yield and yield components of Western Oromia, Ethiopia. Agriculture Forestry and Fisheries. 2016;5:151–62.Search in Google Scholar
[28] Getaneh L, Laekemariam LF. Response of potato (Solanum tuberosum L.) to NPS fertilizer rates and inter-row spacing in Kechi district, south western Ethiopia. Appl Environ Soil Sci. 2021;2021:1–11.Search in Google Scholar
[29] Bilate DB, Belew YD, Mulualem BT, Gebreselassie AW. Assessment of cassava utilization patterns, postharvest handling practices, and productivity influencing factors in South and Southwest Ethiopia. J Food Qual. 2023;11:1–12.Search in Google Scholar
[30] Bouyoucos GJ. Hydrometer method improved for making particle size analyses of soils 1. Agron J. 1962;54(5):464–5.Search in Google Scholar
[31] Chopra SH, Kanwar JS. Analysis agricultural chemistry Kalyni publishe r Ludhiana New Delhi. Commun Soil Sci Plant Anal. 1976;33(9–10):1537–75.Search in Google Scholar
[32] Bremner MJ. Determination of nitrogen in soil by the Kjeldahl method. J Agric Sci. 1960;55(1):11–33.Search in Google Scholar
[33] Mehlich A. Mehlich 3 soil test extractant: A modification of Mehlich 2 extractant. Commun Soil Sci plant Anal. 1984;15(12):1409–16.Search in Google Scholar
[34] Chapman HD. Cation‐exchange capacity. Methods Soil Anal. 1965;9:891–901.Search in Google Scholar
[35] Hazelton P, Murphy B. Interpreting soil test results: What do all the numbers mean?. Australia: CSIRO publishing; 2016.Search in Google Scholar
[36] SAS, Institute Inc, SAS® 9.4 System Options: Reference. Cary, NC, and USA: SAS Institute Inc; 2019.Search in Google Scholar
[37] Gomez KA, Gomez AA. Statistical procedures for agricultural research. Philippines: John Wiley & Sons; 1984.Search in Google Scholar
[38] CIMMYT. Economics Program, From agronomic data to farmer recommendations: an economics training manual (No. 27); 1988.Search in Google Scholar
[39] Tadesse A, Shanka D, Laekemariam F. Short-term integrated application of nitrogen, phosphorus, sulfur, and boron fertilizer and the farmyard manure effect on the yield and yield components of common bean (Phaseolus vulgaris L.) at Alle special Woreda, Southern Ethiopia. Appl Environ Soil Sci. 2022;3:1–13.Search in Google Scholar
[40] Nebiyu A, Diels J, Boeckx P. Phosphorus use efficiency of improved faba bean (Vicia faba) varieties in low‐input agro‐ecosystems. J Plant Nutr Soil Sci. 2016;179(3):347–54.Search in Google Scholar
[41] Rasul GA. Effect of level combinations of nitrogen and phosphorus fertilizers on growth and yield of faba bean (Vicia faba L.) in a calcareous soil from Sulaimani province. J Homepage. 2018;20(1):81–8.Search in Google Scholar
[42] Zamukulu PM, Bagula EM, Mondo JM, Chuma GB, Safina FB, Cishesa TH, et al. Optimization of plant density and fertilizer application to improve biofortified common bean (Phaseolus vulgaris L.) yield on Nitisols of South-Kivu, East D.R. Congo. Heliyon. 2023;9:e17293. 10.1016/j.heliyon.Search in Google Scholar
[43] Mekonnen L, Saliha J. The response of common bean (Phaseoluse vulgaris L.) to various levels of blended fertilizer. Int J Res Agriculture Forestry. 2018;5(7):15–20.Search in Google Scholar
[44] Deresa S. Response of common bean (Phaseolus vulgaris L.) varieties to rates of blended NPS fertilizer in Adola district, Southern Ethiopia. Afr J Plant Sci. 2018;12(8):164–79.Search in Google Scholar
[45] Zewide L, Boni T, Wondimu W, Adimasu K. Yield and economics of bean (Phaseolus vulgaris L.) as affected by blended NPS fertilizer rates and inter row spacing at Maenitgoldia, Southwest Ethiopia. Sci Temper. 2023;14(2):468–78.Search in Google Scholar
[46] Gebeyehu B. Effects of Rhizobium inoculation and blended fertilizer rate on yield and yield components of faba bean (Vicia faba L.) in Dangila District, Northwestern Ethiopia. Int J Res Agric Sci. 2021;8(1):55–63.Search in Google Scholar
[47] Debela C, Tana T, Wogi L. Effect of Rhizobium Inoculation, NPS Fertilizer and Vermicompost on Nodulation and Yield of Soybean (Glycine max (L). Merrill) at Bako, Western Ethiopia. J Chem Env Biol Eng. 2021;5:49–61.Search in Google Scholar
[48] Samago TY, Anniye EW, Dakora FD. Grain yield of common bean (Phaseolus vulgaris L.) varieties is markedly increased by rhizobial inoculation and phosphorus application in Ethiopia. Symbiosis. 2018;75:245–55.Search in Google Scholar
[49] Tirfessa T, Jalata Z, Lamessa K. Influence of blended NPSB fertilizer on nodulation and yield performance of Rhizobium inoculated common bean varieties in acidic soil, western Ethiopia. All Life. 2022;5(1):1290–303.Search in Google Scholar
[50] Geleta D, Bekele G. Yield response of faba bean to lime, NPSB, and Rhizobium inoculation in Kiremu district, western Ethiopia. Appl Environ Soil Sci. 2022;2022:1–11.Search in Google Scholar
[51] Kaysha K, Shanka D, Bibiso M. Performance of mung bean (Vigna radiata L.) varieties at different NPS rates and row spacing at Kindo Koysha district, Southern Ethiopia. Cogent Food Agric. 2020;6(1):1771112.Search in Google Scholar
[52] Baza M, Shanka D, Bibiso M. Agronomic and economic performance of mung bean (Vigna radiata L.) varieties in response to rates of blended NPS fertilizer in Kindo Koysha district, Southern Ethiopia. Open Life Sci. 2022;17(1):1053–63.Search in Google Scholar
[53] Arega A, Zenebe M. Common Bean (Phaseolus vulgaris L.) varieties response to rates of blended NPKSB fertilizer at Arba Minch, Southern Ethiopia. Adv Crop Sci Technol. 2019;7(3):429.Search in Google Scholar
[54] Wayima EF, Ligaba-Osena A, Dagne K, Tesfaye K, Machuka EM, Mutiga SK, et al. Screening of diverse Ethiopian durum wheat accessions for aluminum tolerance. Agronomy. 2019;9(8):440.Search in Google Scholar
[55] Agegnehu G, Amede T, Erkossa T, Yirga C, Henry C, Tyler R, et al. Extent and management of acid soils for sustainable crop production system in the tropical agroecosystems: A review. Acta Agric Scand Sect B – Soil Plant Sci. 2021 Aug;71(9):852–69.Search in Google Scholar
© 2024 the author(s), published by De Gruyter
This work is licensed under the Creative Commons Attribution 4.0 International License.
Articles in the same Issue
- Biomedical Sciences
- Constitutive and evoked release of ATP in adult mouse olfactory epithelium
- LARP1 knockdown inhibits cultured gastric carcinoma cell cycle progression and metastatic behavior
- PEGylated porcine–human recombinant uricase: A novel fusion protein with improved efficacy and safety for the treatment of hyperuricemia and renal complications
- Research progress on ocular complications caused by type 2 diabetes mellitus and the function of tears and blepharons
- The role and mechanism of esketamine in preventing and treating remifentanil-induced hyperalgesia based on the NMDA receptor–CaMKII pathway
- Brucella infection combined with Nocardia infection: A case report and literature review
- Detection of serum interleukin-18 level and neutrophil/lymphocyte ratio in patients with antineutrophil cytoplasmic antibody-associated vasculitis and its clinical significance
- Ang-1, Ang-2, and Tie2 are diagnostic biomarkers for Henoch-Schönlein purpura and pediatric-onset systemic lupus erythematous
- PTTG1 induces pancreatic cancer cell proliferation and promotes aerobic glycolysis by regulating c-myc
- Role of serum B-cell-activating factor and interleukin-17 as biomarkers in the classification of interstitial pneumonia with autoimmune features
- Effectiveness and safety of a mumps containing vaccine in preventing laboratory-confirmed mumps cases from 2002 to 2017: A meta-analysis
- Low levels of sex hormone-binding globulin predict an increased breast cancer risk and its underlying molecular mechanisms
- A case of Trousseau syndrome: Screening, detection and complication
- Application of the integrated airway humidification device enhances the humidification effect of the rabbit tracheotomy model
- Preparation of Cu2+/TA/HAP composite coating with anti-bacterial and osteogenic potential on 3D-printed porous Ti alloy scaffolds for orthopedic applications
- Aquaporin-8 promotes human dermal fibroblasts to counteract hydrogen peroxide-induced oxidative damage: A novel target for management of skin aging
- Current research and evidence gaps on placental development in iron deficiency anemia
- Single-nucleotide polymorphism rs2910829 in PDE4D is related to stroke susceptibility in Chinese populations: The results of a meta-analysis
- Pheochromocytoma-induced myocardial infarction: A case report
- Kaempferol regulates apoptosis and migration of neural stem cells to attenuate cerebral infarction by O‐GlcNAcylation of β-catenin
- Sirtuin 5 regulates acute myeloid leukemia cell viability and apoptosis by succinylation modification of glycine decarboxylase
- Apigenin 7-glucoside impedes hypoxia-induced malignant phenotypes of cervical cancer cells in a p16-dependent manner
- KAT2A changes the function of endometrial stromal cells via regulating the succinylation of ENO1
- Current state of research on copper complexes in the treatment of breast cancer
- Exploring antioxidant strategies in the pathogenesis of ALS
- Helicobacter pylori causes gastric dysbacteriosis in chronic gastritis patients
- IL-33/soluble ST2 axis is associated with radiation-induced cardiac injury
- The predictive value of serum NLR, SII, and OPNI for lymph node metastasis in breast cancer patients with internal mammary lymph nodes after thoracoscopic surgery
- Carrying SNP rs17506395 (T > G) in TP63 gene and CCR5Δ32 mutation associated with the occurrence of breast cancer in Burkina Faso
- P2X7 receptor: A receptor closely linked with sepsis-associated encephalopathy
- Probiotics for inflammatory bowel disease: Is there sufficient evidence?
- Identification of KDM4C as a gene conferring drug resistance in multiple myeloma
- Microbial perspective on the skin–gut axis and atopic dermatitis
- Thymosin α1 combined with XELOX improves immune function and reduces serum tumor markers in colorectal cancer patients after radical surgery
- Highly specific vaginal microbiome signature for gynecological cancers
- Sample size estimation for AQP4-IgG seropositive optic neuritis: Retinal damage detection by optical coherence tomography
- The effects of SDF-1 combined application with VEGF on femoral distraction osteogenesis in rats
- Fabrication and characterization of gold nanoparticles using alginate: In vitro and in vivo assessment of its administration effects with swimming exercise on diabetic rats
- Mitigating digestive disorders: Action mechanisms of Mediterranean herbal active compounds
- Distribution of CYP2D6 and CYP2C19 gene polymorphisms in Han and Uygur populations with breast cancer in Xinjiang, China
- VSP-2 attenuates secretion of inflammatory cytokines induced by LPS in BV2 cells by mediating the PPARγ/NF-κB signaling pathway
- Factors influencing spontaneous hypothermia after emergency trauma and the construction of a predictive model
- Long-term administration of morphine specifically alters the level of protein expression in different brain regions and affects the redox state
- Application of metagenomic next-generation sequencing technology in the etiological diagnosis of peritoneal dialysis-associated peritonitis
- Clinical diagnosis, prevention, and treatment of neurodyspepsia syndrome using intelligent medicine
- Case report: Successful bronchoscopic interventional treatment of endobronchial leiomyomas
- Preliminary investigation into the genetic etiology of short stature in children through whole exon sequencing of the core family
- Cystic adenomyoma of the uterus: Case report and literature review
- Mesoporous silica nanoparticles as a drug delivery mechanism
- Dynamic changes in autophagy activity in different degrees of pulmonary fibrosis in mice
- Vitamin D deficiency and inflammatory markers in type 2 diabetes: Big data insights
- Lactate-induced IGF1R protein lactylation promotes proliferation and metabolic reprogramming of lung cancer cells
- Meta-analysis on the efficacy of allogeneic hematopoietic stem cell transplantation to treat malignant lymphoma
- Mitochondrial DNA drives neuroinflammation through the cGAS-IFN signaling pathway in the spinal cord of neuropathic pain mice
- Application value of artificial intelligence algorithm-based magnetic resonance multi-sequence imaging in staging diagnosis of cervical cancer
- Embedded monitoring system and teaching of artificial intelligence online drug component recognition
- Investigation into the association of FNDC1 and ADAMTS12 gene expression with plumage coloration in Muscovy ducks
- Yak meat content in feed and its impact on the growth of rats
- A rare case of Richter transformation with breast involvement: A case report and literature review
- First report of Nocardia wallacei infection in an immunocompetent patient in Zhejiang province
- Rhodococcus equi and Brucella pulmonary mass in immunocompetent: A case report and literature review
- Downregulation of RIP3 ameliorates the left ventricular mechanics and function after myocardial infarction via modulating NF-κB/NLRP3 pathway
- Evaluation of the role of some non-enzymatic antioxidants among Iraqi patients with non-alcoholic fatty liver disease
- The role of Phafin proteins in cell signaling pathways and diseases
- Ten-year anemia as initial manifestation of Castleman disease in the abdominal cavity: A case report
- Coexistence of hereditary spherocytosis with SPTB P.Trp1150 gene variant and Gilbert syndrome: A case report and literature review
- Utilization of convolutional neural networks to analyze microscopic images for high-throughput screening of mesenchymal stem cells
- Exploratory evaluation supported by experimental and modeling approaches of Inula viscosa root extract as a potent corrosion inhibitor for mild steel in a 1 M HCl solution
- Imaging manifestations of ductal adenoma of the breast: A case report
- Gut microbiota and sleep: Interaction mechanisms and therapeutic prospects
- Isomangiferin promotes the migration and osteogenic differentiation of rat bone marrow mesenchymal stem cells
- Prognostic value and microenvironmental crosstalk of exosome-related signatures in human epidermal growth factor receptor 2 positive breast cancer
- Circular RNAs as potential biomarkers for male severe sepsis
- Knockdown of Stanniocalcin-1 inhibits growth and glycolysis in oral squamous cell carcinoma cells
- The expression and biological role of complement C1s in esophageal squamous cell carcinoma
- A novel GNAS mutation in pseudohypoparathyroidism type 1a with articular flexion deformity: A case report
- Predictive value of serum magnesium levels for prognosis in patients with non-small cell lung cancer undergoing EGFR-TKI therapy
- HSPB1 alleviates acute-on-chronic liver failure via the P53/Bax pathway
- IgG4-related disease complicated by PLA2R-associated membranous nephropathy: A case report
- Baculovirus-mediated endostatin and angiostatin activation of autophagy through the AMPK/AKT/mTOR pathway inhibits angiogenesis in hepatocellular carcinoma
- Metformin mitigates osteoarthritis progression by modulating the PI3K/AKT/mTOR signaling pathway and enhancing chondrocyte autophagy
- Evaluation of the activity of antimicrobial peptides against bacterial vaginosis
- Atypical presentation of γ/δ mycosis fungoides with an unusual phenotype and SOCS1 mutation
- Analysis of the microecological mechanism of diabetic kidney disease based on the theory of “gut–kidney axis”: A systematic review
- Omega-3 fatty acids prevent gestational diabetes mellitus via modulation of lipid metabolism
- Refractory hypertension complicated with Turner syndrome: A case report
- Interaction of ncRNAs and the PI3K/AKT/mTOR pathway: Implications for osteosarcoma
- Association of low attenuation area scores with pulmonary function and clinical prognosis in patients with chronic obstructive pulmonary disease
- Long non-coding RNAs in bone formation: Key regulators and therapeutic prospects
- The deubiquitinating enzyme USP35 regulates the stability of NRF2 protein
- Neutrophil-to-lymphocyte ratio and platelet-to-lymphocyte ratio as potential diagnostic markers for rebleeding in patients with esophagogastric variceal bleeding
- G protein-coupled receptor 1 participating in the mechanism of mediating gestational diabetes mellitus by phosphorylating the AKT pathway
- LL37-mtDNA regulates viability, apoptosis, inflammation, and autophagy in lipopolysaccharide-treated RLE-6TN cells by targeting Hsp90aa1
- The analgesic effect of paeoniflorin: A focused review
- Chemical composition’s effect on Solanum nigrum Linn.’s antioxidant capacity and erythrocyte protection: Bioactive components and molecular docking analysis
- Knockdown of HCK promotes HREC cell viability and inner blood–retinal barrier integrity by regulating the AMPK signaling pathway
- The role of rapamycin in the PINK1/Parkin signaling pathway in mitophagy in podocytes
- Laryngeal non-Hodgkin lymphoma: Report of four cases and review of the literature
- Clinical value of macrogenome next-generation sequencing on infections
- Overview of dendritic cells and related pathways in autoimmune uveitis
- TAK-242 alleviates diabetic cardiomyopathy via inhibiting pyroptosis and TLR4/CaMKII/NLRP3 pathway
- Hypomethylation in promoters of PGC-1α involved in exercise-driven skeletal muscular alterations in old age
- Profile and antimicrobial susceptibility patterns of bacteria isolated from effluents of Kolladiba and Debark hospitals
- The expression and clinical significance of syncytin-1 in serum exosomes of hepatocellular carcinoma patients
- A histomorphometric study to evaluate the therapeutic effects of biosynthesized silver nanoparticles on the kidneys infected with Plasmodium chabaudi
- PGRMC1 and PAQR4 are promising molecular targets for a rare subtype of ovarian cancer
- Analysis of MDA, SOD, TAOC, MNCV, SNCV, and TSS scores in patients with diabetes peripheral neuropathy
- SLIT3 deficiency promotes non-small cell lung cancer progression by modulating UBE2C/WNT signaling
- The relationship between TMCO1 and CALR in the pathological characteristics of prostate cancer and its effect on the metastasis of prostate cancer cells
- Heterogeneous nuclear ribonucleoprotein K is a potential target for enhancing the chemosensitivity of nasopharyngeal carcinoma
- PHB2 alleviates retinal pigment epithelium cell fibrosis by suppressing the AGE–RAGE pathway
- Anti-γ-aminobutyric acid-B receptor autoimmune encephalitis with syncope as the initial symptom: Case report and literature review
- Comparative analysis of chloroplast genome of Lonicera japonica cv. Damaohua
- Human umbilical cord mesenchymal stem cells regulate glutathione metabolism depending on the ERK–Nrf2–HO-1 signal pathway to repair phosphoramide mustard-induced ovarian cancer cells
- Electroacupuncture on GB acupoints improves osteoporosis via the estradiol–PI3K–Akt signaling pathway
- Renalase protects against podocyte injury by inhibiting oxidative stress and apoptosis in diabetic nephropathy
- Review: Dicranostigma leptopodum: A peculiar plant of Papaveraceae
- Combination effect of flavonoids attenuates lung cancer cell proliferation by inhibiting the STAT3 and FAK signaling pathway
- Renal microangiopathy and immune complex glomerulonephritis induced by anti-tumour agents: A case report
- Correlation analysis of AVPR1a and AVPR2 with abnormal water and sodium and potassium metabolism in rats
- Gastrointestinal health anti-diarrheal mixture relieves spleen deficiency-induced diarrhea through regulating gut microbiota
- Myriad factors and pathways influencing tumor radiotherapy resistance
- Exploring the effects of culture conditions on Yapsin (YPS) gene expression in Nakaseomyces glabratus
- Screening of prognostic core genes based on cell–cell interaction in the peripheral blood of patients with sepsis
- Coagulation factor II thrombin receptor as a promising biomarker in breast cancer management
- Ileocecal mucinous carcinoma misdiagnosed as incarcerated hernia: A case report
- Methyltransferase like 13 promotes malignant behaviors of bladder cancer cells through targeting PI3K/ATK signaling pathway
- The debate between electricity and heat, efficacy and safety of irreversible electroporation and radiofrequency ablation in the treatment of liver cancer: A meta-analysis
- ZAG promotes colorectal cancer cell proliferation and epithelial–mesenchymal transition by promoting lipid synthesis
- Baicalein inhibits NLRP3 inflammasome activation and mitigates placental inflammation and oxidative stress in gestational diabetes mellitus
- Impact of SWCNT-conjugated senna leaf extract on breast cancer cells: A potential apoptotic therapeutic strategy
- MFAP5 inhibits the malignant progression of endometrial cancer cells in vitro
- Major ozonated autohemotherapy promoted functional recovery following spinal cord injury in adult rats via the inhibition of oxidative stress and inflammation
- Axodendritic targeting of TAU and MAP2 and microtubule polarization in iPSC-derived versus SH-SY5Y-derived human neurons
- Differential expression of phosphoinositide 3-kinase/protein kinase B and Toll-like receptor/nuclear factor kappa B signaling pathways in experimental obesity Wistar rat model
- The therapeutic potential of targeting Oncostatin M and the interleukin-6 family in retinal diseases: A comprehensive review
- BA inhibits LPS-stimulated inflammatory response and apoptosis in human middle ear epithelial cells by regulating the Nf-Kb/Iκbα axis
- Role of circRMRP and circRPL27 in chronic obstructive pulmonary disease
- Investigating the role of hyperexpressed HCN1 in inducing myocardial infarction through activation of the NF-κB signaling pathway
- Characterization of phenolic compounds and evaluation of anti-diabetic potential in Cannabis sativa L. seeds: In vivo, in vitro, and in silico studies
- Quantitative immunohistochemistry analysis of breast Ki67 based on artificial intelligence
- Ecology and Environmental Science
- Screening of different growth conditions of Bacillus subtilis isolated from membrane-less microbial fuel cell toward antimicrobial activity profiling
- Degradation of a mixture of 13 polycyclic aromatic hydrocarbons by commercial effective microorganisms
- Evaluation of the impact of two citrus plants on the variation of Panonychus citri (Acari: Tetranychidae) and beneficial phytoseiid mites
- Prediction of present and future distribution areas of Juniperus drupacea Labill and determination of ethnobotany properties in Antalya Province, Türkiye
- Population genetics of Todarodes pacificus (Cephalopoda: Ommastrephidae) in the northwest Pacific Ocean via GBS sequencing
- A comparative analysis of dendrometric, macromorphological, and micromorphological characteristics of Pistacia atlantica subsp. atlantica and Pistacia terebinthus in the middle Atlas region of Morocco
- Macrofungal sporocarp community in the lichen Scots pine forests
- Assessing the proximate compositions of indigenous forage species in Yemen’s pastoral rangelands
- Food Science
- Gut microbiota changes associated with low-carbohydrate diet intervention for obesity
- Reexamination of Aspergillus cristatus phylogeny in dark tea: Characteristics of the mitochondrial genome
- Differences in the flavonoid composition of the leaves, fruits, and branches of mulberry are distinguished based on a plant metabolomics approach
- Investigating the impact of wet rendering (solventless method) on PUFA-rich oil from catfish (Clarias magur) viscera
- Non-linear associations between cardiovascular metabolic indices and metabolic-associated fatty liver disease: A cross-sectional study in the US population (2017–2020)
- Knockdown of USP7 alleviates atherosclerosis in ApoE-deficient mice by regulating EZH2 expression
- Utility of dairy microbiome as a tool for authentication and traceability
- Agriculture
- Enhancing faba bean (Vicia faba L.) productivity through establishing the area-specific fertilizer rate recommendation in southwest Ethiopia
- Impact of novel herbicide based on synthetic auxins and ALS inhibitor on weed control
- Perspectives of pteridophytes microbiome for bioremediation in agricultural applications
- Fertilizer application parameters for drip-irrigated peanut based on the fertilizer effect function established from a “3414” field trial
- Improving the productivity and profitability of maize (Zea mays L.) using optimum blended inorganic fertilization
- Application of leaf multispectral analyzer in comparison to hyperspectral device to assess the diversity of spectral reflectance indices in wheat genotypes
- Animal Sciences
- Knockdown of ANP32E inhibits colorectal cancer cell growth and glycolysis by regulating the AKT/mTOR pathway
- Development of a detection chip for major pathogenic drug-resistant genes and drug targets in bovine respiratory system diseases
- Exploration of the genetic influence of MYOT and MB genes on the plumage coloration of Muscovy ducks
- Transcriptome analysis of adipose tissue in grazing cattle: Identifying key regulators of fat metabolism
- Comparison of nutritional value of the wild and cultivated spiny loaches at three growth stages
- Transcriptomic analysis of liver immune response in Chinese spiny frog (Quasipaa spinosa) infected with Proteus mirabilis
- Disruption of BCAA degradation is a critical characteristic of diabetic cardiomyopathy revealed by integrated transcriptome and metabolome analysis
- Plant Sciences
- Effect of long-term in-row branch covering on soil microorganisms in pear orchards
- Photosynthetic physiological characteristics, growth performance, and element concentrations reveal the calcicole–calcifuge behaviors of three Camellia species
- Transcriptome analysis reveals the mechanism of NaHCO3 promoting tobacco leaf maturation
- Bioinformatics, expression analysis, and functional verification of allene oxide synthase gene HvnAOS1 and HvnAOS2 in qingke
- Water, nitrogen, and phosphorus coupling improves gray jujube fruit quality and yield
- Improving grape fruit quality through soil conditioner: Insights from RNA-seq analysis of Cabernet Sauvignon roots
- Role of Embinin in the reabsorption of nucleus pulposus in lumbar disc herniation: Promotion of nucleus pulposus neovascularization and apoptosis of nucleus pulposus cells
- Revealing the effects of amino acid, organic acid, and phytohormones on the germination of tomato seeds under salinity stress
- Combined effects of nitrogen fertilizer and biochar on the growth, yield, and quality of pepper
- Comprehensive phytochemical and toxicological analysis of Chenopodium ambrosioides (L.) fractions
- Impact of “3414” fertilization on the yield and quality of greenhouse tomatoes
- Exploring the coupling mode of water and fertilizer for improving growth, fruit quality, and yield of the pear in the arid region
- Metagenomic analysis of endophytic bacteria in seed potato (Solanum tuberosum)
- Antibacterial, antifungal, and phytochemical properties of Salsola kali ethanolic extract
- Exploring the hepatoprotective properties of citronellol: In vitro and in silico studies on ethanol-induced damage in HepG2 cells
- Enhanced osmotic dehydration of watermelon rind using honey–sucrose solutions: A study on pre-treatment efficacy and mass transfer kinetics
- Effects of exogenous 2,4-epibrassinolide on photosynthetic traits of 53 cowpea varieties under NaCl stress
- Comparative transcriptome analysis of maize (Zea mays L.) seedlings in response to copper stress
- An optimization method for measuring the stomata in cassava (Manihot esculenta Crantz) under multiple abiotic stresses
- Fosinopril inhibits Ang II-induced VSMC proliferation, phenotype transformation, migration, and oxidative stress through the TGF-β1/Smad signaling pathway
- Antioxidant and antimicrobial activities of Salsola imbricata methanolic extract and its phytochemical characterization
- Bioengineering and Biotechnology
- Absorbable calcium and phosphorus bioactive membranes promote bone marrow mesenchymal stem cells osteogenic differentiation for bone regeneration
- New advances in protein engineering for industrial applications: Key takeaways
- An overview of the production and use of Bacillus thuringiensis toxin
- Research progress of nanoparticles in diagnosis and treatment of hepatocellular carcinoma
- Bioelectrochemical biosensors for water quality assessment and wastewater monitoring
- PEI/MMNs@LNA-542 nanoparticles alleviate ICU-acquired weakness through targeted autophagy inhibition and mitochondrial protection
- Unleashing of cytotoxic effects of thymoquinone-bovine serum albumin nanoparticles on A549 lung cancer cells
- Erratum
- Erratum to “Investigating the association between dietary patterns and glycemic control among children and adolescents with T1DM”
- Erratum to “Activation of hypermethylated P2RY1 mitigates gastric cancer by promoting apoptosis and inhibiting proliferation”
- Retraction
- Retraction to “MiR-223-3p regulates cell viability, migration, invasion, and apoptosis of non-small cell lung cancer cells by targeting RHOB”
- Retraction to “A data mining technique for detecting malignant mesothelioma cancer using multiple regression analysis”
- Special Issue on Advances in Neurodegenerative Disease Research and Treatment
- Transplantation of human neural stem cell prevents symptomatic motor behavior disability in a rat model of Parkinson’s disease
- Special Issue on Multi-omics
- Inflammasome complex genes with clinical relevance suggest potential as therapeutic targets for anti-tumor drugs in clear cell renal cell carcinoma
- Gastroesophageal varices in primary biliary cholangitis with anti-centromere antibody positivity: Early onset?