Virtualizing clinical cases of atrial flutter in a fast marching simulation including conduction velocity and ablation scars
-
 ,
,

Abstract
Diagnosis of atrial flutter caused by ablation of atrial fibrillation is complex due to ablation scars. This paper presents an approach to replicate the clinically measured flutter circuit in a dynamic computer model. In a first step, important anatomical features of the flutter circuit are extracted manually based on the clinical measurement. With the help of this information, the electrical excitation propagation is simulated on the atrial geometry using the fast marching method. The simulated flutter circuit is used to estimate the global and local conduction velocity by approximating it iteratively. The parameterized flutter simulation is supposed to support the physician during diagnosis and treatment of atrial flutter.
1 Introduction
Catheter-based radio-frequency ablation is a promising method to treat atrial fibrillation (AFib), but leads to atrial flutter (AFlut) in 4.7–31 % of all cases [1]. Diagnosis of AFlut caused by AFib ablation, however, is particularly difficult, due to substrate modification of the myocardium. Since signals can have very low amplitudes in areas of slow conduction, common methods to diagnose AFlut such as P wave evaluation are not usable.
Therefore, this paper presents an approach to replicate the clinically measured flutter circuit in a computer model using a reentry variant of the fast marching (FaMa) method. The simulation considers ablation scars and is used to estimate the global and local conduction velocity (CV) to reproduce the flutter circuit [2]. The dynamic flutter simulation will support the physician during diagnosis of and treatment planning for AFlut, for example by giving information about the effect of ablation lines on the flutter circuit.
2 Material and methods
2.1 Clinical data
Clinical data from two patients were acquired using the 3D electroanatomical mapping system Velocity (St. Jude Medical). Both patients provided informed consent. Patient A (male, aged 54) was mapped using a 10-pole single-loop catheter during AFlut characterized by a basic cycle length (BCL) of 253 ms, a macro reentry around the pulmonary veins (PVs) and an isthmus in the roof line. Patient B (male, aged 56) was mapped with a 20-pole double-loop catheter during counterclockwise peri-mitral flutter with a BCL of 267 ms. Both tachycardias were stable during mapping. The measured local activation time (LAT) maps were exported containing one second of data for each collected intracardiac electrogram (EGM) at a sampling rate of 2034.5 Hz.
2.2 Fast marching simulation
Electrophysiological models are used to simulate the electrical excitation of the heart and can be divided in Eikonal models and biophysical cellular models coupled with excitation propagation. The FaMa method is an Eikonal model simulating the excitation wave on the cardiac surface by calculating the activation time of each surface node. Thereby, the wave propagation is approximated with the Eikonal equation. In contrast to biophysical cellular models, Eikonal models do not consider ion transport through the membrane. Accordingly, Eikonal models have fast computing times and are consequently easier to use under clinical time constraints.
This work is based on a C++ implementation of the FaMa simulation (FaMaS) [3].
2.3 Manual feature detection
Anatomical features of the flutter circuit were detected manually on the basis of an excitation movie and an LAT map. As an example, the manual feature detection of the clinical flutter circuit of Patient A was as follows: The LAT map (see Figure 1a) indicates that the excitation wave came from the anterior wall, narrowed and extended to the posterior wall after passing through an isthmus (green circle) on the roof (LAT: 0 ms). An energy-based excitation movie showed that the PVs were not or only partially excited. Since the LATs on the antero-septal side of the LA (see Figure 1b) were smaller than the LATs on the lateral side, the excitation wave obviously conducted a U-turn on the anterior wall.
As the flutter circuit is a reentry mechanism, the start of excitation was defined in the isthmus where least tissue was excited. In contrast to the real clinical case, the simulated flutter circuit had to be started once which required an initial refractory time for the tissue ‘behind’ the excitation wave.
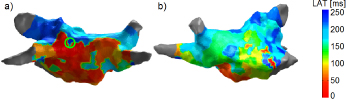
LAT map of the left atrium (LA) of Patient A in posteroanterior (PA) (a) and right anterior oblique (RAO) (b) view.
Scars and initial refractory lines were defined on the LA geometry using specific points of the respective line and a MATLAB implementation of the Dijkstra algorithm. The surface geometry, trimesh structure and state information (scar, start of excitation, initial refractory, normal) were written to a Visualization Toolkit (VTK) file for processing with FaMaS.
2.4 Estimation of the conduction velocity
2.4.1 Global conduction velocity
FaMaS was used to estimate the global CV by approximating it iteratively using the clinically measured BCL as a reference.
The first step was to run the simulation with any guessed global CV for four cycles to reduce the effect of initial refractory times. The difference between the calculated LAT of the fourth and third cycle (for each activated nodei ) served as simulated BCL:
with N being the number of activated nodes of the mesh. If the deviation between calculated BCLFaMaS and clinically measured cycle length BCLclinical was below a threshold for acceptance (here: 1 ms), the estimation of the global CV was finished. Otherwise, the CV for the next iterationk was approximated as follows:
2.4.2 Local conduction velocity
Since the myocardium is not homogeneous due to ablation scars and slow conduction areas, the local CV was estimated in a next step. The CV was approximated iteratively by comparing the calculated time stamp to the clinically measured LAT for each node where an electrode was present (‘electrode node’).
A ‘zone’ contained the electrode nodes which were considered in the current iterationk. In case of CV adaption, the zone was divided in two ‘subzones’. If the CV of both sub-zones of the current iteration was estimated, the zone of the previous iteration (‘superzone’) was examined.
First, the global CV was estimated as described above, and all electrode nodes were ordered according to their clinical LAT. Besides, the surface was subdivided in Voronoi cells (‘electrode areas’) according to the electrodes such that each node of the surface belonged to its closest electrode.
The LAT was computed for each electrode node of the current zone using the estimated global CV. If the deviation between calculated and clinically measured LAT for an electrode node was greater than a threshold for acceptance, the CV of this electrode area was adapted as follows:
In this work, the local estimation was evaluated for two thresholds for acceptance (1 ms and 5 ms). To achieve stability, the CV was limited by a lower and upper threshold, and by an upper threshold for the difference between CVs in adjacent electrode areas. The parameters were varied according to Table 1. For the next iteration, the current zone including the electrode nodes was divided in two subzones. The procedure started at the beginning regarding the first subzone.
Variation of the threshold parameters.
| Threshold parameter | S1 | S2 | S3 | |
|---|---|---|---|---|
| Minimal CV | 10 | 50 | 100 | |
| Minimal CV | 1000 | 1500 | 2000 | |
| Minimal CV difference | 200 | 500 | 800 |
If the deviation between calculated and clinically measured LAT was smaller than the threshold for all electrode nodes of the current subzone, the approximation of the CV for the second subzone followed.
If the approximation of the CV was finished for both sub-zones, the next superzone was examined.
After the CV of the last zone was adapted, the estimation of the local CV was finished and a second global adjustment followed:
The procedure was evaluated with the help of simulated test cases. Several combinations of material classes with different CVs were defined on a spherical geometry ( 10 cm, surface mesh: 1517 nodes). 114 nodes served as electrode nodes and their time stamps as clinical LATs.
For processing with clinical data, the LAT maps were interpolated using Laplacian minimization.
3 Results
3.1 Manual feature detection
During the manual feature detection, a scar was placed along the roof line and around the PVs (see Figure 2a) for Patient A. In order to realize the U-turn, a further scar was placed on the anterior wall since otherwise the excitation would propagate directly and straightforward along the mitral valve in an area of homogeneous tissue (see Figure 2b). In order to assign the propagation direction, the start of excitation defined in the isthmus on the roof, was surrounded by an area of initial refractory nodes and by scars (see Figure 2a).

LA of Patient A in PA (a) and RAO (b) view. Color codes the state of the nodes.
3.2 Estimation of the conduction velocity
3.2.1 Global conduction velocity
In the test cases with known CV (varying in the range of typical atrial CVs
After estimating the global CV for clinical cases, the calculated BCL deviated less than 1 ms from the clinical BCL (0.39 % for Patient A, 0.37 % for Patient B related to the BCL). The approximation of the global CV was already finished after one iteration and the computation time was shorter than 1 s.
3.2.2 Local conduction velocity
For the simulated test cases with spherical geometry, the CV of the majority of the surface was approximated with a deviation of less than
Table 2 presents the results of the calculation time and the deviation between calculated and measured LAT for the clinical cases. Concerning the latter, the average and median deviation between the LAT of all electrodes were calculated after the final global adjustment.
Local estimation results for the parameter combination which resulted in smallest deviation (A: error per electrode: 1 ms, B: error per electrode: 5 ms, max. CV:
| Patient | Calc. time | Average deviation | Median deviation |
|---|---|---|---|
| A | 6.8–8 s | 45 ms (0.18 % BCL) | 48 ms (0.19 % BCL) |
| B | 17–20 s | 25 ms (0.09 % BCL) | 18 ms (0.07 % BCL) |
A further quality criterion was the resulting BCL after the final global adjustment which agreed with the clinically measured one for both patients. Figure 3 shows the estimated local CVs on the LA geometry.
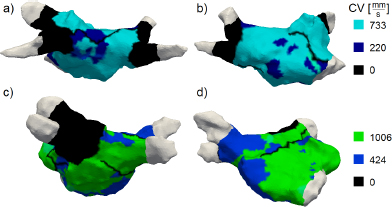
LA including estimated local CVs for Patient A (a, b) and Patient B (c, d) in PA (a, c) and RAO (b, d) view.
4 Discussion
4.1 Estimation of the conduction velocity
4.1.1 Global conduction velocity
Test cases with known CV proved that the global CV can be estimated accurately (deviation < 2 %).
Concerning clinical cases, the final BCL deviated less than 1 ms from the clinical BCL which equated to nearly 0.4 % for both patients. For typical BCLs of AFlut (200– 350 ms [4, 5]) the deviation was less than 0.5 %. Therefore, the deviation was tolerable for both example patients and other typical cases of AFlut. The calculation time (< 1 s) was suitable for clinical use.
4.1.2 Local conduction velocity
The estimation of the local CV delivered good results for all simulated test cases. Despite wrongly estimated CVs on a boundary, the estimated local CV can be used to detect slow conduction areas, which was the main purpose.
Concerning clinical cases, single LATs after local estimation deviated significantly from the clinical measurement (Patient A: ~20 % of BCL, Patient B: ~8 % of BCL). Overall, the local estimation replicated the excitation propagation adequately, which can be seen by comparing the clinical excitation movie to the visualized FaMaS at which distinctive propagation features, for instance U-turn and wave front collision, were well replicated. The calculation time (< 20 s) was suitable for clinical use. In the course of estimating the local CV, the clinical LAT map was interpolated due to outlier LATs which may result from fractionated EGMs or from moving the catheter during the recording period.
4.2 Conclusion
The simulated flutter circuit provided information about the excitation propagation subject to manually defined anatomical features. The average CV of the flutter circuit can be well described by estimating the global CV. Concerning the local estimation, the clinical measurement was not reproduced exactly as the resulting LATs showed. Possible reasons were the interpolation of the LAT map and limitation of the CV. A larger number of signals with higher quality is supposed to provide better results. Overall, the estimated local CVs approximated the propagation on the atrial surface. Since FaMaS was able to simulate clinical cases of AFlut and to consider predefined scars, the effect of arbitrarily chosen and manually annotated scars on the excitation propagation can be evaluated. In order to support the physician during diagnosis of and treatment planning for AFlut, the next step is an automatized detection of electrophysiological features such as scars, e.g. with the help of EGM signal analysis.
Author’s Statement
Conflict of interest: Authors state no conflict of interest. Material and Methods: Informed consent: Informed consent has been obtained from all individuals included in this study. Ethical approval: The research related to human use has been complied with all the relevant national regulations, institutional policies and in accordance the tenets of the Helsinki Declaration, and has been approved by the authors’ institutional review board or equivalent committee.
References
[1] Castrejón-Castrejón S, Ortega M, Pérez-Silva A, et al. Organized atrial tachycardias after atrial fibrillation ablation. Cardiology Research and Practice 2011; 1–1610.4061/2011/957538Search in Google Scholar PubMed PubMed Central
[2] Chinchapatnam P, Rhode KS, Ginks M, et al. Model-based imaging of cardiac apparent conductivity and local conduction velocity for diagnosis and planning of therapy. IEEE Transactions on Medical Imaging 2008; 27: 1631–164210.1109/TMI.2008.2004644Search in Google Scholar PubMed
[3] E Poremba. Implementation of a fast simulation C++ framework for the computation of vulnerability to artial arrhythmias using the fast marching algorithm. Institute of Biomedical Engineering, Karlsruhe Institute of Technology (KIT), 2013Search in Google Scholar
[4] Itoh T, Kimura M, Sasaki S, et al. High correlation of estimated local conduction velocity with natural logarithm of bipolar electrogram amplitude in the reentry circuit of atrial flutter. Journal of Cardiovascular Electrophysiology 2013; 1–810.1111/jce.12329Search in Google Scholar PubMed
[5] Jaïs P, Matsuo S, Knecht S, et al. A deductive mapping strategy for atrial tachycardia following atrial fibrillation ablation: importance of localized reentry. Journal of Cardiovascular Electrophysiology 2009; 20: 480–49110.1111/j.1540-8167.2008.01373.xSearch in Google Scholar PubMed
© 2015 by Walter de Gruyter GmbH, Berlin/Boston
This article is distributed under the terms of the Creative Commons Attribution Non-Commercial License, which permits unrestricted non-commercial use, distribution, and reproduction in any medium, provided the original work is properly cited.
Articles in the same Issue
- Research Article
- Development and characterization of superparamagnetic coatings
- Research Article
- The development of an experimental setup to measure acousto-electric interaction signal
- Research Article
- Stability analysis of ferrofluids
- Research Article
- Investigation of endothelial growth using a sensors-integrated microfluidic system to simulate physiological barriers
- Research Article
- Energy harvesting for active implants: powering a ruminal pH-monitoring system
- Research Article
- New type of fluxgate magnetometer for the heart’s magnetic fields detection
- Research Article
- Field mapping of ballistic pressure pulse sources
- Research Article
- Development of a new homecare sleep monitor using body sounds and motion tracking
- Research Article
- Noise properties of textile, capacitive EEG electrodes
- Research Article
- Detecting phase singularities and rotor center trajectories based on the Hilbert transform of intraatrial electrograms in an atrial voxel model
- Research Article
- Spike sorting: the overlapping spikes challenge
- Research Article
- Separating the effect of respiration from the heart rate variability for cases of constant harmonic breathing
- Research Article
- Locating regions of arrhythmogenic substrate by analyzing the duration of triggered atrial activities
- Research Article
- Combining different ECG derived respiration tracking methods to create an optimal reconstruction of the breathing pattern
- Research Article
- Atrial and ventricular signal averaging electrocardiography in pacemaker and cardiac resynchronization therapy
- Research Article
- Estimation of a respiratory signal from a single-lead ECG using the 4th order central moments
- Research Article
- Compressed sensing of multi-lead ECG signals by compressive multiplexing
- Research Article
- Heart rate monitoring in ultra-high-field MRI using frequency information obtained from video signals of the human skin compared to electrocardiography and pulse oximetry
- Research Article
- Synchronization in wireless biomedical-sensor networks with Bluetooth Low Energy
- Research Article
- Automated classification of stages of anaesthesia by populations of evolutionary optimized fuzzy rules
- Research Article
- Effects of sampling rate on automated fatigue recognition in surface EMG signals
- Research Article
- Closed-loop transcranial alternating current stimulation of slow oscillations
- Research Article
- Cardiac index in atrio- and interventricular delay optimized cardiac resynchronization therapy and cardiac contractility modulation
- Research Article
- The role of expert evaluation for microsleep detection
- Research Article
- The impact of baseline wander removal techniques on the ST segment in simulated ischemic 12-lead ECGs
- Research Article
- Metal artifact reduction by projection replacements and non-local prior image integration
- Research Article
- A novel coaxial nozzle for in-process adjustment of electrospun scaffolds’ fiber diameter
- Research Article
- Processing of membranes for oxygenation using the Bellhouse-effect
- Research Article
- Inkjet printing of viable human dental follicle stem cells
- Research Article
- The use of an icebindingprotein out of the snowflea Hypogastrura harveyi as a cryoprotectant in the cryopreservation of mesenchymal stem cells
- Research Article
- New NIR spectroscopy based method to determine ischemia in vivo in liver – a first study on rats
- Research Article
- QRS and QT ventricular conduction times and permanent pacemaker therapy after transcatheter aortic valve implantation
- Research Article
- Adopting oculopressure tonometry as a transient in vivo rabbit glaucoma model
- Research Article
- Next-generation vision testing: the quick CSF
- Research Article
- Improving tactile sensation in laparoscopic surgery by overcoming size restrictions
- Research Article
- Design and control of a 3-DOF hydraulic driven surgical instrument
- Research Article
- Evaluation of endourological tools to improve the diagnosis and therapy of ureteral tumors – from model development to clinical application
- Research Article
- Frequency based assessment of surgical activities
- Research Article
- “Hands free for intervention”, a new approach for transoral endoscopic surgery
- Research Article
- Pseudo-haptic feedback in medical teleoperation
- Research Article
- Feasibility of interactive gesture control of a robotic microscope
- Research Article
- Towards structuring contextual information for workflow-driven surgical assistance functionalities
- Research Article
- Towards a framework for standardized semantic workflow modeling and management in the surgical domain
- Research Article
- Closed-loop approach for situation awareness of medical devices and operating room infrastructure
- Research Article
- Kinect based physiotherapy system for home use
- Research Article
- Evaluating the microsoft kinect skeleton joint tracking as a tool for home-based physiotherapy
- Research Article
- Integrating multimodal information for intraoperative assistance in neurosurgery
- Research Article
- Respiratory motion tracking using Microsoft’s Kinect v2 camera
- Research Article
- Using smart glasses for ultrasound diagnostics
- Research Article
- Measurement of needle susceptibility artifacts in magnetic resonance images
- Research Article
- Dimensionality reduction of medical image descriptors for multimodal image registration
- Research Article
- Experimental evaluation of different weighting schemes in magnetic particle imaging reconstruction
- Research Article
- Evaluation of CT capability for the detection of thin bone structures
- Research Article
- Towards contactless optical coherence elastography with acoustic tissue excitation
- Research Article
- Development and implementation of algorithms for automatic and robust measurement of the 2D:4D digit ratio using image data
- Research Article
- Automated high-throughput analysis of B cell spreading on immobilized antibodies with whole slide imaging
- Research Article
- Tissue segmentation from head MRI: a ground truth validation for feature-enhanced tracking
- Research Article
- Video tracking of swimming rodents on a reflective water surface
- Research Article
- MR imaging of model drug distribution in simulated vitreous
- Research Article
- Studying the extracellular contribution to the double wave vector diffusion-weighted signal
- Research Article
- Artifacts in field free line magnetic particle imaging in the presence of inhomogeneous and nonlinear magnetic fields
- Research Article
- Introducing a frequency-tunable magnetic particle spectrometer
- Research Article
- Imaging of aortic valve dynamics in 4D OCT
- Research Article
- Intravascular optical coherence tomography (OCT) as an additional tool for the assessment of stent structures
- Research Article
- Simple concept for a wide-field lensless digital holographic microscope using a laser diode
- Research Article
- Intraoperative identification of somato-sensory brain areas using optical imaging and standard RGB camera equipment – a feasibility study
- Research Article
- Respiratory surface motion measurement by Microsoft Kinect
- Research Article
- Improving image quality in EIT imaging by measurement of thorax excursion
- Research Article
- A clustering based dual model framework for EIT imaging: first experimental results
- Research Article
- Three-dimensional anisotropic regularization for limited angle tomography
- Research Article
- GPU-based real-time generation of large ultrasound volumes from freehand 3D sweeps
- Research Article
- Experimental computer tomograph
- Research Article
- US-tracked steered FUS in a respiratory ex vivo ovine liver phantom
- Research Article
- Contribution of brownian rotation and particle assembly polarisation to the particle response in magnetic particle spectrometry
- Research Article
- Preliminary investigations of magnetic modulated nanoparticles for microwave breast cancer detection
- Research Article
- Construction of a device for magnetic separation of superparamagnetic iron oxide nanoparticles
- Research Article
- An IHE-conform telecooperation platform supporting the treatment of dementia patients
- Research Article
- Automated respiratory therapy system based on the ARDSNet protocol with systemic perfusion control
- Research Article
- Identification of surgical instruments using UHF-RFID technology
- Research Article
- A generic concept for the development of model-guided clinical decision support systems
- Research Article
- Evaluation of local alterations in femoral bone mineral density measured via quantitative CT
- Research Article
- Creating 3D gelatin phantoms for experimental evaluation in biomedicine
- Research Article
- Influence of short-term fixation with mixed formalin or ethanol solution on the mechanical properties of human cortical bone
- Research Article
- Analysis of the release kinetics of surface-bound proteins via laser-induced fluorescence
- Research Article
- Tomographic particle image velocimetry of a water-jet for low volume harvesting of fat tissue for regenerative medicine
- Research Article
- Wireless medical sensors – context, robustness and safety
- Research Article
- Sequences for real-time magnetic particle imaging
- Research Article
- Speckle-based off-axis holographic detection for non-contact photoacoustic tomography
- Research Article
- A machine learning approach for planning valve-sparing aortic root reconstruction
- Research Article
- An in-ear pulse wave velocity measurement system using heart sounds as time reference
- Research Article
- Measuring different oxygenation levels in a blood perfusion model simulating the human head using NIRS
- Research Article
- Multisegmental fusion of the lumbar spine a curse or a blessing?
- Research Article
- Numerical analysis of the biomechanical complications accompanying the total hip replacement with NANOS-Prosthetic: bone remodelling and prosthesis migration
- Research Article
- A muscle model for hybrid muscle activation
- Research Article
- Mathematical, numerical and in-vitro investigation of cooling performance of an intra-carotid catheter for selective brain hypothermia
- Research Article
- An ideally parameterized unscented Kalman filter for the inverse problem of electrocardiography
- Research Article
- Interactive visualization of cardiac anatomy and atrial excitation for medical diagnosis and research
- Research Article
- Virtualizing clinical cases of atrial flutter in a fast marching simulation including conduction velocity and ablation scars
- Research Article
- Mesh structure-independent modeling of patient-specific atrial fiber orientation
- Research Article
- Accelerating mono-domain cardiac electrophysiology simulations using OpenCL
- Research Article
- Understanding the cellular mode of action of vernakalant using a computational model: answers and new questions
- Research Article
- A java based simulator with user interface to simulate ventilated patients
- Research Article
- Evaluation of an algorithm to choose between competing models of respiratory mechanics
- Research Article
- Numerical simulation of low-pulsation gerotor pumps for use in the pharmaceutical industry and in biomedicine
- Research Article
- Numerical and experimental flow analysis in centifluidic systems for rapid allergy screening tests
- Research Article
- Biomechanical parameter determination of scaffold-free cartilage constructs (SFCCs) with the hyperelastic material models Yeoh, Ogden and Demiray
- Research Article
- FPGA controlled artificial vascular system
- Research Article
- Simulation based investigation of source-detector configurations for non-invasive fetal pulse oximetry
- Research Article
- Test setup for characterizing the efficacy of embolic protection devices
- Research Article
- Impact of electrode geometry on force generation during functional electrical stimulation
- Research Article
- 3D-based visual physical activity assessment of children
- Research Article
- Realtime assessment of foot orientation by Accelerometers and Gyroscopes
- Research Article
- Image based reconstruction for cystoscopy
- Research Article
- Image guided surgery innovation with graduate students - a new lecture format
- Research Article
- Multichannel FES parameterization for controlling foot motion in paretic gait
- Research Article
- Smartphone supported upper limb prosthesis
- Research Article
- Use of quantitative tremor evaluation to enhance target selection during deep brain stimulation surgery for essential tremor
- Research Article
- Evaluation of adhesion promoters for Parylene C on gold metallization
- Research Article
- The influence of metallic ions from CoCr28Mo6 on the osteogenic differentiation and cytokine release of human osteoblasts
- Research Article
- Increasing the visibility of thin NITINOL vascular implants
- Research Article
- Possible reasons for early artificial bone failure in biomechanical tests of ankle arthrodesis systems
- Research Article
- Development of a bending test procedure for the characterization of flexible ECoG electrode arrays
- Research Article
- Tubular manipulators: a new concept for intracochlear positioning of an auditory prosthesis
- Research Article
- Investigation of the dynamic diameter deformation of vascular stents during fatigue testing with radial loading
- Research Article
- Electrospun vascular grafts with anti-kinking properties
- Research Article
- Integration of temperature sensors in polyimide-based thin-film electrode arrays
- Research Article
- Use cases and usability challenges for head-mounted displays in healthcare
- Research Article
- Device- and service profiles for integrated or systems based on open standards
- Research Article
- Risk management for medical devices in research projects
- Research Article
- Simulation of varying femoral attachment sites of medial patellofemoral ligament using a musculoskeletal multi-body model
- Research Article
- Does enhancing consciousness for strategic planning processes support the effectiveness of problem-based learning concepts in biomedical education?
- Research Article
- SPIO processing in macrophages for MPI: The breast cancer MPI-SNLB-concept
- Research Article
- Numerical simulations of airflow in the human pharynx of OSAHS patients