Investigative properties of CeO2 doped with niobium: A combined characterization and DFT studies
-
Toyin Shittu


Abstract
Catalytic capacity of ceria mainly stems from a facile switch in the Ce oxidation states from +4 to +4 − x. While various experimental and computational studies pinpoint the reduction chemistry of Ce atom through the creation of oxygen vacancies, the analogous process when ceria surface is decorated with cations remains poorly understood. Where such results are available, a synergy between experimental and first principle calculation is scarce. Niobium materials are evolving and their use in catalysis is being widely investigated due to their high surface acidity and thermal and chemical stability. This study aims to report structural and electronic properties of various configurations of mixed Ce–Nb oxides and elaborates on factors that underpin potential catalytic improvements. Evaluations of the samples through X-ray diffraction (XRD), Fourier transform infrared (FTIR), N2-adsorption–desorption, scanning electron microscope (SEM), energy dispersive spectroscope (EDS), and thermogravimetric (TGA) analyses are examined and discussed. First principles density functional theory (DFT) calculations provide structural features of the Ce–Nb solutions at low concentration of Nb via computing atomic charge distribution. Contraction in the lattice parameter after Nb doping was confirmed with both XRD and DFT results. SEM analysis reveals particle growth at the loading of 50 wt%. FTIR results established the Ce–Nb–O bond at 1,100 cm−1 and the TGA analysis confirms the thermal stability of Nb-doped ceria. Tetrahedral O atoms demonstrate an increase in electronegativity and this in turn facilitates catalytic propensity of the material because the O atoms will exhibit higher affinity for adsorbed reactants. Cerium oxide (CeO2) after Nb doping displays a noticeable band gap narrowing, confirming the possible improvement in the catalytic behavior. The 4d states of the Niobium pentoxide (Nb2O5) is found to fill up the 4f states of CeO2 around the Fermi energy level promoting electrons excitation in the CeO2. Reported electronic, structural, and thermal characteristics herein indicate promising catalytic applications of niobium-promoted ceria.
1 Introduction
Doped or pure metal oxides have been widely deployed to improve the catalytic activity and selectivity of both oxidation and reduction reactions through substitution of the cation of the base metal oxide with the cation of a second metal oxide [1]. Niobium pentoxide (Nb2O5) exhibits amorphous or crystalline structures, and possesses wide band gap, good chemical stability, efficient electron injection efficiency, and efficiently serves as acid catalyst for the production of a wide array of chemicals and fuels [2,3]. Defected Nb2O5 synthesized either through incorporation of ad-atoms or oxygen exhibits promising catalytic capacity in niche industrial operations [4,5]. The promotional effect of Nb2O5 as a second metal or metal oxide in operations such as catalysis is gaining attention due to the relative ease of their reaction with other metal oxides to form mixed metal oxide phases with a complex structure [6]. This complex structure could result from the distortion of niobium oxide deposited on the parent metal or originated from the actual disruption of the chemical bonds at the surface of the parent oxide [1,7]. In either case, electron transfer occurs, and the active centers are the dopants or the oxygen atoms close to the dopants, leading to a material behavior that departs from the pure metal oxides [1]. The synthesis of a truly homogenous-mixed oxide with a profound improvement in catalytic activity is a channeling endeavor. The presence of other materials such as impurities in the precursors might as well contribute to the observed changes in their performance [1].
On the other hand, cerium oxide (CeO2) enjoys various applications due to the inherent electrical, chemical, and physical properties [8]. Stand-alone CeO2 has been effective in numerous catalytic applications, most prominently in the semi-hydrogenation of alkynes to alkenes [9], and water and gas splitting reactions [10]. Due to their profound redox properties, efficient oxygen storage ability, and low cost, CeO2 has been deployed as mixed oxide catalyst for enhanced performance [11]. Among the various metal oxides, CeO2 offers high interaction with Nb2O5 [7]. As a reducible oxide, CeO2 could switch oxidation from Ce4+ to a reduced form as Ce4−x by interaction with the Nb5+ of the niobium oxide [12]. This phenomenon induces a notable effect on the chemistry of the mixed oxide formed. The selective catalytic reduction (SCR) performance of CeO2 displays significant improvement when doped with niobium oxide owing to the strong acidity and redox ability of the latter [12]. A 100% selectivity to N2 was achieved for NO x reduction in NH3-SCR reaction when cerium was doped with niobium [13,14,15].
To provide an atomic base insight into the observed catalytic improvement of mixed Ce–Nb oxides, it is essential to comprehend governing structural and electronic attributes of these configurations. For instance, doping metal oxides that display dissimilar cation–oxygen bond lengths affects their catalytic behavior; however, a robust evaluation of such scenario necessitates materials modeling via density functional theory (DFT) calculations [1]. Experimentally, the various available spectroscopy techniques could be used to underpin structural changes from the pure metal oxides after doping. Literature provides a detailed account on pure oxide forms of CeO2 and Nb2O5 [16]. However, to the best of our knowledge, studies that report properties of the mixed Ce–Nb oxides from both experimental and DFT studies are rather scarce.
Thus, this article aims to evaluate the energetic, atomic, and electronic features of clean, defect-free, and doped CeO2(111) and Nb2O5(111) structures using DFT and to confirm the formation of the mixed oxides using material characterization techniques. The main motivation behind this work is to illustrate attributes that may improve the catalytic activity of Nb–Ce–O materials.
2 Materials and methods
2.1 Materials preparation
Cerium–niobium mixed oxide samples were prepared with the incipient wet-impregnation method. The cerium(iv) oxide (Sigma Aldrich; 99.99%) was first dried in an oven for 2 h at 200°C to drive out moisture. Nb2O5 (Sigma Aldrich; 99.99%) serves as the precursor with the loading of Nb2O5 varied from 1.5, 2.5, 3.0, and 50 wt%. Aqueous solution of the samples was added to an identified mass of CeO2. The resulting mixtures were heated at 70°C for 30 min on a magnetic stirrer at a stirring rate of 150 rpm. The samples were then dried overnight at 100°C. Calcination was carried out under the flow of air for 4 h at 550°C with a heating rate of 10°C/min. Powder X-ray diffraction (XRD) patterns were recorded on X-ray diffractometer (PANalytical Instrument, X’Pert3 Powder, Philips, Holland) equipped with CuK radiation (k = 1.540598 nm) and operated at 45 mV and 40 mA. The scanning was performed within 2θ range of 10–80° with a step size of 0.02°/min. A Quantachrome Instrument (NOVAtouch NT 2LX-1, USA) performed the N2 adsorption and desorption experiment. All the catalyst samples were outgassed at 300°C for 3 h utilizing liquid nitrogen (N2) at the temperature of −196°C. The Brunauer–Emmett–Teller (BET) surface areas were computed by employing partial pressure (P/P 0) in the ranges of 0.02–0.35, which are reliable based on the obtained C constant values [17]. The Barrett–Joyner–Halenda (BJH) was used to determine the average pore size and the pore size distribution with P/P 0 range of the desorption branches of 0.80–0.35. The Fourier Transform Infrared (FTIR) analysis was performed with FTIR Spectrometer (Jasco Corporation, Japan). Before analysis, the catalyst samples were mixed with potassium bromide (KBr; Sigma Aldrich) initially dried in the oven at 105°C in order to eliminate possible water interference. The recorded spectra were varied in the range of 4,000–400 cm−1. A multifunctional general-purpose scanning electron microscope (SEM) by (JEOL JSM. 6010 PLUS/LA) integrated with Energy Dispersive Spectroscope (EDS) was used to perform surface and elemental analyses. The instrument is equipped with an auto-coater which enables the sample to be coated with gold particles before analysis. In order to investigate the thermal stability and the composition of the pure and prepared samples, Thermogravimetric analysis (TGA) was carried out with (TGA Q50 V20.10 Build 36 analyzer). The temperature was changed from 0 to 650°C at a heating rate of 10°C/min under the flow of nitrogen.
2.2 Computational details
The CASTEP code performs all the structural optimizations and energy estimations [18] within the DFT framework to examine the properties of CeO2 and Nb2O5. Generalized gradient approximation is employed to obtain precise structural parameters and the exchange–correlation function of Perdew–Burke–Ernzerhof is adopted in the local density approximation. On the fly pseudopotential describes the interaction between the valence electron and the ion core. The energy of the convergence tolerance is set at 0.001 eV/atom. The maximum force, maximum stress, and maximum displacement are set at 0.03 eV/Å, 0.05 GPa, and 0.001 Å, respectively. To describe the on-site Coulomb interactions for the Nb 4d and Ce 4f states, effective Hubbard U parameters of 3.0 and 4.5 eV are employed, respectively. This choice of U value follows from previous theoretical investigations [19,20]. The plane wave cutoff energy amounts to 320 eV and a κ-point sampling of 2 × 2 × 1 was generated by the Monkhorst–Pack scheme. The doping is performed by substituting the Ce atom of the CeO2 with Nb, and the electronic changes are examined. Appropriate choice of dopant concentration is essential to preserve the catalytic activity of the materials. Low concentration of dopant is preferred over the high value because the recombination rate of electron/hole pair is decreased and the reaction rate such as photodegradation is improved [21]. Thus, computations are performed by replacing the Ce atom with one Nb atom.
3 Results and discussion
3.1 XRD patterns
The diffraction patterns observed for the referenced pure CeO2 and all the prepared catalysts are shown in Figure 1. Conventionally, doped oxide displays a similar structure as that of the host oxide [1]. The patterns observed are typical of the pure fluorite cubic CeO2 structure (JCPDS 43-1002) [22]. All except one (50 wt% loading) of the XRD results show an absence of the peaks associated with Nb-containing species. This might be due to either low loading or high dispersion. In our experiment, the Nb loading exceeded the optimum solubility weight of Nb (1.4 wt%) on CeO2, appropriately, the absence of Nb peaks is ascribed to a high dispersion [23]. The dispersed state of Nb2O5 phase on the CeO2 is in the NbO x form and the presence as metallic Nb cannot be excluded. This signifies that the crystallinity of the CeO2 is not distorted with Nb incorporation [1,22,24,25]. However, at a 50.0 wt% Nb loading, the effect of loading is observable with the formation of two new peaks from Nb2O5 around 22° and 50°.

XRD patterns of the prepared catalyst samples.
The lattice parameters were computed from the XRD peaks in order to investigate the doping effect. The inter-planar spacing was evaluated with the Bragg’s law, equation (1), and the lattice parameter was calculated with equation (2). The crystallite sizes of the samples were computed with the Scherrer’s equation (equation (3)) by utilizing the full width at half maximum (FWHM).
where d signifies the inter-planar spacing, λ is the wavelength, a is the lattice parameter, h, k, and l denote the miller indices, β is the FWHM, k is the Scherrer constant, D represents the crystallite size, and θ stands for the Bragg or diffraction angle. The equations were applied to the peak highest intensity, CeO2(111) plane. The results obtained are shown in Tables 1–3. The pure CeO2 gave the highest value of the lattice parameter 5.410 Å which is in good agreement with previous experimental values of 5.410 Å [26,27] and computed values of 5.490 Å [28].
Miller indices of the XRD peaks
| N | 2θ | Θ | sin θ | sin2 θ | Ratio | Index | D |
|---|---|---|---|---|---|---|---|
| 1 | 28.54 | 14.270 | 0.2465 | 0.0607 | 3 | 111 | 3.12384 |
| 2 | 33.11 | 16.555 | 0.2849 | 0.0812 | 4 | 200 | 2.70270 |
| 3 | 47.55 | 23.775 | 0.4031 | 0.1625 | 8 | 220 | 1.91020 |
| 4 | 56.37 | 28.185 | 0.4723 | 0.2231 | 11 | 311 | 1.63032 |
| 5 | 59.16 | 29.580 | 0.4936 | 0.2437 | 12 | 222 | 1.55997 |
| 6 | 69.53 | 34.765 | 0.5702 | 0.3251 | 16 | 400 | 1.35040 |
| 7 | 76.73 | 38.365 | 0.6207 | 0.3852 | 19 | 331 | 1.24053 |
| 8 | 79.17 | 39.585 | 0.6372 | 0.4061 | 20 | 420 | 1.20841 |
Inter-plane spacing and lattice parameters of the prepared samples
| Sample | 2θ | Θ | D | A |
|---|---|---|---|---|
| Pure CeO2 | 28.54 | 14.270 | 3.12384 | 5.41065 |
| 1.5 wt% Nb–CeO2 | 28.59 | 14.295 | 3.11849 | 5.40138 |
| 2.5 wt% Nb–CeO2 | 28.65 | 14.325 | 3.11209 | 5.39031 |
| 3.0 wt% Nb–CeO2 | 28.66 | 14.330 | 3.11103 | 5.38846 |
| 50 wt% Nb–CeO2 | 28.70 | 14.350 | 3.10679 | 5.38111 |
Crystallite size of the prepared samples
| Sample | Crystallite size (nm) |
|---|---|
| CeO2 | 26.154 |
| 1.5 wt% Nb–CeO2 | 24.354 |
| 2.5 wt% Nb–CeO2 | 25.328 |
| 3.0 wt% Nb–CeO2 | 25.932 |
| 50 wt% Nb–CeO2 | 28.707 |
The doped samples assume lower lattice parameter. This decrease in value is associated with the contraction of the CeO2 lattice, and the possible substitution of the Ce4+ by the Nb5+ [29,30]. This is due to the lower ionic radius of niobium (0.64 Å) compared with cerium (0.97 Å) which induced the contraction of the crystal lattice [31]. The incorporation of neodymium (Nd) into CeO2 expands the crystal lattice owing to the higher ionic radius of Ce4+ (0.970 Å) when compared to Nd3+ (1.109 Å) [10]. The shifts in lattice parameter are vital in confirming the formation of doped oxide [1]. This assertion is further corroborated with the result of the crystallite size enlisted in Table 3. Although significant variations in the crystallite size of all the samples were not prevalent, (maximum difference of ±1.8), this difference further supports the formation of doped oxides. This is in agreement with the findings of Amarsingh [31] that the substitution of pentavalent ions such as Nb in CeO2 does not initiate significant reduction in the crystallite size. Thus, pure CeO2 affords the highest size of 26.154 nm. Additionally, the minute reduction in the crystallite size suggests that the incorporation of Nb into CeO2 crystal inhibits the grain growth of the CeO2, as later shown with the SEM results [25]. However, this assertion remains valid at low loading. Increasing the Nb loading was found to affect the CeO2 phase, with the formation of new peaks at the highest loading. The slight increase in the intensity at the (311) plane corresponding to the peaks at 2θ = 56.37° confirms that the amorphous Nb2O5 is incorporated into the CeO2 crystals and that the CeO2 content is decreased, compensating for the minute decrease in the crystallinity [13,32].
3.2 FTIR analysis
The FTIR results present the possible presence of the Nb phases on the CeO2 as shown in Figure 2. All the Nb-doped CeO2 samples show the absence of the carboxylic groups C═O stretching at 1,700 cm−1 and C–O asymmetrical stretching at 1,380 cm−1 that are typical of Nb containing species. This is indicative that the sample contains only Nb2O5 [17]. The spectra of the Nb2O5 exhibits the surface Nb═O stretches at the region of 1,050–948 cm−1 [33]. The Nb–O peak at 929.52 cm−1 denotes the stretching vibrations of Nb–O of NbO6 units and the Nb–O peak at 880 cm−1 is due to angular vibrations [33]. In addition to the OH groups on pure CeO2, the characteristic stretching vibrational peaks associated with the Ce–O bond is observed around 590 cm−1 [34].
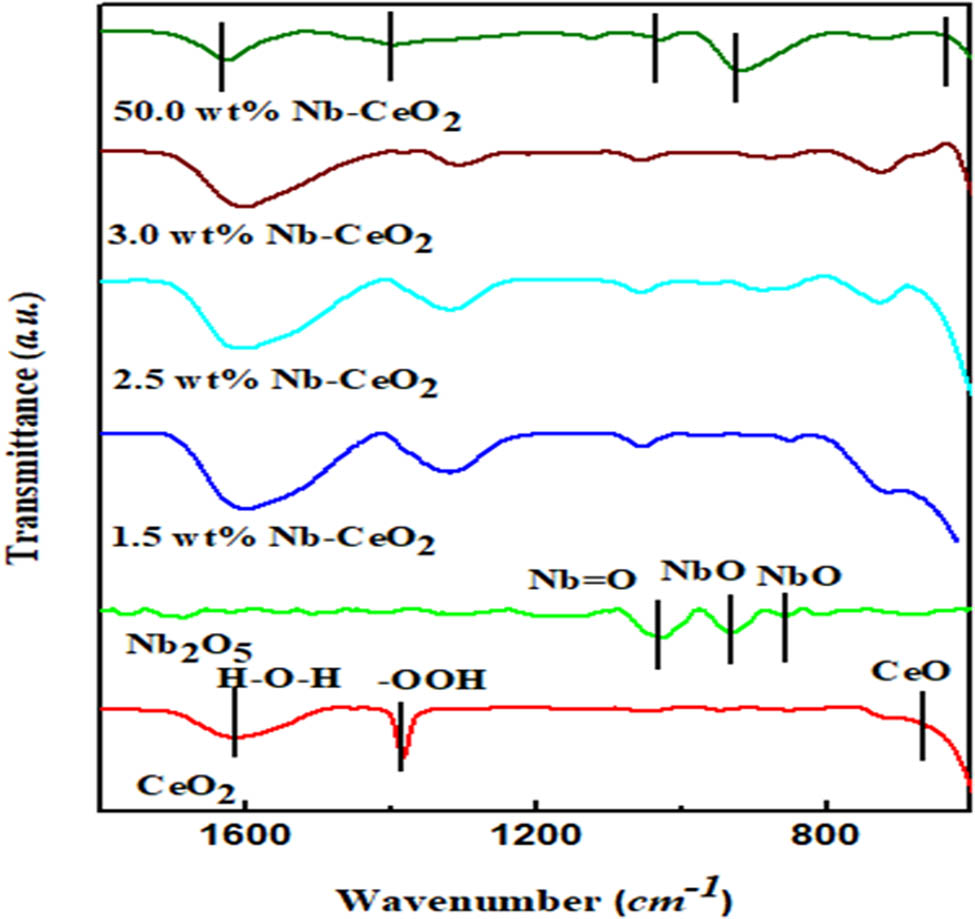
FTIR spectral of the pure and doped samples.
The characteristic peaks associated with the lattice vibrations of metal–oxygen bonds are observed for the Nb-doped samples with the increase in the loading. The peak observed around 1,123 cm−1 is typical of Ce–Nb–O spectral which affirms the formation of doped mixed oxide sample [35]. With the additional loading, the Nb═O disappeared (at 50 wt% Nb–CeO2), and the observed broadened peak of Nb–O shows the incorporation of the niobium ions into the CeO2 lattice, resulting in little distortion [23,31,36]. In comparison to the pure CeO2 spectra, the stretching mode vibration of Ce–O at around 590 cm−1 in the other samples shifted to a lower wavenumber. This indicates the weakening of this bond in favor of the formation of the Ce–Nb–O linkage [31,37].
The intensity of the peak of Nb–O identified at wavenumber of 929.52 cm−1 on the pure Nb2O5 sample becomes lessened as the Nb2O5 loading was increased from 1.5 wt% to 3.0 wt%. This shows that the further addition of Nb might facilitate the reduction in NbO to metallic Nb [13]. Thus, the interaction of Nb with CeO2 is strengthened, while the interaction between Nb–O and CeO2 is weakened. Also, higher Nb loading enhances both the Brønsted acidity and strong Lewis acidity. These acidic sites serve as the active centers for surface-assisted reaction and are associated with the Nb–O and Nb–O–Nb bonds present in NbOx species. Increasing Nb loading beyond the dispersion capacity will limit the formation of the Brønsted and Lewis acid sites [13]. However, as observed at 50 wt% loading, the broad and intense peak of NbO reappeared. This suggests that a very high loading diminishes the catalytic activity of cerium-niobium mixed oxide. Exceeding the monolayer coverage will lead to the formation of multilayer inactive NbOx.
3.3 N2 adsorption–desorption
The isotherms plot and the structural properties of the prepared samples obtained with the N2 adsorption–desorption analysis are depicted in Figure 3 and Table 4, respectively. All the prepared sample shows a typical type IV isotherms associated with the capillary condensation in mesopores. The pure samples show the H1 type hysteresis loop and the addition of Nb to CeO2 preserves the H1 type. This observation is consistent with the earlier report involving Nb–CeO2-doped catalysts [38]. The values of the pore diameter obtained for all the samples show a mesoporous structure. The pore cerium oxide gives a particle size of 3.4 nm in agreement with the values between 3.24–3.89 nm earlier reported for ceria prepared via precipitation method [39]. Likewise, the pore volume obtained for all the samples is approximately constant despite increasing the Nb loading, suggesting the samples entail a narrow particle size distribution [40]. However, the observable differences result from the evaluated BET surface area. The Nb2O5 gives the lowest surface area of 38.451 m2/g, while a value of 50.437 m2/g is obtained for CeO2. Loading the CeO2 with Nb decreases the surface area from 43.815 m2/g at 1.5 wt% Nb–CeO2 to 40.833 m2/g at 50 wt% Nb–CeO2. The minimal reduction observed among the doped materials in the BET surface area might have evolved from the blocking effect on the sample pores due to the incorporation of the Nb on the samples’ inter-particle volume. This is supported by the slight decrease shown in the pore volume [13]. Similar results have been reported for the nanostructured CeO2 doped with platinum [40].

N2 adsorption–desorption isotherms for the prepared samples. (a) CeO2; (b) Nb2O5; (c) 3 wt% doped, and (d) 50 wt% doped Nb-CeO2.
BET surface area and pore volume of the catalyst samples
| Sample | BET surface area (m2/g) | Pore volume (cc/g) | Pore diameter (nm) |
|---|---|---|---|
| CeO2 | 50.437 | 0.021 | 3.319 |
| Nb2O5 | 38.451 | 0.032 | 3.309 |
| 1.5 wt% Nb–CeO2 | 43.815 | 0.017 | 3.294 |
| 2.5 wt% Nb–CeO2 | 43.114 | 0.018 | 3.296 |
| 3.0 wt% Nb–CeO2 | 41.741 | 0.018 | 3.306 |
| 50 wt% Nb–CeO2 | 40.833 | 0.017 | 3.318 |
3.4 SEM and EDS analyses
The elemental composition, morphology, and shape of the prepared samples are analyzed with the SEM. The SEM images and EDS mapping of the cerium oxide and the niobium-doped cerium oxide are displayed in Figures 4 and 5. The pure cerium particles show cerium as fine and well dispersed, with uniform morphology and with the absence of any specific shape [24,41]. This fine structure suggests that CeO2 is able to withstand the operational temperature employed during the calcination process [39]. The morphology of the pure Nb2O5 discloses fine particles together with agglomerated and sponge shaped particles. The doped samples present similar structure as that of the pure CeO2 sample at low to moderate loading of 1.5–3.0 wt% of Nb.
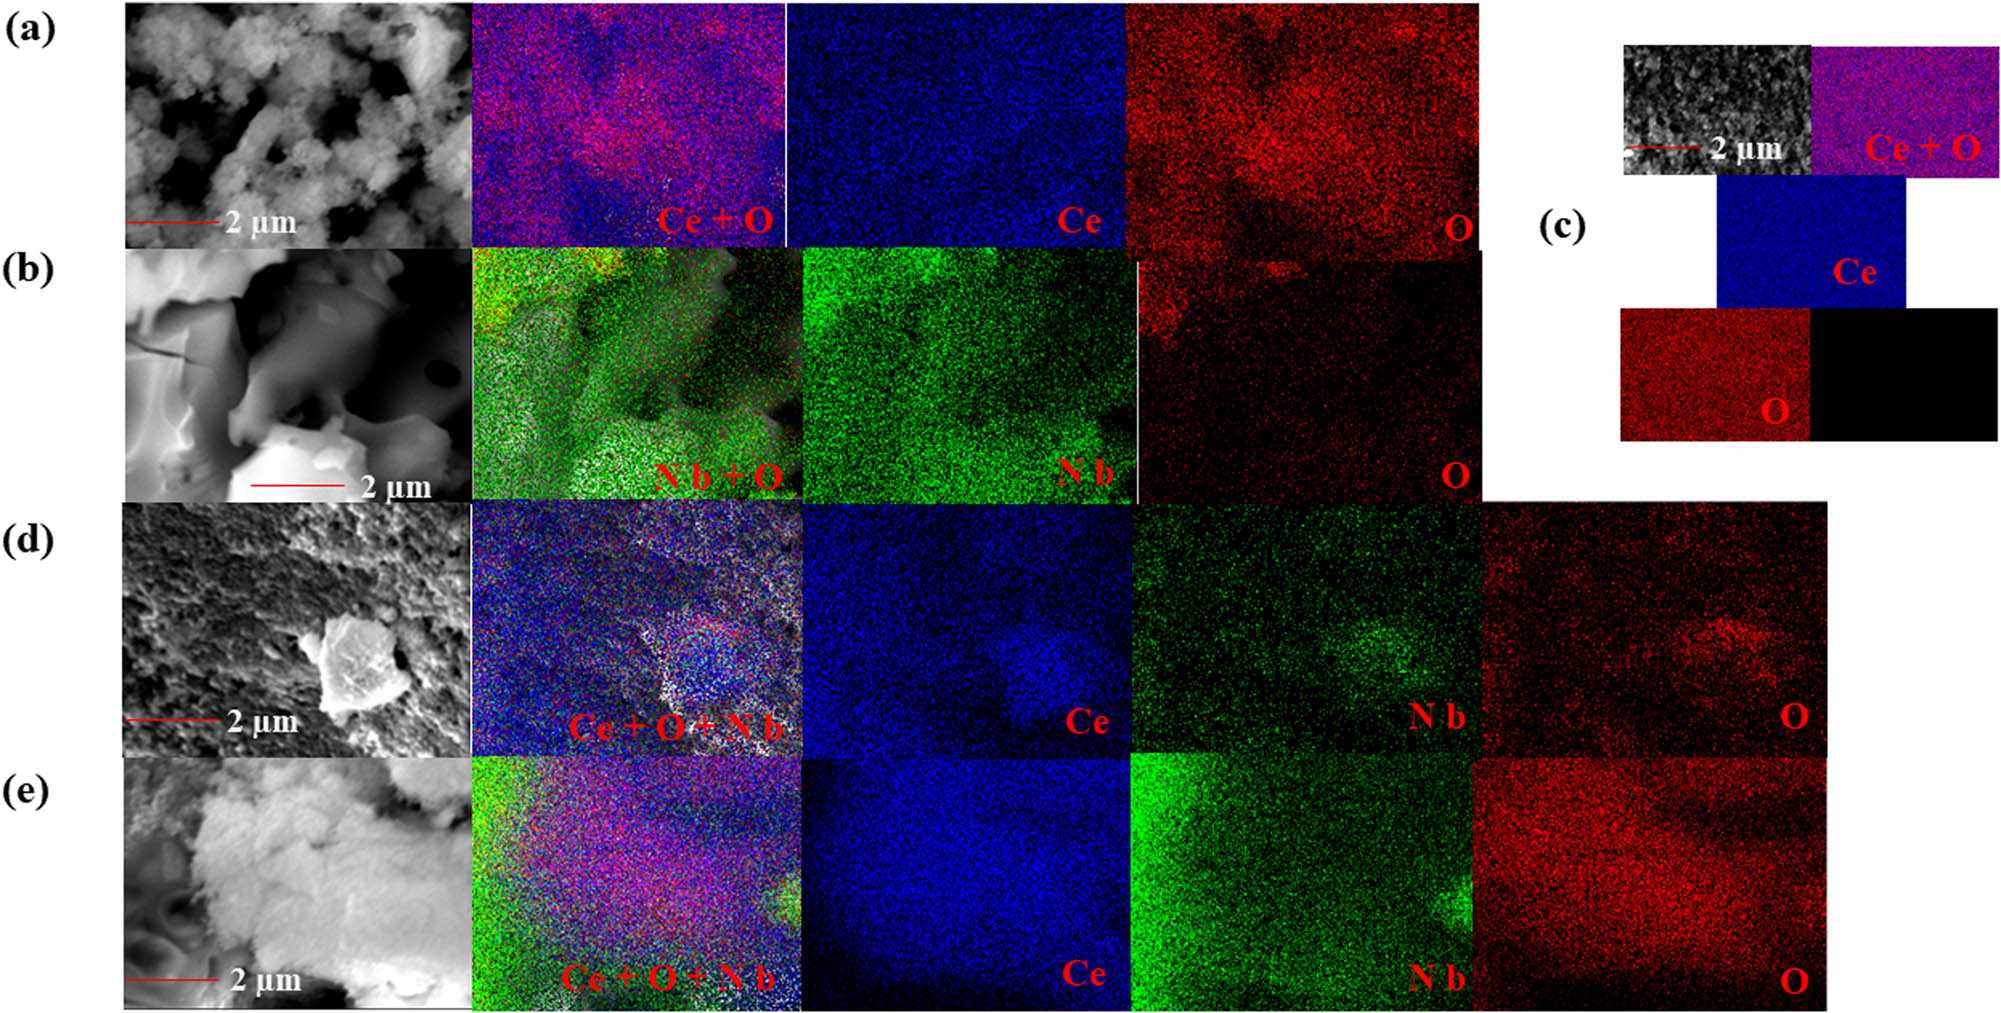
SEM images and EDS mapping obtained for the materials (a) CeO2; (b) Nb2O5; (c) 2.5 wt% doped, (d) 3 wt% doped, and (e) 50 wt% doped Nb–CeO2.

EDS plots obtained for the materials (a) CeO2; (b) Nb2O5; (c) 1.5 wt% doped, (d) 2.5 wt% doped, (e) 3 wt% doped, and (f) 50 wt% doped Nb–CeO2.
Figure 4 demonstrates the EDS mapping of the prepared samples. CeO2 and Nb2O5 reveals a homogenous well dispersed atoms of the constituent elements. The addition of 1.5 and 2.5 wt% of Nb do not show any presence of Nb atoms in the mapping analysis (Figure 4c, only 2.5 wt% loading is present). However, as confirmed by the EDS profiles later, there is the presence of Nb atoms at this loading values. This can be attributed to the very high dispersion and incorporation of the Nb atoms into the CeO2 [42]. Increasing the loading to 3 wt%, Nb atoms are detected by the EDS mapping (not too conspicuous), and the atoms are well dispersed over the CeO2 surface. This further confirms that the non-detection of the Nb atoms at lower loading cannot solely be attributed to complete absence of Nb atoms. The Nb atoms becomes more feasible at 50 wt%, with the high concentration at the corner of the sample. This might have resulted from the possible Nb agglomeration due to high loading. Additionally, the high dispersion observed at low loading of Nb loading together with the reduction in the calculated values of crystallite size indicates the strong interaction between the CeO2 and Nb2O5 oxides of the doped samples [43]. The EDS profiles confirm the presence of only cerium, niobium, and oxygen on all samples. For the pure samples, the identified oxides are CeO2 and Nb2O5, confirming the purity of the starting materials. Weak peaks associated with Nb atoms are observed on the doped CeO2 samples.
Additionally, the quantitative EDS analysis reveals that increase in the loading weight gives a corresponding increase in the amount of Nb deposited on the CeO2. The % atomic composition predicts the formula for the 1.5 wt%, 2.5 wt%, 3.0 wt%, and 50.0 wt% samples as Ce0.985Nb0.015O2, Ce0.975Nb0.025O2, Ce0.97Nb0.03O2, and Ce0.5Nb0.5O2, respectively. This further affirms the incorporation of the Nb into the CeO2 lattice and the reduction in the Ce atom.
3.5 TGA analysis
Figure 6 shows the TGA measurements obtained for pure CeO2 and Nb2O5 samples. In order to determine the thermal effects on the doped oxides, only samples with 3.0 and 50 wt% are considered. Pure CeO2 shows a mass loss of about 1.4%, and equilibrium is reached at about 350°C. This loss is ascribed to the H2O present in the sample surface [10]. This result is in good agreement with mass loss of about 1.3% and 350°C that was reported earlier [10]. Similarly, the doped samples show a mass loss at about 1.1%, suggesting that the crystallinity of CeO2 is preserved after the doping [44]. The impregnation of Nb in CeO2 is found to affect the thermal stability of the doped samples, reducing the mass loss as the temperature is raised [45,46]. This is corroborated with the result of enhanced thermal stability obtained for the pure Nb2O5 samples. Two stages of mass loss are observed for the Nb2O5. Stage 1 (about 1.5% loss), the interval 50−450°C encompasses the elimination of the adsorbed H2O, and stage 2 (6.2% loss) between 450 and 600°C signifies the loss of structural H2O [44,47,48]. As observed, after about 450°C, all the samples assumed a steady value, thus the calcination temperature was kept below 600°C.

TGA results of the prepared samples (a) CeO2, 3 wt% doped, and 50 wt% doped Nb-CeO2 and (b) Nb2O5.
3.6 CeO2 structure and charge distribution analysis
The effect of Nb content on CeO2 has been evaluated with the DFT calculations. The electronic interaction and distribution are examined on the CeO2(111) structure. CeO2 exhibits a fluorite crystallographic structure with the Ce atoms located at the face center cubic (fcc) positions, while the O atoms prefer the tetrahedral sites. Addition of the Nb atoms preserves the fluorite structure, a result previously confirmed with our XRD analysis.
Figure 7 shows the optimized geometries of the bulk and surface structures of both the perfect CeO2(111) and niobium-doped structures. The optimized bulk and surface geometries of Nb2O5(111) are likewise shown. The lattice parameter of the perfect CeO2 stands at 5.464 Å and slightly shrinks to 5.284 Å after Nb doping. This reduction trend agrees with the XRD prediction where the lattice parameters reduce with increase in the loading weight of Nb. Although, our calculation result gives a sizeable reduction in the lattice parameter as compared with XRD values, both results confirm that Nb doping reduces the lattice parameter [1].
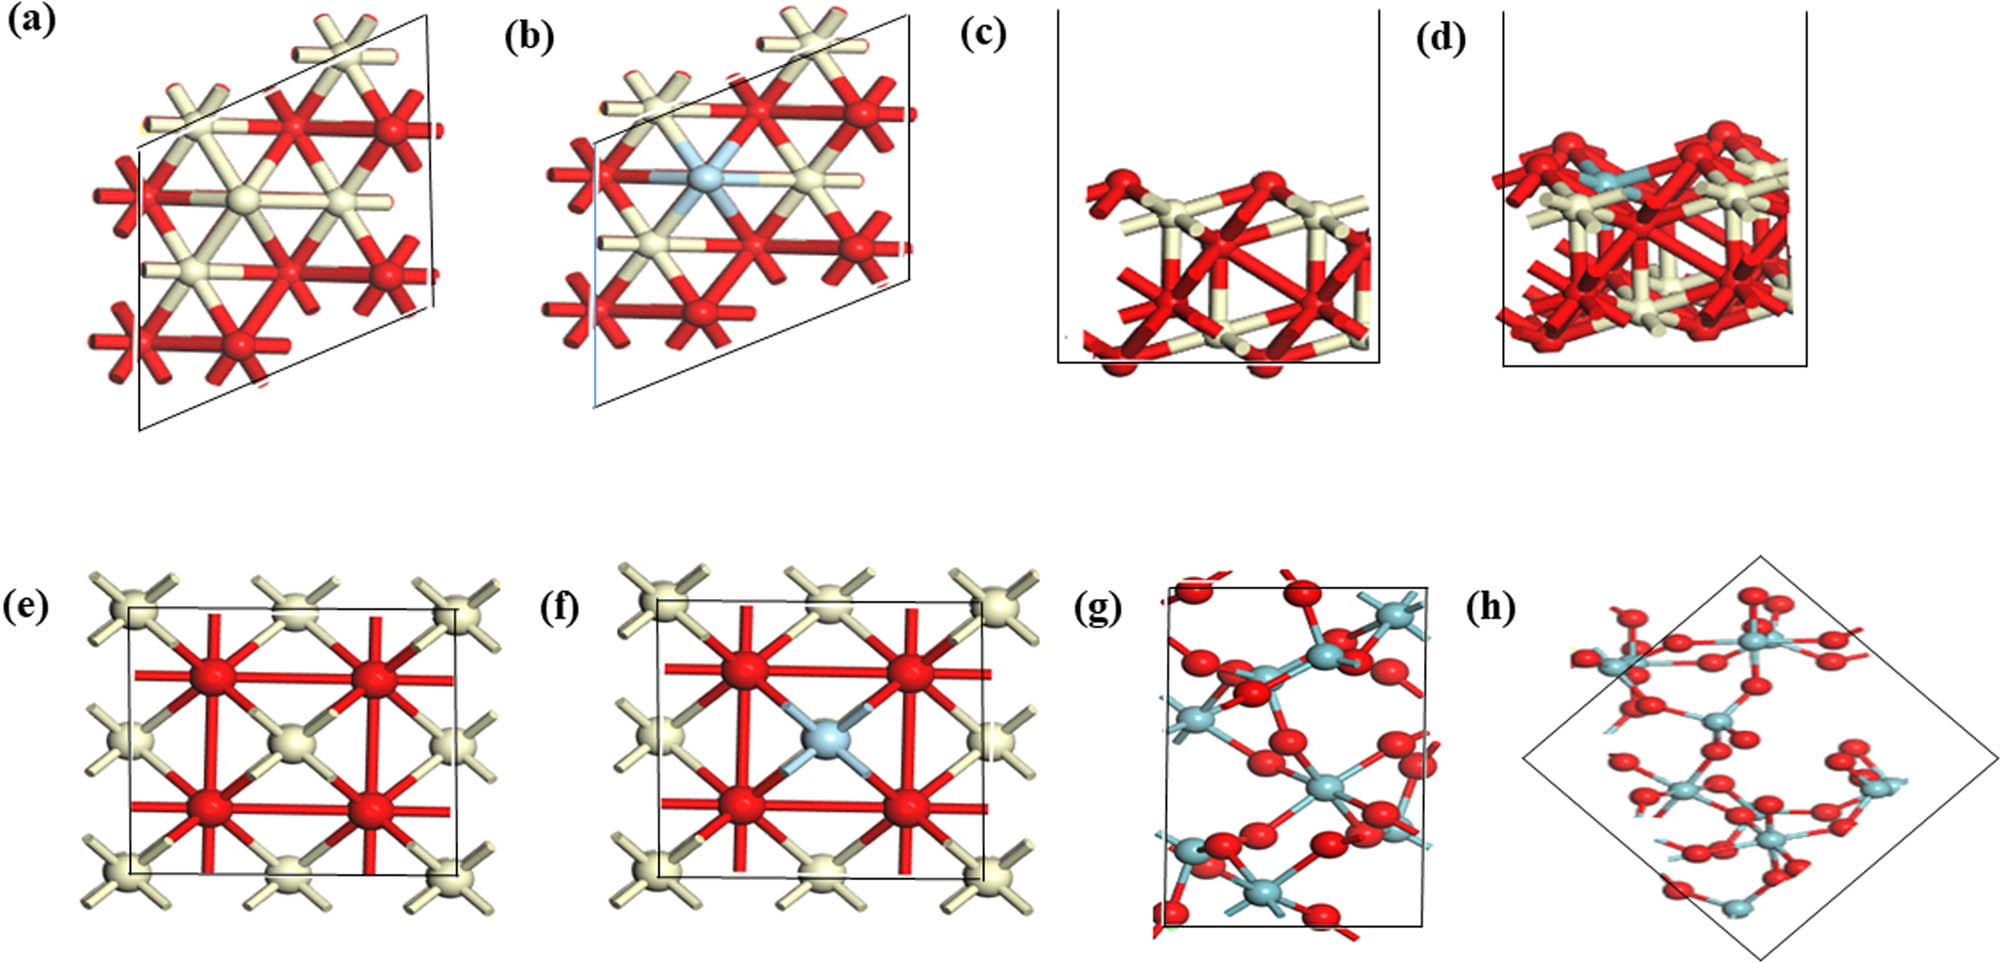
Structural geometries of (a) top view of un-doped, (b) top view of doped, (c) side view of un-doped, and (d) side view of doped CeO2 surfaces (slightly bent); (e) un-doped bulk and (f) doped bulk CeO2; (g) bulk Nb2O5; and (h) Nb2O5 surface. Red, grey, and light blue spheres refer to oxygen, cerium, and niobium atoms, respectively.
Table 5 enlists the bond length of the considered structures. Generally, Ce–O bond distance is used to validate the possible expansion or contraction of the crystal lattice of doped materials. Ionic radius of dopants is essential in determining the behavior of the bond length. Earlier reports have provided contrasting observation. For instance, CeO2 doped with Yb, Er, and Y presents a similar Ce–O and dopant-oxygen distances, while for Gd, Sm, La dopants, observed distances were higher for the dopant-oxygen than the Ce–O distance. It is expected that dopants with higher ionic radius than Ce should induce higher dopant-oxygen distance, and dopants having lesser ionic radius should give lesser bond distance. This is not always true, because similar distance was observed for Ce–O and Yb–O, Er–O and Y–O, despite Yb, Er, and Y possessing higher ionic radius [49].
Bond distance (Å) of the optimized structures
| Bond type | Perfect CeO2 (bulk) | Perfect CeO2 (surface) | Doped CeO2 bulk | Doped CeO2 surface | Perfect Nb2O5 bulk | Perfect Nb2O5 surface |
|---|---|---|---|---|---|---|
| Ce–O | 2.443 | 2.370 | 2.432 | 2.436 | — | — |
| Nb–O | — | — | 2.191 | 1.940 | 2.287 | 2.127 |
Perfect CeO2 shows a Ce–O bond length of 2.370 Å, which is in a perfect agreement with 2.352 Å and 2.340 Å reported previously [10,27]. The Ce–O distance in the perfect CeO2 demonstrates an overshoot of 0.073 Å in the bulk as compared to the surface. In comparison with the doped structures, the Ce–O distance shortens by 0.011 Å for the bulk, while an increase of 0.066 Å is observed for the surface (in reference to experimentally measured value for the bulk CeO2). The Nb–O bond distance amounts to 2.287 Å for the bulk and 2.127 Å for the surface, which reasonably agrees with the experimentally reported values of 1.73–2.26 Å [50]. The Nb–O distance in the pure Nb2O5 structure is shorter in the surface than the corresponding value in the bulk by 0.16 Å. After doping, the Nb–O is found to reduce by 0.096 Å for the bulk and by 0.187 Å for the surface.
Thus, our result demonstrates that doping Ce with Nb ensures the reduction in the Ce–O and Nb–O distances, which corroborates the result of the lattice parameter. The contraction in the bond length of both Ce–O and Nb–O bonds obtained with DFT is indicative of the contraction of the oxygen atoms and not the Nb environment itself.
Figure 8 shows a disparate charge distribution for the bulk and surface structures of the perfect and Nb-doped CeO2. The perfect bulk structure shows that the atomic charge on O atom are constant at −0.330 e, while the Ce atom maintains a positive charge of 0.660 e throughout the structure. Introducing the Nb atom to the bulk structure reveals that the electronegativity values of the tetrahedral O atoms are improved with a charge increase of 0.01 e. This is expected to improve the catalytic tendency of the material since the O atoms will assume more affinity for adsorbed reactant [51]. Simultaneously, after doping, the Ce atoms are less positively charged (i.e., there is presence of more electrons), suggesting that the Nb atoms derives more reduction on the two Ce atoms bounding the tetrahedral O atoms, engendering the Ce atoms more reactive. The edge and corner Ce atoms surrounding the bulk CeO2 are likewise reduced to that obtained for the perfect bulk structure. This is a desirable result for improved catalyst performance, ratifying the possible interswitch of Ce atom oxidation state between Ce4+ to Ce4−x [10]. Analysis of the atomic charge on the surface structures presents similar trend observed for the bulk structure. The Ce atoms on the perfect surface exceeds that of the bulk by 0.07 e, while the O atoms is 0.03 e which is higher. Doping the surface presents a lower negative charge for all the O atoms on the surface, this will expedite their removal as oxygen molecules during reduction reactions [9].

Atomic Hirshfeld charges (in e) of (a) un-doped bulk, (b) doped bulk, (c) un-doped surface, (d) and doped surface of CeO2(111).
3.7 Analysis of total and partial density of states (TDOS and PDOS) of CeO2 and Nb2O5
The TDOS and the PDOS are calculated to explicate the electronic states of the prepared samples and to provide information germane to contribution of the orbitals around the Fermi energy level (E f = 0 eV, represented by the dotted lines) [52]. Figure 9 shows the DOS of both the bulk and surface un-doped CeO2. The band width is examined between −5 and −20 eV for all structures. The pure bulk CeO2 reveals the concentration of electrons with a narrow band within the 0–5 eV region, and a relative electron distribution at a higher energy. Our calculated band gap of Nb2O5 amounts to 3.037 eV, a value that is in a very good accord with the corresponding experimental measurement of 3.09 eV [21]. The electron concentration in the doped sample, Nb–CeO2, shifts to a higher energy level and demonstrates a band gap of 1.086 eV (that is, a reduction of 0.614 eV), in a close agreement with the analogous experimental value which shows a reduction of 0.59 eV in the band gap for Pb–CeO2 system [53]. This reveals that lower unoccupied molecular orbital and higher unoccupied molecular orbital are shortened, accounting for improved electron excitation into the conduction band. The band gap reduction observed shows that Nb will significantly promote the optical and catalytic properties of the mixed oxide [21].
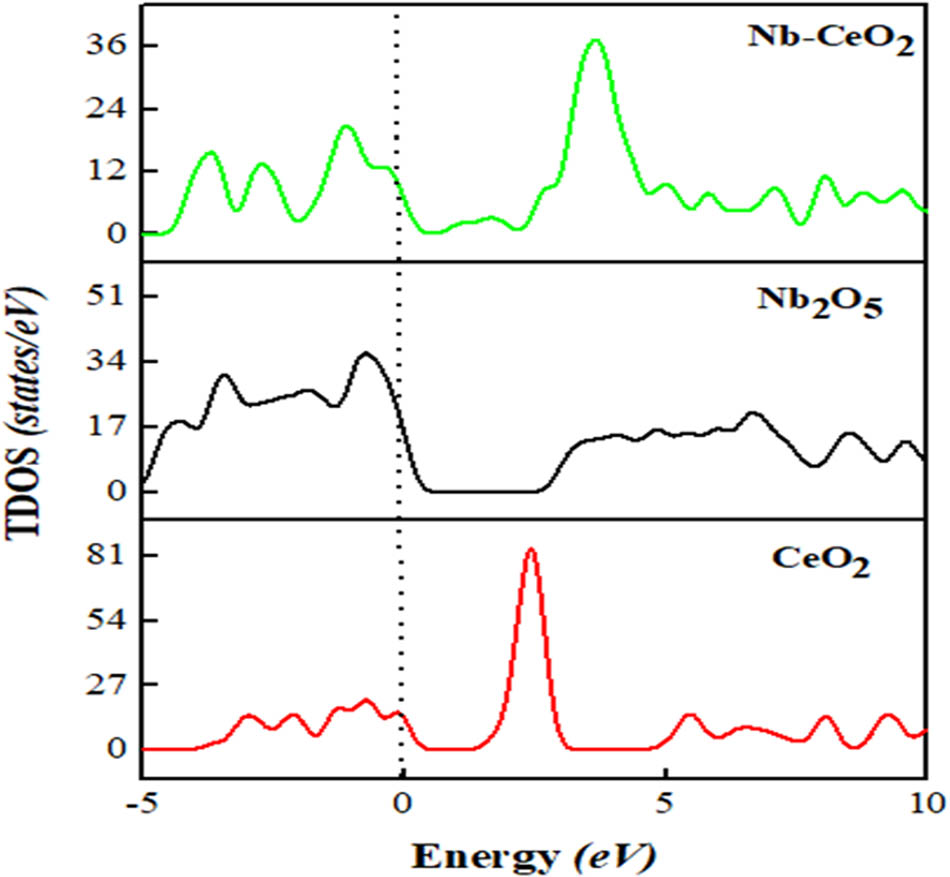
TDOS of the samples.
Figure 10 portrays the PDOS of the prepared samples. The O 2s and Ce 3p states lie at the lowest energy band (not shown) and the O 2p and Ce 4f states interact around the Fermi energy level with a hybridization of the Ce 5d and Ce 4f states [54]. The bandwidth of the O 2p band is 4.2 eV and the Ce 4f states exhibit a spacing of 1.5 eV which agrees with the computational values of 4.5 and 1.4 eV for O and Ce, respectively [28]. Our computed values for O 2p–Ce 5d orbitals band gap shows a band separation of 5.7 eV, which is in a good agreement with literature values reported between 5.3–5.7 eV [28]. Nb2O5 reveals an O 2p bandwidth of 6 eV mainly concentrated at the top of the valence band. The Nb 4d states span between −5 eV and 8 eV. The p and d electrons are found to be active at the Fermi level, with some contribution of Nb 2p states around the conduction band leading to high interaction between the O-2p, Nb-4p, and 4d states. There is an overlap between the Nb 4p states and 2p states at the regions of 2–6 eV. The Nb-doped CeO2 shows that, in addition to the occupied Ce 4f states around 2 eV, more 4f electrons that are absent in the pure CeO2 now concentrates around 4–6 eV (segment marked with arrow). The presence of excess electrons can either be initiated through the creation of oxygen vacancies or the addition of dopant. These excess electrons would occupy the Ce 4f states, localizing on individual Ce atoms [28]. This infers that the f states occupation observed herein originates from the addition of Nb atoms. In addition, the Nb 4d electrons which are conspicuous in the pure Nb2O5 sample is redundant after doping, indicating the possible electron transfer to the Ce 4f states, thus, reducing the Ce4+ to Ce3+. The availability of Ce3+ is known to promote catalytic reactions, and the excess electron gain by the 4f would give rise to n-type conductivity and the charge carrier in the band [55]. Similar analogy involving peaks shortening and disappearance was used to confirm electron transfer between atoms of similar doped systems [56].

PDOS plots of (a) Nb-doped CeO2, (b) un-doped CeO2, and (c) Nb2O5.
4 Conclusion
Nb2O5 is found to improve the properties of CeO2 in terms of the narrowed band gap and the electronic states of the Ce and O atoms. Experimental results of XRD confirm the formation of new peaks associated with Nb at high loading, and the EDS analysis detects the presence of Nb. There is a narrow distribution of the crystallite size of the prepared samples with the reduction in BET surface area as the Nb loading increases. TGA analysis predicts that the calcination temperature should be limited to below 600°C. DFT calculations support the experimental observation pertinent to the decrease in the lattice parameter of the CeO2 when Nb atom is incorporated. The Hirshfeld charges reveal the reduction in Ce atom after Nb doping with maximum reduction in the Ce atoms nearer to the Nb atom. The electronegativity values of the tetrahedral O atoms are increased by 0.01 e after Nb doping. This will promote the catalytic tendency of the material since more O atoms will exhibit higher affinity for adsorbed reactants. Analysis of the TDOS successfully re-produces the experimentally measured analogous values for pure CeO2 and Nb2O5. Nb doping is found to improve the semi conductivity nature of CeO2 through the reduction in the band gap of CeO2 by ∼0.60 eV. PDOS identifies the filling of the Ce-4f states from the Nb-4d states electron which is expected to improve the catalytic capacity of CeO2.
-
Funding information: This study has been supported by and a start-up grant from the College of Engineering at the United Arab Emirates University, UAEU (grant number: 31N421). Computations were carried out at the high performance cluster (HPC) of the UAEU.
-
Author contributions: All authors have accepted responsibility for the entire content of this manuscript and approved its submission.
-
Conflict of interest: The authors state no conflict of interest.
References
[1] McFarland EW, Metiu HJCR. Catalysis by doped oxides. Chem Rev. 2013;113(6):4391–427.10.1021/cr300418sSearch in Google Scholar
[2] Skrodczky K, Antunes MM, Han X, Santangelo S, Scholz G, Valente AA, et al. Niobium pentoxide nanomaterials with distorted structures as efficient acid catalysts. Commun Chem. 2019;2(1):1–11.10.1038/s42004-019-0231-3Search in Google Scholar
[3] Sathasivam S, Williamson BA, Althabaiti SA, Obaid AY, Basahel SN, Mokhtar M, et al. Chemical vapor deposition synthesis and optical properties of Nb2O5 thin films with hybrid functional theoretical insight into the band structure and band gaps. Appl Mater Interfaces. 2017;9(21):18031–8.10.1021/acsami.7b00907Search in Google Scholar
[4] Siddiki SH, Rashed MN, Ali MA, Toyao T, Hirunsit P, Ehara M, et al. Lewis acid catalysis of Nb2O5 for reactions of carboxylic acid derivatives in the presence of basic inhibitors. ChemCatChem. 2019;11(1):383–96.10.1002/cctc.201801239Search in Google Scholar
[5] Xin Y, Dong L, Guo Y, Liu X, Hu Y, Wang YJ. Correlation of the catalytic performance with Nb2O5 surface properties in the hydrodeoxygenation of lignin model compound. J Catal. 2019;375:202–12.10.1016/j.jcat.2019.05.007Search in Google Scholar
[6] Ushikubo T. Recent topics of research and development of catalysis by niobium and tantalum oxides. Catal Today. 2000;57(3–4):331–8.10.1016/S0920-5861(99)00344-2Search in Google Scholar
[7] Casapu M, Krocher O, Mehring M, Nachtegaal M, Borca C, Harfouche M, et al. Characterization of Nb-containing MnOx−CeO2 catalyst for low-temperature selective catalytic reduction of NO with NH3. J Phys Chem C. 2010;114(21):9791–801.10.1021/jp911861qSearch in Google Scholar
[8] Zhang N, Tsang EP, Chen J, Fang Z, Zhao DJ. Critical role of oxygen vacancies in heterogeneous Fenton oxidation over ceria-based catalysts. J Colloid Interface Sci. 2020;558:163–72.10.1016/j.jcis.2019.09.079Search in Google Scholar PubMed
[9] Rawadieh SE, Altarawneh M, Altarawneh IS, Batiha MA, Al-Makhadmeh LA. A kinetic model for evolution of H2 and CO over Zr-doped ceria. J Mol Catal. 2020;498:111256–63.10.1016/j.mcat.2020.111256Search in Google Scholar
[10] Mordekovitz Y, Sagi S, Barzilai S, Hayun S. Effect of Nd content on the energetics of H2O adsorption and defect structure in the Ce(1−x)NdxO(2−0.5x) system. J Mater Chem A. 2020;8(41):21842–51.10.1039/D0TA04613BSearch in Google Scholar
[11] Maitarad P, Han J, Zhang D, Shi L, Namuangruk S, Rungrotmongkol T. Structure–activity relationships of NiO on CeO2 nanorods for the selective catalytic reduction of NO with NH3: experimental and DFT studies. J Phys Chem C. 2014;118(18):9612–20.10.1021/jp5024845Search in Google Scholar
[12] Wang P, Chen S, Gao S, Zhang J, Wang H, Wu Z. Niobium oxide confined by ceria nanotubes as a novel SCR catalyst with excellent resistance to potassium, phosphorus, and lead. Appl Catal B-Environ. 2018;231:299–309.10.1016/j.apcatb.2018.03.024Search in Google Scholar
[13] Ma Z, Wu X, Si Z, Weng D, Ma J, Xu T. Impacts of niobia loading on active sites and surface acidity in NbOx/CeO2–ZrO2 NH3–SCR catalysts. Appl Catal B-Environ. 2015;179:380–94.10.1016/j.apcatb.2015.05.038Search in Google Scholar
[14] Ding S, Liu F, Shi X, He H. Promotional effect of Nb additive on the activity and hydrothermal stability for the selective catalytic reduction of NOx with NH3 over CeZrOx catalyst. Appl Catal B-Environ. 2016;180:766–74.10.1016/j.apcatb.2015.06.055Search in Google Scholar
[15] Qu R, Peng Y, Sun X, Li J, Gao X, Cen K, et al. Identification of the reaction pathway and reactive species for the selective catalytic reduction of NO with NH3 over cerium–niobium oxide catalysts. Catal Sci Technol. 2016;6(7):2136–42.10.1039/C5CY01220ASearch in Google Scholar
[16] Khan W, Betzler SB, Šipr O, Ciston J, Blaha P, Scheu C, et al. Theoretical and experimental study on the optoelectronic properties of Nb3O7 (OH) and Nb2O5 photoelectrodes. J Phys Chem C. 2016;120(41):23329–38.10.1021/acs.jpcc.6b06391Search in Google Scholar
[17] de Sousa Lima LF, Coelho CR, Gomes GHM, Mohallem ND. Technology. Nb2O5/SiO2 mesoporous monoliths synthetized by sol–gel process using ammonium niobate oxalate hydrate as porogenic agent. J Sol-Gel Sci Technol. 2020;93(1):168–74.10.1007/s10971-019-05146-5Search in Google Scholar
[18] Shi L, Xu C, Yuan H. A CASTEP study on magnetic properties of C-doped ZnO crystal. Physica B Condens Matter. 2011;406(17):3187–91.10.1016/j.physb.2011.05.022Search in Google Scholar
[19] Wang Y, Puggioni D, Rondinelli JM. Assessing exchange-correlation functional performance in the chalcogenide lacunar spinels GaM4Q8 (M = Mo, V, Nb, Ta; Q = S, Se). Phys Rev B. 2019;100(11):115149–63.10.1103/PhysRevB.100.115149Search in Google Scholar
[20] Miran HA, Jiang Z-T, Altarawneh M, Veder J-P, Zhou Z-F, Rahman MM, et al. Influence of DC magnetron sputtering reaction gas on structural and optical characteristics of Ce-oxide thin films. Ceram Int. 2018;44(14):16450–8.10.1016/j.ceramint.2018.06.059Search in Google Scholar
[21] Oliveira JA, Reis MO, Pires MS, Ruotolo LA, Ramalho TC, Oliveira CR, et al. Zn-Doped Nb2O5 photocatalysts driven by visible-light: an experimental and theoretical study. Chem Phys. 2019;228:160–7.10.1016/j.matchemphys.2019.02.062Search in Google Scholar
[22] Lian Z, Shan W, Zhang Y, Wang M, He HJI, Research EC. Morphology-dependent catalytic performance of NbOx/CeO2 catalysts for selective catalytic reduction of NOx with NH3. Ind Eng Chem Res. 2018;57(38):12736–41.10.1021/acs.iecr.8b02553Search in Google Scholar
[23] Fonseca ROD, da Silva AA, Signorelli MR, Rabelo-Neto RC, Noronha FB, Simões RC, et al. Nickel/doped ceria solid oxide fuel cell anodes for dry reforming of methane. J Braz Chem Soc. 2014;25:2356–63.10.5935/0103-5053.20140245Search in Google Scholar
[24] You R, Zhang X, Luo L, Pan Y, Pan H, Yang J, et al. NbOx/CeO2-rods catalysts for oxidative dehydrogenation of propane: Nb–CeO2 interaction and reaction mechanism. J Catal. 2017;348:189–99.10.1016/j.jcat.2016.12.012Search in Google Scholar
[25] Liu Z, Zhang X, Cai T, Yuan J, Zhao K, Lu W, et al. Niobium modification of Au/CeO2 for enhanced catalytic performance over benzene combustion. Nanomaterials. 2021;11(1):189–99.10.3390/nano11010189Search in Google Scholar PubMed PubMed Central
[26] Wuilloud E, Delley B, Schneider W-D, Baer Y. Spectroscopic evidence for localized and extended f-symmetry states in CeO2. Phys Rev Lett. 1984;53(2):202–5.10.1103/PhysRevLett.53.202Search in Google Scholar
[27] Gerward L, Olsen JS, Petit L, Vaitheeswaran G, Kanchana V, Svane A, et al. Bulk modulus of CeO2 and PrO2 – an experimental and theoretical study. J Alloys Compd. 2005;400(1–2):56–61.10.1016/j.jallcom.2005.04.008Search in Google Scholar
[28] Sun L, Huang X, Wang L, Janotti A. Disentangling the role of small polarons and oxygen vacancies in CeO2. Phys Rev B. 2017;95(24):245101–8.10.1103/PhysRevB.95.245101Search in Google Scholar
[29] Santander J, López E, Diez A, Dennehy M, Pedernera M, Tonetto G. Ni–Nb mixed oxides: one-pot synthesis and catalytic activity for oxidative dehydrogenation of ethane. Chem Eng J. 2014;255:185–94.10.1016/j.cej.2014.06.048Search in Google Scholar
[30] Heracleous E, Lemonidou A. Ni–Nb–O mixed oxides as highly active and selective catalysts for ethene production via ethane oxidative dehydrogenation. Part I: characterization and catalytic performance. J Catal. 2006;237(1):162–74.10.1016/j.jcat.2005.11.002Search in Google Scholar
[31] Amarsingh KB, Theerthagiri J, Madhavan J, Balu T, Rajasekaran T, Arof AK. Investigations on acceptor (Pr3+) and donor (Nb5+) doped cerium oxide for the suitability of solid oxide fuel cell electrolytes. Ionics. 2016;22(12):2461–70.10.1007/s11581-016-1780-4Search in Google Scholar
[32] Wandre T, Gaikwad P, Tapase A, Garadkar K, Vanalakar S, Lokhande P, et al. Sol–gel synthesized TiO2–CeO2 nanocomposite: an efficient photocatalyst for degradation of methyl orange under sunlight. J Mater Sci. 2016;27(1):825–33.10.1007/s10854-015-3823-4Search in Google Scholar
[33] Gómez CD, Rodríguez-Páez JE, Ceramics AO. The effect of the synthesis conditions on structure and photocatalytic activity of Nb2O5 nanostructures. Process. Appl Ceram. 2018;12(3):218–29.10.2298/PAC1803218GSearch in Google Scholar
[34] Katta PP, Nalliyan R. Corrosion resistance with self-healing behavior and biocompatibility of Ce incorporated niobium oxide coated 316L SS for orthopedic applications. Surf Coat Tech. 2019;375:715–26.10.1016/j.surfcoat.2019.07.042Search in Google Scholar
[35] Su T, Zhai Y, Jiang H, Gong H. Calorimetry. Studies on the thermal decomposition kinetics and mechanism of ammonium niobium oxalate. J Therm Anal Calorim. 2009;98(2):449–55.10.1007/s10973-009-0300-4Search in Google Scholar
[36] Hardcastle FD, Wachs IE. Determination of niobium-oxygen bond distances and bond orders by Raman spectroscopy. Solid State Ion. 1991;45(3–4):201–13.10.1016/0167-2738(91)90153-3Search in Google Scholar
[37] Liu YH, Zuo JC, Ren XF, Yong L. Synthesis and character of cerium oxide (CeO2) nanoparticles by the precipitation method. Metalurgija. 2014;53(4):463–5.Search in Google Scholar
[38] Qu R, Gao X, Cen K, Li J. Relationship between structure and performance of a novel cerium-niobium binary oxide catalyst for selective catalytic reduction of NO with NH3. Appl Catal B-Environ. 2013;142:290–7.10.1016/j.apcatb.2013.05.035Search in Google Scholar
[39] Valechha D, Lokhande S, Klementova M, Subrt J, Rayalu S, Labhsetwar N. Study of nano-structured ceria for catalytic CO oxidation. J Mater Chem. 2011;21(11):3718–25.10.1039/c0jm03267kSearch in Google Scholar
[40] Perkas N, Rotter H, Vradman L, Landau MV, Gedanken A. Sonochemically prepared Pt/CeO2 and its application as a catalyst in ethyl acetate combustion. Langmuir. 2006;22(16):7072–7.10.1021/la0600907Search in Google Scholar PubMed
[41] Sumathi S, Kavipriya A. Structural, optical and photocatalytic activity of cerium doped zinc aluminate. Solid State Sci. 2017;65:52–60.10.1016/j.solidstatesciences.2017.01.003Search in Google Scholar
[42] Lee SM, Park KH, Hong SC. MnOx/CeO2–TiO2 mixed oxide catalysts for the selective catalytic reduction of NO with NH3 at low temperature. Chem Eng J. 2012;195:323–31.10.1016/j.cej.2012.05.009Search in Google Scholar
[43] Qi G, Yang RT. Characterization and FTIR studies of MnOx−CeO2 catalyst for low-temperature selective catalytic reduction of NO with NH3. J Phys Chem B. 2004;108(40):15738–47.10.1021/jp048431hSearch in Google Scholar
[44] Li S, Xu Q, Uchaker E, Cao X, Cao G. Comparison of amorphous, pseudohexagonal and orthorhombic Nb2O5 for high-rate lithium ion insertion. CrystEngComm. 2016;18(14):2532–40.10.1039/C5CE02069GSearch in Google Scholar
[45] Özel RE, Hayat A, Wallace KN, Andreescu S. Effect of cerium oxide nanoparticles on intestinal serotonin in zebrafish. Rsc Adv. 2013;3(35):15298–309.10.1039/c3ra41739eSearch in Google Scholar
[46] Han R, Wang Z, Zhang Y, Niu K. Thermal stability of CeO2/graphene/phenyl silicone rubber composites. Polym. Test. 2019;75:277–83.10.1016/j.polymertesting.2019.02.027Search in Google Scholar
[47] Morawa Eblagon K, Malaika A, Ptaszynska K, Pereira MFR, Figueiredo JL. Impact of thermal treatment of Nb2O5 on its performance in glucose dehydration to 5-hydroxymethylfurfural in water. Nanomaterials. 2020;10(9):1685.10.3390/nano10091685Search in Google Scholar PubMed PubMed Central
[48] Lin J, Yuan Y, Su Q, Pan A, Dinesh S, Peng C, et al. Facile synthesis of Nb2O5/carbon nanocomposites as advanced anode materials for lithium-ion batteries. Electrochim Acta. 2018;292:63–71.10.1016/j.electacta.2018.09.138Search in Google Scholar
[49] Schmitt R, Nenning A, Kraynis O, Korobko R, Frenkel AI, Lubomirsky I, et al. A review of defect structure and chemistry in ceria and its solid solutions. J Chem Soc Rev. 2020;49(2):554–92.10.1039/C9CS00588ASearch in Google Scholar
[50] Kreissl HT, Li MM, Peng Y-K, Nakagawa K, Hooper TJ, Hanna JV, et al. Structural studies of bulk to nanosize niobium oxides with correlation to their acidity. J Am Chem Soc. 2017;139(36):12670–80.10.1021/jacs.7b06856Search in Google Scholar PubMed
[51] Nwosu C. An electronegativity approach to catalytic performance. J Tech Sci Technol. 2012;1(2):25–8.Search in Google Scholar
[52] Patel V, Somaiya RN, Kansara S, Singh D, Prajapati N, Sonvane Y, et al. Structural and electrical properties of CeO2 monolayers using first-principles calculations. Solid State Commun. 2020;307:113801–5.10.1016/j.ssc.2019.113801Search in Google Scholar
[53] Murugadoss G, Ma J, Ning X, Kumar MR. Selective metal ions doped CeO2 nanoparticles for excellent photocatalytic activity under sun light and supercapacitor application. Inorg Chem Commun. 2019;109:107577–87.10.1016/j.inoche.2019.107577Search in Google Scholar
[54] Mehrotra S, Sharma P, Rajagopalan M, Bandyopadhyay A. High pressure phase transition and band structures of different phases in CeO2. Solid State Commun. 2006;140(6):313–7.10.1016/j.ssc.2006.08.031Search in Google Scholar
[55] Su Y-Q, Filot IA, Liu J-X, Tranca I, Hensen E. Charge transport over the defective CeO2(111) surface. Chem Mater. 2016;28(16):5652–8.10.1021/acs.chemmater.6b01548Search in Google Scholar
[56] Liu H, Yuan X, Rao L, Liu S, Shi Z, Zhou Y, et al. Refinement mechanism of NbC by CeO2 in hypereutectic Fe-Cr-C hardfacing coating. J Alloys Compd. 2019;770:1016–28.10.1016/j.jallcom.2018.08.162Search in Google Scholar
© 2022 Toyin Shittu and Mohammednoor Altarawneh, published by De Gruyter
This work is licensed under the Creative Commons Attribution 4.0 International License.
Articles in the same Issue
- Research Articles
- Theoretical and experimental investigation of MWCNT dispersion effect on the elastic modulus of flexible PDMS/MWCNT nanocomposites
- Mechanical, morphological, and fracture-deformation behavior of MWCNTs-reinforced (Al–Cu–Mg–T351) alloy cast nanocomposites fabricated by optimized mechanical milling and powder metallurgy techniques
- Flammability and physical stability of sugar palm crystalline nanocellulose reinforced thermoplastic sugar palm starch/poly(lactic acid) blend bionanocomposites
- Glutathione-loaded non-ionic surfactant niosomes: A new approach to improve oral bioavailability and hepatoprotective efficacy of glutathione
- Relationship between mechano-bactericidal activity and nanoblades density on chemically strengthened glass
- In situ regulation of microstructure and microwave-absorbing properties of FeSiAl through HNO3 oxidation
- Research on a mechanical model of magnetorheological fluid different diameter particles
- Nanomechanical and dynamic mechanical properties of rubber–wood–plastic composites
- Investigative properties of CeO2 doped with niobium: A combined characterization and DFT studies
- Miniaturized peptidomimetics and nano-vesiculation in endothelin types through probable nano-disk formation and structure property relationships of endothelins’ fragments
- N/S co-doped CoSe/C nanocubes as anode materials for Li-ion batteries
- Synergistic effects of halloysite nanotubes with metal and phosphorus additives on the optimal design of eco-friendly sandwich panels with maximum flame resistance and minimum weight
- Octreotide-conjugated silver nanoparticles for active targeting of somatostatin receptors and their application in a nebulized rat model
- Controllable morphology of Bi2S3 nanostructures formed via hydrothermal vulcanization of Bi2O3 thin-film layer and their photoelectrocatalytic performances
- Development of (−)-epigallocatechin-3-gallate-loaded folate receptor-targeted nanoparticles for prostate cancer treatment
- Enhancement of the mechanical properties of HDPE mineral nanocomposites by filler particles modulation of the matrix plastic/elastic behavior
- Effect of plasticizers on the properties of sugar palm nanocellulose/cinnamon essential oil reinforced starch bionanocomposite films
- Optimization of nano coating to reduce the thermal deformation of ball screws
- Preparation of efficient piezoelectric PVDF–HFP/Ni composite films by high electric field poling
- MHD dissipative Casson nanofluid liquid film flow due to an unsteady stretching sheet with radiation influence and slip velocity phenomenon
- Effects of nano-SiO2 modification on rubberised mortar and concrete with recycled coarse aggregates
- Mechanical and microscopic properties of fiber-reinforced coal gangue-based geopolymer concrete
- Effect of morphology and size on the thermodynamic stability of cerium oxide nanoparticles: Experiment and molecular dynamics calculation
- Mechanical performance of a CFRP composite reinforced via gelatin-CNTs: A study on fiber interfacial enhancement and matrix enhancement
- A practical review over surface modification, nanopatterns, emerging materials, drug delivery systems, and their biophysiochemical properties for dental implants: Recent progresses and advances
- HTR: An ultra-high speed algorithm for cage recognition of clathrate hydrates
- Effects of microalloying elements added by in situ synthesis on the microstructure of WCu composites
- A highly sensitive nanobiosensor based on aptamer-conjugated graphene-decorated rhodium nanoparticles for detection of HER2-positive circulating tumor cells
- Progressive collapse performance of shear strengthened RC frames by nano CFRP
- Core–shell heterostructured composites of carbon nanotubes and imine-linked hyperbranched polymers as metal-free Li-ion anodes
- A Galerkin strategy for tri-hybridized mixture in ethylene glycol comprising variable diffusion and thermal conductivity using non-Fourier’s theory
- Simple models for tensile modulus of shape memory polymer nanocomposites at ambient temperature
- Preparation and morphological studies of tin sulfide nanoparticles and use as efficient photocatalysts for the degradation of rhodamine B and phenol
- Polyethyleneimine-impregnated activated carbon nanofiber composited graphene-derived rice husk char for efficient post-combustion CO2 capture
- Electrospun nanofibers of Co3O4 nanocrystals encapsulated in cyclized-polyacrylonitrile for lithium storage
- Pitting corrosion induced on high-strength high carbon steel wire in high alkaline deaerated chloride electrolyte
- Formulation of polymeric nanoparticles loaded sorafenib; evaluation of cytotoxicity, molecular evaluation, and gene expression studies in lung and breast cancer cell lines
- Engineered nanocomposites in asphalt binders
- Influence of loading voltage, domain ratio, and additional load on the actuation of dielectric elastomer
- Thermally induced hex-graphene transitions in 2D carbon crystals
- The surface modification effect on the interfacial properties of glass fiber-reinforced epoxy: A molecular dynamics study
- Molecular dynamics study of deformation mechanism of interfacial microzone of Cu/Al2Cu/Al composites under tension
- Nanocolloid simulators of luminescent solar concentrator photovoltaic windows
- Compressive strength and anti-chloride ion penetration assessment of geopolymer mortar merging PVA fiber and nano-SiO2 using RBF–BP composite neural network
- Effect of 3-mercapto-1-propane sulfonate sulfonic acid and polyvinylpyrrolidone on the growth of cobalt pillar by electrodeposition
- Dynamics of convective slippery constraints on hybrid radiative Sutterby nanofluid flow by Galerkin finite element simulation
- Preparation of vanadium by the magnesiothermic self-propagating reduction and process control
- Microstructure-dependent photoelectrocatalytic activity of heterogeneous ZnO–ZnS nanosheets
- Cytotoxic and pro-inflammatory effects of molybdenum and tungsten disulphide on human bronchial cells
- Improving recycled aggregate concrete by compression casting and nano-silica
- Chemically reactive Maxwell nanoliquid flow by a stretching surface in the frames of Newtonian heating, nonlinear convection and radiative flux: Nanopolymer flow processing simulation
- Nonlinear dynamic and crack behaviors of carbon nanotubes-reinforced composites with various geometries
- Biosynthesis of copper oxide nanoparticles and its therapeutic efficacy against colon cancer
- Synthesis and characterization of smart stimuli-responsive herbal drug-encapsulated nanoniosome particles for efficient treatment of breast cancer
- Homotopic simulation for heat transport phenomenon of the Burgers nanofluids flow over a stretching cylinder with thermal convective and zero mass flux conditions
- Incorporation of copper and strontium ions in TiO2 nanotubes via dopamine to enhance hemocompatibility and cytocompatibility
- Mechanical, thermal, and barrier properties of starch films incorporated with chitosan nanoparticles
- Mechanical properties and microstructure of nano-strengthened recycled aggregate concrete
- Glucose-responsive nanogels efficiently maintain the stability and activity of therapeutic enzymes
- Tunning matrix rheology and mechanical performance of ultra-high performance concrete using cellulose nanofibers
- Flexible MXene/copper/cellulose nanofiber heat spreader films with enhanced thermal conductivity
- Promoted charge separation and specific surface area via interlacing of N-doped titanium dioxide nanotubes on carbon nitride nanosheets for photocatalytic degradation of Rhodamine B
- Elucidating the role of silicon dioxide and titanium dioxide nanoparticles in mitigating the disease of the eggplant caused by Phomopsis vexans, Ralstonia solanacearum, and root-knot nematode Meloidogyne incognita
- An implication of magnetic dipole in Carreau Yasuda liquid influenced by engine oil using ternary hybrid nanomaterial
- Robust synthesis of a composite phase of copper vanadium oxide with enhanced performance for durable aqueous Zn-ion batteries
- Tunning self-assembled phases of bovine serum albumin via hydrothermal process to synthesize novel functional hydrogel for skin protection against UVB
- A comparative experimental study on damping properties of epoxy nanocomposite beams reinforced with carbon nanotubes and graphene nanoplatelets
- Lightweight and hydrophobic Ni/GO/PVA composite aerogels for ultrahigh performance electromagnetic interference shielding
- Research on the auxetic behavior and mechanical properties of periodically rotating graphene nanostructures
- Repairing performances of novel cement mortar modified with graphene oxide and polyacrylate polymer
- Closed-loop recycling and fabrication of hydrophilic CNT films with high performance
- Design of thin-film configuration of SnO2–Ag2O composites for NO2 gas-sensing applications
- Study on stress distribution of SiC/Al composites based on microstructure models with microns and nanoparticles
- PVDF green nanofibers as potential carriers for improving self-healing and mechanical properties of carbon fiber/epoxy prepregs
- Osteogenesis capability of three-dimensionally printed poly(lactic acid)-halloysite nanotube scaffolds containing strontium ranelate
- Silver nanoparticles induce mitochondria-dependent apoptosis and late non-canonical autophagy in HT-29 colon cancer cells
- Preparation and bonding mechanisms of polymer/metal hybrid composite by nano molding technology
- Damage self-sensing and strain monitoring of glass-reinforced epoxy composite impregnated with graphene nanoplatelet and multiwalled carbon nanotubes
- Thermal analysis characterisation of solar-powered ship using Oldroyd hybrid nanofluids in parabolic trough solar collector: An optimal thermal application
- Pyrene-functionalized halloysite nanotubes for simultaneously detecting and separating Hg(ii) in aqueous media: A comprehensive comparison on interparticle and intraparticle excimers
- Fabrication of self-assembly CNT flexible film and its piezoresistive sensing behaviors
- Thermal valuation and entropy inspection of second-grade nanoscale fluid flow over a stretching surface by applying Koo–Kleinstreuer–Li relation
- Mechanical properties and microstructure of nano-SiO2 and basalt-fiber-reinforced recycled aggregate concrete
- Characterization and tribology performance of polyaniline-coated nanodiamond lubricant additives
- Combined impact of Marangoni convection and thermophoretic particle deposition on chemically reactive transport of nanofluid flow over a stretching surface
- Spark plasma extrusion of binder free hydroxyapatite powder
- An investigation on thermo-mechanical performance of graphene-oxide-reinforced shape memory polymer
- Effect of nanoadditives on the novel leather fiber/recycled poly(ethylene-vinyl-acetate) polymer composites for multifunctional applications: Fabrication, characterizations, and multiobjective optimization using central composite design
- Design selection for a hemispherical dimple core sandwich panel using hybrid multi-criteria decision-making methods
- Improving tensile strength and impact toughness of plasticized poly(lactic acid) biocomposites by incorporating nanofibrillated cellulose
- Green synthesis of spinel copper ferrite (CuFe2O4) nanoparticles and their toxicity
- The effect of TaC and NbC hybrid and mono-nanoparticles on AA2024 nanocomposites: Microstructure, strengthening, and artificial aging
- Excited-state geometry relaxation of pyrene-modified cellulose nanocrystals under UV-light excitation for detecting Fe3+
- Effect of CNTs and MEA on the creep of face-slab concrete at an early age
- Effect of deformation conditions on compression phase transformation of AZ31
- Application of MXene as a new generation of highly conductive coating materials for electromembrane-surrounded solid-phase microextraction
- A comparative study of the elasto-plastic properties for ceramic nanocomposites filled by graphene or graphene oxide nanoplates
- Encapsulation strategies for improving the biological behavior of CdS@ZIF-8 nanocomposites
- Biosynthesis of ZnO NPs from pumpkin seeds’ extract and elucidation of its anticancer potential against breast cancer
- Preliminary trials of the gold nanoparticles conjugated chrysin: An assessment of anti-oxidant, anti-microbial, and in vitro cytotoxic activities of a nanoformulated flavonoid
- Effect of micron-scale pores increased by nano-SiO2 sol modification on the strength of cement mortar
- Fractional simulations for thermal flow of hybrid nanofluid with aluminum oxide and titanium oxide nanoparticles with water and blood base fluids
- The effect of graphene nano-powder on the viscosity of water: An experimental study and artificial neural network modeling
- Development of a novel heat- and shear-resistant nano-silica gelling agent
- Characterization, biocompatibility and in vivo of nominal MnO2-containing wollastonite glass-ceramic
- Entropy production simulation of second-grade magnetic nanomaterials flowing across an expanding surface with viscidness dissipative flux
- Enhancement in structural, morphological, and optical properties of copper oxide for optoelectronic device applications
- Aptamer-functionalized chitosan-coated gold nanoparticle complex as a suitable targeted drug carrier for improved breast cancer treatment
- Performance and overall evaluation of nano-alumina-modified asphalt mixture
- Analysis of pure nanofluid (GO/engine oil) and hybrid nanofluid (GO–Fe3O4/engine oil): Novel thermal and magnetic features
- Synthesis of Ag@AgCl modified anatase/rutile/brookite mixed phase TiO2 and their photocatalytic property
- Mechanisms and influential variables on the abrasion resistance hydraulic concrete
- Synergistic reinforcement mechanism of basalt fiber/cellulose nanocrystals/polypropylene composites
- Achieving excellent oxidation resistance and mechanical properties of TiB2–B4C/carbon aerogel composites by quick-gelation and mechanical mixing
- Microwave-assisted sol–gel template-free synthesis and characterization of silica nanoparticles obtained from South African coal fly ash
- Pulsed laser-assisted synthesis of nano nickel(ii) oxide-anchored graphitic carbon nitride: Characterizations and their potential antibacterial/anti-biofilm applications
- Effects of nano-ZrSi2 on thermal stability of phenolic resin and thermal reusability of quartz–phenolic composites
- Benzaldehyde derivatives on tin electroplating as corrosion resistance for fabricating copper circuit
- Mechanical and heat transfer properties of 4D-printed shape memory graphene oxide/epoxy acrylate composites
- Coupling the vanadium-induced amorphous/crystalline NiFe2O4 with phosphide heterojunction toward active oxygen evolution reaction catalysts
- Graphene-oxide-reinforced cement composites mechanical and microstructural characteristics at elevated temperatures
- Gray correlation analysis of factors influencing compressive strength and durability of nano-SiO2 and PVA fiber reinforced geopolymer mortar
- Preparation of layered gradient Cu–Cr–Ti alloy with excellent mechanical properties, thermal stability, and electrical conductivity
- Recovery of Cr from chrome-containing leather wastes to develop aluminum-based composite material along with Al2O3 ceramic particles: An ingenious approach
- Mechanisms of the improved stiffness of flexible polymers under impact loading
- Anticancer potential of gold nanoparticles (AuNPs) using a battery of in vitro tests
- Review Articles
- Proposed approaches for coronaviruses elimination from wastewater: Membrane techniques and nanotechnology solutions
- Application of Pickering emulsion in oil drilling and production
- The contribution of microfluidics to the fight against tuberculosis
- Graphene-based biosensors for disease theranostics: Development, applications, and recent advancements
- Synthesis and encapsulation of iron oxide nanorods for application in magnetic hyperthermia and photothermal therapy
- Contemporary nano-architectured drugs and leads for ανβ3 integrin-based chemotherapy: Rationale and retrospect
- State-of-the-art review of fabrication, application, and mechanical properties of functionally graded porous nanocomposite materials
- Insights on magnetic spinel ferrites for targeted drug delivery and hyperthermia applications
- A review on heterogeneous oxidation of acetaminophen based on micro and nanoparticles catalyzed by different activators
- Early diagnosis of lung cancer using magnetic nanoparticles-integrated systems
- Advances in ZnO: Manipulation of defects for enhancing their technological potentials
- Efficacious nanomedicine track toward combating COVID-19
- A review of the design, processes, and properties of Mg-based composites
- Green synthesis of nanoparticles for varied applications: Green renewable resources and energy-efficient synthetic routes
- Two-dimensional nanomaterial-based polymer composites: Fundamentals and applications
- Recent progress and challenges in plasmonic nanomaterials
- Apoptotic cell-derived micro/nanosized extracellular vesicles in tissue regeneration
- Electronic noses based on metal oxide nanowires: A review
- Framework materials for supercapacitors
- An overview on the reproductive toxicity of graphene derivatives: Highlighting the importance
- Antibacterial nanomaterials: Upcoming hope to overcome antibiotic resistance crisis
- Research progress of carbon materials in the field of three-dimensional printing polymer nanocomposites
- A review of atomic layer deposition modelling and simulation methodologies: Density functional theory and molecular dynamics
- Recent advances in the preparation of PVDF-based piezoelectric materials
- Recent developments in tensile properties of friction welding of carbon fiber-reinforced composite: A review
- Comprehensive review of the properties of fly ash-based geopolymer with additive of nano-SiO2
- Perspectives in biopolymer/graphene-based composite application: Advances, challenges, and recommendations
- Graphene-based nanocomposite using new modeling molecular dynamic simulations for proposed neutralizing mechanism and real-time sensing of COVID-19
- Nanotechnology application on bamboo materials: A review
- Recent developments and future perspectives of biorenewable nanocomposites for advanced applications
- Nanostructured lipid carrier system: A compendium of their formulation development approaches, optimization strategies by quality by design, and recent applications in drug delivery
- 3D printing customized design of human bone tissue implant and its application
- Design, preparation, and functionalization of nanobiomaterials for enhanced efficacy in current and future biomedical applications
- A brief review of nanoparticles-doped PEDOT:PSS nanocomposite for OLED and OPV
- Nanotechnology interventions as a putative tool for the treatment of dental afflictions
- Recent advancements in metal–organic frameworks integrating quantum dots (QDs@MOF) and their potential applications
- A focused review of short electrospun nanofiber preparation techniques for composite reinforcement
- Microstructural characteristics and nano-modification of interfacial transition zone in concrete: A review
- Latest developments in the upconversion nanotechnology for the rapid detection of food safety: A review
- Strategic applications of nano-fertilizers for sustainable agriculture: Benefits and bottlenecks
- Molecular dynamics application of cocrystal energetic materials: A review
- Synthesis and application of nanometer hydroxyapatite in biomedicine
- Cutting-edge development in waste-recycled nanomaterials for energy storage and conversion applications
- Biological applications of ternary quantum dots: A review
- Nanotherapeutics for hydrogen sulfide-involved treatment: An emerging approach for cancer therapy
- Application of antibacterial nanoparticles in orthodontic materials
- Effect of natural-based biological hydrogels combined with growth factors on skin wound healing
- Nanozymes – A route to overcome microbial resistance: A viewpoint
- Recent developments and applications of smart nanoparticles in biomedicine
- Contemporary review on carbon nanotube (CNT) composites and their impact on multifarious applications
- Interfacial interactions and reinforcing mechanisms of cellulose and chitin nanomaterials and starch derivatives for cement and concrete strength and durability enhancement: A review
- Diamond-like carbon films for tribological modification of rubber
- Layered double hydroxides (LDHs) modified cement-based materials: A systematic review
- Recent research progress and advanced applications of silica/polymer nanocomposites
- Modeling of supramolecular biopolymers: Leading the in silico revolution of tissue engineering and nanomedicine
- Recent advances in perovskites-based optoelectronics
- Biogenic synthesis of palladium nanoparticles: New production methods and applications
- A comprehensive review of nanofluids with fractional derivatives: Modeling and application
- Electrospinning of marine polysaccharides: Processing and chemical aspects, challenges, and future prospects
- Electrohydrodynamic printing for demanding devices: A review of processing and applications
- Rapid Communications
- Structural material with designed thermal twist for a simple actuation
- Recent advances in photothermal materials for solar-driven crude oil adsorption