Effect of deformation conditions on compression phase transformation of AZ31
-
Qianhua Yang
 ,
Chun Xue
,
Chun Xue

Abstract
In this article, the compression simulation of AZ31 magnesium alloy is simulated by the molecular dynamics method. The effects of loading mode, temperature, and strain rate on the compression behavior are analyzed. The lattice distortion, mechanical behavior, structural evolution, and dislocation evolution in the compression process are deeply analyzed, and the results of different loading modes are obtained. The hexagonal close-packed (HCP) → face-centered cubic (FCC) phase transformation mechanism of AZ31 magnesium alloy during compression at temperature and strain rate, which is related to the mechanical behavior, has been studied completely. This article perfects the research on the compression behavior of magnesium alloys, excavates the application potential of magnesium alloys, and provides a new idea for improving the processing technology and developing high-performance magnesium alloys.
1 Introduction
Magnesium and magnesium alloys have excellent physical and mechanical properties, high specific strength, good thermal conductivity, and some more properties. They are important and excellent materials for automotive and aerospace industry structures [1,2,3,4,5,6,7,8,9]. Mg–Al–Zn magnesium alloy is currently one of the most widely used magnesium alloy series [10], of which the most representative is AZ31 wrought magnesium alloy. However, the large-scale commercial application of mg-based alloys still faces some obstacles [11,12,13]. To further improve the strength of magnesium alloy, it is necessary to fully understand the influence of microstructure and dislocation evolution on the strength [14]. Magnesium alloys have a hexagonal closely packed structure [15], and its deformation mechanism is closely related to stress/strain state, temperature, and strain rate. Plastic deformation still plays a key role in the strengthening of the hexagonal close-packed (HCP) phase [16,17]. Grain refinement of magnesium alloys, especially magnesium–aluminum (Mg–Al) alloys, is the most effective method to improve strength [18].
Integrated computational material engineering has become a reliable tool to establish the relationship between structure, process, and properties, which will promote the development and the application of new magnesium alloys to a great extent [19,20,21]. Among them, molecular dynamics (MD) simulation, as an important method in the study of plastic deformation mechanism at micro- and nano-scale in metal materials [22,23,24,25], can predict the effects of grain size, grain boundaries, stacking faults, and dislocations on the deformation behavior of materials at the atomic level [26,27,28,29,30,31,32,33,34,35,36,37]. MD simulations show that grain boundaries are the origin of dislocations in nanomaterials [38]. The nucleation and diffusion of some Shockley dislocations are caused by grain boundary (GB) deformation, that is, the position migration under the action of atomic phase transformation and stress [39,40]. Therefore, the study of dislocation evolution mechanism and phase transformation mechanism is of great significance to the total plastic deformation [41].
Rajput and Paul [42] studied the effect of uniaxial and plane strain tensile deformation on the mechanical behavior of nanocrystalline copper and found that the yield of the material begins with the nucleation of Shockley partial dislocations, and the subsequent deformation leads to the increase of dislocation line length in the material. The nucleation and diffusion of dislocations and stacking faults jointly control the strain hardening behavior of materials. The uneven distribution of atomic strain and dislocation was observed in uniaxial and plane strain tensile deformation. Higher GB migration was observed during uniaxial tensile deformation. Vlasova [43] investigated the deformation characteristics of nanocrystalline magnesium under high-speed deformation by MD simulation. Uniaxial compression and plane strain compression (PSC) of [0001]-nanocrystalline magnesium were carried out, and the effects of loading methods on the deformation and strength properties of [0001]-nanocrystalline magnesium were investigated. Paul et al. [44] studied the deformation mechanism and pore nucleation of nanocrystalline aluminum under uniaxial and plane strain loading. Compared with uniaxial loading, nanocavities nucleate earlier under plane strain loading. Zhang et al. [45] studied the micro-mechanical behavior of Cu/Ti laminated composites during uniaxial tension and PSC by the MD method and revealed the microdeformation mechanism of closely packed hexagonal metal laminated composites.
To sum up, the compression simulation of AZ31 magnesium alloy is simulated by the MD method, the effects of loading mode, temperature, and strain rate on the compression behavior are analyzed, the lattice distortion, mechanical behavior, structural evolution, and dislocation evolution in the compression process are deeply analyzed, and different loading modes are obtained. The HCP → face-centered cubic (FCC) phase transformation mechanism of AZ31 magnesium alloy during compression at temperature and strain rate, which is related to the mechanical behavior, has been studied completely. This article studies the compression behavior of magnesium alloys, excavates the application potential of magnesium alloys, and provides a new idea for improving the processing technology and developing high-performance magnesium alloys.
2 Simulation method
The potential function is a mathematical function that describes the total energy E and particle coordinates (r) of the model particles in the study of MD [46,47,48,49]. The modified embedded atomic method potential function can be used to calculate the pairwise interactions of various materials, which is more suitable for the calculation of metals and alloys with FCC, body-centered cubic (BCC), HCP, and diamond structures [50,51,52,53,54,55,56]. Eq. (1) for modified embedded atom method is given as follows:
In Eq. (1), E is the total energy of atom i, F is the embedded energy and is the function of atomic electron density ρ, ρ is the atomic electron density, γ and ϕ is a pair of potential interactions, and α and β is the element type of atoms i and j.
The model of AZ31 magnesium alloy was established by Atomsk [57], and the X-axis, Y-axis, and Z-axis were set to correspond to [1̅21̅0], [1̅010], and [0001], respectively. The model is imported into large-scale atomic/molecular massively parallel simulator (LAMMPS) [58] for MD simulation. The potential function developed by Stukowski [59] can be used to study the deformation and recrystallization characteristics of Mg–Al–Zn alloy in the whole processing temperature range, and so this potential function is used for calculation. X, Y, and Z are all periodic boundary conditions, constant-pressure, constant-temperature (NPT) ensemble is adopted, and the time step is 0.001 ps. The NPT ensemble and the nose-hoover thermostat maintain the stability of the entire system at constant pressure and temperature. The conjugate gradient algorithm is used to minimize the model energy to obtain the equilibrium structure at a given temperature in the NPT ensemble. Therefore, the model is first relaxed 10 ps under constant temperature and pressure, and then different deformation conditions are imposed, the deformation time is 20 ps, and the final deformation of magnesium alloy reaches 20%. The deformation Eq. (2) is expressed as follows:
In Eq. (2), ε is strain; L 1 is the initial length of the model in [0001] crystal direction; and L 2 is the length of the model compressed along the [0001] crystal direction.
The results are imported into the visualization software OVITO for analysis. Common neighbor analysis (CNA) can observe the face-centered cubic, body-centered cubic, closely packed hexagonal (HCP) structure, and other structure (GB atoms) in the metal. DXA (dislocation analysis) can determine the Burgers vector of each dislocation and identify the dislocation junction. Grain segmentation can observe the grain changes in the simulation process. Construct surface mesh can identify the cavity and calculate the cavity area [60,61,62,63,64,65].
3 Results and analysis
3.1 Influence of compression mode on phase transition
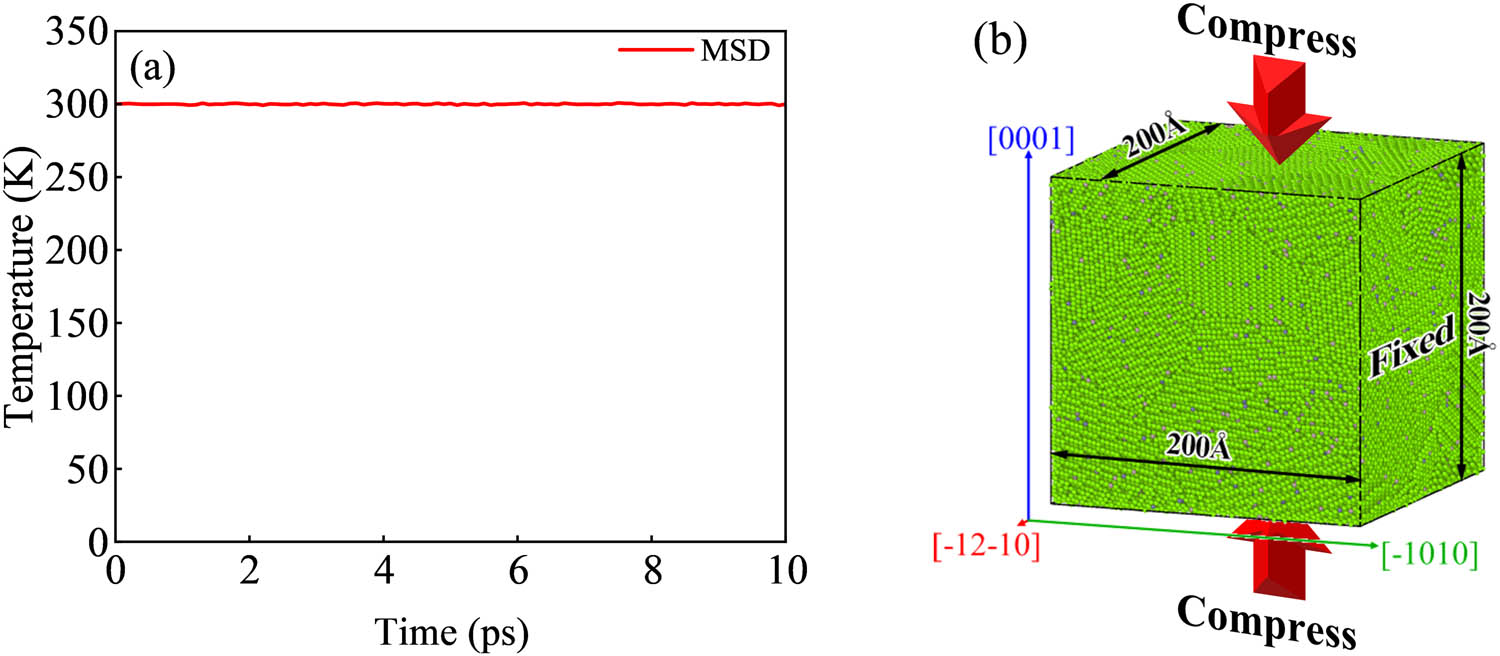
The model of AZ31 magnesium alloy with a size of 192.6 Å × 222.395 Å × 208.4 Å is established, in which 96% are Mg atoms, 3% are Al atoms, and 1% are Zn atoms. The model contains 20 grains, and the X-axis, Y-axis, and Z-axis are set to correspond to the crystal directions of [1̅21̅0], [1̅010], and [0001], respectively. Import the model into LAMMPS and then assign the potential function developed by Hyo-Sun Jang to the model. X, Y, and Z are all periodic boundary conditions, and the time step is 0.001 ps. The model energy is minimized and 10 ps is relaxed at 300 K. The temperature change in the relaxation process is shown in Figure 1a. The model is uniformly compressed 20 ps along the Z-axis ([0001] direction) at 300 K with the strain rate of 0.01 ps−1, and the uniaxial compression simulation (UC) is realized. The process diagram is shown in Figure 1b.

Uniaxial compression: (a) the change of temperature during relaxation and (b) process diagram.
The model of AZ31 magnesium alloy with a size of 200 Å × 200 Å × 200 Å is established, in which 96% are Mg atoms, 3% are Al atoms, and 1% are Zn atoms. The model contains 20 grains, and the X-axis, Y-axis, and Z-axis are set to correspond to the crystal directions of [1̅21̅0], [1̅010], and [0001], respectively. The MD simulation is carried out by LAMMPS, and the potential function developed by Jang is assigned to the model. X, Y, and Z are all periodic boundary conditions, the time step is 0.001 ps, and the 10 ps is relaxed at 300 K. The change of temperature during the relaxation process is shown in Figure 2a. Keeping the size of the Y-axis model unchanged, the model is uniformly compressed 20 ps along the Z-axis ([0001] direction) at the strain rate of 0.01 ps−1 at 300 K, and the PSC simulation is realized. The process diagram is shown in Figure 2b.
Plane strain compression: (a) the change of temperature during relaxation and (b) process diagram.
Figure 3 shows the grain change, Figure 3a shows the grain number curve, Figure 3b shows the grains at different strains under PSC, and Figure 3c shows the grains at different strains under UC. It can be seen that under PSC, the grain number is more, the grain volume is smaller, the grain refinement is more obvious, and the grain refinement occurs earlier.

Grain change: (a) grain number curve, (b) grain change under PSC, and (c) grain change under UC.
Figure 4 shows parameter changes during compression. Figure 4a shows the stress–strain curve. The yield stress under PSC is 2.85 GPa, and the yield stress under UC is 1.92 GPa, which increases by 48.43%. The yield strain under PSC is 10.2%, and the yield strain under UC is 9.6%, with an increase of 6.25%. The elastic modulus of PSC is larger, which means that PSC can improve the plasticity of AZ31 magnesium alloy. Figure 4b shows the dislocation density curve. The dislocation occurs earlier, and the dislocation density is higher in AZ31 magnesium alloy under PSC.
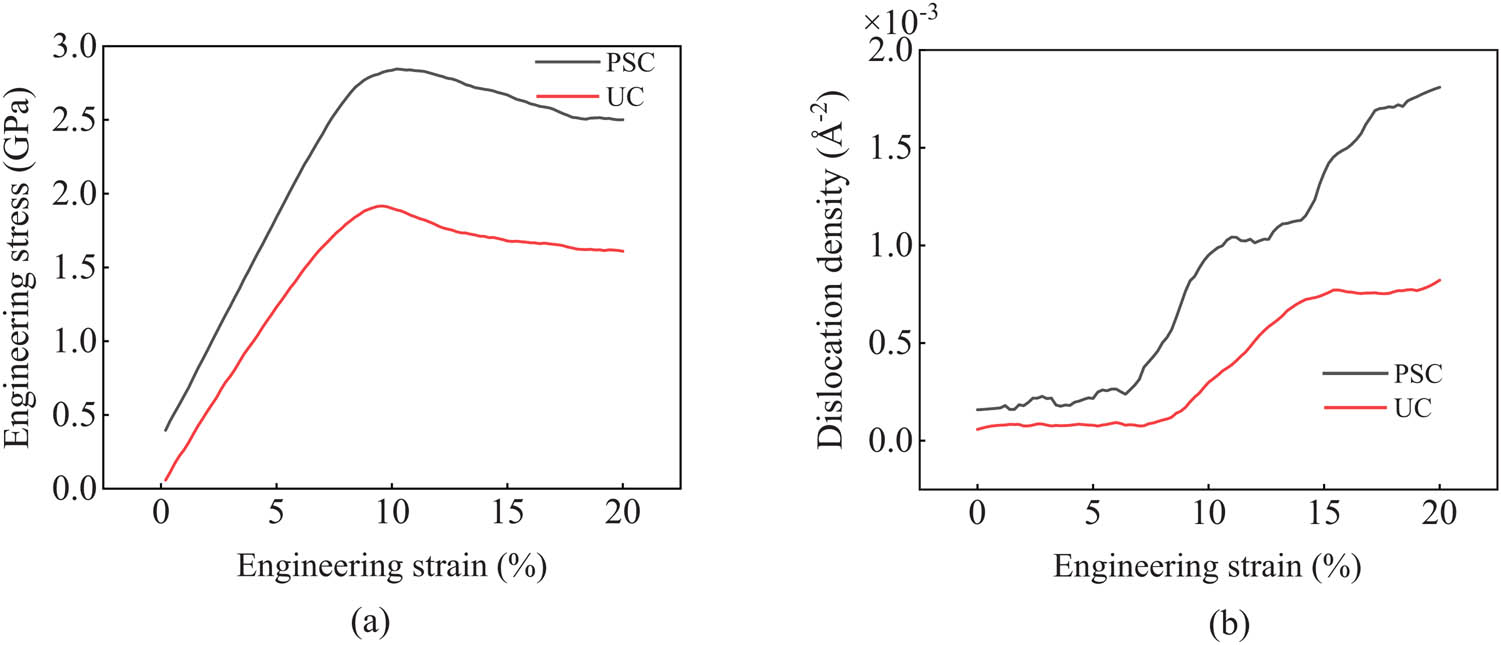
Parameter changes during compression: (a) stress–strain curve and (b) dislocation density curve.
Figure 5 shows cavity evolution. Figure 5a shows the curve of the cavity area, Figure 5b shows the evolution of the cavity under PSC, and Figure 5c shows the evolution of the cavity under UC. It can be found that cavity appears earlier in magnesium alloys under PSC, the time of cavity appearing is almost consistent with the time of dislocation increase, and the cavty area formed under PSC is larger. Therefore, in the PSC process, because the Y direction is fixed, the atomic position changes faster, forming dislocations and cavity, and at the same time, the yield stress of magnesium alloy increases.

Cavity evolution: (a) cavity area curve, (b) cavity evolution under PSC, and (c) cavity evolution under UC.
Figure 6 shows GB evolution. Figure 6a shows the atomic fraction curve within the grain, and Figure 6b shows the atomic fraction curve of the GB. The GB diffusion of magnesium alloy occurs earlier under PSC, and the rate and degree of diffusion are higher than that of UC. Figure 6c and d are CNA diagrams of PSC and UC, respectively, in which the red atom is the HCP structure, the green atom is FCC structure, and the white atom is GB atom. It is obvious that with the increase in compression, the number of atoms in the GB increases, the GB diffuses, and the atoms of the FCC structure increase gradually, and the FCC stacking faults increase. The FCC stacking fault first forms at the GB and then expands into the grain. The formation principle is as follows: due to the compression, the position of the HCP structure atom changes and becomes the GB atom. With the increase in the squeezing amount, the GB atom forms an FCC stacking fault.

Grain boundary evolution: (a) fraction curve of GI atoms, (b) fraction curve of GB atoms (c) figure of CNA under PSC and (d) figure of CNA in UC.
Figure 7 shows structural evolution. Figure 7a–c shows the fractional curve of HCP, FCC, and BCC structure, respectively. It can be seen that the change of grain internal (GI) atoms curve is mainly caused by HCP structure and FCC structure, while the proportion of the BCC structure is very small. The structural change of PSC is earlier than that of UC, and the number of BCC atoms in PSC is slightly more than that of UC. The changes of HCP structure and FCC structure are earlier than the occurrence of plastic deformation. In the process of compression, the atoms of the HCP structure first become GB atoms. With the increase in the amount of compression, the position of GB atoms continues to change, and some atoms form FCC stacking faults. Figure 7d–f shows the evolution diagram of each structure under PSC, and Figure 7g–i shows the evolution diagram of each structure under UC. It can be seen that under PSC, the occurrence of FCC stacking fault is earlier than that of UC and the occurrence of the BCC structure is earlier than that of UC. The FCC stacking fault occurs between the HCP structure and the GB, so that the phase structure transformation of HCP → GB → FCC occurs during compression.

Structural evolution: (a) HCP structure fraction curve, (b) FCC structure fraction curve, (c) BCC structure fraction curve, (d)–(f) structural evolution diagram under PSC, and (g)–(i) structural evolution diagram under UC.
Figure 8 shows dislocation evolution. Figure 8a and b shows the dislocation evolution diagrams under PSC and UC, respectively. With the increase in the amount of squeezing, the atomic position changes, and the dislocation density increases. Figure 8c and d shows the dislocation density curves under PSC and UC, respectively. It is found that the dislocations in the model are mainly other dislocations and

Dislocation evolution: (a) dislocation evolution diagram under PSC, (b) dislocation evolution diagram under UC, (c) dislocation density curve under PSC, and (d) dislocation density curve under UC.
Bergson marks of common dislocations in hexagonal close packed crystals [67]
| Mark |
|
|
|
|
|
|
|---|---|---|---|---|---|---|
|
|
|
|
|
|
|
|
3.2 Effect of temperature on phase transition under PSC
The AZ31 magnesium alloy model with a size of 200 Å × 200 Å × 200 Å is imported into LAMMPS, then the potential function is assigned to the model, X, Y, and Z are all set as periodic boundary conditions, NPT ensemble is adopted, the time step is 0.001 ps, and the 10 ps is relaxed under 300–700 K, respectively. The change of temperature during the relaxation process is shown in Figure 9. Then, keeping the size of the Y-axis model unchanged, the PSC is realized by uniformly compressing 20 ps along the Z-axis ([0001] direction) at the strain rate of 0.01 ps−1.
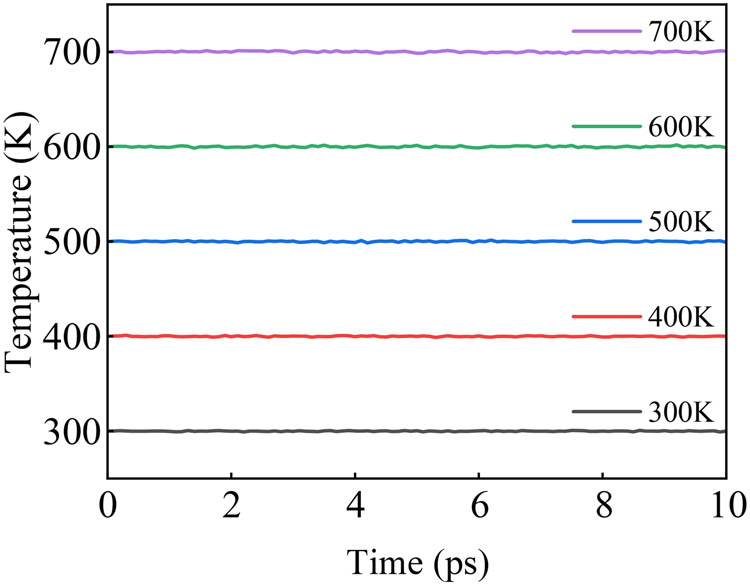
Temperature change during relaxation.
Figure 10 shows the grain evolution, Figure 10(a) shows the grain diagram, and Figure 10(b) shows the grain curve. It can be seen that the change in the number of grains is not very obvious with the change of temperature, and the number of grains at different temperatures is roughly the same. Therefore, it is speculated that temperature has little effect on grain refinement.
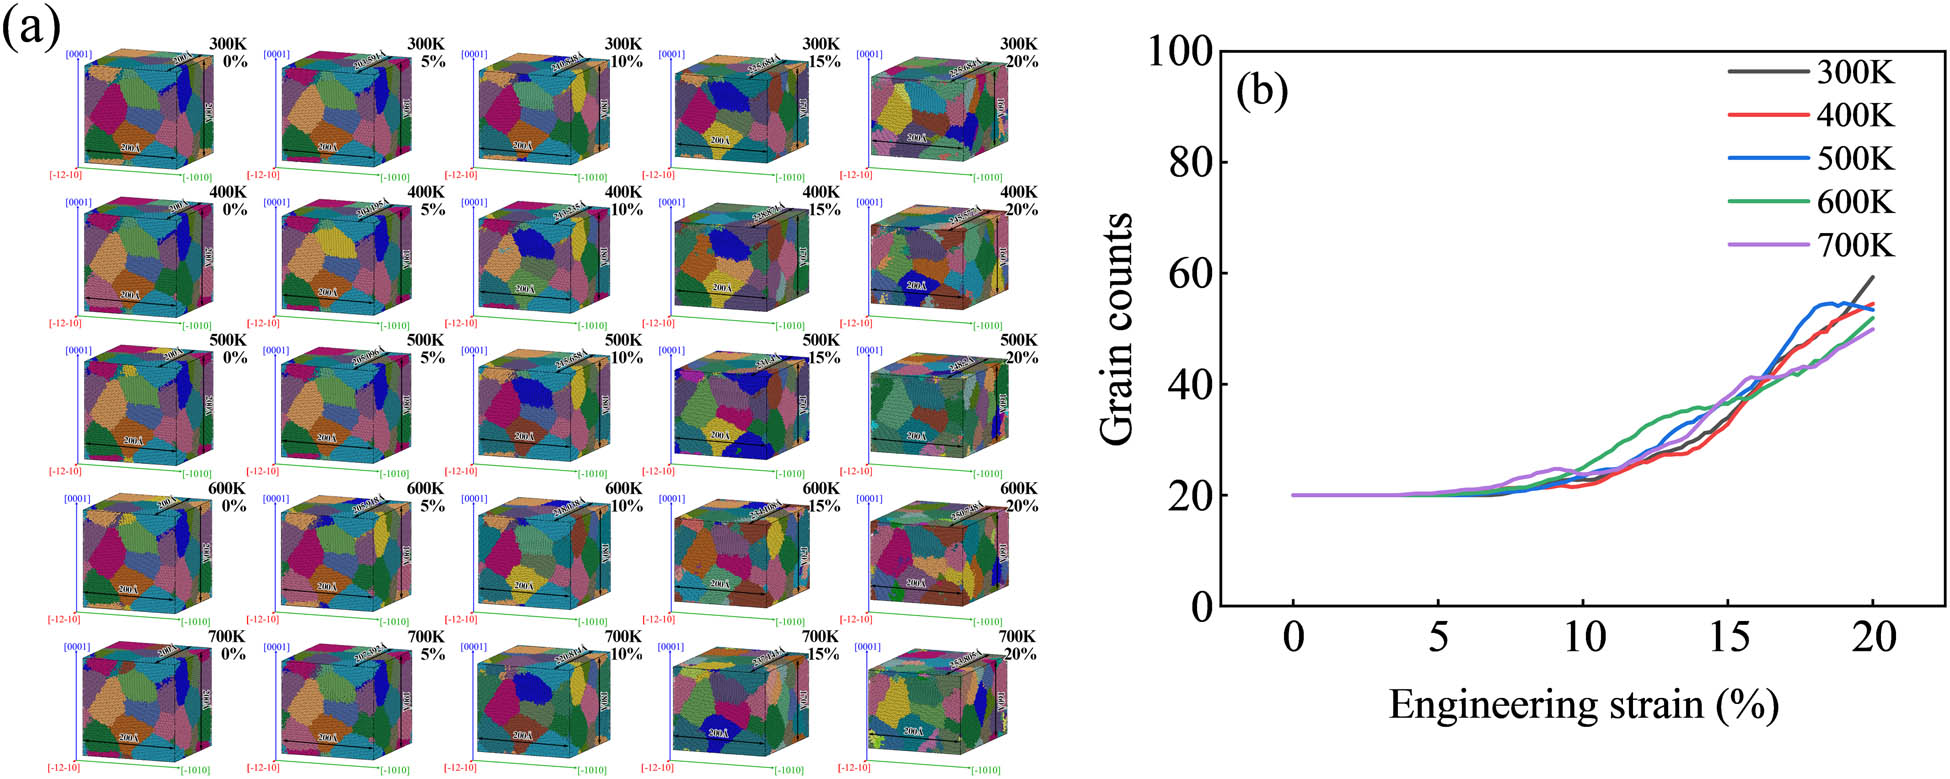
Grain evolution: (a) grain diagram and (b) grain number curve.
Figure 11 shows the force–energy parameter curve under PSC, and Figure 11a shows the stress–strain curve. With the increase in temperature, the initial stress increases, the yield stress decreases, and the elastic modulus decreases. In the PSC process, with the increase in temperature, the potential energy of AZ31 magnesium alloy increases and plastic deformation occurs more easily, so the yield stress and yield strain decrease with the increase in temperature. Figure 11b shows the potential energy curve. The higher the temperature is, the more energy is obtained and the greater the potential energy is. Figure 11c is a volume curve. With the increase in the amount of compression, the elastic deformation first occurs and the volume decreases. When the strain reaches the yield strain, the volume begins to increase when the strain reaches the plastic stage. The higher the temperature is, the shorter the elastic stage is and the smaller the volume change is. Figure 11d shows the total dislocation density curve. With the increase in the amount of compression, the atomic position changes, and the total dislocation density increases.
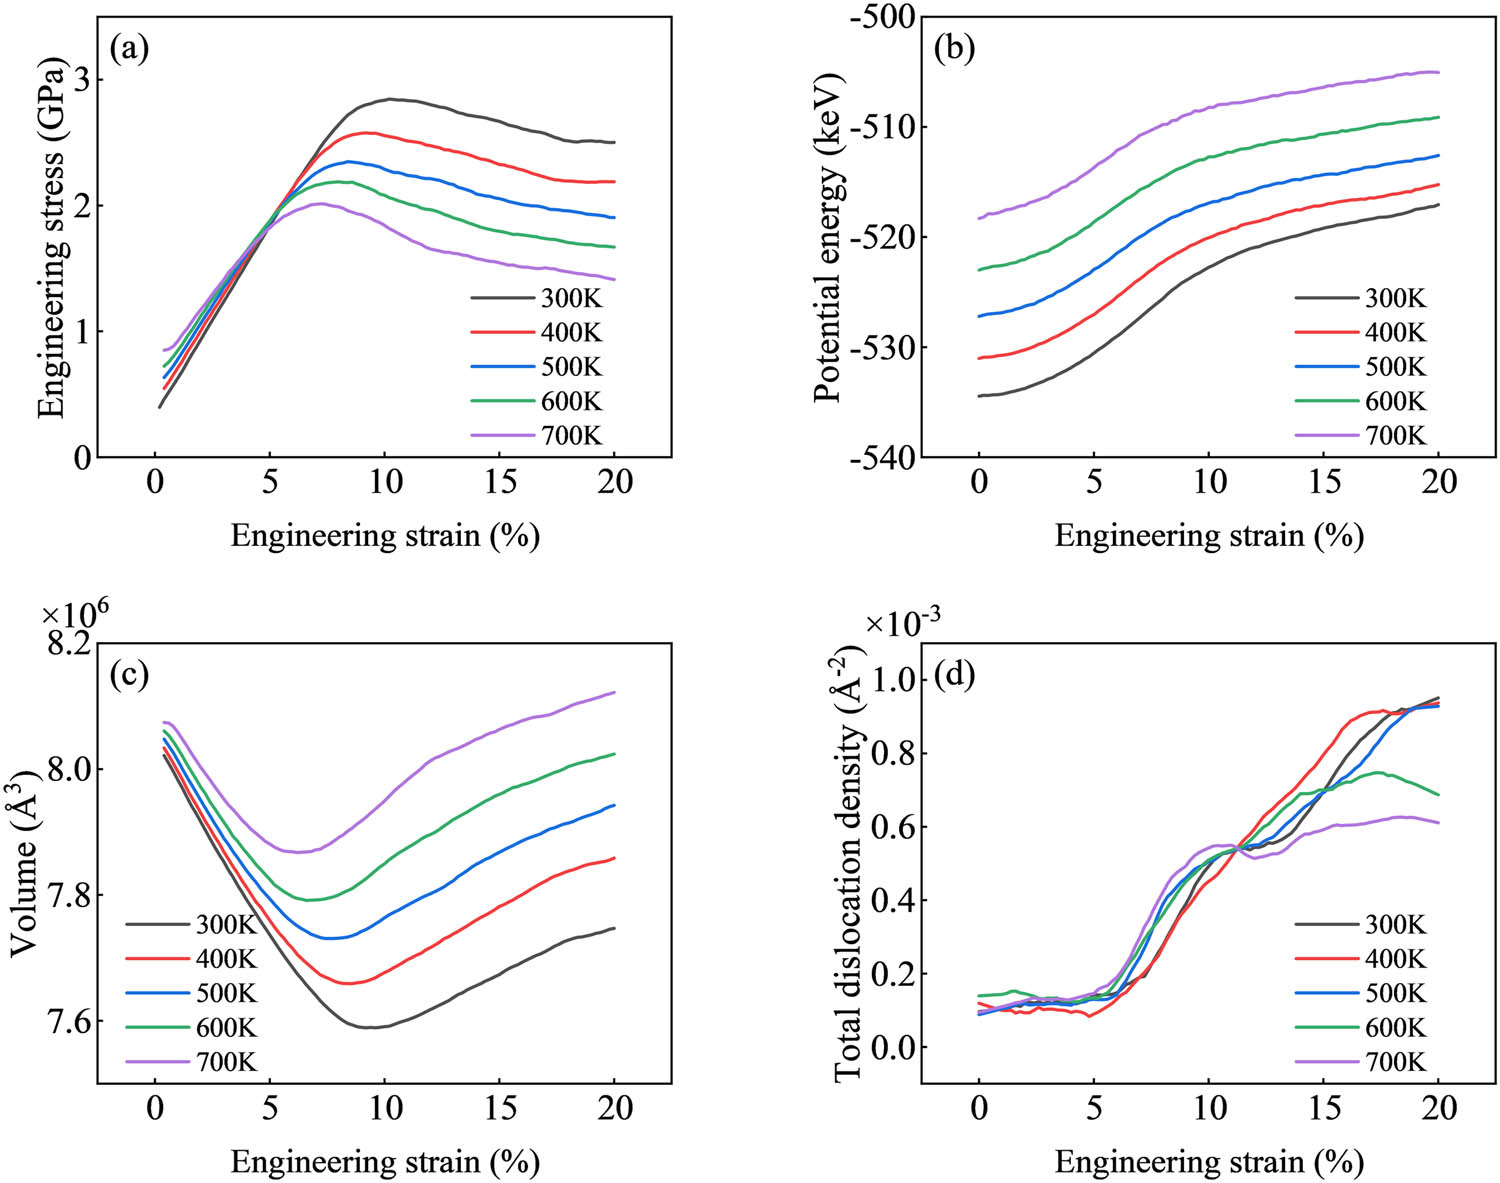
Force energy parameter curve: (a) stress–strain curve, (b) potential energy curve, (c) volume curve, and (d) total dislocation density curve.
Figure 12 shows the evolution of the cavity, Figure 12a shows the cavity, and Figure 12b shows the cavity curve. It can be seen that cavityies appear at the same time as the yield time of magnesium alloy; so in the process of compression, cavities are generated with the change of atomic position, and at the end of elastic deformation, magnesium alloys begin to yield and enter the plastic stage, the number of cavity increases, and the area increases, increasing the overall volume of magnesium alloys.
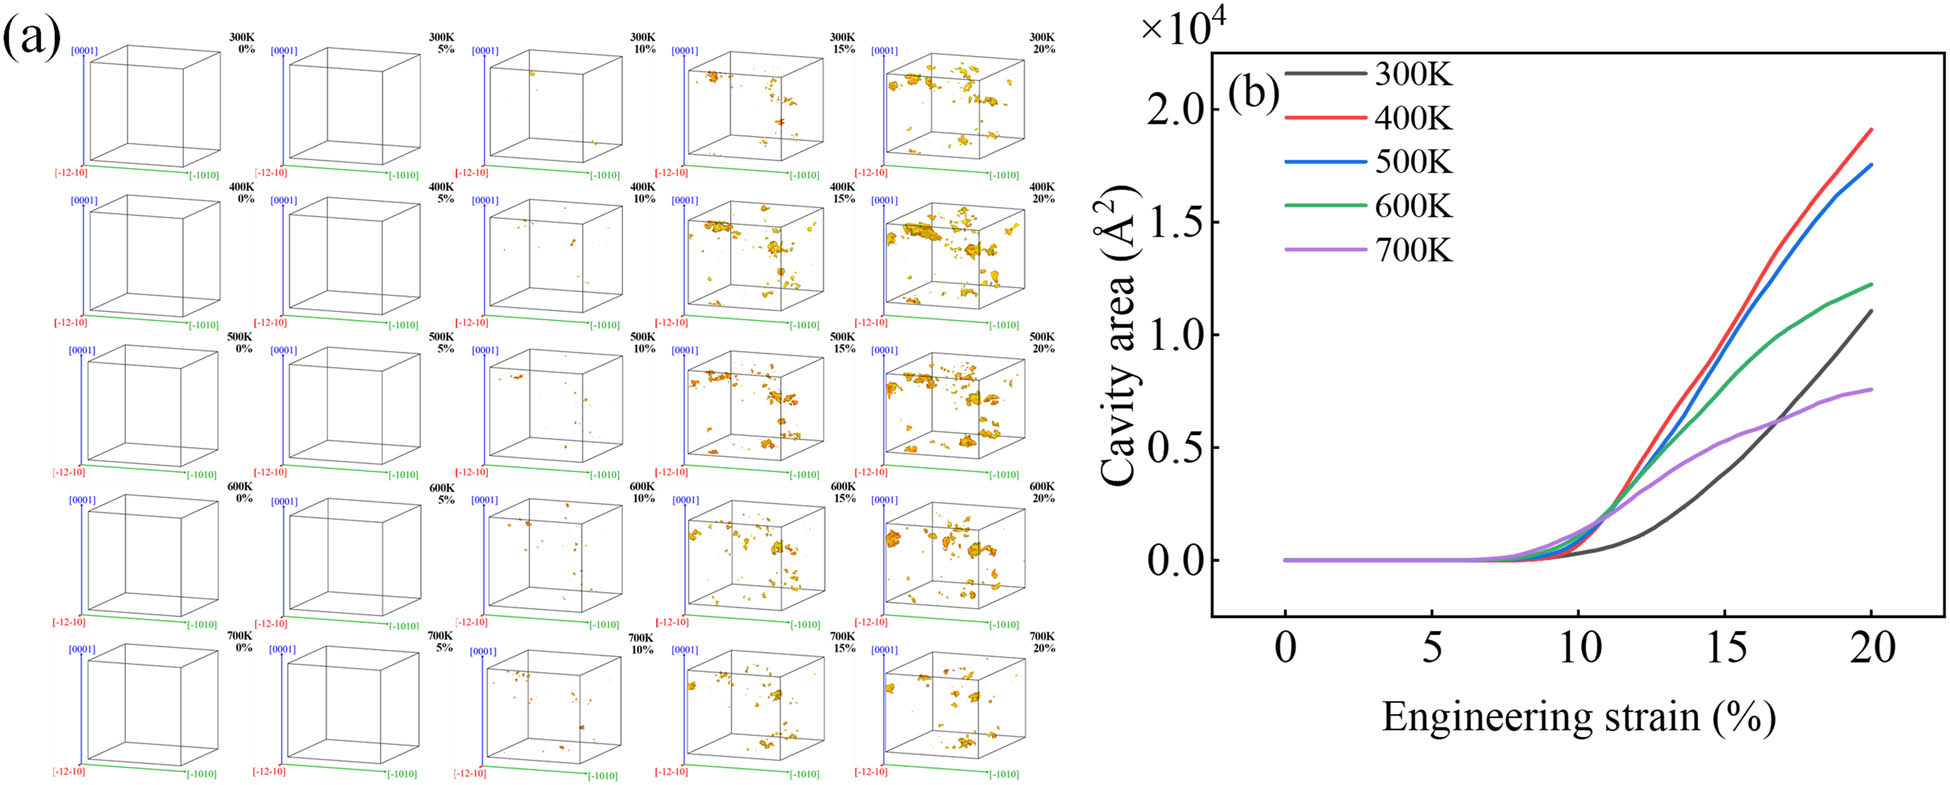
Cavity evolution: (a) cavity diagram and (b) cavity curve.
Figure 13 shows the evolution of grain boundaries under PSC, and Figure 13a shows the diagram of CNA. It is obvious that with the increase in compression, the number of atoms in the FCC structure increases, and the number of atoms in grain boundaries increases. When
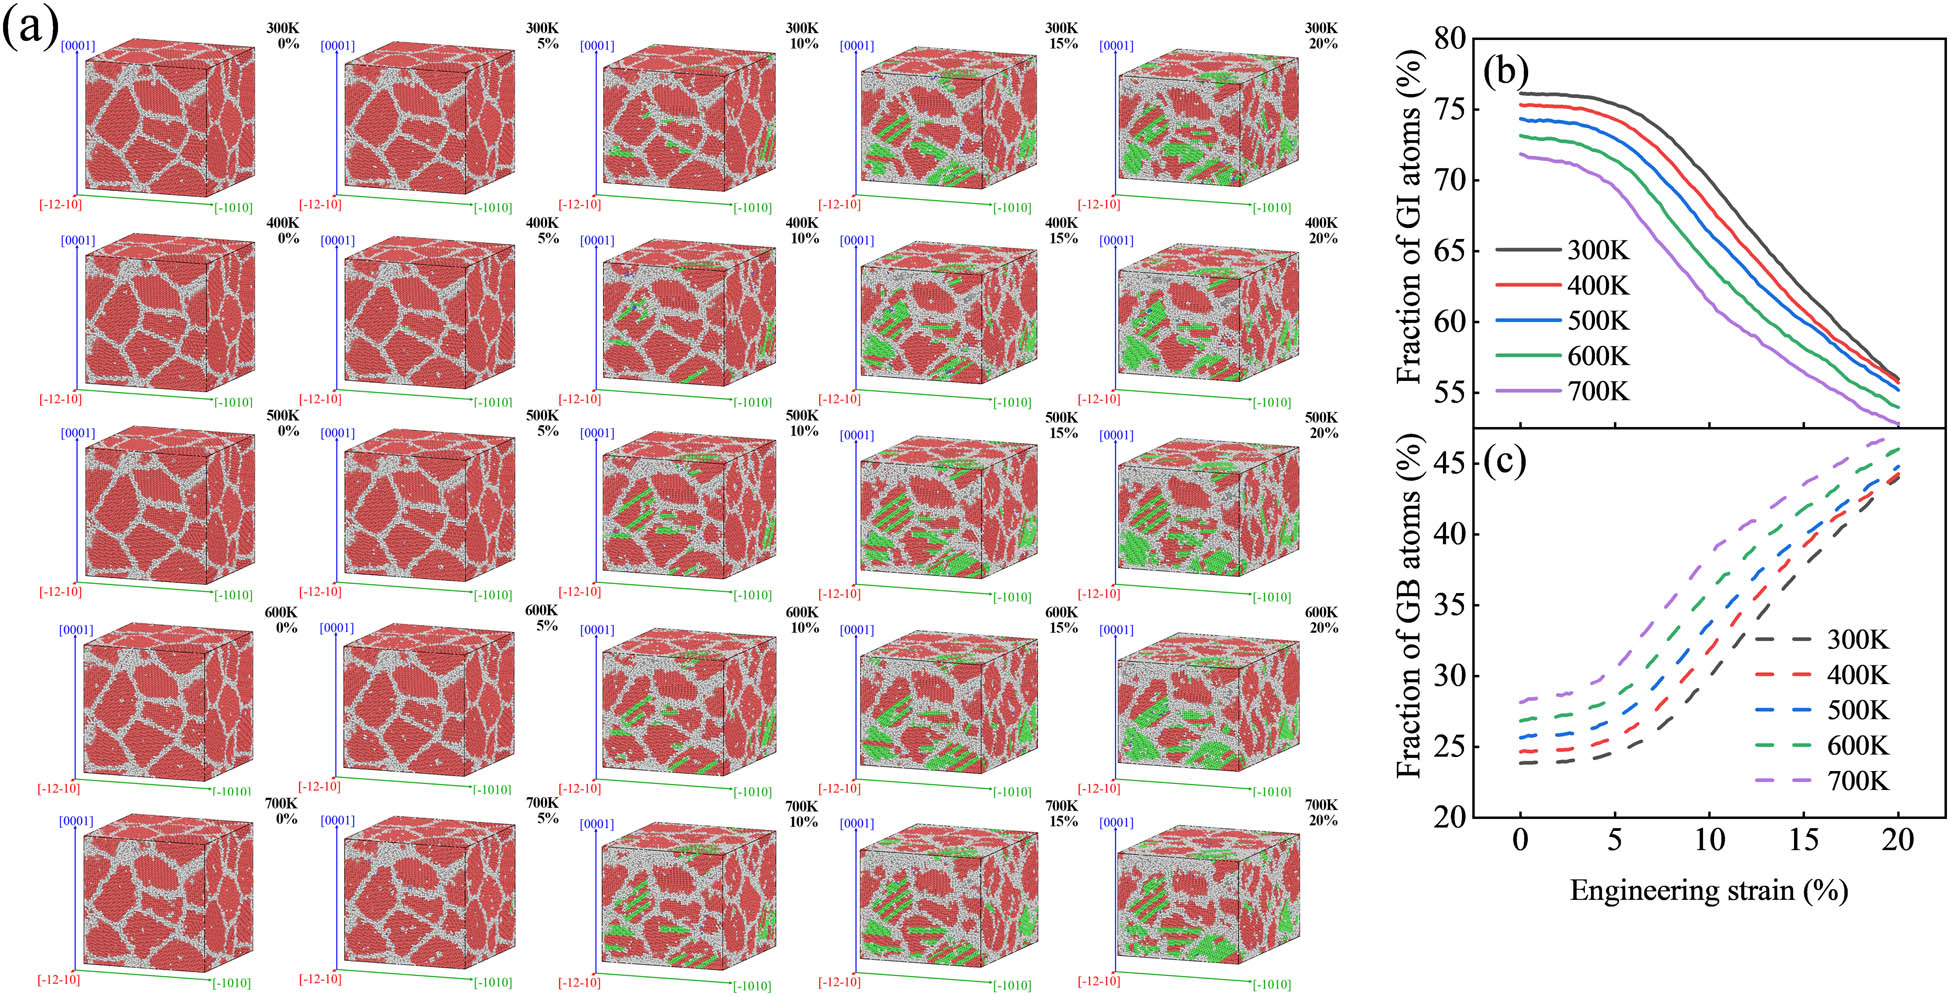
Grain boundary evolution under PSC: (a) CNA diagram, (b) GI atomic curve, and (c) GB atomic curve.
Figure 14 shows the structure evolution, Figure 14a shows the CNA diagram of HCP structure, Figure 14b shows the CNA diagram of the FCC structure, Figure 14c shows the CNA diagram of the BCC structure, Figure 14d shows the atomic curve of the HCP structure, Figure 14e shows the atomic curve of FCC structure, and Figure 14f shows the atomic curve of the BCC structure. It can be seen that the higher the temperature is, the earlier the atomic fraction of HCP begins to change, and the smaller the atomic fraction of the BCC structure is. When

Structural evolution: (a) CNA diagram of HCP structure, (b) CNA diagram of FCC structure, (c) CNA diagram of BCC structure, (d) atomic curve of HCP structure, (e) atomic curve of FCC structure, and (f) atomic curve of BCC structure.
Figure 15 shows the evolution of dislocations, Figure 15a shows the dislocation lines, and Figure 15b–f shows the dislocation density curves at different temperatures. With the increase in compression, the number of dislocation lines increases, the dislocation lines become longer, and the dislocation density increases. Among them, the dislocations with the highest dislocation densities are
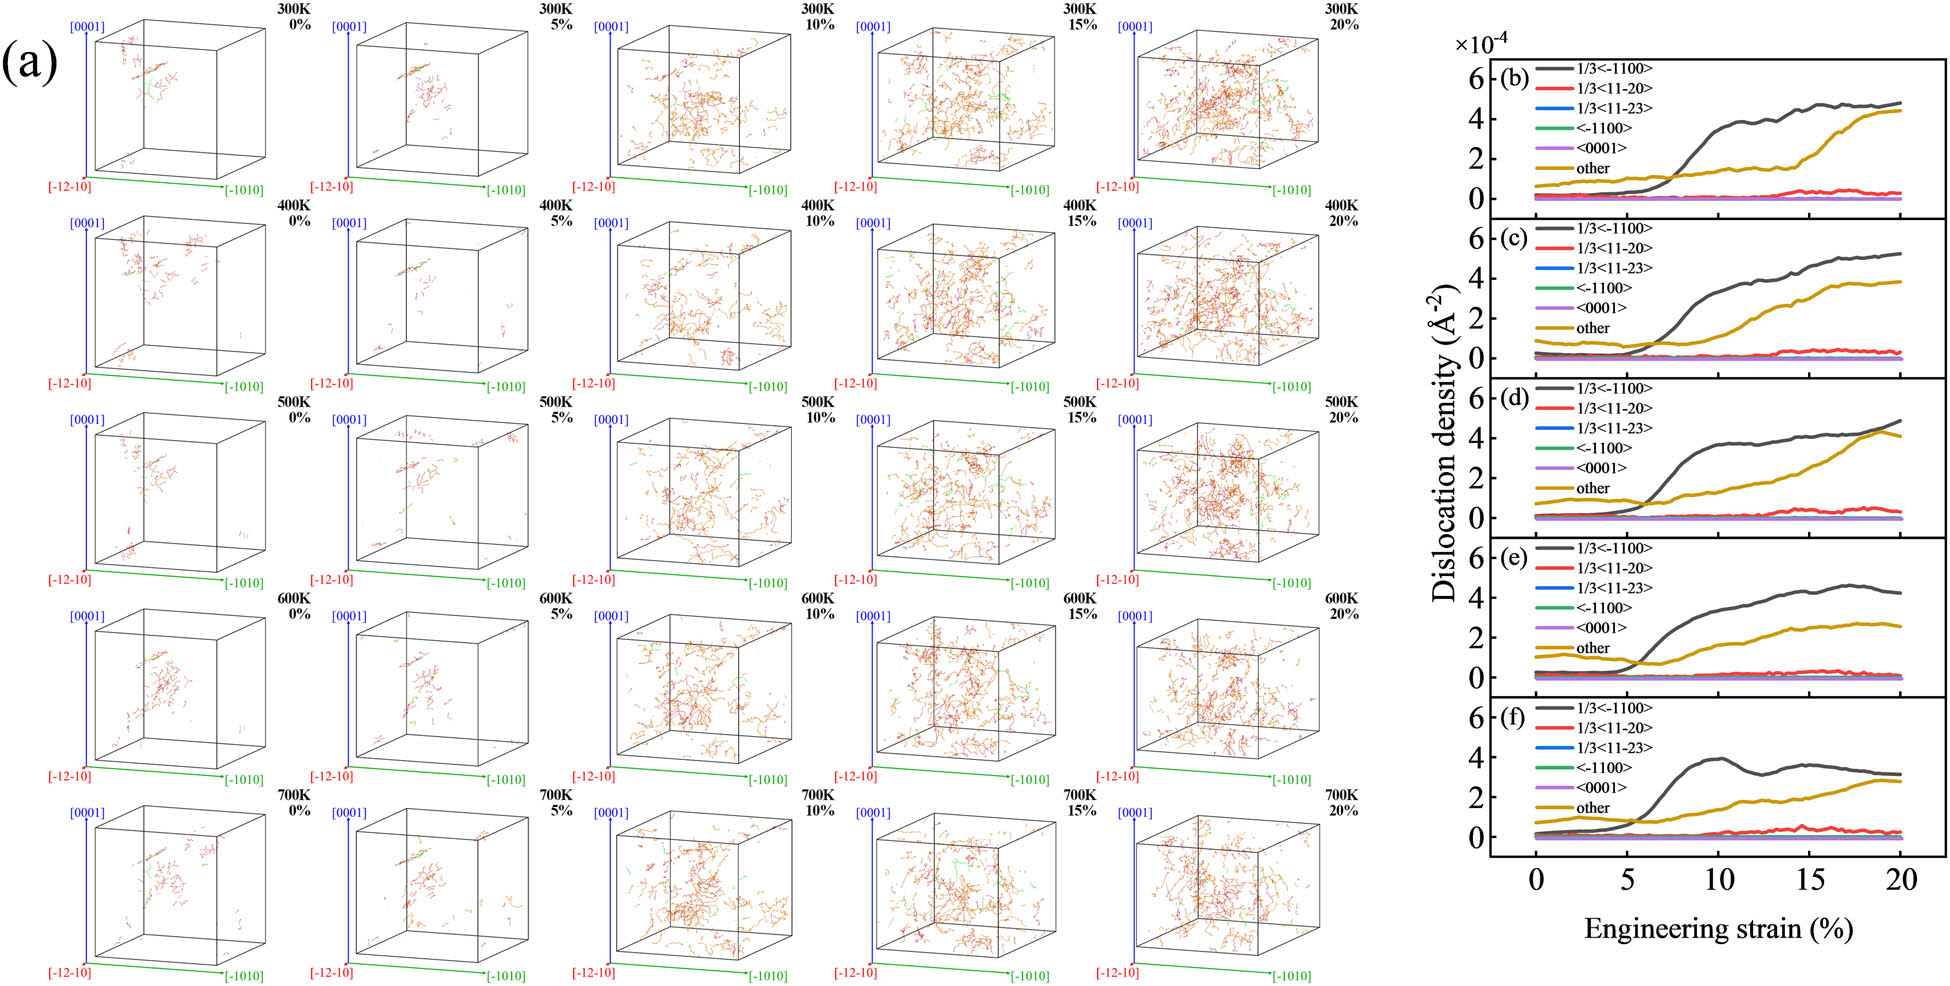
Dislocation evolution: (a) dislocation line diagram and (b)–(f) dislocation density curve.
3.3 Effect of strain rate on phase transformation under PSC
The AZ31 magnesium alloy model with a size of 200 Å × 200 Å × 200 Å is imported into LAMMPS, and the potential function is assigned to the model. X, Y, and Z are all periodic boundary conditions, using NPT ensemble, the time step is 0.001 ps, and the 10 ps is relaxed at 300 K. The change of temperature during the relaxation process is shown in Figure 16. Keeping the size of the Y-axis model unchanged, the model was uniformly compressed 20 ps along the Z-axis ([0001] direction) at 300 K at the strain rate of 0.001–0.1 ps−1 to achieve PSC.

Temperature change during relaxation.
Figure 17 shows the grain evolution, Figure 17a shows the grain diagram, and Figure 17b presents the grain curve. It can be seen that there is no obvious rule in the number of grains at different strain rates, so it is inferred that the strain rate has no significant effect on the grain refinement of magnesium alloys.
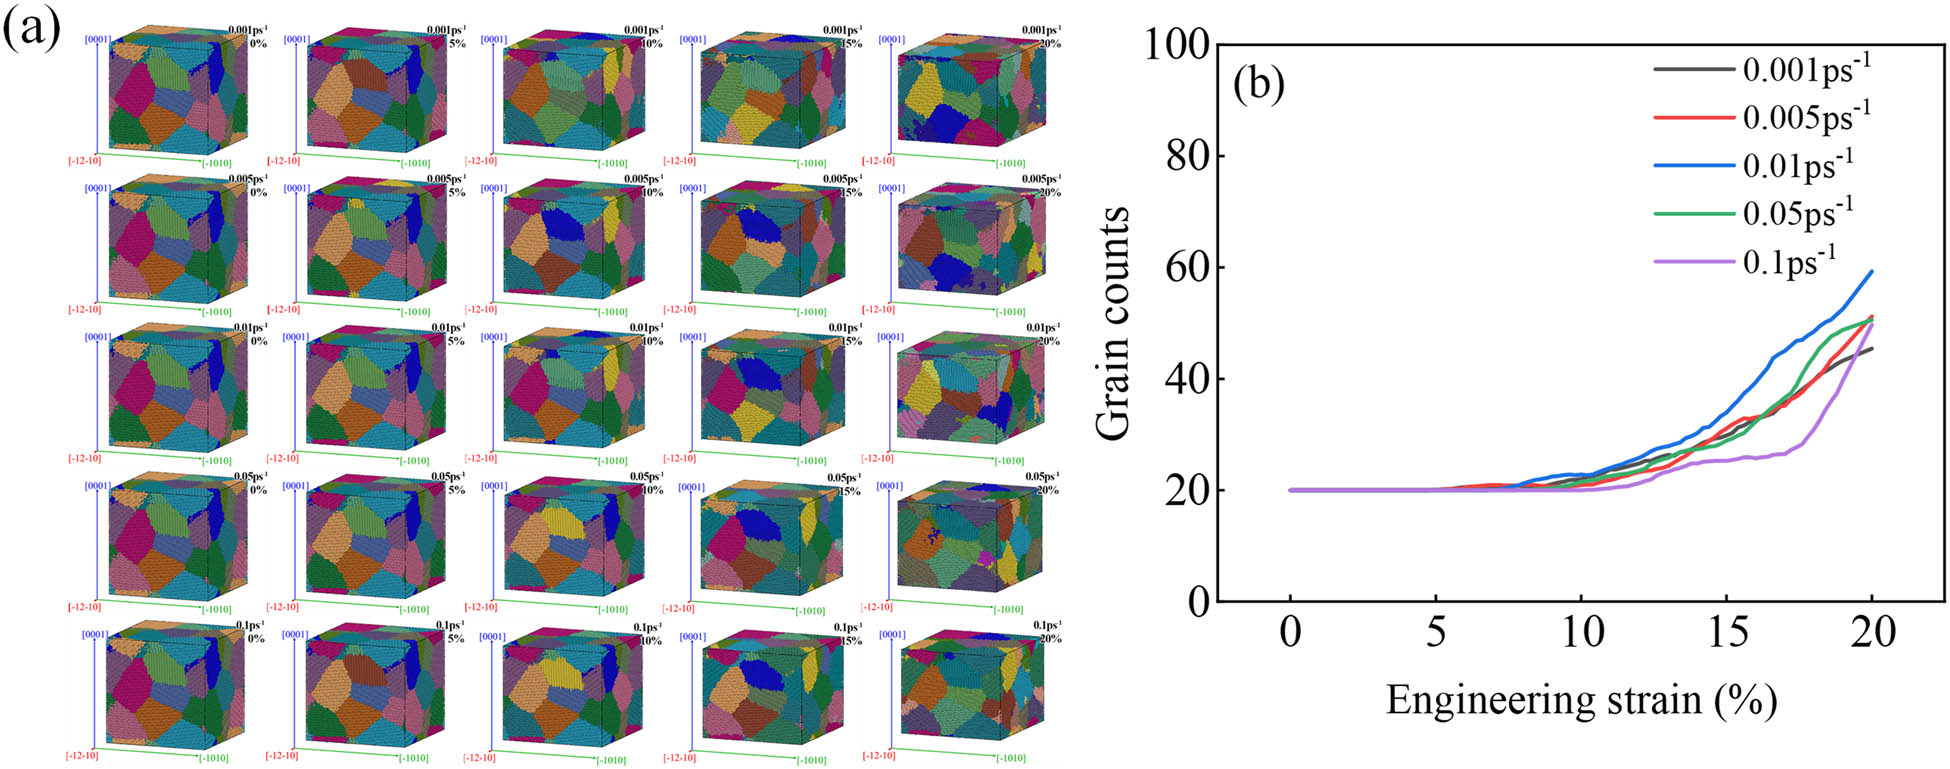
Grain evolution: (a) grain diagram and (b) grain curve.
Figure 18 shows the force–energy parameter curve under PSC, and Figure 18a shows the stress–strain curve. When

Force energy parameter curve: (a) stress–strain curve, (b) potential energy curve, (c) volume curve, and (d) total dislocation density curve.
Figure 19 shows the evolution of cavitys, Figure 19a shows cavities, and Figure 19b shows cavitys curve. It can be seen that the time of appearance of the cavity is the same as the yield time of magnesium alloy, and so in the process of compression, with the change of atomic position, cavity is produced, at the end of elastic deformation, magnesium alloys begin to yield and enter the plastic stage, the number of cavity increases, and the volume increases, increasing the overall volume of magnesium alloys. With the increase in the strain rate, the cavity area decreases, and when

Cavity evolution: (a) cavity diagram and (b) cavity curve.
Figure 20 shows the evolution of the GB, and Figure 20a shows the CNA diagram. It is obvious that with the increase in the amount of compression, the number of atoms in the FCC structure increases, and the number of atoms in the GB increases. With the increase in the strain rate, the FCC stacking fault occurs later. Figure 20b shows the GI atomic curve, and Figure 20c shows the GB atomic curve. It can be seen that the fraction of GB atoms increases with the increase in compression. The higher the strain rate, the later the growth of GB atoms and the greater the growth rate, so the strain rate affects the time and degree of phase transformation. The higher the rate is, the later the phase transformation is, and the greater the degree of phase transformation is.
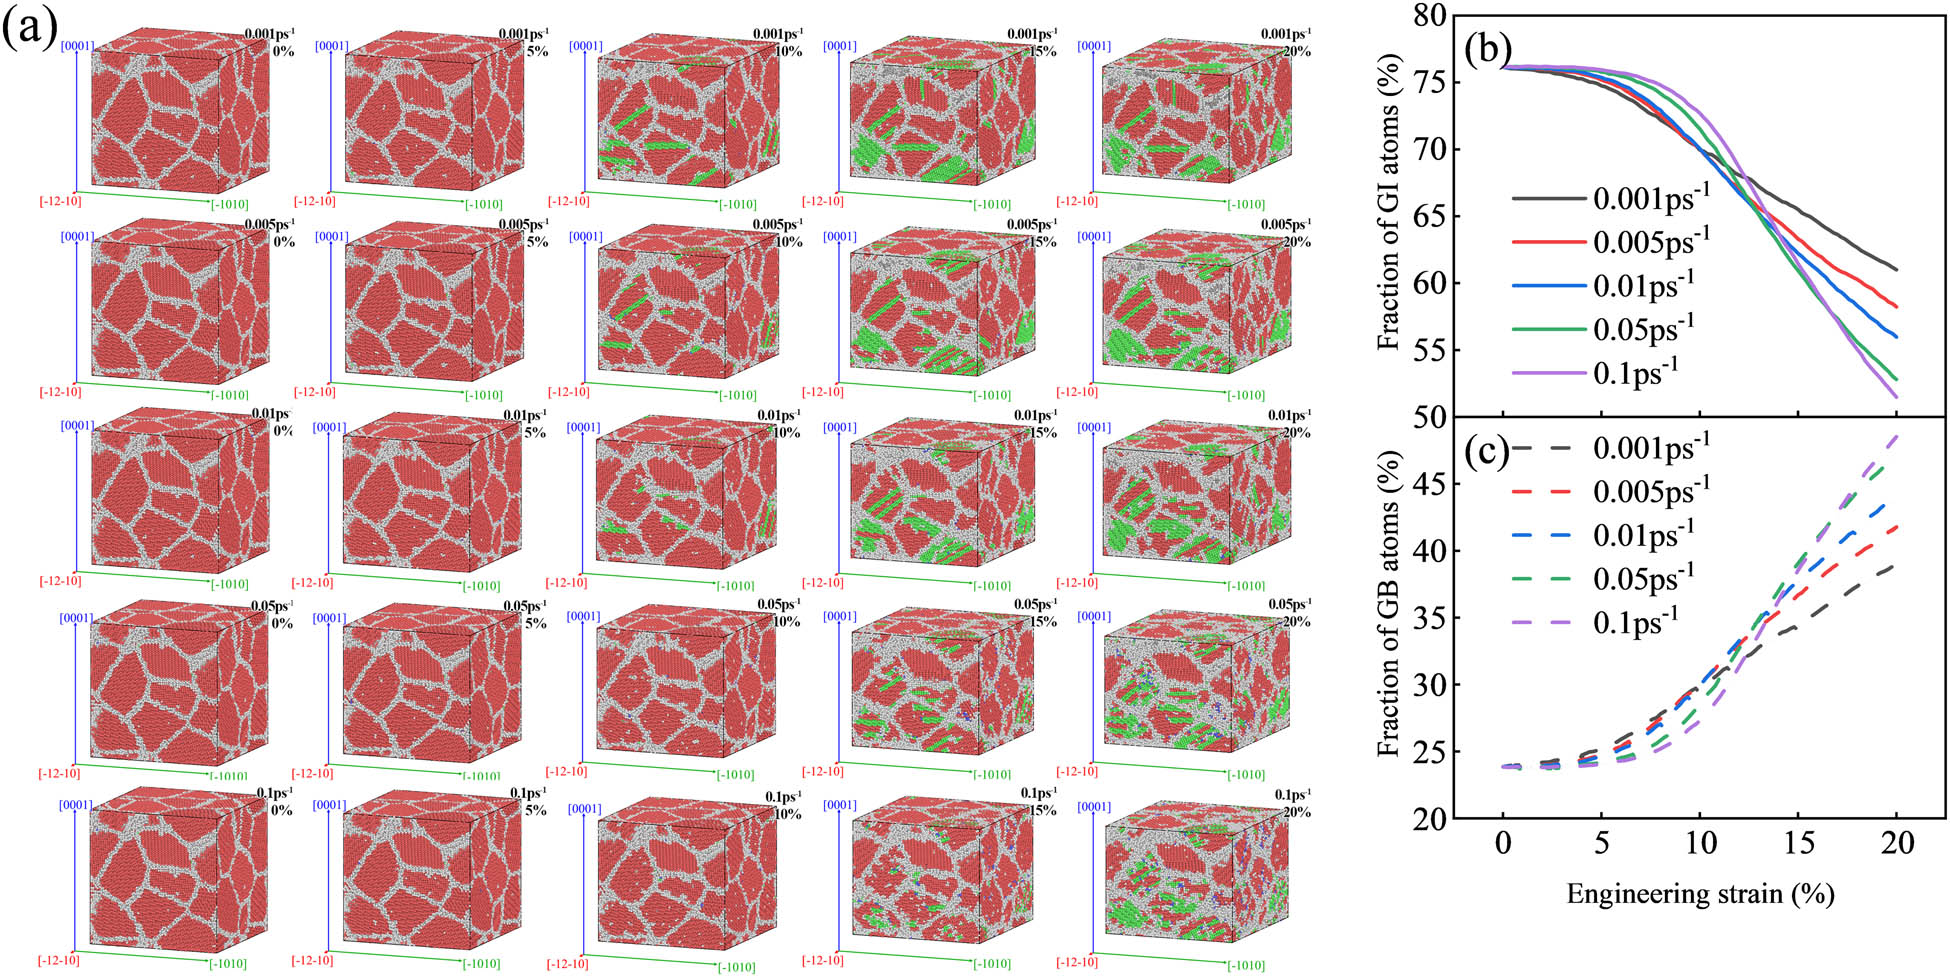
Grain boundary evolution: (a) CNA diagram, (b) GI atomic curve, and (c) GB atomic curve.
Figure 21 is the structure evolution under PSC, Figure 21a shows the CNA diagram of the HCP structure, Figure 21b shows the CNA diagram of the FCC structure, Figure 21c shows the CNA diagram of the BCC structure, Figure 21d shows the atomic curve of the HCP structure, Figure 21e shows the atomic curve of the FCC structure, and Figure 21f shows the atomic curve of the BCC structure. It can be seen that the higher the strain rate is, the later the atomic fraction of HCP begins to change. This is because the larger the strain rate is, the smaller the potential energy is, the less the atom is, and the position of the atom is not easy to change. The smaller the pore area is, the higher the strain rate is, the greater the yield strain is, and the greater the yield strength is. With the increase in the strain rate, the atomic fraction curves of the HCP structure and the FCC structure change later, while the strain phase of the BCC structure changes. The atomic fraction of the BCC structure increases with the increase in the strain rate. Therefore, the strain rate mainly affects the phase transition time and the degree of phase transformation.

Structural evolution: (a) CNA diagram of HCP structure, (b) CNA diagram of FCC structure, (c) CNA diagram of BCC structure, (d) atomic curve of HCP structure, (e) atomic curve of FCC structure, and (f) atomic curve of BCC structure.
Figure 22 shows the evolution of dislocations, Figure 22a shows the dislocation lines, and Figure 22b–f shows the dislocation density curves at different temperatures. It can be seen that the dislocation densities at all strain rates increase with the increase in compression. In the process of compression, the dislocations with the highest dislocation density are still

Dislocation evolution: (a) dislocation line diagram and (b)–(f) dislocation density curve.
4 Conclusion
In this article, the compression simulation of AZ31 magnesium alloy is simulated by the MD method. The effects of loading mode, temperature, and strain rate on the compression behavior are analyzed. The lattice distortion, mechanical behavior, structural evolution, and dislocation evolution in the compression process are deeply analyzed, and the results of different loading modes are obtained. The HCP → FCC phase transformation mechanism of AZ31 magnesium alloy during compression at temperature and strain rate, which is related to the mechanical behavior, has been studied completely. The main results are as follows:
PSC can improve the plasticity of AZ31 magnesium alloy and produce more severe grain refinement, GB diffusion, and phase transformation earlier, and the dislocation density is significantly higher than that of UC.
The plastic deformation mechanism of magnesium alloy changes into GB diffusion due to the increase of temperature, which has no obvious effect on grain refinement and dislocation evolution. With the increase in temperature, the potential energy of magnesium alloy increases and plastic deformation occurs more easily, so the yield stress and yield strain decrease.
The strain rate affects the time and degree of phase transformation. The higher the strain rate is, the later the phase transformation is, and the greater the degree of phase transformation is, the greater the yield strength and yield strain are.
The phase transformation of HCP → GB → FCC occurs in AZ31 magnesium alloy during compression. With the increase in compression amount, the number of atoms in GB increases, the number of atoms in GB diffuses, the number of atoms in the FCC structure increases gradually, and the number of FCC stacking faults increases. Due to the compression, the position of the HCP structure atom changes and becomes the GB atom, resulting in Shockley partial dislocations. As the squeezing continues to increase, the GB atom becomes an FCC stacking fault.
The phase transformation is before the specific plastic deformation in the compression process of magnesium alloy, and the yield occurs during the formation of the cavity. With the increase in the amount of compression, the elastic deformation of magnesium alloy occurs at first, the volume decreases, the atomic position changes gradually, and the phase transformation occurs. When a cavity occurs in the magnesium alloy, it begins to yield and enters the plastic stage, and the volume begins to increase.
There is a strong correlation between Shockley partial dislocations and FCC stacking faults. The corresponding strain when the density of Shockley partial dislocations increases is consistent with that when the atomic fraction of FCC structure begins to increase.
Acknowledgments
This work was supported by the National Key Research and Development Project (2018YFB1307902), Shanxi Province Joint Student Training Base Talent Training Project (No. 2018JD33), Shanxi young top talent project, Shanxi Province Science Foundation for Youths (201901D211312), Excellent young academic leaders in Shanxi colleges and universities (No. 2019045), Excellent Achievements Cultivation Project of Shanxi Higher Education Institutions (No. 2019KJ028), Shanxi Province emerging industry leader talent project, Shanxi Graduate Education Innovation Project (No. 2019SY482).
-
Funding information: This work was supported by the National Key Research and Development Project (2018YFB1307902), Shanxi Province Joint Student Training Base Talent Training Project (No. 2018JD33), Shanxi young top talent project, Shanxi Province Science Foundation for Youths (201901D211312), Excellent young academic leaders in Shanxi colleges and universities (No. 2019045), Excellent Achievements Cultivation Project of Shanxi Higher Education Institutions (No. 2019KJ028), Shanxi Province emerging industry leader talent project, Shanxi Graduate Education Innovation Project (No. 2019SY482).
-
Author contributions: Q.H. Yang ideated, designed the study and analyzed the results. Q.H. Yang carried out the MC/MD structure evolution analysis, dislocation visualization analysis and making the figures. Z.B. Chu contributed to the overall guidance for the work and provided financial support. C. Xue, B.W. Yang, Y.G. Li, L.F. Tuo and H. Gao provided ideas. All authors have accepted responsibility for the entire content of this manuscript and approved its submission.
-
Conflict of interest: The authors declare that they have no conflict of interest.
-
Data availability statement: The datasets generated during and/or analyzed during the current study are available from the corresponding author on reasonable request.
References
[1] Luo Q, Guo Y, Liu B, Feng Y, Zhang J, Li Q, et al. Thermodynamics and kinetics of phase transformation in rare earth-magnesium alloys: A critical review. J Mater Sci Technol. 2020;44:171–90.10.1016/j.jmst.2020.01.022Search in Google Scholar
[2] Wu Z, Wang J, Wang H, Ma S, Huang S, Li S, et al. Enhanced damping capacities of Mg–Ce alloy by the special microstructure with parallel second phase. J Mater Sci Technol. 2017;33:941–6.10.1016/j.jmst.2016.06.027Search in Google Scholar
[3] Wang J, Gao S, Song P, Huang X, Shi Z, Pan F. Effects of phase composition on the mechanical properties and damping capacities of as-extruded Mg-Zn-Y-Zr alloys. J Alloy Compd. 2011;509:8567–72.10.1016/j.jallcom.2011.06.017Search in Google Scholar
[4] Qin D, Wang J, Chen Y, Lu R, Pan F. Effect of long period stacking ordered structure on the damping capacities of Mg-Ni-Y alloys. Mater Sci Eng A. 2015;624:9–13.10.1016/j.msea.2014.11.011Search in Google Scholar
[5] Liu L, Chen X, Pan F, Tang A, Wang X, Liu J, et al. Microstructure, texture, mechanical properties and electromagnetic shielding effectiveness of Mg-Zn-Zr-Ce alloys. Mater Sci Eng A. 2016;669:259–68.10.1016/j.msea.2016.05.098Search in Google Scholar
[6] Song JM, Wen TX, Wang JY. Vibration fracture properties of a lightweight Mg-Li-Zn alloy. Scr Mater. 2007;56:529–32.10.1016/j.scriptamat.2006.11.017Search in Google Scholar
[7] Pan H, Pan F, Yang R, Peng J, Zhao C, She J, et al. Thermal and electrical conductivity of binary magnesium alloys. J Mater Sci. 2014;49:3107–24.10.1007/s10853-013-8012-3Search in Google Scholar
[8] Zhu WF, Luo Q, Zhang JY, Li Q. Phase equilibria of Mg-La-Zr system and thermal conductivity of selected alloys. J Alloy Compd. 2018;731:784–95.10.1016/j.jallcom.2017.10.013Search in Google Scholar
[9] Zha M, Zhang H, Yu Z, Zhang X, Meng X, Wang H, et al. Bimodal microstructure – A feasible strategy for high-strength and ductile metallic materials. J Mater Sci Technol. 2018;34:257–64.10.1016/j.jmst.2017.11.018Search in Google Scholar
[10] Zhang H. Analysis of phase transformation and solidification structure of AZ magnesium alloy. Chongqing University; 2007.Search in Google Scholar
[11] Itoi T, Ichikawa R, Hirohashi M. Deformation behavior of Mg-Ni-Y alloy with long period stacking ordered phase. Mater Sci Forum. 2012;706–709:1176–80.10.4028/www.scientific.net/MSF.706-709.1176Search in Google Scholar
[12] Cui X, Yu Z, Liu F, Du Z, Bai P. Influence of secondary phases on crack initiation and propagation during fracture process of as-cast Mg–Al–Zn-Nd alloy. Mater Sci Eng A. 2019;759:708–14.10.1016/j.msea.2019.05.062Search in Google Scholar
[13] Song G, Bowles AL, StJohn DH. Corrosion resistance of aged die cast magnesium alloy AZ91D. Mater Sci Eng A. 2004;366:74–86.10.1016/j.msea.2003.08.060Search in Google Scholar
[14] Nie JF. Precipitation and hardening in magnesium alloys. Metall Mater Trans A. 2012;43:3891–939.10.1007/s11661-012-1217-2Search in Google Scholar
[15] Fischer J, Becker G. In: Kainer KU, editor. Magnesium – Eigenschaften, Anwendungen, potenziale. VCH Wiley Weinheim; 2000. p. 99–110.Search in Google Scholar
[16] Allavikutty R, Gupta P, Santr TS, Rengaswamy J. Additive manufacturing of Mg alloys for biomedical applications: Current status and challenges. Curr OpBiomed Eng. 2021;18:100276.10.1016/j.cobme.2021.100276Search in Google Scholar
[17] Wu G, Wang C, Sun M, Ding W. Recent developments and applications on high-performance cast magnesium rare-earth alloys. J Magnes Alloy. 2021;9:1–20.10.1016/j.jma.2020.06.021Search in Google Scholar
[18] Alia Y, Qiu D, Jiang B, Pan F, Zhang MX. Current research progress in grain refinement of cast magnesium alloys: A review article. J Alloy Compd. 2015;619:639–51.10.1016/j.jallcom.2014.09.061Search in Google Scholar
[19] Nie KB, Wang XJ, Deng KK, Hu XS, Wu K. Magnesium matrix composite reinforced by nanoparticles-A review. J Magnes Alloy. 2021;1:57–77.10.1016/j.jma.2020.08.018Search in Google Scholar
[20] Song J, She J, Chen D, Pan F. Latest research advances on magnesium and magnesium alloys worldwide. J Magnes Alloy. 2020;1:1–41.10.1016/j.jma.2020.02.003Search in Google Scholar
[21] Wang XJ, Xu DK, Wu RZ, Chen XB, Peng QM, Jin L, et al. What is going on in magnesium alloys. J Mater Sci Technol. 2018;2:245–7.10.1016/j.jmst.2017.07.019Search in Google Scholar
[22] Liu P, Han X, Sun D, Wang Q. Research progress of molecular dynamics simulation of friction and wear of materials. Mater Sci Technol. 2017;3:26–34.Search in Google Scholar
[23] Srivastava I, Kotia A, Ghosh SK, Ali MKA. Recent advances of molecular dynamics simulations in nanotribology. J Mol Liq. 2021;335:116154.10.1016/j.molliq.2021.116154Search in Google Scholar
[24] Yan SR, Toghraie D, Hekmatifar M, Miansari M, Rostami S. Molecular dynamics simulation of Water-Copper nanofluid flow in a three-dimensional nanochannel with different types of surface roughness geometry for energy economic management. J Mol Liq. 2020;311:113222.10.1016/j.molliq.2020.113222Search in Google Scholar
[25] Kedharnath A, Kapoor R, Sarkar A. Classical molecular dynamics simulations of the deformation of metals under uniaxial monotonic loading: A review. Computers & Struct. 2021;254:106614.10.1016/j.compstruc.2021.106614Search in Google Scholar
[26] Yang B, Peng Y, Pan F, Shi B. Research progress on plastic deformation mechanism of magnesium alloys based on molecular dynamics. Mater Eng. 2019;47:40–8.Search in Google Scholar
[27] Wang Y, Tang A, Pan R, Pan F. Application of molecular dynamics in micro plastic deformation of magnesium and magnesium alloys. Mater Rep. 2019;19:3290–7.Search in Google Scholar
[28] Mollahosseini A, Abdelrasoul A. Molecular dynamics simulation for membrane separation and porous materials: A current state of art review. J Mol Graph Model. 2021;107:107947.10.1016/j.jmgm.2021.107947Search in Google Scholar PubMed
[29] Dong L, Li Y, Devanathan R, Gao F. Molecular dynamics simulation of the structural, elastic, and thermal properties of pyrochlores. RSC Adv. 2016;6(47):41410–9.10.1039/C6RA04779CSearch in Google Scholar
[30] Wolf D, Yamakov V, Phillpot SR, Mukherjee A, Gleiter H. Deformation of nanocrystalline materials by molecular-dynamics simulation: relationship to experiments. Acta Mater. 2005;53:1–40.10.1016/j.actamat.2004.08.045Search in Google Scholar
[31] Tsuruta K, Uchida A, Totsuji C, Totsuji H. Molecular dynamics simulation of nanostructured materials. Mater Sci Forum. 2007;539–543:2804–9.10.4028/www.scientific.net/MSF.539-543.2804Search in Google Scholar
[32] Rida A, Micoulaut M, Rouhaud E, Makke A. Understanding the strain rate sensitivity of nanocrystalline copper using molecular dynamics simulations. Comp Mater Sci. 2020;172:109294.10.1016/j.commatsci.2019.109294Search in Google Scholar
[33] Rupert TJ. Strain localization in a nanocrystalline metal: atomic mechanisms and the effect of testing conditions. J Appl Phys. 2013;114(3):033527.10.1063/1.4815965Search in Google Scholar
[34] Zhang Y, Tucker GJ, Trelewicz JR. Stress-assisted grain growth in nanocrystalline metals: grain boundary mediated mechanisms and stabilization through alloying. Acta Mater. 2017;131:39–47.10.1016/j.actamat.2017.03.060Search in Google Scholar
[35] Kobler A, Brandl C, Hahn H, Kübel C. In situ observation of deformation processes in nanocrystalline face-centered cubic metals. Beilstein J Nanotechnol. 2016;7:572–80.10.3762/bjnano.7.50Search in Google Scholar PubMed PubMed Central
[36] Tucker GJ, Foiles SM. Quantifying the influence of twin boundaries on the deformation of nanocrystalline copper using atomistic simulations. Int J Plast. 2015;65:191–205.10.1016/j.ijplas.2014.09.006Search in Google Scholar
[37] Rida A, Rouhaud E, Makke A, Micoulaut M, Mantisi B. Study of the effects of grain size on the mechanical properties of nanocrystalline copper using molecular dynamics simulation with initial realistic samples. Phil Mag. 2017;97(27):2387–405.10.1080/14786435.2017.1334136Search in Google Scholar
[38] Dupraz M, Sun Z, Brandl C, Van Swygenhoven H. Dislocation interactions at reduced strain rates in atomistic simulations of nanocrystalline Al. Acta Mater. 2018;144:68–79.10.1016/j.actamat.2017.10.043Search in Google Scholar
[39] Van Swygenhoven H, Derlet P, Frøseth A. Nucleation and propagation of dislocations in nanocrystalline fcc metals. Acta Mater. 2006;54(7):1975–83.10.1016/j.actamat.2005.12.026Search in Google Scholar
[40] Frøseth A, Derlet P, Van Swygenhoven H. Dislocations emitted from nanocrystalline grain boundaries: nucleation and splitting distance. Acta Mater. 2004;52(20):5863–70.10.1016/j.actamat.2004.09.001Search in Google Scholar
[41] Vo N, Averback R, Bellon P, Odunuga S, Caro A. Quantitative description of plastic deformation in nanocrystalline Cu: dislocation glide versus grain boundary sliding. Phys Rev B. 2008;77(13):134108.10.1103/PhysRevB.77.134108Search in Google Scholar
[42] Rajput A, Paul SK. Effect of different tensile loading modes on deformation behavior of nanocrystalline copper: atomistic simulations. Results Mater. 2019;4:100042.10.1016/j.rinma.2019.100042Search in Google Scholar
[43] Vlasova AM. Hardening of [0001]-magnesium nanocrystals: molecular dynamics simulation. AIP Conf Proc. 2019;2167:020385.10.1063/1.5132252Search in Google Scholar
[44] Paul SK, Kumar S, Tarafder S. Effect of loading conditions on nucleation of nano Cavity and failure of nanocrystalline aluminum: an atomistic investigation. Eng Fract Mech. 2017;176:257–62.10.1016/j.engfracmech.2017.03.010Search in Google Scholar
[45] Zhang H, Yan H, Jia N, Jin J, Zhao X. Exploring plastic deformation mechanism of multilayered Cu/Ti composites by using molecular dynamics modeling. Acta Metal Sin. 2018;54(9):1333–42.Search in Google Scholar
[46] Caro A, Crowson DA, Caro M. Classical many-body potential for concentrated alloys and the inversion of order in iron-chromium alloys. Phys Rev Lett. 2005;95:075702.10.1103/PhysRevLett.95.075702Search in Google Scholar PubMed
[47] Stukowski A, Sadigh B, Erhart P, Caro A. Efficient implementation of the concentration-dependent embedded atom method for molecular-dynamics and Monte-Carlo simulations. Model Simul Mater Sci Eng. 2009;17:075005.10.1088/0965-0393/17/7/075005Search in Google Scholar
[48] Zhou XW, Johnson RA, Wadley HNG. Misfit-energy-increasing dislocations in vapor-deposited CoFe/NiFe multilayers. Phys Rev B. 2004;69:144113.10.1103/PhysRevB.69.144113Search in Google Scholar
[49] Baskes MI. Modified embedded-atom potentials for cubic materials and impurities. Phys Rev B. 1992;46:2727–42.10.1103/PhysRevB.46.2727Search in Google Scholar PubMed
[50] Fang H, Michael GP, Alexander S, Horstemeyer Mark F, Baskes Michael I, John WG, et al. Numerical tools for atomistic simulations. United States; 2004.10.2172/918395Search in Google Scholar
[51] Lee B-J, Baskes MI. Second nearest-neighbor modified embedded-atom-method potential. Phys Rev B. 2000;62:8564–7.10.1103/PhysRevB.62.8564Search in Google Scholar
[52] Lee B-J, Baskes MI, Kim H, Cho YK. Second nearest-neighbor modified embedded atom method potentials for bcc transition metals. Phys Rev B. 2001;64:184102.10.1103/PhysRevB.64.184102Search in Google Scholar
[53] Valone SM, Baskes MI, Martin RL. Atomistic model of helium bubbles in gallium-stabilized plutonium alloys. Phys Rev B. 2006;73:214209.10.1103/PhysRevB.73.214209Search in Google Scholar
[54] Wang GF, Van Hove MA, Ross PN, Baskes MI. Monte Carlo simulations of segregation in Pt-Re catalyst nanoparticles. J Chem Phys. 2004;121:5410–22.10.1063/1.1781151Search in Google Scholar PubMed
[55] Ziegler JF, Biersack JP. The stopping and range of ions in matter. In: Bromley DA, editors. Treatise on heavy-ion science. Boston, MA: Springer; 1985.10.1007/978-1-4615-8103-1_3Search in Google Scholar
[56] Hirel P. Atomsk: A tool for manipulating and converting atomic data files. Computer Phys Commun. 2015;197:212–9.10.1016/j.cpc.2015.07.012Search in Google Scholar
[57] Plimpton S. Fast parallel algorithms for short-range molecular dynamics. J Comput Phys. 1995;117:1–19.10.2172/10176421Search in Google Scholar
[58] Jang H-S, Seol D, Lee B-J. Modified embedded-atom method interatomic potentials for Mg-Al-Ca and Mg–Al–Zn ternary systems. J Magnes Alloy. 2021;9:317–35.10.1016/j.jma.2020.09.006Search in Google Scholar
[59] Stukowski A. Visualization and analysis of atomistic simulation data with OVITO–the open visualization tool. Model Simul Mater Sci Eng. 2009;18:015012.10.1088/0965-0393/18/1/015012Search in Google Scholar
[60] Larsen PM, Schmidt S, Schiøtz J. Robust structural identification via polyhedral template matching. Model Simul Mater Sci Eng. 2016;24:055007.10.1088/0965-0393/24/5/055007Search in Google Scholar
[61] Bonald T, Charpentier B, Galland A, Hollocou A. Hierarchical graph clustering using node pair samplin. arXiv. 1806 01664[cs.SI].Search in Google Scholar
[62] Panzarino JF, Rupert TJ. Tracking microstructure of crystalline materials: a post-processing algorithm for atomistic simulations. JOM. 2014;66:417–28.10.1007/s11837-013-0831-9Search in Google Scholar
[63] Stukowski A, Bulatov VV, Arsenlis A. Automated identification and indexing of dislocations in crystal interfaces. Model Simul Mater Sci Eng. 2012;20:085007.10.1088/0965-0393/20/8/085007Search in Google Scholar
[64] Honeycutt JD, Andersen HC. Molecular dynamics study of melting and freezing of small Lennard-Jones clusters. J Phys Chem A. 1987;91:4950–63.10.1021/j100303a014Search in Google Scholar
[65] Stukowski A. Computational analysis methods in atomistic modeling of crystals. JOM. 2014;66(3):399–407.10.1007/s11837-013-0827-5Search in Google Scholar
[66] Berghezan A, Fourdeux A, Amelinckx S. Transmission electron microscopy studies of dislocations and stacking faults in a hexagonal metal: Zinc Etudes par microscopie electronique par transmission des dislocations et des fautes d’empilement dans un metal hexagonal: Zinc Untersuchungen von Versetzungen in stapelfehlern mit elektronenmikroskopischer Durchstrahlung in einem hexagonalen metal: Zink. Acta Mater. 1961;9:464.10.1016/0001-6160(61)90142-0Search in Google Scholar
[67] Yanan W, Shujiang C, Xichun D. Dislocation theory and its application. Metallurgical Industry Press; 2007.Search in Google Scholar
© 2022 Qianhua Yang et al., published by De Gruyter
This work is licensed under the Creative Commons Attribution 4.0 International License.
Articles in the same Issue
- Research Articles
- Theoretical and experimental investigation of MWCNT dispersion effect on the elastic modulus of flexible PDMS/MWCNT nanocomposites
- Mechanical, morphological, and fracture-deformation behavior of MWCNTs-reinforced (Al–Cu–Mg–T351) alloy cast nanocomposites fabricated by optimized mechanical milling and powder metallurgy techniques
- Flammability and physical stability of sugar palm crystalline nanocellulose reinforced thermoplastic sugar palm starch/poly(lactic acid) blend bionanocomposites
- Glutathione-loaded non-ionic surfactant niosomes: A new approach to improve oral bioavailability and hepatoprotective efficacy of glutathione
- Relationship between mechano-bactericidal activity and nanoblades density on chemically strengthened glass
- In situ regulation of microstructure and microwave-absorbing properties of FeSiAl through HNO3 oxidation
- Research on a mechanical model of magnetorheological fluid different diameter particles
- Nanomechanical and dynamic mechanical properties of rubber–wood–plastic composites
- Investigative properties of CeO2 doped with niobium: A combined characterization and DFT studies
- Miniaturized peptidomimetics and nano-vesiculation in endothelin types through probable nano-disk formation and structure property relationships of endothelins’ fragments
- N/S co-doped CoSe/C nanocubes as anode materials for Li-ion batteries
- Synergistic effects of halloysite nanotubes with metal and phosphorus additives on the optimal design of eco-friendly sandwich panels with maximum flame resistance and minimum weight
- Octreotide-conjugated silver nanoparticles for active targeting of somatostatin receptors and their application in a nebulized rat model
- Controllable morphology of Bi2S3 nanostructures formed via hydrothermal vulcanization of Bi2O3 thin-film layer and their photoelectrocatalytic performances
- Development of (−)-epigallocatechin-3-gallate-loaded folate receptor-targeted nanoparticles for prostate cancer treatment
- Enhancement of the mechanical properties of HDPE mineral nanocomposites by filler particles modulation of the matrix plastic/elastic behavior
- Effect of plasticizers on the properties of sugar palm nanocellulose/cinnamon essential oil reinforced starch bionanocomposite films
- Optimization of nano coating to reduce the thermal deformation of ball screws
- Preparation of efficient piezoelectric PVDF–HFP/Ni composite films by high electric field poling
- MHD dissipative Casson nanofluid liquid film flow due to an unsteady stretching sheet with radiation influence and slip velocity phenomenon
- Effects of nano-SiO2 modification on rubberised mortar and concrete with recycled coarse aggregates
- Mechanical and microscopic properties of fiber-reinforced coal gangue-based geopolymer concrete
- Effect of morphology and size on the thermodynamic stability of cerium oxide nanoparticles: Experiment and molecular dynamics calculation
- Mechanical performance of a CFRP composite reinforced via gelatin-CNTs: A study on fiber interfacial enhancement and matrix enhancement
- A practical review over surface modification, nanopatterns, emerging materials, drug delivery systems, and their biophysiochemical properties for dental implants: Recent progresses and advances
- HTR: An ultra-high speed algorithm for cage recognition of clathrate hydrates
- Effects of microalloying elements added by in situ synthesis on the microstructure of WCu composites
- A highly sensitive nanobiosensor based on aptamer-conjugated graphene-decorated rhodium nanoparticles for detection of HER2-positive circulating tumor cells
- Progressive collapse performance of shear strengthened RC frames by nano CFRP
- Core–shell heterostructured composites of carbon nanotubes and imine-linked hyperbranched polymers as metal-free Li-ion anodes
- A Galerkin strategy for tri-hybridized mixture in ethylene glycol comprising variable diffusion and thermal conductivity using non-Fourier’s theory
- Simple models for tensile modulus of shape memory polymer nanocomposites at ambient temperature
- Preparation and morphological studies of tin sulfide nanoparticles and use as efficient photocatalysts for the degradation of rhodamine B and phenol
- Polyethyleneimine-impregnated activated carbon nanofiber composited graphene-derived rice husk char for efficient post-combustion CO2 capture
- Electrospun nanofibers of Co3O4 nanocrystals encapsulated in cyclized-polyacrylonitrile for lithium storage
- Pitting corrosion induced on high-strength high carbon steel wire in high alkaline deaerated chloride electrolyte
- Formulation of polymeric nanoparticles loaded sorafenib; evaluation of cytotoxicity, molecular evaluation, and gene expression studies in lung and breast cancer cell lines
- Engineered nanocomposites in asphalt binders
- Influence of loading voltage, domain ratio, and additional load on the actuation of dielectric elastomer
- Thermally induced hex-graphene transitions in 2D carbon crystals
- The surface modification effect on the interfacial properties of glass fiber-reinforced epoxy: A molecular dynamics study
- Molecular dynamics study of deformation mechanism of interfacial microzone of Cu/Al2Cu/Al composites under tension
- Nanocolloid simulators of luminescent solar concentrator photovoltaic windows
- Compressive strength and anti-chloride ion penetration assessment of geopolymer mortar merging PVA fiber and nano-SiO2 using RBF–BP composite neural network
- Effect of 3-mercapto-1-propane sulfonate sulfonic acid and polyvinylpyrrolidone on the growth of cobalt pillar by electrodeposition
- Dynamics of convective slippery constraints on hybrid radiative Sutterby nanofluid flow by Galerkin finite element simulation
- Preparation of vanadium by the magnesiothermic self-propagating reduction and process control
- Microstructure-dependent photoelectrocatalytic activity of heterogeneous ZnO–ZnS nanosheets
- Cytotoxic and pro-inflammatory effects of molybdenum and tungsten disulphide on human bronchial cells
- Improving recycled aggregate concrete by compression casting and nano-silica
- Chemically reactive Maxwell nanoliquid flow by a stretching surface in the frames of Newtonian heating, nonlinear convection and radiative flux: Nanopolymer flow processing simulation
- Nonlinear dynamic and crack behaviors of carbon nanotubes-reinforced composites with various geometries
- Biosynthesis of copper oxide nanoparticles and its therapeutic efficacy against colon cancer
- Synthesis and characterization of smart stimuli-responsive herbal drug-encapsulated nanoniosome particles for efficient treatment of breast cancer
- Homotopic simulation for heat transport phenomenon of the Burgers nanofluids flow over a stretching cylinder with thermal convective and zero mass flux conditions
- Incorporation of copper and strontium ions in TiO2 nanotubes via dopamine to enhance hemocompatibility and cytocompatibility
- Mechanical, thermal, and barrier properties of starch films incorporated with chitosan nanoparticles
- Mechanical properties and microstructure of nano-strengthened recycled aggregate concrete
- Glucose-responsive nanogels efficiently maintain the stability and activity of therapeutic enzymes
- Tunning matrix rheology and mechanical performance of ultra-high performance concrete using cellulose nanofibers
- Flexible MXene/copper/cellulose nanofiber heat spreader films with enhanced thermal conductivity
- Promoted charge separation and specific surface area via interlacing of N-doped titanium dioxide nanotubes on carbon nitride nanosheets for photocatalytic degradation of Rhodamine B
- Elucidating the role of silicon dioxide and titanium dioxide nanoparticles in mitigating the disease of the eggplant caused by Phomopsis vexans, Ralstonia solanacearum, and root-knot nematode Meloidogyne incognita
- An implication of magnetic dipole in Carreau Yasuda liquid influenced by engine oil using ternary hybrid nanomaterial
- Robust synthesis of a composite phase of copper vanadium oxide with enhanced performance for durable aqueous Zn-ion batteries
- Tunning self-assembled phases of bovine serum albumin via hydrothermal process to synthesize novel functional hydrogel for skin protection against UVB
- A comparative experimental study on damping properties of epoxy nanocomposite beams reinforced with carbon nanotubes and graphene nanoplatelets
- Lightweight and hydrophobic Ni/GO/PVA composite aerogels for ultrahigh performance electromagnetic interference shielding
- Research on the auxetic behavior and mechanical properties of periodically rotating graphene nanostructures
- Repairing performances of novel cement mortar modified with graphene oxide and polyacrylate polymer
- Closed-loop recycling and fabrication of hydrophilic CNT films with high performance
- Design of thin-film configuration of SnO2–Ag2O composites for NO2 gas-sensing applications
- Study on stress distribution of SiC/Al composites based on microstructure models with microns and nanoparticles
- PVDF green nanofibers as potential carriers for improving self-healing and mechanical properties of carbon fiber/epoxy prepregs
- Osteogenesis capability of three-dimensionally printed poly(lactic acid)-halloysite nanotube scaffolds containing strontium ranelate
- Silver nanoparticles induce mitochondria-dependent apoptosis and late non-canonical autophagy in HT-29 colon cancer cells
- Preparation and bonding mechanisms of polymer/metal hybrid composite by nano molding technology
- Damage self-sensing and strain monitoring of glass-reinforced epoxy composite impregnated with graphene nanoplatelet and multiwalled carbon nanotubes
- Thermal analysis characterisation of solar-powered ship using Oldroyd hybrid nanofluids in parabolic trough solar collector: An optimal thermal application
- Pyrene-functionalized halloysite nanotubes for simultaneously detecting and separating Hg(ii) in aqueous media: A comprehensive comparison on interparticle and intraparticle excimers
- Fabrication of self-assembly CNT flexible film and its piezoresistive sensing behaviors
- Thermal valuation and entropy inspection of second-grade nanoscale fluid flow over a stretching surface by applying Koo–Kleinstreuer–Li relation
- Mechanical properties and microstructure of nano-SiO2 and basalt-fiber-reinforced recycled aggregate concrete
- Characterization and tribology performance of polyaniline-coated nanodiamond lubricant additives
- Combined impact of Marangoni convection and thermophoretic particle deposition on chemically reactive transport of nanofluid flow over a stretching surface
- Spark plasma extrusion of binder free hydroxyapatite powder
- An investigation on thermo-mechanical performance of graphene-oxide-reinforced shape memory polymer
- Effect of nanoadditives on the novel leather fiber/recycled poly(ethylene-vinyl-acetate) polymer composites for multifunctional applications: Fabrication, characterizations, and multiobjective optimization using central composite design
- Design selection for a hemispherical dimple core sandwich panel using hybrid multi-criteria decision-making methods
- Improving tensile strength and impact toughness of plasticized poly(lactic acid) biocomposites by incorporating nanofibrillated cellulose
- Green synthesis of spinel copper ferrite (CuFe2O4) nanoparticles and their toxicity
- The effect of TaC and NbC hybrid and mono-nanoparticles on AA2024 nanocomposites: Microstructure, strengthening, and artificial aging
- Excited-state geometry relaxation of pyrene-modified cellulose nanocrystals under UV-light excitation for detecting Fe3+
- Effect of CNTs and MEA on the creep of face-slab concrete at an early age
- Effect of deformation conditions on compression phase transformation of AZ31
- Application of MXene as a new generation of highly conductive coating materials for electromembrane-surrounded solid-phase microextraction
- A comparative study of the elasto-plastic properties for ceramic nanocomposites filled by graphene or graphene oxide nanoplates
- Encapsulation strategies for improving the biological behavior of CdS@ZIF-8 nanocomposites
- Biosynthesis of ZnO NPs from pumpkin seeds’ extract and elucidation of its anticancer potential against breast cancer
- Preliminary trials of the gold nanoparticles conjugated chrysin: An assessment of anti-oxidant, anti-microbial, and in vitro cytotoxic activities of a nanoformulated flavonoid
- Effect of micron-scale pores increased by nano-SiO2 sol modification on the strength of cement mortar
- Fractional simulations for thermal flow of hybrid nanofluid with aluminum oxide and titanium oxide nanoparticles with water and blood base fluids
- The effect of graphene nano-powder on the viscosity of water: An experimental study and artificial neural network modeling
- Development of a novel heat- and shear-resistant nano-silica gelling agent
- Characterization, biocompatibility and in vivo of nominal MnO2-containing wollastonite glass-ceramic
- Entropy production simulation of second-grade magnetic nanomaterials flowing across an expanding surface with viscidness dissipative flux
- Enhancement in structural, morphological, and optical properties of copper oxide for optoelectronic device applications
- Aptamer-functionalized chitosan-coated gold nanoparticle complex as a suitable targeted drug carrier for improved breast cancer treatment
- Performance and overall evaluation of nano-alumina-modified asphalt mixture
- Analysis of pure nanofluid (GO/engine oil) and hybrid nanofluid (GO–Fe3O4/engine oil): Novel thermal and magnetic features
- Synthesis of Ag@AgCl modified anatase/rutile/brookite mixed phase TiO2 and their photocatalytic property
- Mechanisms and influential variables on the abrasion resistance hydraulic concrete
- Synergistic reinforcement mechanism of basalt fiber/cellulose nanocrystals/polypropylene composites
- Achieving excellent oxidation resistance and mechanical properties of TiB2–B4C/carbon aerogel composites by quick-gelation and mechanical mixing
- Microwave-assisted sol–gel template-free synthesis and characterization of silica nanoparticles obtained from South African coal fly ash
- Pulsed laser-assisted synthesis of nano nickel(ii) oxide-anchored graphitic carbon nitride: Characterizations and their potential antibacterial/anti-biofilm applications
- Effects of nano-ZrSi2 on thermal stability of phenolic resin and thermal reusability of quartz–phenolic composites
- Benzaldehyde derivatives on tin electroplating as corrosion resistance for fabricating copper circuit
- Mechanical and heat transfer properties of 4D-printed shape memory graphene oxide/epoxy acrylate composites
- Coupling the vanadium-induced amorphous/crystalline NiFe2O4 with phosphide heterojunction toward active oxygen evolution reaction catalysts
- Graphene-oxide-reinforced cement composites mechanical and microstructural characteristics at elevated temperatures
- Gray correlation analysis of factors influencing compressive strength and durability of nano-SiO2 and PVA fiber reinforced geopolymer mortar
- Preparation of layered gradient Cu–Cr–Ti alloy with excellent mechanical properties, thermal stability, and electrical conductivity
- Recovery of Cr from chrome-containing leather wastes to develop aluminum-based composite material along with Al2O3 ceramic particles: An ingenious approach
- Mechanisms of the improved stiffness of flexible polymers under impact loading
- Anticancer potential of gold nanoparticles (AuNPs) using a battery of in vitro tests
- Review Articles
- Proposed approaches for coronaviruses elimination from wastewater: Membrane techniques and nanotechnology solutions
- Application of Pickering emulsion in oil drilling and production
- The contribution of microfluidics to the fight against tuberculosis
- Graphene-based biosensors for disease theranostics: Development, applications, and recent advancements
- Synthesis and encapsulation of iron oxide nanorods for application in magnetic hyperthermia and photothermal therapy
- Contemporary nano-architectured drugs and leads for ανβ3 integrin-based chemotherapy: Rationale and retrospect
- State-of-the-art review of fabrication, application, and mechanical properties of functionally graded porous nanocomposite materials
- Insights on magnetic spinel ferrites for targeted drug delivery and hyperthermia applications
- A review on heterogeneous oxidation of acetaminophen based on micro and nanoparticles catalyzed by different activators
- Early diagnosis of lung cancer using magnetic nanoparticles-integrated systems
- Advances in ZnO: Manipulation of defects for enhancing their technological potentials
- Efficacious nanomedicine track toward combating COVID-19
- A review of the design, processes, and properties of Mg-based composites
- Green synthesis of nanoparticles for varied applications: Green renewable resources and energy-efficient synthetic routes
- Two-dimensional nanomaterial-based polymer composites: Fundamentals and applications
- Recent progress and challenges in plasmonic nanomaterials
- Apoptotic cell-derived micro/nanosized extracellular vesicles in tissue regeneration
- Electronic noses based on metal oxide nanowires: A review
- Framework materials for supercapacitors
- An overview on the reproductive toxicity of graphene derivatives: Highlighting the importance
- Antibacterial nanomaterials: Upcoming hope to overcome antibiotic resistance crisis
- Research progress of carbon materials in the field of three-dimensional printing polymer nanocomposites
- A review of atomic layer deposition modelling and simulation methodologies: Density functional theory and molecular dynamics
- Recent advances in the preparation of PVDF-based piezoelectric materials
- Recent developments in tensile properties of friction welding of carbon fiber-reinforced composite: A review
- Comprehensive review of the properties of fly ash-based geopolymer with additive of nano-SiO2
- Perspectives in biopolymer/graphene-based composite application: Advances, challenges, and recommendations
- Graphene-based nanocomposite using new modeling molecular dynamic simulations for proposed neutralizing mechanism and real-time sensing of COVID-19
- Nanotechnology application on bamboo materials: A review
- Recent developments and future perspectives of biorenewable nanocomposites for advanced applications
- Nanostructured lipid carrier system: A compendium of their formulation development approaches, optimization strategies by quality by design, and recent applications in drug delivery
- 3D printing customized design of human bone tissue implant and its application
- Design, preparation, and functionalization of nanobiomaterials for enhanced efficacy in current and future biomedical applications
- A brief review of nanoparticles-doped PEDOT:PSS nanocomposite for OLED and OPV
- Nanotechnology interventions as a putative tool for the treatment of dental afflictions
- Recent advancements in metal–organic frameworks integrating quantum dots (QDs@MOF) and their potential applications
- A focused review of short electrospun nanofiber preparation techniques for composite reinforcement
- Microstructural characteristics and nano-modification of interfacial transition zone in concrete: A review
- Latest developments in the upconversion nanotechnology for the rapid detection of food safety: A review
- Strategic applications of nano-fertilizers for sustainable agriculture: Benefits and bottlenecks
- Molecular dynamics application of cocrystal energetic materials: A review
- Synthesis and application of nanometer hydroxyapatite in biomedicine
- Cutting-edge development in waste-recycled nanomaterials for energy storage and conversion applications
- Biological applications of ternary quantum dots: A review
- Nanotherapeutics for hydrogen sulfide-involved treatment: An emerging approach for cancer therapy
- Application of antibacterial nanoparticles in orthodontic materials
- Effect of natural-based biological hydrogels combined with growth factors on skin wound healing
- Nanozymes – A route to overcome microbial resistance: A viewpoint
- Recent developments and applications of smart nanoparticles in biomedicine
- Contemporary review on carbon nanotube (CNT) composites and their impact on multifarious applications
- Interfacial interactions and reinforcing mechanisms of cellulose and chitin nanomaterials and starch derivatives for cement and concrete strength and durability enhancement: A review
- Diamond-like carbon films for tribological modification of rubber
- Layered double hydroxides (LDHs) modified cement-based materials: A systematic review
- Recent research progress and advanced applications of silica/polymer nanocomposites
- Modeling of supramolecular biopolymers: Leading the in silico revolution of tissue engineering and nanomedicine
- Recent advances in perovskites-based optoelectronics
- Biogenic synthesis of palladium nanoparticles: New production methods and applications
- A comprehensive review of nanofluids with fractional derivatives: Modeling and application
- Electrospinning of marine polysaccharides: Processing and chemical aspects, challenges, and future prospects
- Electrohydrodynamic printing for demanding devices: A review of processing and applications
- Rapid Communications
- Structural material with designed thermal twist for a simple actuation
- Recent advances in photothermal materials for solar-driven crude oil adsorption