
Polymer nanocomposite for protecting photovoltaic cells from solar ultraviolet in space
-
Abdalla M. Darwish
 ,
Sergey S. Sarkisov
,
Brandon Graycol
,
Sergey S. Sarkisov
,
Brandon Graycol

Abstract
Polymer nanocomposite coatings of solar photovoltaic cells that absorb solar ultraviolet (UV) radiation and convert it into visible and near-infrared (NIR) light can increase the operational lifetime and the energy efficiency of the cells. We report a polymer nanocomposite spectrum converting layer (SCL) made of colorless polyimide CORIN impregnated with the nanoparticles (NPs) of fluoride NaYF4 doped with three-valent ions of Europium at a molar concentration of 60%. The NPs were the nanocrystals (179 ± 35 nm in size) in thermally stable hexagonal beta-phase. The visible-NIR photoluminescence quantum yield of the nano-powder was ∼69%. The SCLs were applied using the open-air multi-beam multi-target pulsed laser deposition method to silicon heterojunction (SHJ), copper-indium-gallium-selenide (CIGS), and inverted metamorphic multijunction (IMM) solar cells. The cells were exposed to UV radiation from a 365 nm light emitting diode. The I–V characteristics of the cells were measured with a solar simulator using AM0 filter. The proposed SCLs improved the UV stability of all three types of the cells: the power degradation of SHJs and IMMs cells was stopped or slightly reversed and the degradation rate of CIGSs decreased by ∼25%. The proposed SCLs have great commercial potential, especially for applications to space power.
Abbreviations
- AM
-
air mass
- AO
-
atomic oxygen
- BOL
-
beginning-of-life
- CIGS
-
copper-indium-gallium-selenide
- DLS
-
dynamic light scattering
- EDTA
-
Na2-ethylenediaminetetraacetic acid
- EOL
-
end-of-life
- ESH
-
equivalent sun hours
- GPIB-USB
-
general purpose interface bus-universal serial bus
- IMM
-
inverted metamorphic multijunction
- IPCE
-
incident photon to charge carrier efficiency
- I–V
-
current–voltage
- JCPDS
-
joint committee on powder diffraction standards
- LED
-
light emitting diode
- MBMT-PLD
-
multi-beam multi-target pulsed laser deposition
- Nd:YAG
-
neodymium doped yttrium aluminum garnet
- NP
-
nanoparticle
- NIR
-
near-infrared
- OS
-
oligomeric silsesquioxane
- PL
-
photoluminescence
- PLD
-
pulsed laser deposition
- PLQY
-
photoluminescence quantum yield
- PV
-
photovoltaic
- RE
-
rare-earth
- SCL
-
spectrum converting layer
- SEM
-
scanning electron microscopy
- UV
-
ultraviolet
- VIS
-
visible
- XRD
-
X-ray diffraction
1 Introduction
Significant efforts have been put toward the development of polymer coatings protecting photovoltaic (PV) solar cells against harmful ultraviolet (UV) spectral components of solar radiation reducing operational lifetime [1,2,3,4,5]. The advantages of a polymer protecting layer over previously used semi-flexible cover glass are flexibility and light weight. This is critical for space applications with ultracompact solar array deployment systems such as NASA’s Lightweight Integrated Solar Array and AnTenna, slip wrapping concept by Caltech, and R3D2 antenna deployment system by MMA Design developed for small spacecraft [6]. While protecting a solar cell, the polymer overcoat itself is subject to degradation under exposure to solar UV. This degradation reveals as darkening, yellowing, or sublimation [6]. Besides, the energy of UV radiation just gets wasted in the polymer layer without producing electricity. In this study, we describe our efforts to make polymer nanocomposite layers that convert UV into visible and near-infrared (NIR) light that can be used by solar PV cells for producing extra electricity. We call such coatings the spectrum converting layers (SCLs). The configuration of a PV cell coated with an SCL is schematically presented in Figure 1. The SCL made of a polymer nanocomposite embedded with nanoparticles (NPs) is deposited on a protective (optically transparent) layer on the top of the PV cell. Both UV and visible-NIR spectral components of sun radiation reach the SCL. UV component is absorbed by the NPs and spectrally converted into visible-NIR radiation though the mechanism of downshifting. The visible-NIR radiation produced by the spectrum conversion along with the major visible-NIR components pass to the PV cell and generate extra electricity. On their passage through the SCL and the protecting layer, the major and extra visible-NIR radiation might have losses due to reflection, absorption, and scattering. Accordingly, the major yellow arrows below the SCL are shown slightly thinner. Protecting transparent layer can be absent. The SCL is expected to shield itself and the protecting layer and PV cell covered by it from solar UV radiation thus increasing operational lifetime. It must also improve photoelectric energy conversion efficiency. In this work, for the first time to our knowledge, we demonstrated that the proposed SCL improved the UV stability of three types of PV cells suitable for space power.

Sketch illustrating the usage of an SCL on the top of a solar PV cell. There is also solar UV, visible, and NIR radiation reflected from the SCL and the down-shifted visible and NIR radiation emitted by the SCL upwards that is not shown in the sketch.
In Section 2 we describe the mechanism of spectrum conversion, the selection, and synthesis of the materials, making SCLs, and building the experimental setup for testing SCL prototypes. Section 3 includes the results and discussion of the experimental characterization of the performance of the SCL prototypes integrated with typical solar cells, including the candidates for space solar arrays followed by the conclusion in Section 4.
2 Materials and methods
2.1 Solar spectrum converting NPs
Among possible candidates for spectral conversion, we selected the NPs made of fluoride NaYF4 doped with three-valent ions of rare-earth (RE) element Europium. NaYF4 is a suitable host for RE ions due its low phonon energy (∼300 cm−1) that makes multi-phonon assisted nonradiative relaxation of the excited ions weak [7]. Superior performance of Eu3+ as an efficient spectrum converter in various inorganic matrices has been reported in the literature [8,9,10,11,12,13,14,15,16,17,18].
The powders of Eu-doped NaYF4 compound were synthesized using the economic wet process, which in its essence is co-precipitation in the presence of Na2-ethylenediaminetetraacetic acid (EDTA). In a typical procedure, 2.1 g NaF (0.05 mol) was dissolved in 60 mL of deionized water. Another solution was prepared by mixing a × 16 mL of 0.2-mol/L aqueous solution of YCl3 and b × 16 mL of 0.2-mol/L solution of EuCl3 and 20 mL of 0.2-mol/L EDTA aqueous stock solution to form the metal-EDTA complex (a + b = 1). All the chemicals were acquired from Millipore-Sigma. The complex solution was injected in the NaF solution quickly, and the mixture was stirred vigorously for 1 h at room temperature. After stirring, the mixture was allowed to stay overnight for the precipitate to settle. The precipitate was collected and washed several times with distilled water and anhydrous ethanol. In the second stage of the process, the precipitate was dried under vacuum to remove any traces of water. The resulting micro-crystalline powder had a doping rate according to formula NaY a F4: Eu3+ b . For instance, the 10% molar concentration of Eu corresponded to a = 0.9, b = 0.1. We synthesized the powders at various molar proportions between Y and Eu.
To investigate crystalline properties, we conducted the X-ray diffraction (XRD) spectroscopy of the obtained powders using a Bruker D2 Phaser X-ray diffractometer. The results are presented in Figure 2. Spectrum 1 corresponds to a portion of compound NaY0.9F4:

XRD spectra of NaYF4:Eu3+ powders at different molar concentrations of Eu. Spectrum 1 corresponds to NaY0.9F4:
The synthesized compounds were reduced to nano-powders by ball-milling in water using a PQ-N04 Planetary Ball Mill from Across International. The nano-powders were dried and transferred to organic solvent diglyme. The size distribution of the obtained NPs was measured using the Dynamic Light Scattering (DLS) method with a Zetasizer DLS instrument from Malvern Instruments. DLS scan of the size distribution of the NPs is presented in Figure 3. The size of the NPs (assuming their spherical shape) was determined as 179 ± 35 nm.
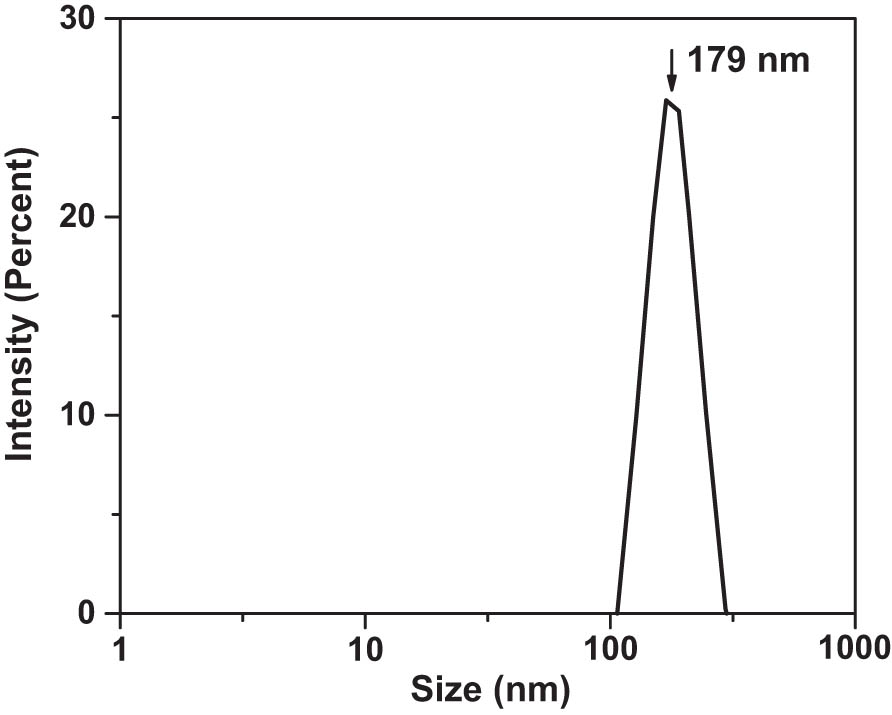
Size distribution of the NPs dispersed in diglyme. Concentration was ∼4 mg of solids per ∼3 mL liquids. The nanocolloid was filtered with a 1.0 μm filter.
2.2 Optical properties of the spectrum converting compounds
The mechanism of spectrum conversion in Eu3+ is downshifting as illustrated in the energy level diagram in Figure 4 [21]. After absorbing UV photons and making transitions shown in the left part of the diagram, excited Eu3+ ions radiationlessly relax to lower energy levels and emit visible and NIR photons during the transition further down the energy ladder in the right half of the diagram. The samples for optical spectroscopy measurements were prepared by compressing the nano-powders into pellets using a 5-T hydraulic press. Figure 5 presents the diffuse reflectance spectrum of NaY0.4F4:
![Figure 4
Energy level diagram of an Eu3+ ion [21].](/document/doi/10.1515/ntrev-2024-0013/asset/graphic/j_ntrev-2024-0013_fig_004.jpg)
Energy level diagram of an Eu3+ ion [21].
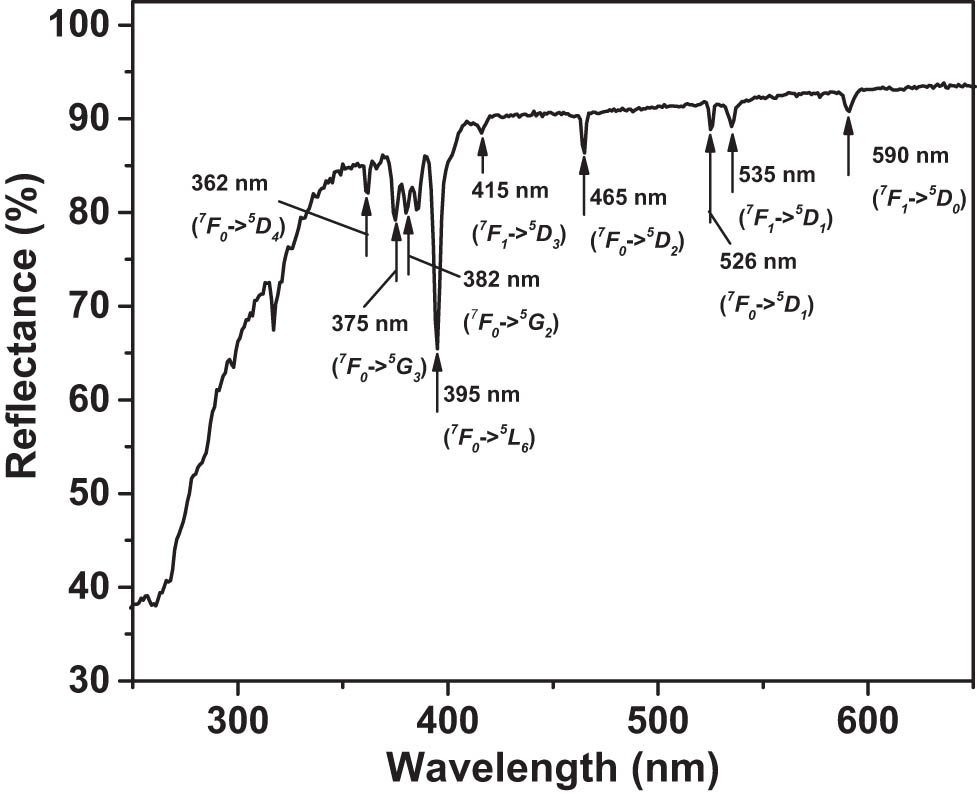
Diffuse reflectance spectrum of NaY0.4F4:
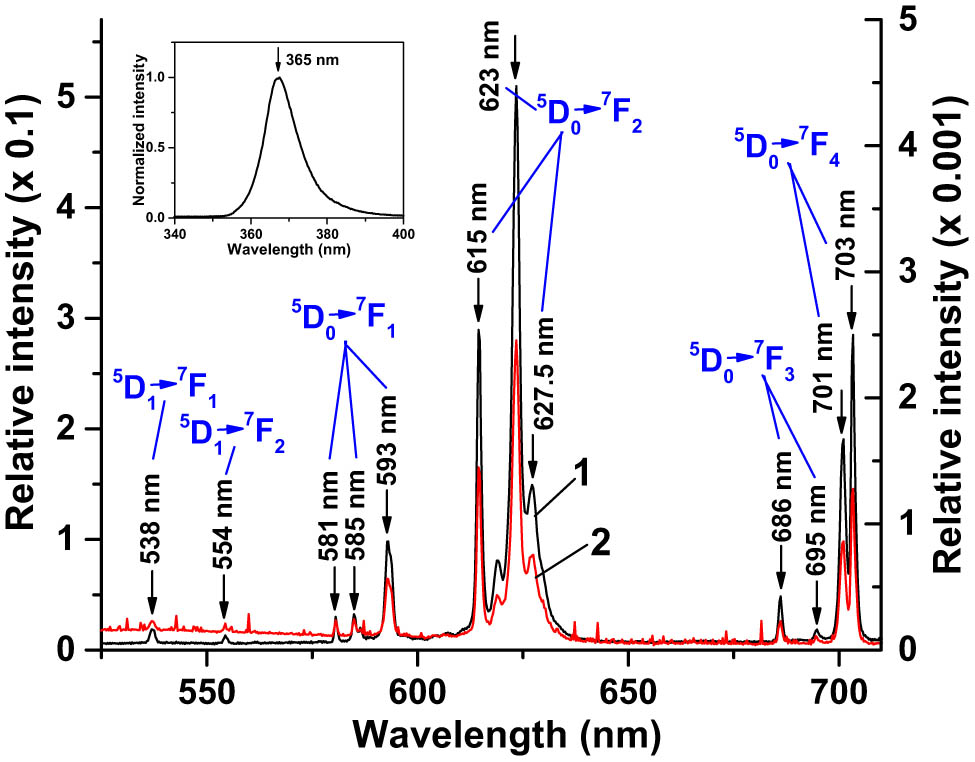
PL spectrum of (1) NaY0.4F4:
![Figure 7
PL spectrum of NaY0.4F4:
Eu
0.6
3
+
{\text{Eu}}_{0.6}^{3+}
powder in Figure 6 presented together with the spectral peak of the pumping UV LED radiation reflected from the powder sample. Also shown are the normalized IPCE spectra of (1) IMM [23], (2) SHJ [24], and (3) CIGS [25] solar cells used in this study.](/document/doi/10.1515/ntrev-2024-0013/asset/graphic/j_ntrev-2024-0013_fig_007.jpg)
2.3 Polymer nanocomposite SCLs
For making SCLs, the NPs of NaY0.4F4:
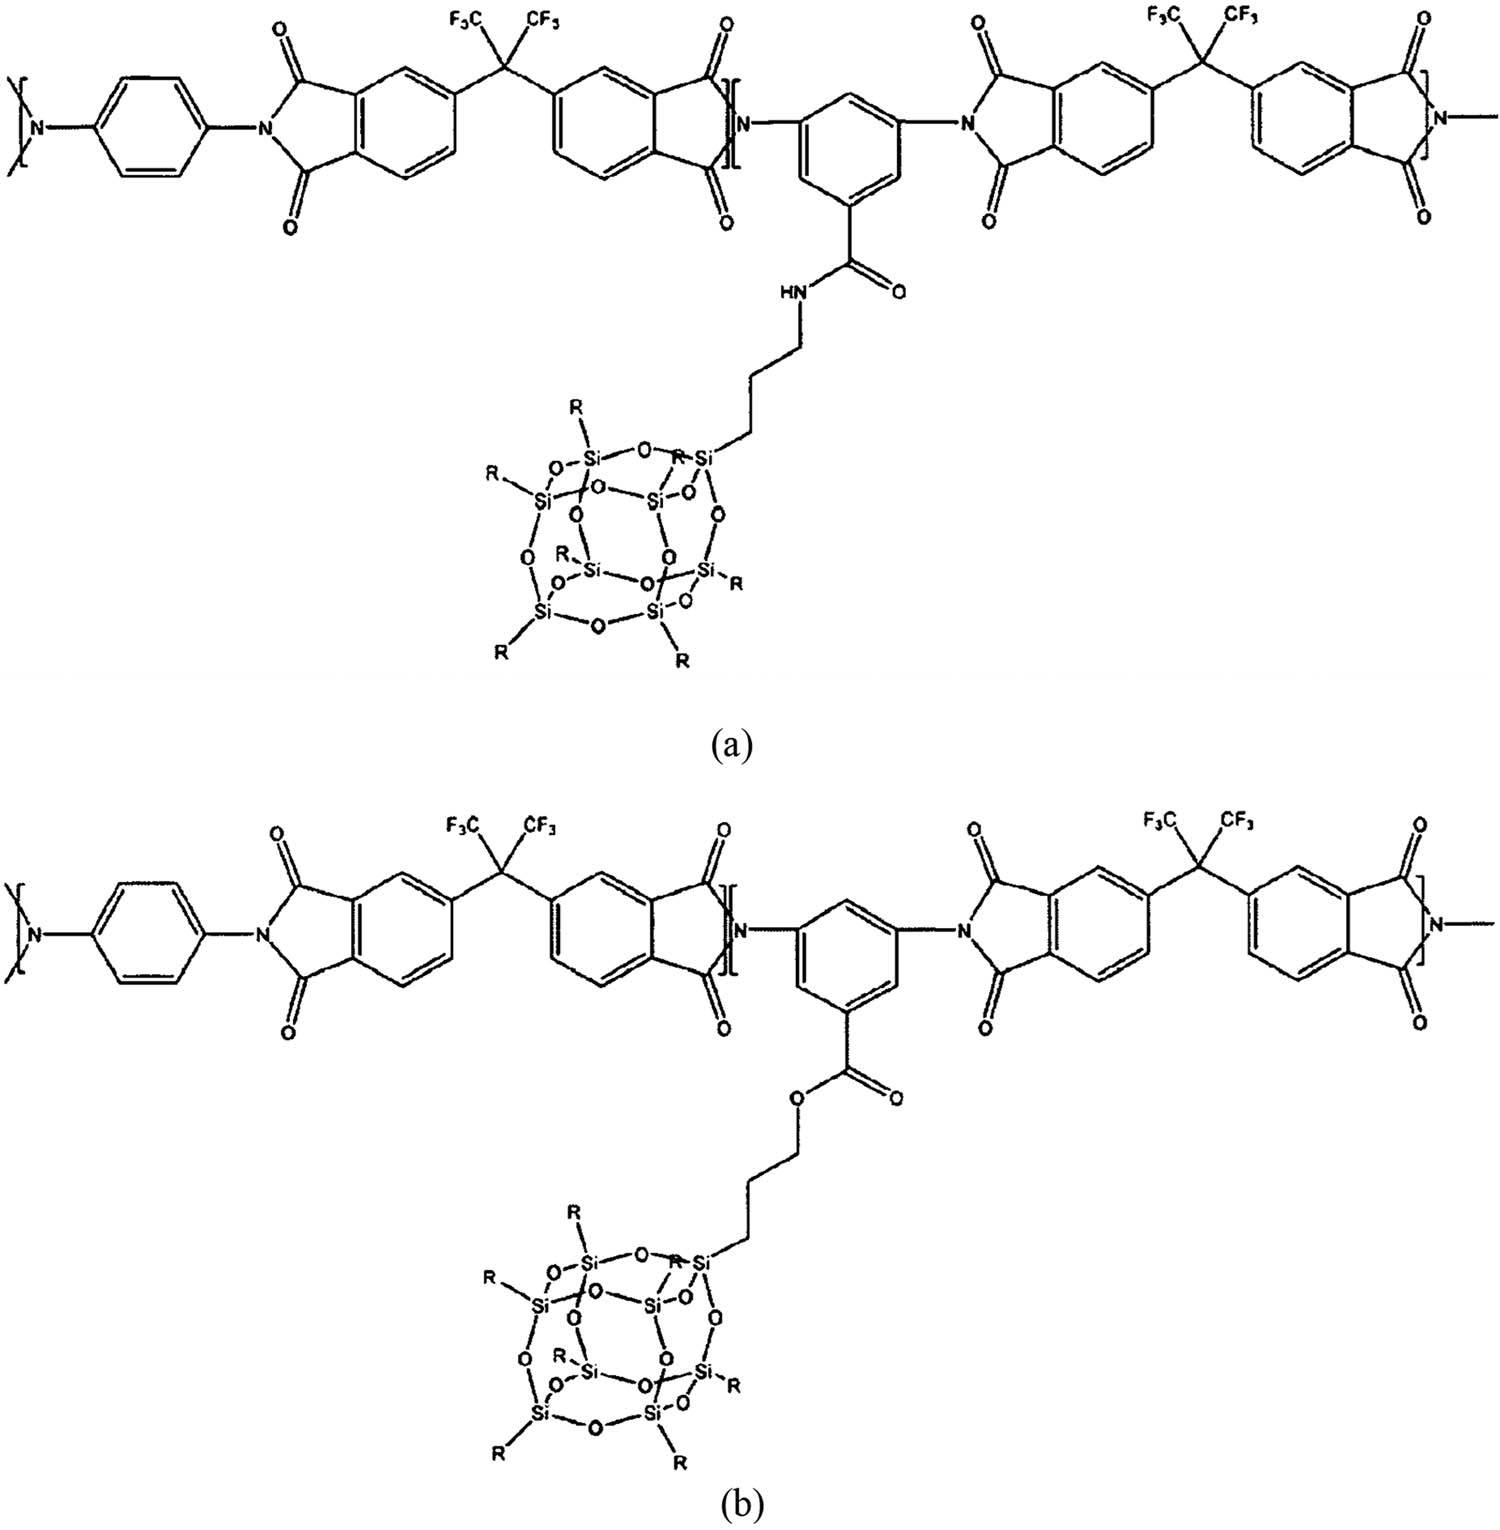
Chemical formula of the chain link of CORIN polyimide with tethered OS pending unit connected with (a) an amide and (b) an ester.
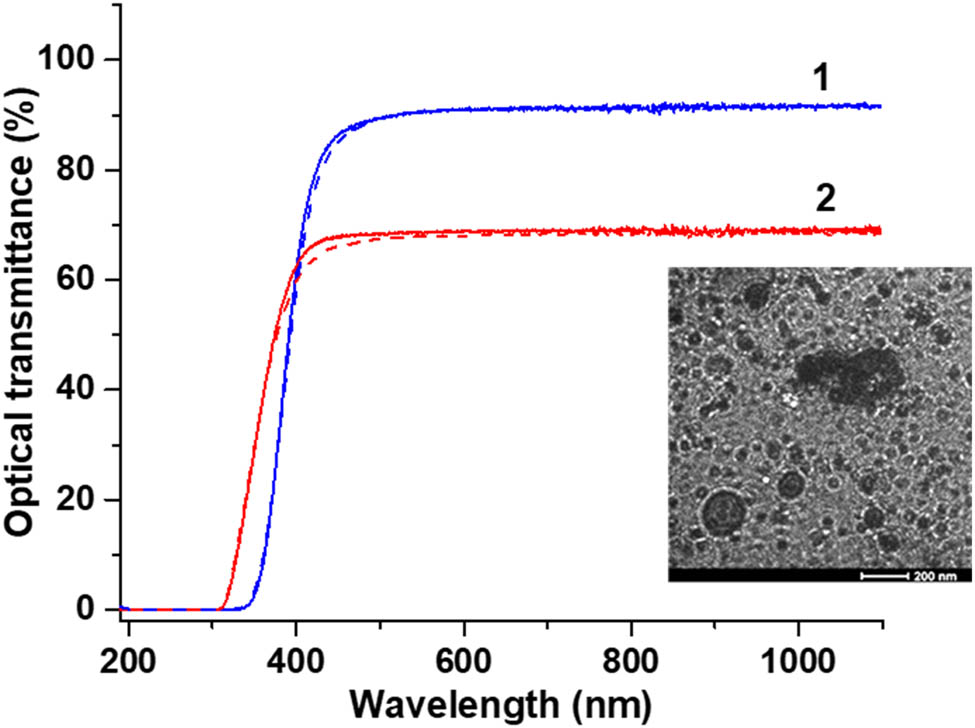
Typical optical transmittance spectrum of (1) the coating made of pure CORIN (thickness = 15 ± 6.4 μm) and (2) SCL (thickness = 17.1 ± 5.9 μm) on a 158 μm thick microscope cover glass. Dashed lines show the transmittance after exposure to UV radiation in vacuum for 1,600 ESH. The insert is the high-resolution SEM image of the SCL coating taken with a JEOL SEM instrument. Dark dots are the NPs.
SCLs were deposited on solar cells using the open-air multi-beam multi-target pulsed laser deposition method invented by D. Darwish [28,29,30,31,32,33,34,35,36,37,38,39,40,41,42,43,44,45,46]. The advantages of the method are low consumption of the material, potentially high accuracy of the thickness of the deposited layer (unfortunately not implemented in this work), and precise control of the concentration of the constituents along and across the deposited layer. We used two variants of the method. The first variant included preparation of a nanocomposite SCL compound by adding NPs to CORIN solution in diglyme at a proportion of approximately 0.53 mg solids per mL liquids and intense stirring. An SCL was then deposited on a moving solar cell using the ejection in open air (with flowing argon) of the liquid composition with a pulsed laser beam [46]. In the second variant, SCLs were deposited on solar cells using the open-air (with flowing argon) two-beam two-target PLD [43,46]. The first target was a pellet of a compressed spectrum converting nano-powder. The second target was a solution of CORIN in diglyme. A 1,064 nm Q-switched Nd:YAG pulsed laser with 9-ns-long pulses, 0.4 J energy per pulse, and 10 pulses per second pulse rate was used as a source of laser pulses. After deposition, the polymer nanocomposite layers were heat-cured using a heat gun and overnight baking on a hot plate in ambient air at 80°C.
2.4 Experimental setup
Figure 10 presents the schematic of the experimental setup for testing SCL prototypes integrated with PV cells. A solar simulator LCS-100 model 94011A-ES from MKS-Newport with a Xe-lamp and Air Mass (AM) 0 filter (simulating solar spectrum above the atmosphere) was used as a light source. The shutter of the simulator was controlled with a shutter controller 71445 from MKS-Newport. The intensity of the light on the surface of a PV cell was adjusted by changing elevation of the solar simulator over the cell. The irradiance in “suns,” the units equivalent to the sun irradiance on the ground (100 mW/cm2), was measured with a calibrated reference PV cell and a calibrated meter model 91150 V from MKS-Newport. The measurement of I–V characteristics was conducted automatically under computer control using LabVIEW software developed for MKS-Newport I–V Test Station PVIV-1A [47]. Voltage was automatically applied to the PV cell, and the flowing electric current was measured by a computer controlled Keithley 2400 Source and Measurement Unit. The unit was connected to the computer through GPIB-USB interface.
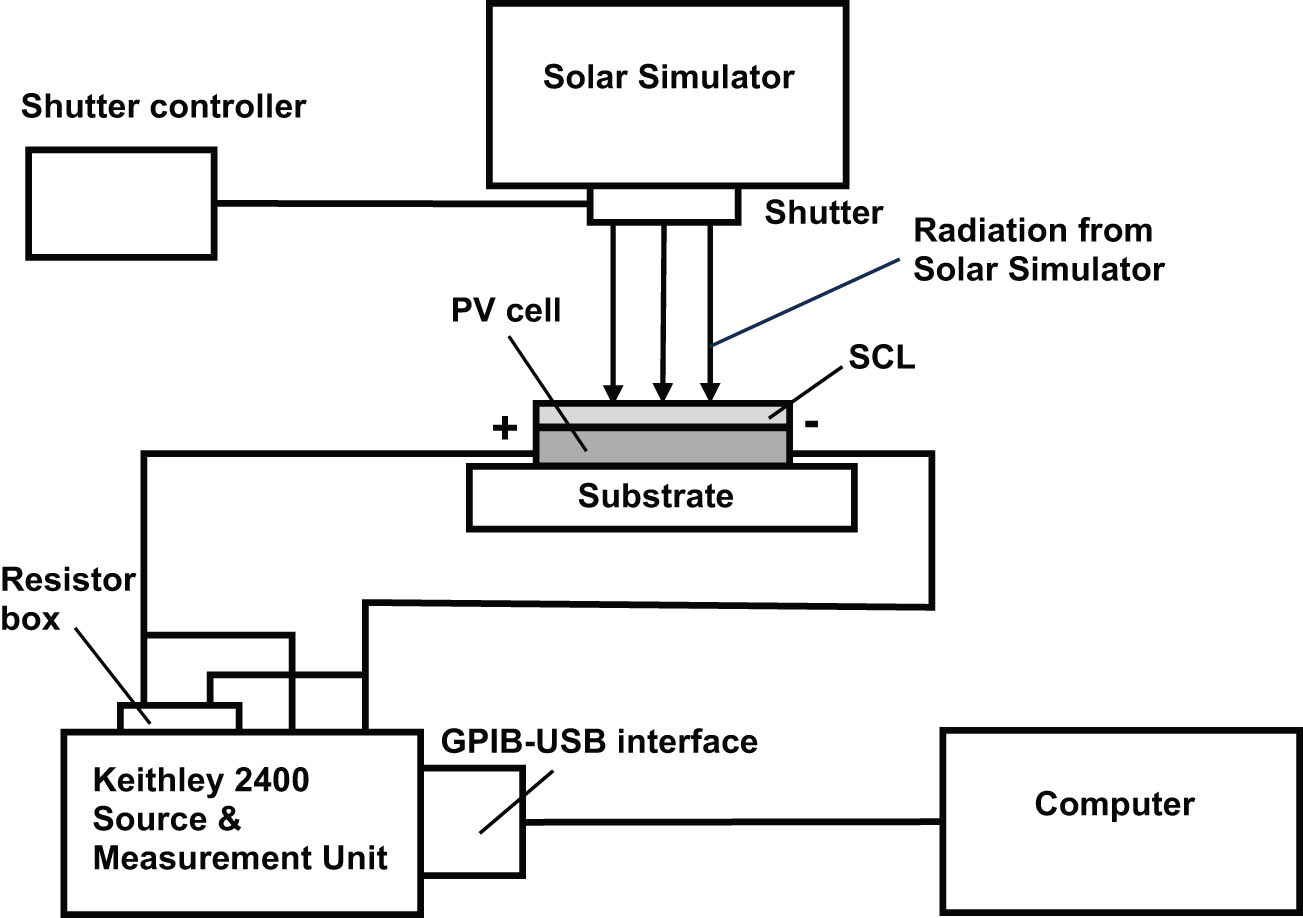
Schematic of the experimental setup for testing SCL prototypes deposited on PV cells.
The uncoated and coated solar cells were exposed in vacuum to UV radiation from 50 to 100 W LED arrays from Shenzhen Chanzon Technology Co., Ltd. This radiation had a spectral band of ∼20 nm around the peak at 365 nm suitable to simulate UV-A component of solar UV spectrum in space. Exposure time was calibrated in the Equivalent solar hours (ESH).
3 Results and discussion
3.1 I–V characteristics of the coated PV cells
For testing SCLs, we chose three types of solar cells: silicon heterojunction (SHJ) cells from Solestial (dimensions: 3.0 cm × 4.65 cm, ∼14.0 cm2 area and dimensions: 3.0 cm × 5.2 cm, 15.6 cm2 area), copper-indium-gallium-selenide (CIGS) flexible cells (dimensions: 4.75 cm × 4.75 cm, 17.77-cm2 active area; according to the manufacturer, the cells are “truly bare” with no protective coating over the front conductors made of silver conductive paste), and epitaxial lift-off inverted metamorphic multijunction (IMM) flexible cells from MicroLink (dimensions: 3.0 cm × 6.6 cm, 19.8 cm2 area). Investigation of possible improvement in the PV energy conversion efficiency of PV cells and UV stability was conducted by comparing the I–V characteristics of the cells coated with SCLs against bare cells or the cells coated with pure CORIN. A total of five randomly picked SHJ, eight CIGS, and five IMM cells were used in the study. SHJ and IMM cells demonstrated no noticeable ageing for at least 8 months of storage in the lab conditions at room temperature. CIGS cells, according to manufacturer’s recommendations, were stored in inert gas (argon) atmosphere at room temperature (to prevent degradation of silver front conductors) and did not show ageing for 6 months. The thicknesses of SHJ, CIGS, and IMM cells were measured as 250 ± 2, 68 ± 3, and 30 ± 2 μm, respectively. The thickness of CORIN/SCL coating on SHJ cells was not possible to measure precisely because the polymer penetrated inside the micro-pores on the surface made by etching to reduce optical reflectance. It was estimated to be between 6 and 16 μm. The thicknesses of CORIN/SCL coatings of CIGS cells after curing were measured as 15.6 ± 8.1 μm; the CORIN/SCL on IMM thicknesses were measured as 6.1 ± 3.2 μm. Despite being uneven, the coatings were optically smooth (roughness did not exceed ∼0.2–0.3 μm) since they demonstrated mirror-like reflection of incident light.
The PL spectrum of the SCL excited by the 365 nm UV LED is presented in Figure 6 (curve 2). It fully replicated the PL spectrum of the Eu-doped nano-powder excited with the same source (Figure 6, curve 1). PLQY of the SCL was estimated as ∼0.5%, much less than that of the nano-powder. This was because the dispersion of the NPs in the solid polymer matrix at a concentration of ∼26.5 mg/mL resulted in ∼6.4 × 1019 cm−3 concentration of the photoluminescent spectrum downshifting Eu3+ ions while their concentration in the nano-powder was ∼1.3 × 1022 cm−3, 203 times greater. Second, the incident UV radiation was partially absorbed in the CORIN polymer matrix of the SCL. We also inspected the spectra of the solar simulator radiation reflected from the SCL-coated PV cells in comparison with the spectra from CORIN-coated ones. Typical examples are presented in Figure 11 (SCL on an SHJ cell) and Figure 12 (SCL on an IMM cell). Zoom-in inserts in the figures show the difference between SCL-related and non-SCL spectra in the region 550–650 nm where the PL peaks at 615 and 623 nm attributed to the SCL are discernible. This extra visible/NIR PL radiation generated by the SCL joined the visible/NIR light from the solar simulator on its passage to the PV cell according to the concept illustrated in Figure 1.
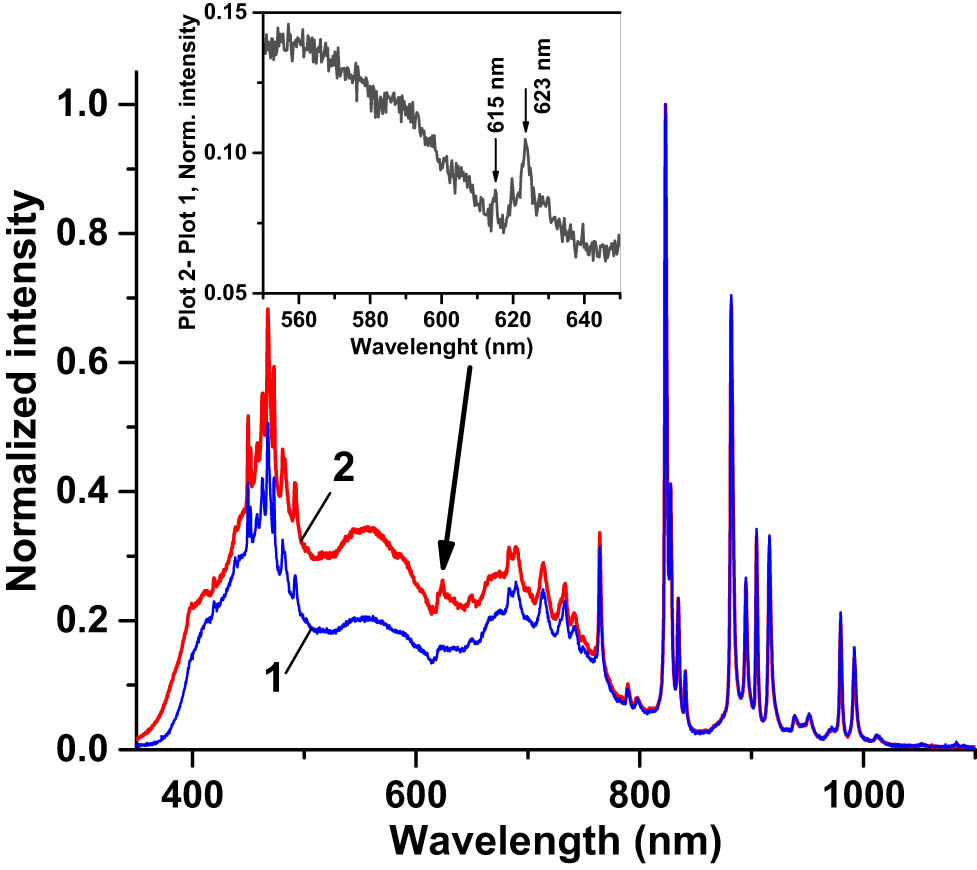
Normalized (to the highest peak at 824 nm) spectrum of the radiation of the solar simulator (AM0 filter) reflected from (1) SHJ cell coated with two layers of CORIN and (2) SHJ cell coated with one layer of CORIN and SCL on the top. Zoom-in insert shows the difference between graphs 2 and 1 in the spectral region 550–650 nm where the PL peaks at 615 and 623 nm attributed to the SCL are visible.
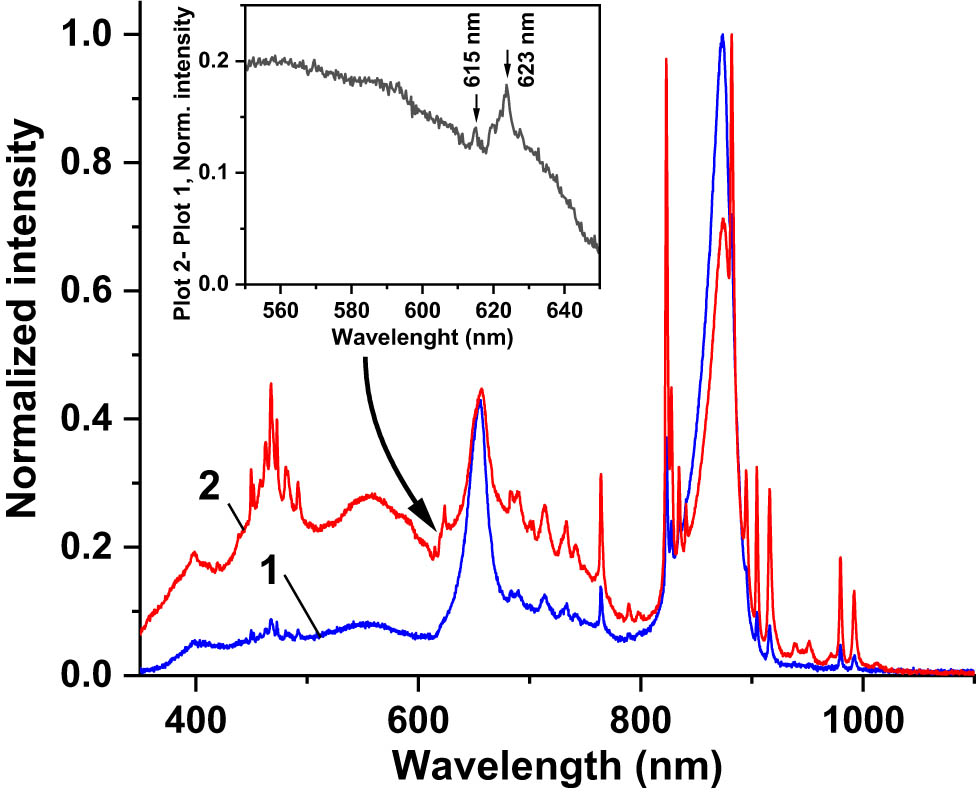
Normalized (to the highest peak at 873 nm) spectrum of the radiation of the solar simulator (AM0 filter) reflected from (1) IMM cell coated with CORIN and (2) IMM cell coated with SCL. Zoom-in insert shows the difference between graphs 2 and 1 in the spectral region 550–650 nm where the PL peaks at 615 and 623 nm attributed to the SCL are visible.
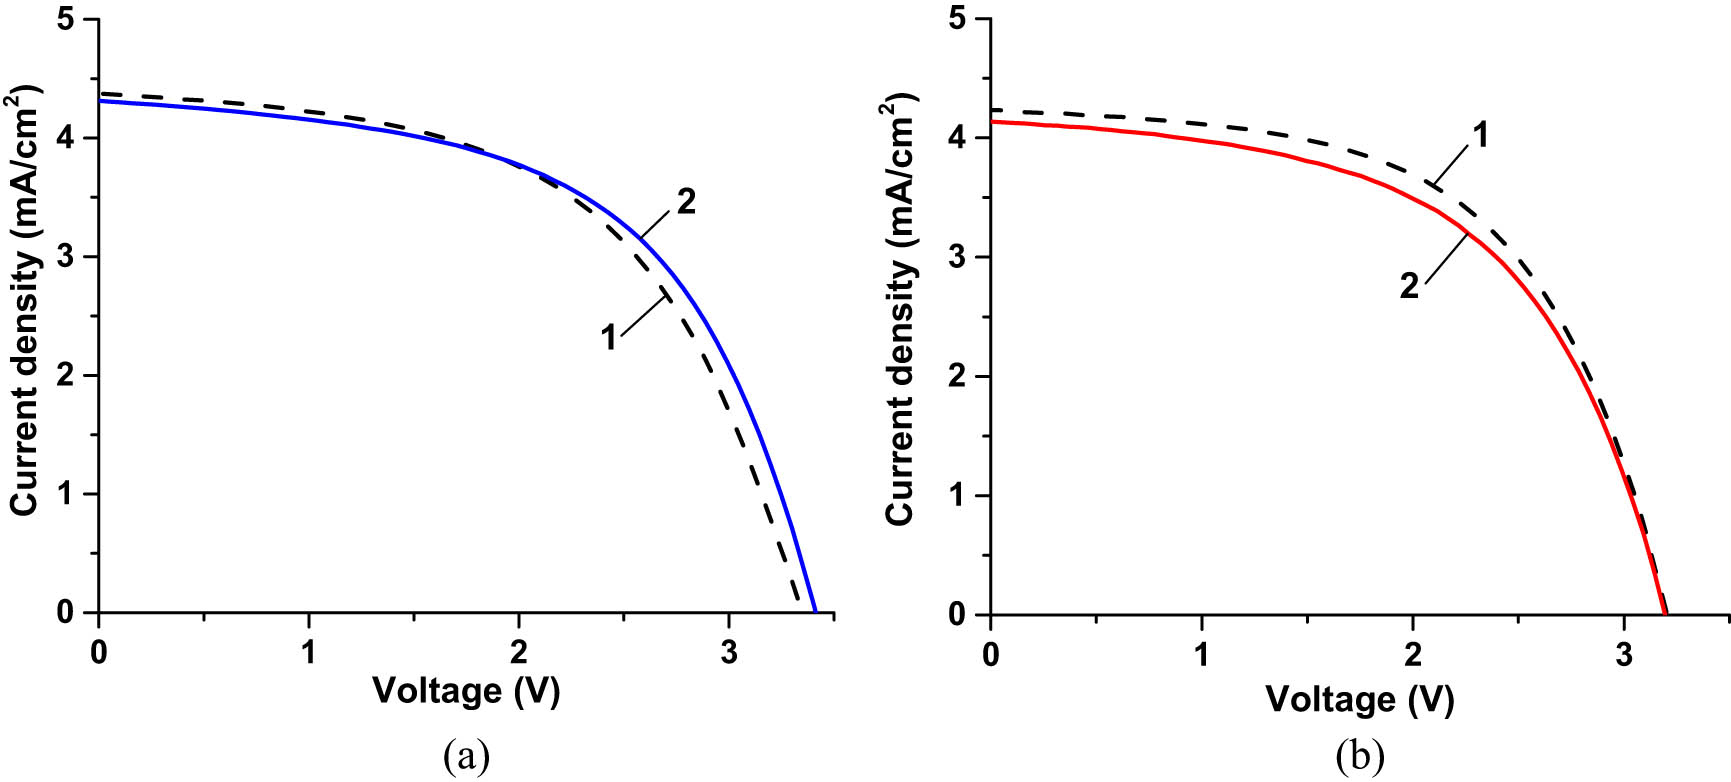
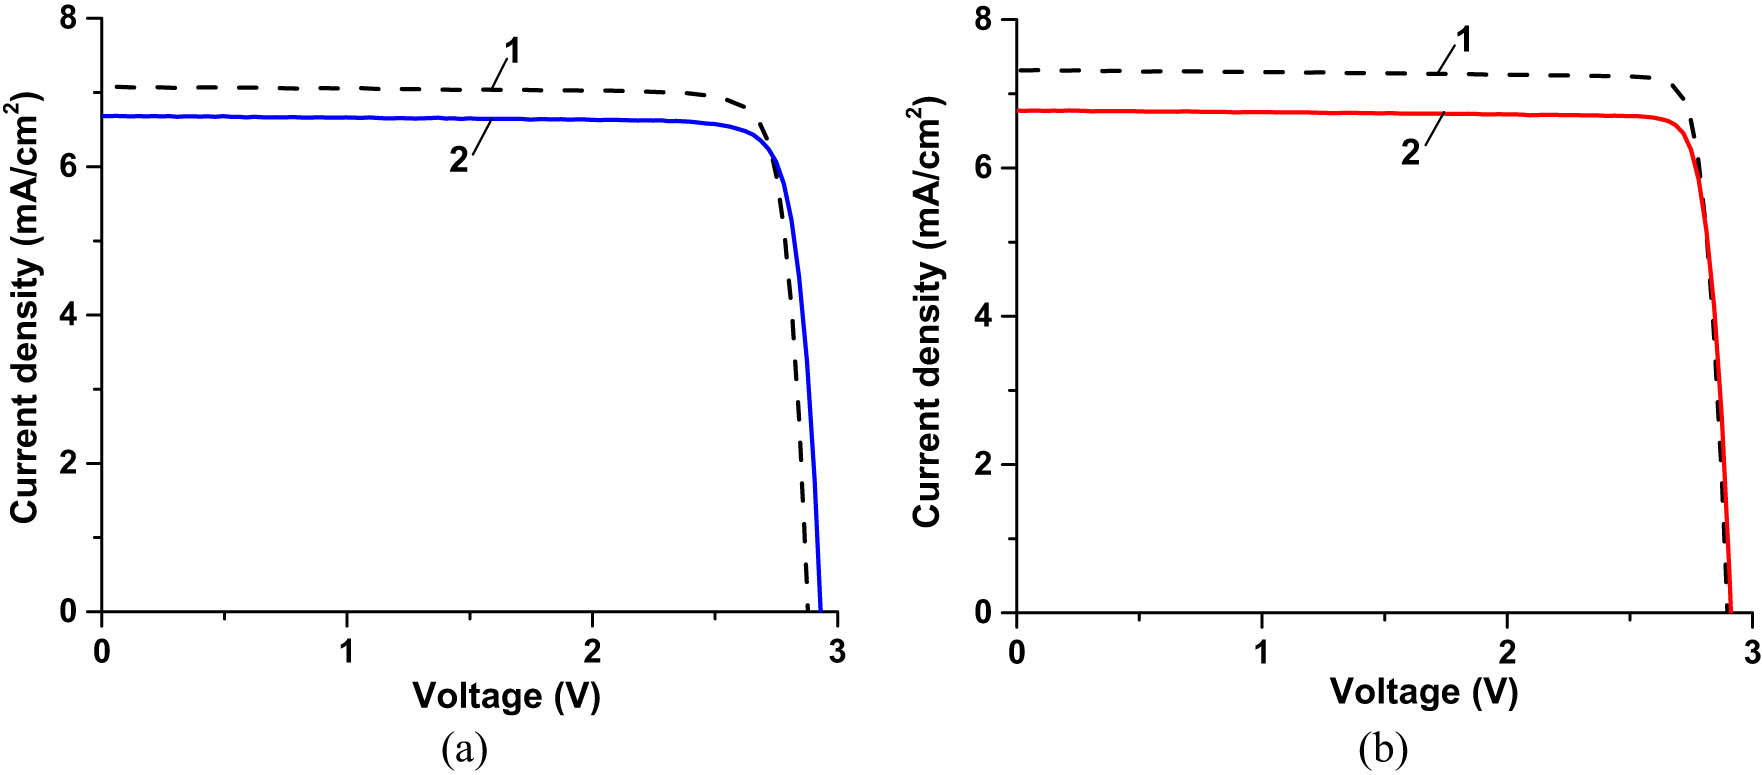
Graphs in Figure 13a and b present the I–V characteristics of the SHJ cells before and after coating with no exposure to UV radiation. For the sake of comparability of the I–V characteristics regardless of the actual area of the cells, instead of photoelectric current I current density J was used in all I–V plots. Figure 13a illustrates the case when two layers of CORIN were deposited and Figure 13b illustrates the case when one layer of CORIN and the SCL on the top as in the configuration in Figure 1 (bottom CORIN functioned as a protecting layer). In both cases the coatings brought the photogenerated current density down compared to the no-coating case, SCL brought it down more.
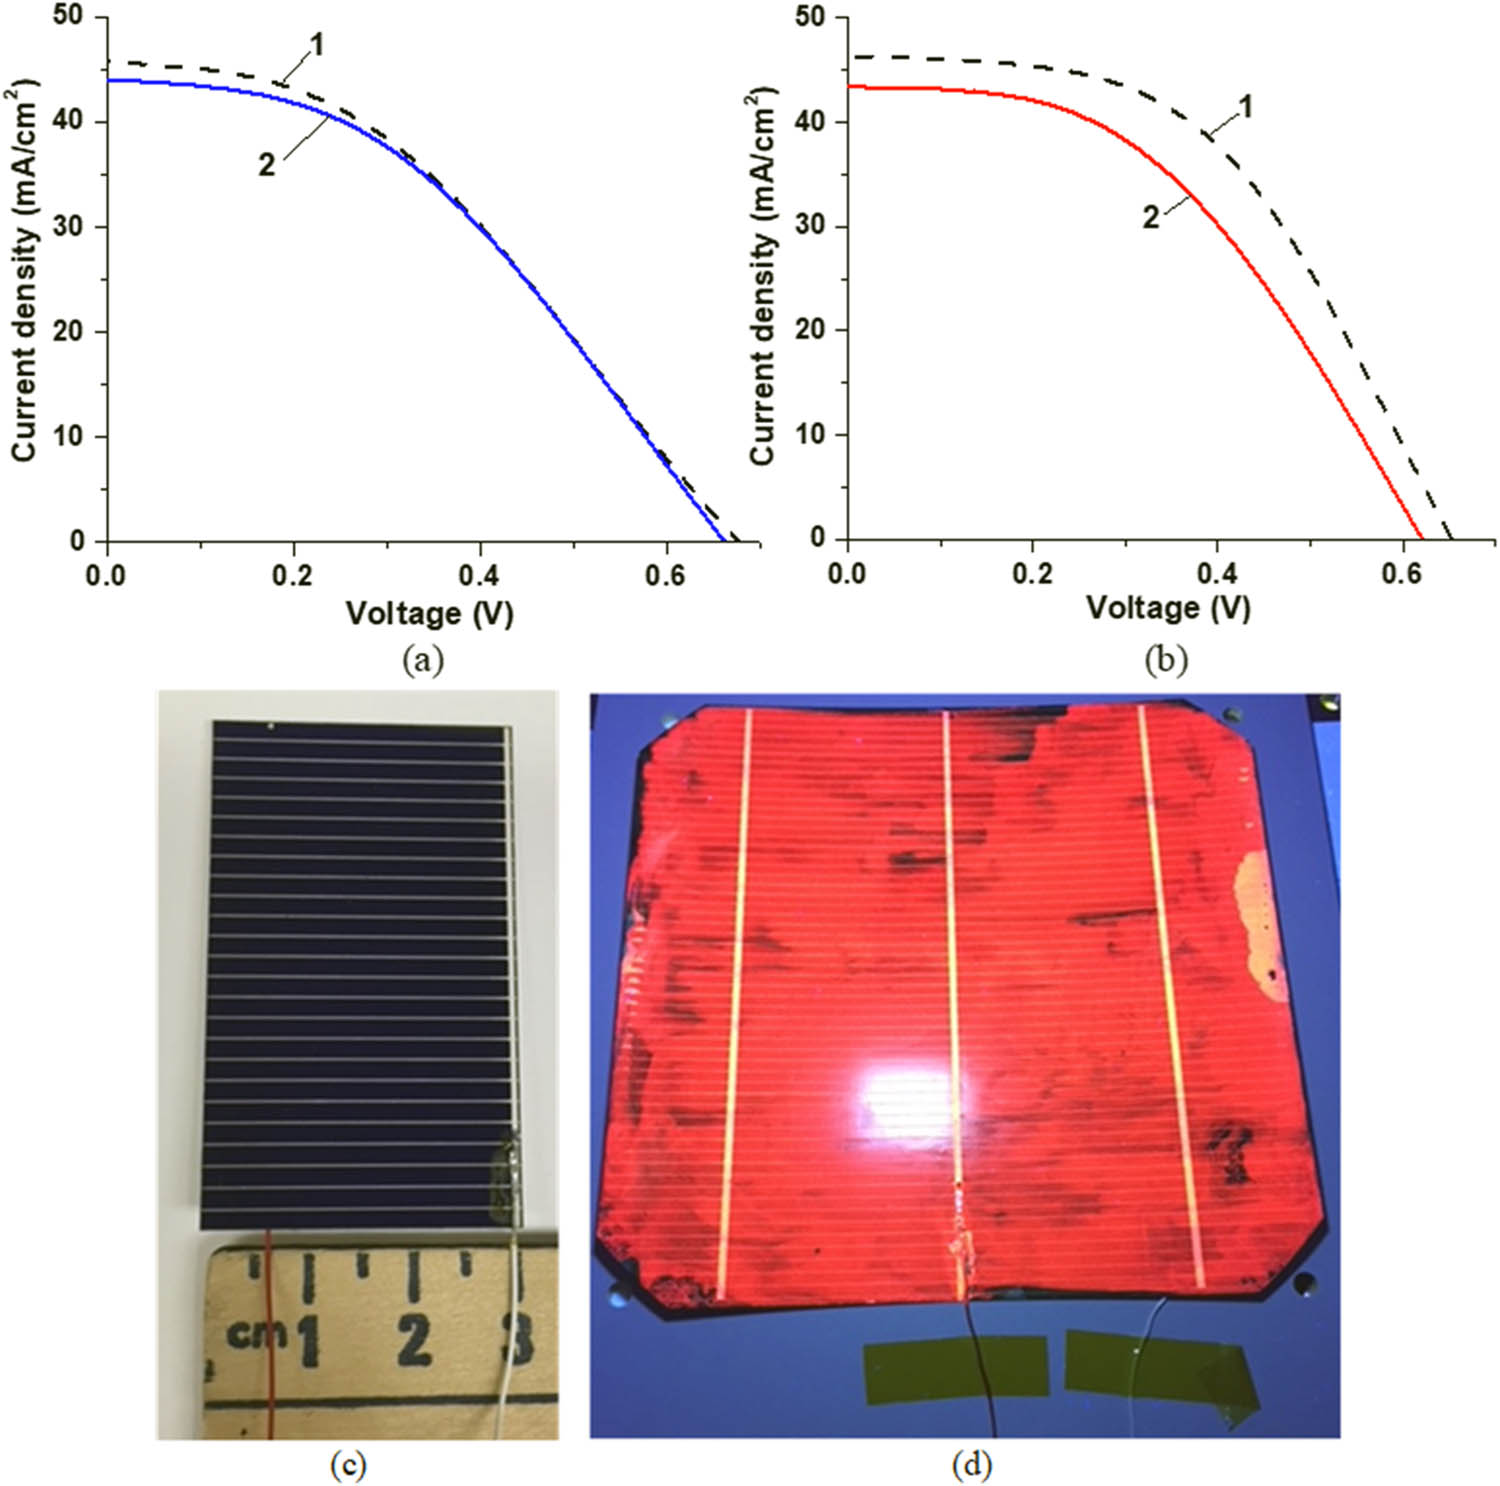
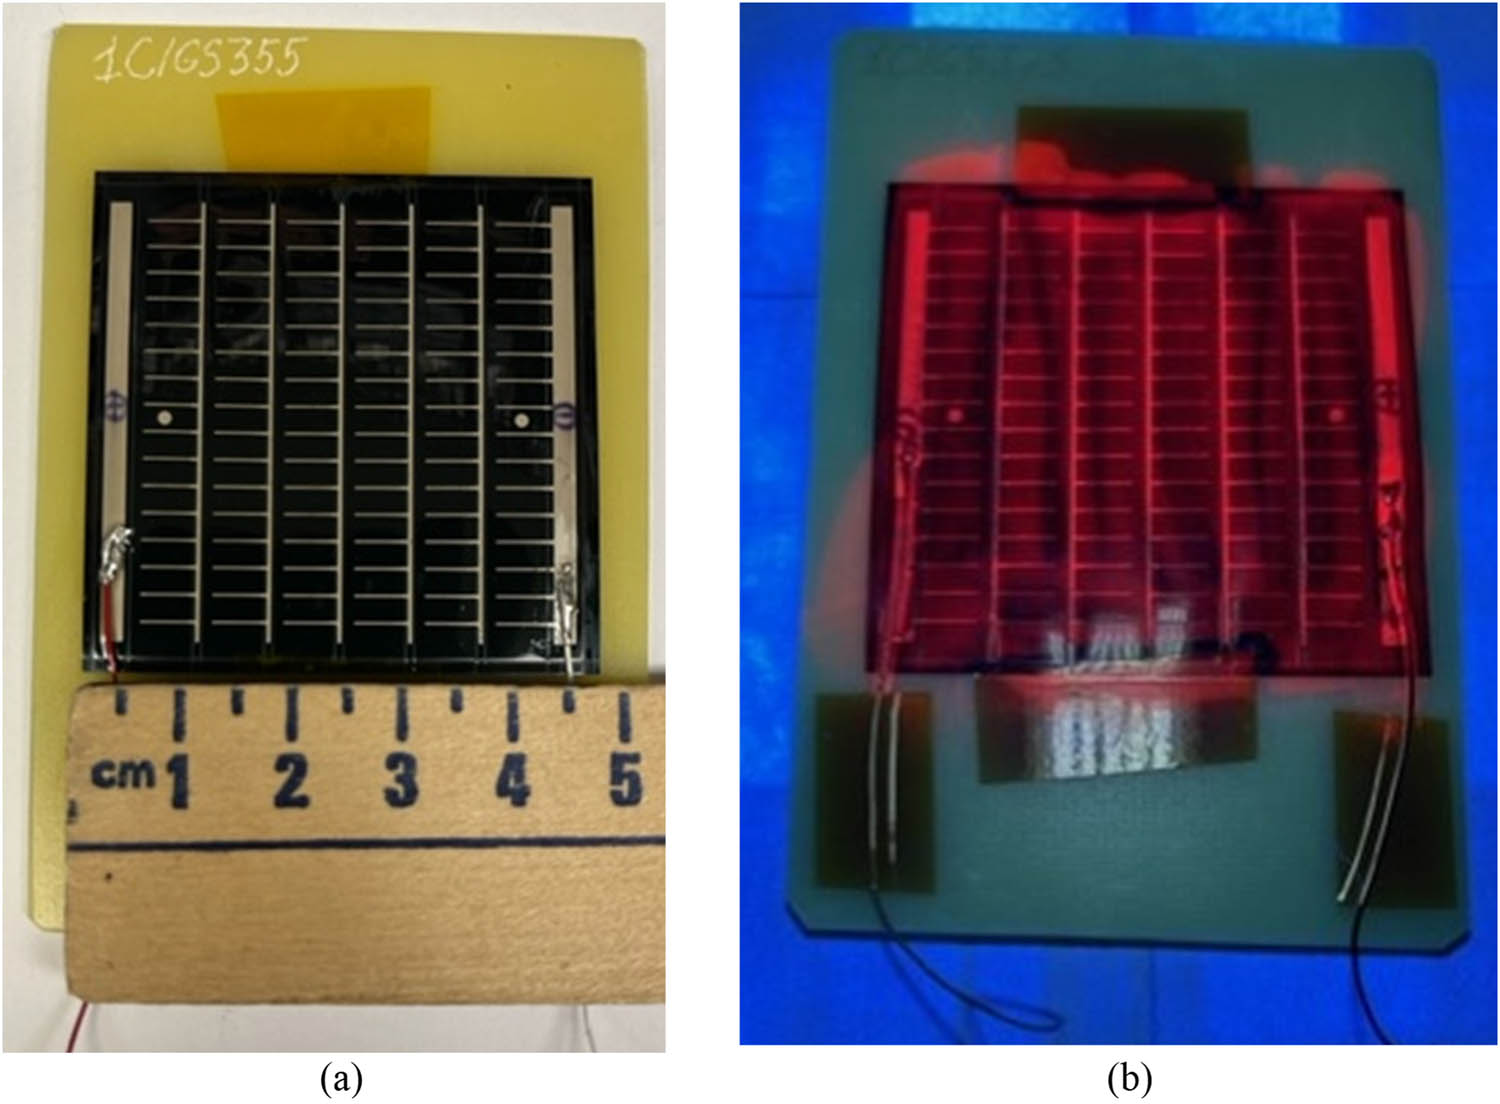
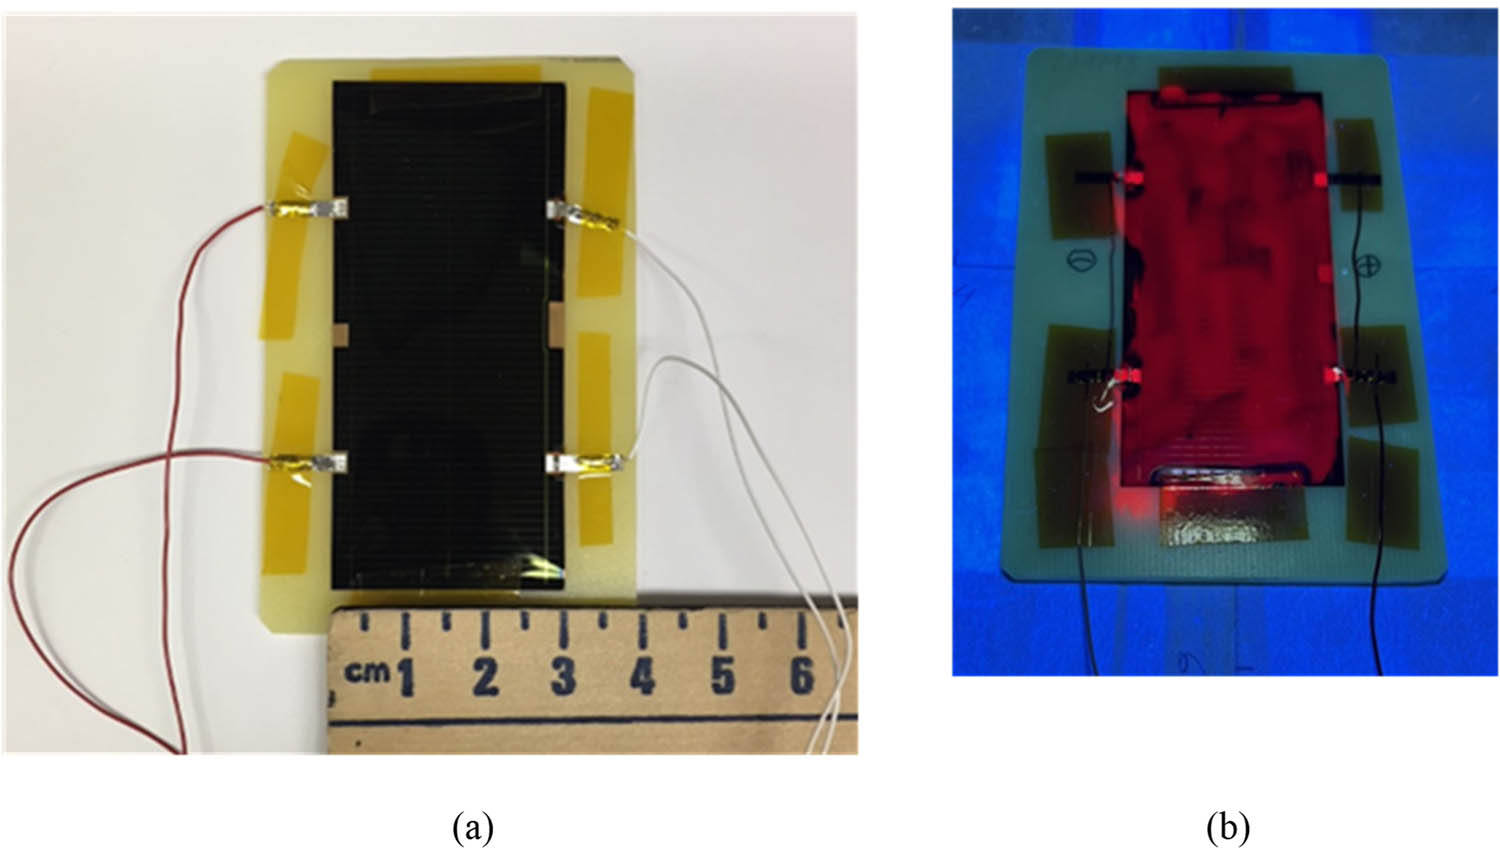
(a) I–V characteristics of an unexposed SHJ cell before coating (curve 1) and after coating with two layers of CORIN (curve 2). (b) I–V characteristics of an unexposed SHJ cell before coating (curve 1) and after coating with one layer of CORIN and SCL on the top (curve 2). During I–V measurements, the cells were illuminated by the solar simulator with an intensity equivalent to 1.367 Sun (AM0 filter), the so-called solar constant – solar irradiance above the atmosphere. (c) General view of a bare SHJ cell. It was cut from an SHJ wafer. (d) An SHJ wafer coated with one layer of CORIN and SCL on the top illuminated with a 365 nm UV LED. Red PL in (d) was produced by the SCL.
Figure 13c presents the photograph of a bare SHJ cell at room illumination. The cell was cut from a 5-inch (127-mm) SHJ wafer. An SHJ wafer coated with one layer of CORIN and SCL on the top and illuminated with a 365-nm UV LED is shown in Figure 13d. Red PL was produced by the SCL.
The performance parameters extracted from the I–V characteristics in Figure13a and b (as described in the Application Note [48]) are presented in Table 1, the third and fourth columns, rows 2 through 5. Besides standard parameters, such as open circuit voltage V oc, short circuit current I sc, short circuit current density J sc, maximum power P max, and efficiency η, we also computed maximum power density PDmax = P max /A, where A is the active cell area. This parameter was convenient in comparing PV power generated by different cells regardless of their actual area. As can be seen from Table 1 (the fourth column, rows 2 and 3), the 0.1% drop of η of the unexposed bare cell from 11.2 down to 11.1% brought by the double-layer CORIN coating was statistically insignificant: less than the maximal statistical spread of 1.0%. The SCL-caused 2.1% efficiency drop from 13.9 down to 11.8% was greater than the 1.5% spread. Correspondingly, the same applied to P max and PDmax (η was proportional to P max and PDmax). As was verified by the reflectance measurements, both coatings reduced the so-called optical coupling of the incident light to the cells [6] or, in other words, increased the reflection of the incident light. This happened primarily because the polymer smoothened the surface texture of the cells intentionally etched to minimize reflectance. In the case of the SCL, another negative factor was the increased light scattering mentioned above (when the optical transmittance data in Figure 9 was discussed). The spectrum downshifted PL did not compensate for the loss of the visible solar radiation reaching the cell.
Performance parameters of the SHJ cells extracted from their I–V characteristics
| Number of the row | Time of exposure | 0 ESH | ∼3,000 ESH | ∼6,000 ESH | |
|---|---|---|---|---|---|
| Parameter | V oc | P max | P max | P max | |
| (I sc) | (PDmax) | (PDmax) | (PDmax) | ||
| [J sc] | [η]a | [η] | [η] | ||
| Unit | V | mW | mW | mW | |
| (mA) | (mW/cm2) | (mW/cm2) | (mW/cm2) | ||
| [mA/cm2] | [%] | [%] | [%] | ||
| 1 | Uncoated SHJ cell | 0.681 ± 0.007 | 176 ± 10 | 173 ± 10b | 170 ± 12c |
| (708 ± 8) | (11.3 ± 0.6) | (11.1 ± 0.6) | (10.9 ± 0.8) | ||
| [45.3 ± 0.5] | [10.5 ± 0.5] | [10.2 ± 0.5] | [10.0 ± 0.8] | ||
| 2 | SHJ cell before coating with two layers of CORIN | 0.681 ± 0.007 | 190 ± 10 | 184 ± 11d | 178 ± 13d |
| (711 ± 8) | (12.2 ± 0.6) | (11.8 ± 0.6) | (11.4 ± 0.8) | ||
| [45.6 ± 0.5] | [11.2 ± 0.5] | [10.8 ± 0.6] | [10.5 ± 0.8] | ||
| 3 | SHJ cell coated with two layers of CORIN | 0.664 ± 0.007 | 188 ± 10 | 188 ± 10e | 189 ± 11c |
| (685 ± 7) | (12.1 ± 0.6) | (12.1 ± 0.6) | (12.2 ± 0.7) | ||
| [43.9 ± 0.4] | [11.1 ± 0.5] | [11.1 ± 0.5] | [11.2 ± 0.7] | ||
| 4 | SHJ cell before coating with one layer of CORIN and one SCL on the top | 0.654 ± 0.007 | 211 ± 12 | 204 ± 14d | 199 ± 17d |
| (645 ± 7) | (15.1 ± 0.9) | (14.6 ± 1.0) | (14.3 ± 1.2) | ||
| [46.2 ± 0.5] | [13.9 ± 0.9] | [13.4 ± 0.9] | [13.1 ± 1.1] | ||
| 5 | SHJ cell coated with one layer of CORIN and one SCL on the top | 0.681 ± 0.007 | 180 ± 10 | 189 ± 11f | 184 ± 11g |
| (604 ± 6) | (12.9 ± 0.7) | (13.5 ± 0.8) | (13.2 ± 0.8) | ||
| [43.3 ± 0.4] | [11.8 ± 0.6] | [12.3 ± 0.8] | [12.1 ± 0.7] | ||
aEfficiency was measured at an irradiance of 1.367 Sun (136.7 mW/cm2) with AM0 filter in the solar simulator and at the temperature in the lab varying between 22 and 27°C. It was corrected to the true efficiency that, according to ASTM E948-16 Standard [49], had to be measured at an irradiance of 1.0 Sun (100.0 mW/cm2) with AM 1.5 G filter at a temperature of 25°C. bExact exposure time was 3,321 ESH. cDue to the lack of experimental data, the values were estimated using the results of fitting experimental data in Figure 14. dExpected values estimated using the results of fitting experimental data in Figure 14. eExact exposure time was 3,147 ESH. fExact exposure time was 2,981 ESH. gExact exposure time was 6,205 ESH.
We exposed the SHJ cells to UV radiation in vacuum (simulating solar UV in space) for a duration varying from 5,000 to 7,000 ESH, measured I–V characteristics for different exposure durations t, and extracted P
max, PDmax, and η from each measured I–V characteristic. The change in η caused by UV exposure was evaluated using the dimensionless relative efficiency change Δη
rel = (η – η
BOL) × 100%/η
BOL to compare different cells regardless of the absolute values of the efficiency; η
BOL was the Beginning-of-Life (BOL) efficiency before exposure (t = 0 ESH). In Table 1
η
BOL is presented in the fourth column. Experimental plots of Δη
rel
vs duration t in ESH for the exposed cells are presented in Figure 14. Plots in Figure 14a and b were fitted with function Δη
rel(t) = [exp(Rt) − 1] × 100%, where fitting parameter R had the meaning of the efficiency evolution rate. Plot in Figure 14c was fitted with function Δη
rel(t) = A[1 − exp(R
1
t)] × 100%. The graphs of the fitting functions are presented by the sets of three lines: the middle, thicker line is the evolution graphs corresponding to the mean values of the fitting parameters
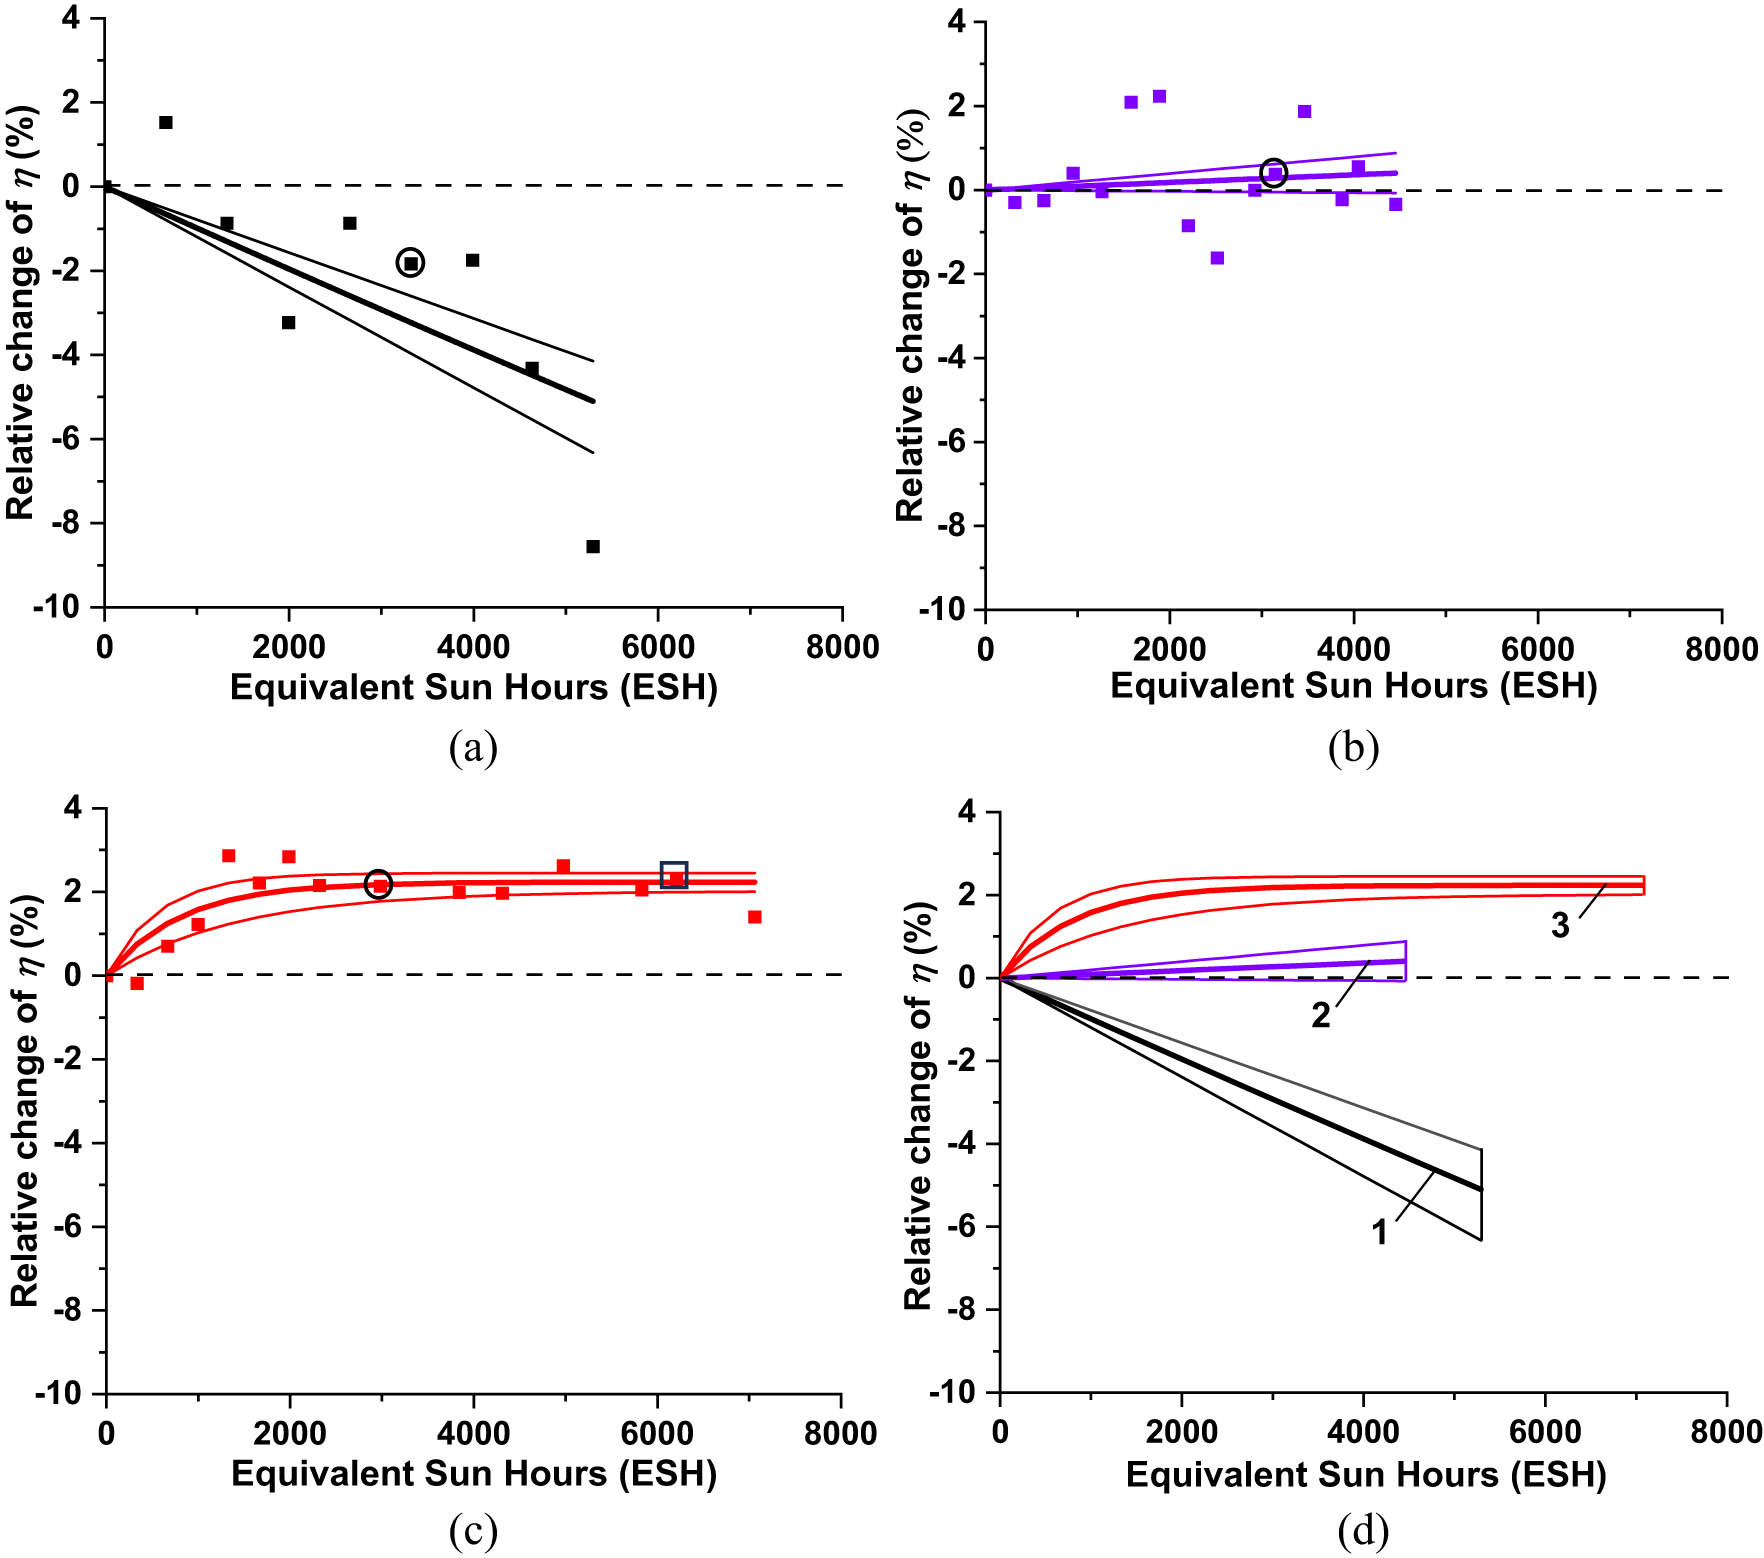
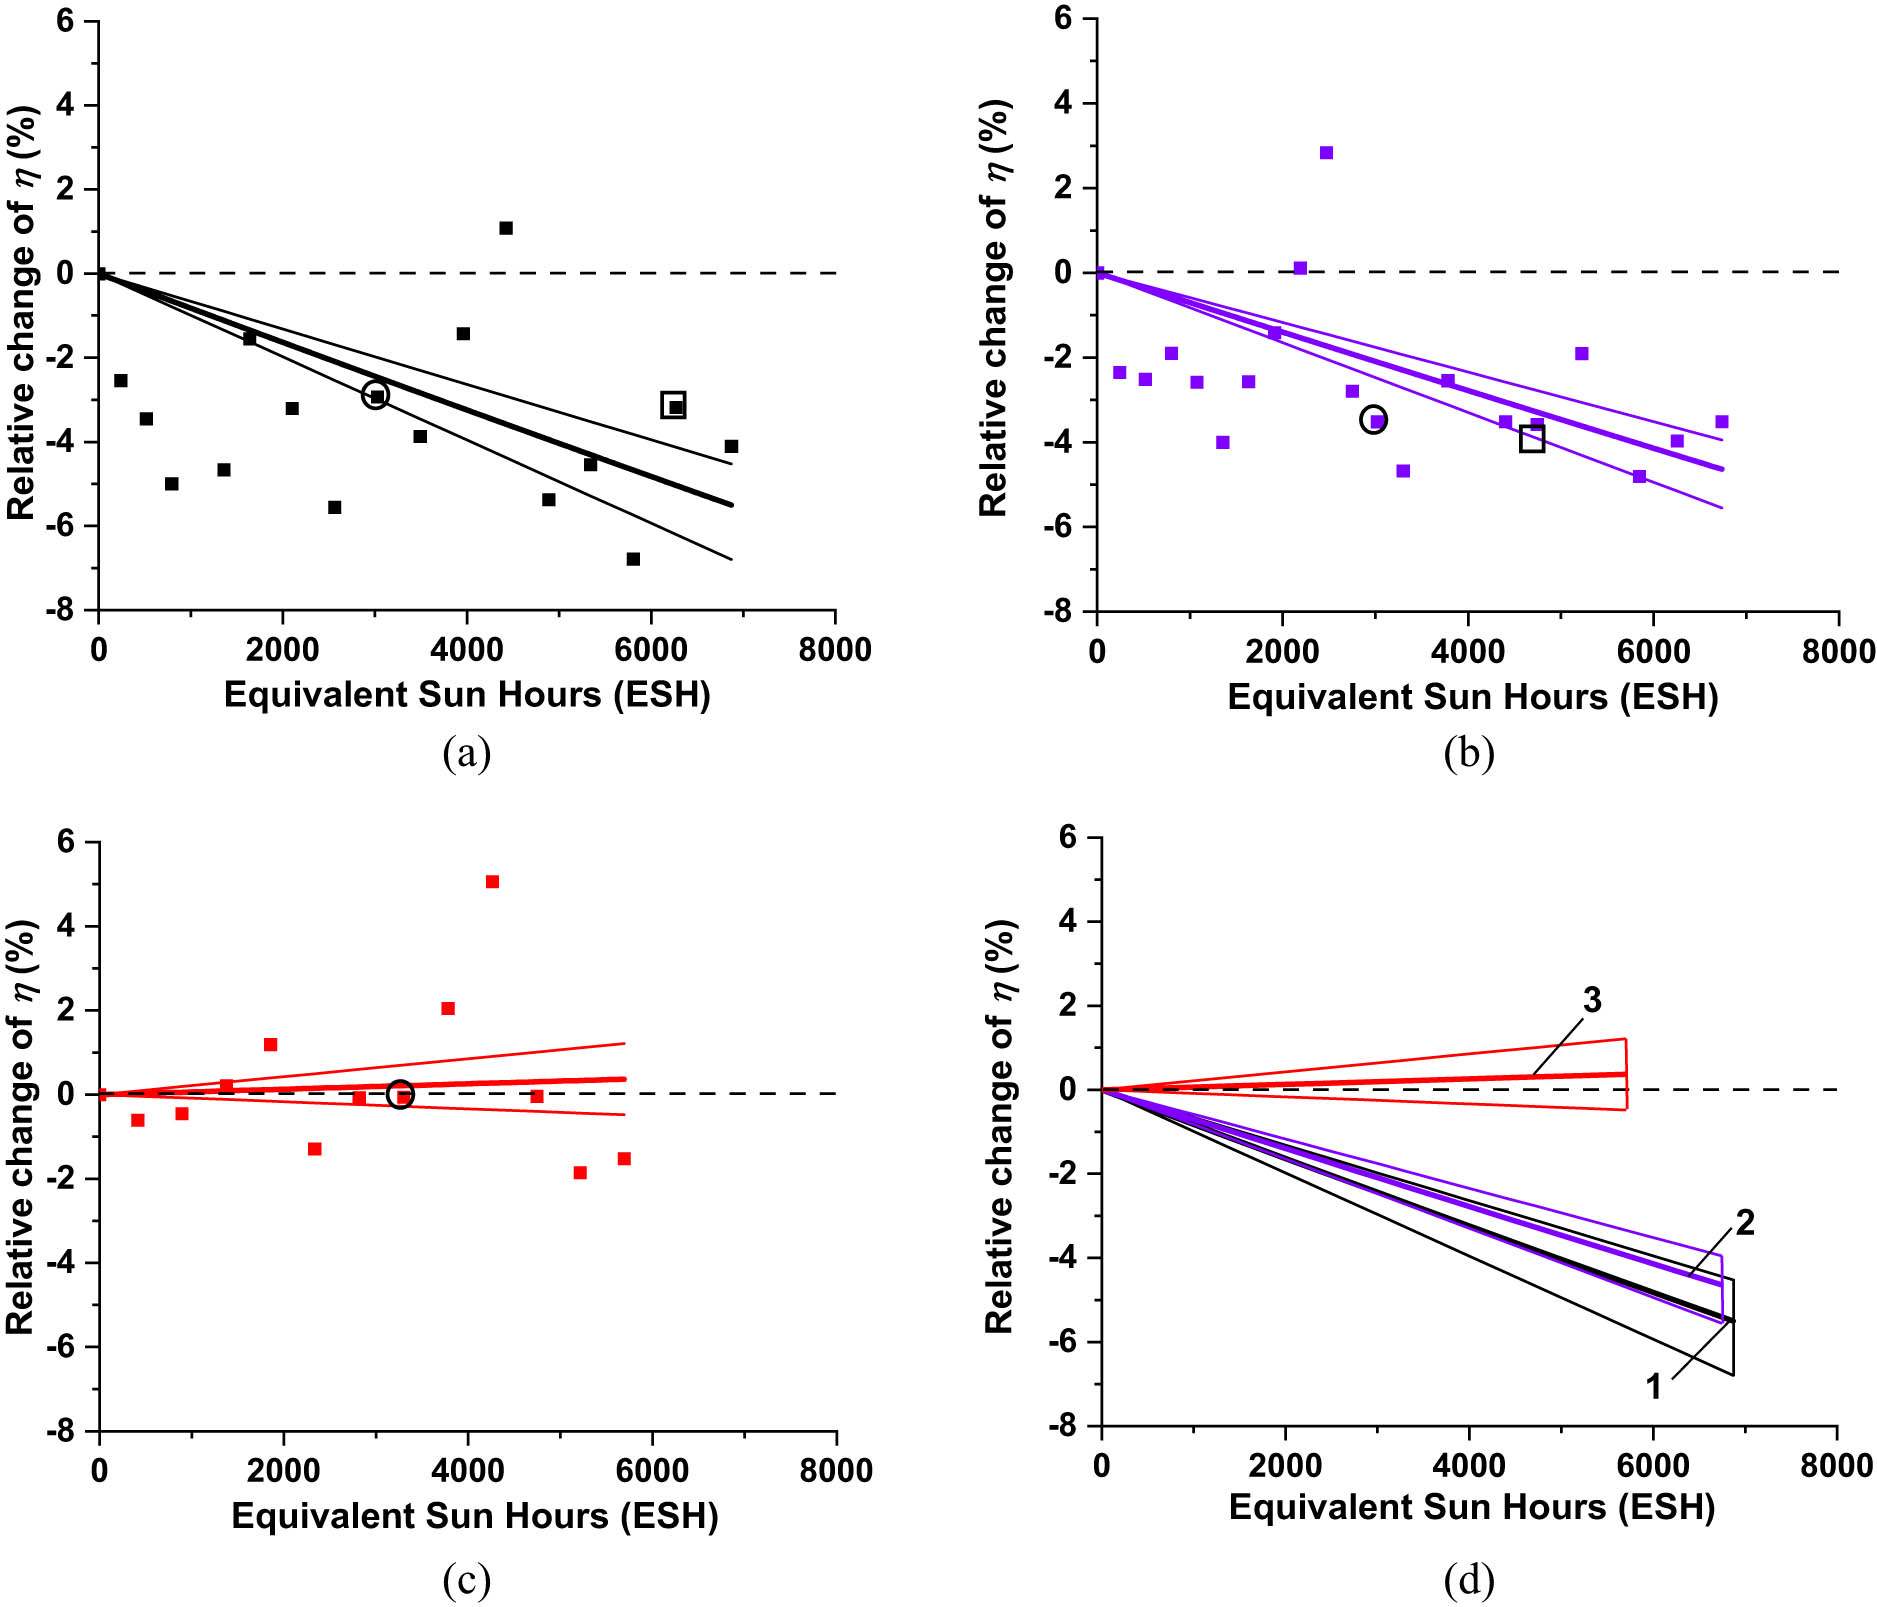
Experimental evolution plots of the relative efficiency change Δη rel of (a) bare SHJ cell, (b) SHJ cell coated with two layers of CORIN, and (c) SHJ cell coated with one layer of CORIN and SCL on the top. Solid lines are the graphs of the functions fitting the experimental points. The middle thick lines are the graphs of the fitting functions corresponding to the mean values of the fitting parameters. The marginal, thinner lines correspond to the marginal values equal to the mean values plus/minus standard deviations determined during fitting computations. Circles mark the experimental points corresponding to the data in Table 1 for ∼3,000 ESH exposure duration. A square marks the experimental point corresponding to the data in Table 1 for ∼6,000 ESH exposure duration. For convenience of comparison, fitting graphs for all the cells are presented together in (d). Set of fitting lines 1 corresponds to bare SHJ cell, Set of fitting lines 2 corresponds to SHJ coated with two layers of CORIN, and Set of fitting lines 3 corresponds to SHJ coated with CORIN and SCL on the top.
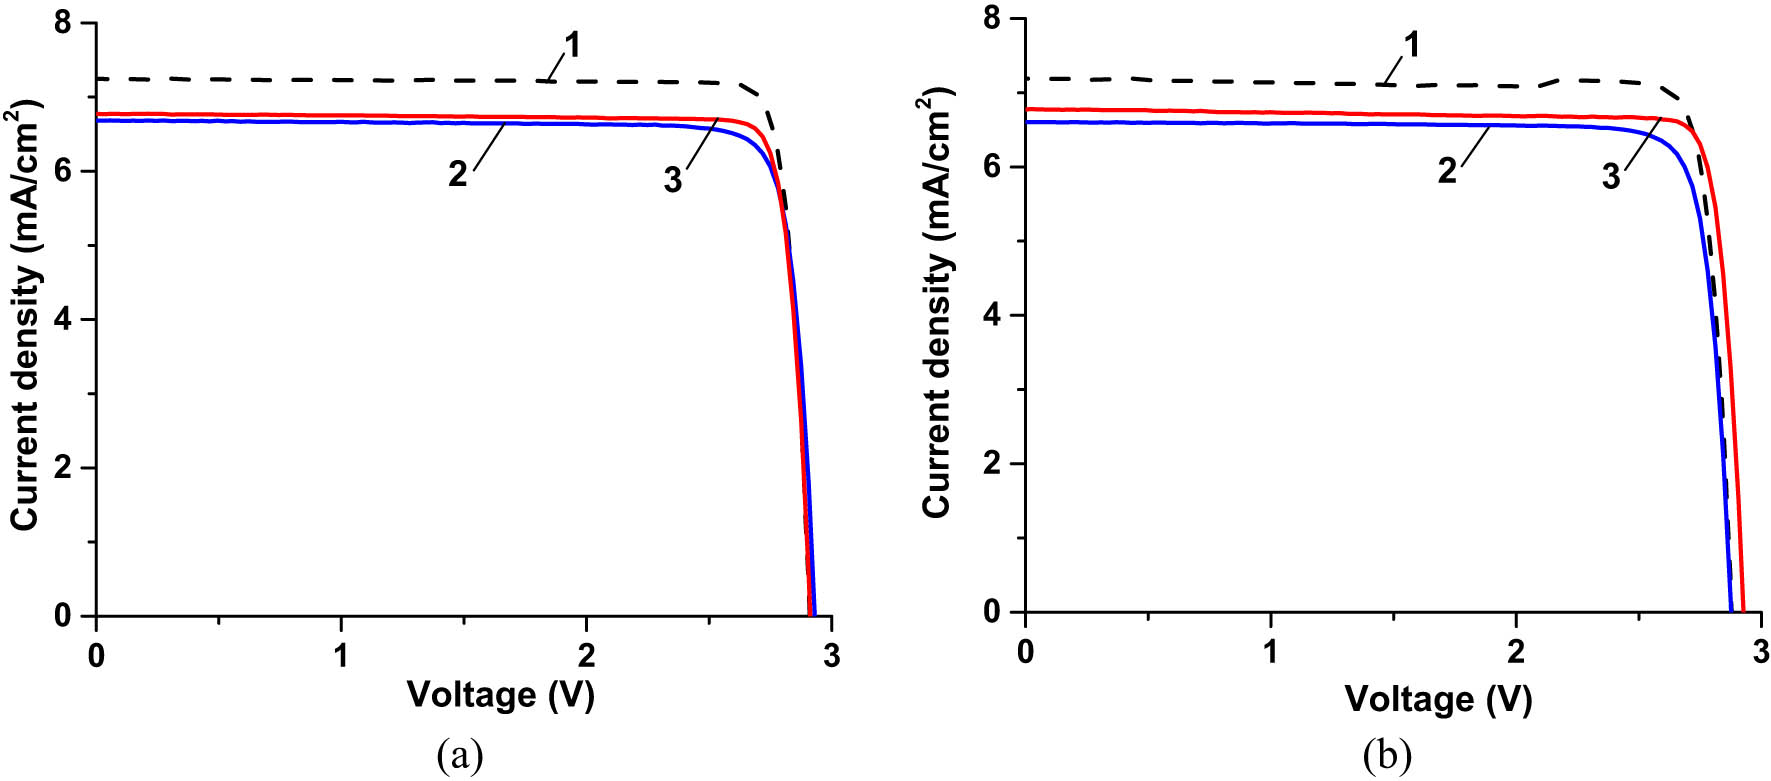
We also compared the I–V characteristics of three different SHJ cells, bare, double CORIN-, and CORIN + SCL-coated, before and after UV exposure for ∼3,000 ESH as shown in Figure 15. The values of P max, PDmax, and η extracted from these characteristics are presented in Table 1, columns 4 and 5, rows 1, 3, and 5. The corresponding experimental points of Δη rel were marked with circles in the plots in Figure 14a–c. They were located (with the exception in Figure 14a) close to the fitting graphs. The bare cell initially performed less than the other two, and the CORIN + SCL-coated one was the highest achiever. After ∼3,000 ESH of exposure, the performance gap between the underperformer (bare cell) and the front runner (CORIN + SCL-coated one) widened. The performance of the CORIN-coated cell did not noticeably change. Using the available experimental data or the estimates derived from the fitting functions in Figure 14 (if the experimental data were not available), we also obtained the performance parameters of three SHJ cells for ∼6,000 ESH exposure duration. They are presented in Table 1, sixth column, rows 1, 2, and 4. The corresponding experimental point of Δη rel was marked with a square in the plot in Figure 14c. It was located close to the fitting graph. The gap between the performance parameters of the bare cell and the CORIN-only and CORIN-SCL cells continued to widen. However, the change in the performance of individual cells with time was less or comparable to the statistical spread (statistically insignificant). Comparison of the expected performance parameters of the would-be-uncoated cells (that were double CORIN- or CORIN + SCL-coated) for ∼3,000 and ∼6,000 ESH in Table 1, columns 5 and 6, rows 2 and 4 with the parameters of the true uncoated cell in row 1 show their correlation in terms of degradation with exposure time.
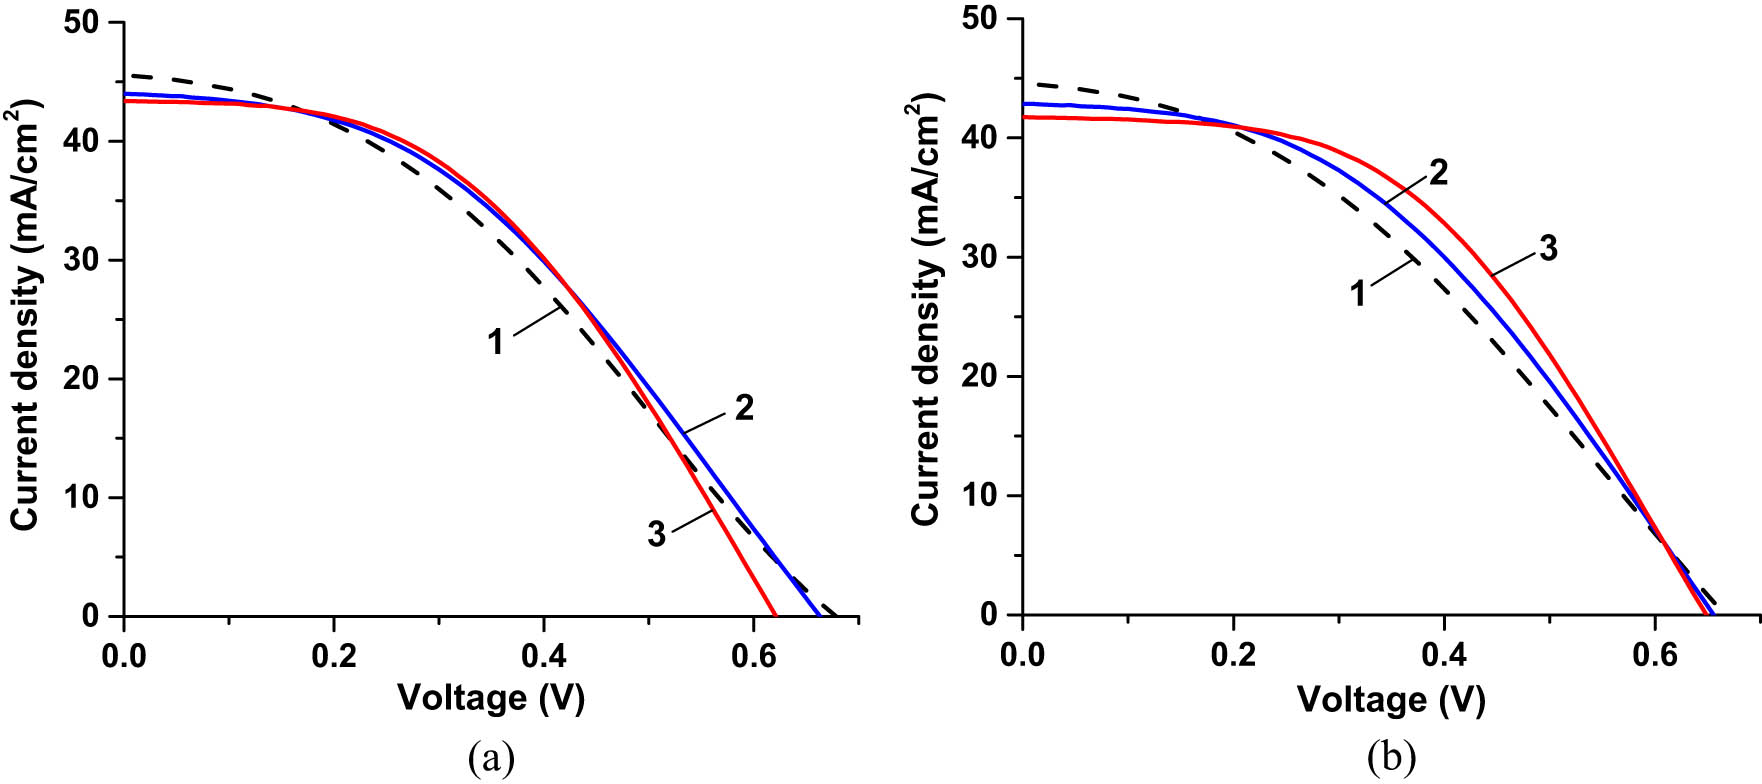
I–V characteristics of three different SHJ cells (a) before UV exposure and (b) after UV exposure for ∼3,000 ESH. Curve 1 corresponds to the bare cell, curve 2 corresponds to the cell coated with two layers of CORIN, and corresponds to curve 3 corresponds to the cell coated with one layer of CORIN and SCL on the top.
Actual exposure time of the bare cell was 3,321 ESH, CORIN-only-coated cell – 3,147 ESH, CORIN + SCL-coated – 2,981 ESH. During I–V measurements, the cells were illuminated by the solar simulator with an intensity of 1.367 Sun (AM0 filter).
Figure 16 presents the photographs of an SCL-coated CIGS cell illuminated with room and UV light. SCL being UV illuminated produced red PL attributed to the Europium doped downshifting NPs. The I–V characteristics of the CIGS cells, uncoated and coated, before UV exposure are presented in Figure 17. The performance parameters of the cells are presented in Table 2, columns 3 and 4, rows 2 through 5. In this case, CORIN coating brought a slight increase in η (by 0.4%) with respect to the bare cell. SCL reduced η by 0.4%. But these changes in performance in both cases are less than 1.0% statistical spread of η. The effect of the coatings on the performance of unexposed CIGS cells could thus be considered statistically insignificant.
(a) General view of a CIGS cell coated with SCL. (b) The same cell illuminated with UV light from a 365 nm UV LED. Red PL was produced by the SCL.
(a) I–V characteristics of an unexposed CIGS cell before coating (curve 1) and after coating with CORIN layer (curve 2). (b) I–V characteristics of an unexposed CIGS cell before coating (curve 1) and after coating with SCL (curve 2). During I–V measurements, the cells were illuminated by the solar simulator with an intensity of 1.367 Sun (AM0 filter). After the article was prepared for publication the manufacturer of CIGS cells suggested that the active area of the cell was 17.77 cm2 instead of 22.5625 cm2 used in the computations. Correspondingly, the current density in (a) and (b) should be increased 1.27 times.
Performance parameters of the CIGS cells extracted from their I–V characteristics*
| Number of the row | Time of exposure | 0 ESH | ∼3,000 ESH | ∼6,000 ESH | |
|---|---|---|---|---|---|
| Parameter | V oc | P max | P max | P max | |
| (I sc) | (PDmax) | (PDmax) | (PDmax) | ||
| [J sc] | [η] | [η] | [η] | ||
| Unit | V | mW | mW | mW | |
| (mA) | (mW/cm2) | (mW/cm2) | (mW/cm2) | ||
| [mA/cm2] | [%] | [%] | [%] | ||
| 1 | Uncoated CIGS cell | 3.14 ± 0.09 | 155 ± 11 | 135 ± 10a | 137 ± 13b |
| (92.4 ± 1.9) | (6.8 ± 0.5) | (5.9 ± 0.4) | (6.0 ± 0.6) | ||
| [4.10 ± 0.09] | [6.2 ± 0.4] | [5.4 ± 0.3] | [5.5 ± 0.5] | ||
| 2 | CIGS cell before coating with CORIN layer | 3.34 ± 0.10 | 179 ± 13 | 162 ± 15c | 146 ± 17c |
| (98.8 ± 2.0) | (7.9 ± 0.6) | (7.1 ± 0.7) | (6.4 ± 0.7) | ||
| [4.38 ± 0.09] | [7.2 ± 0.5] | [6.5 ± 0.6] | [5.9 ± 0.7] | ||
| 3 | CIGS cell coated with CORIN layer | 3.41 ± 0.10 | 185 ± 14 | 171 ± 13d | 162 ± 12e |
| (97.4 ± 2.0) | (8.2 ± 0.6) | (7.6 ± 0.6) | (7.2 ± 0.5) | ||
| [4.32 ± 0.09] | [7.6 ± 0.5] | [7.0 ± 0.5] | [6.7 ± 0.5] | ||
| 4 | CIGS cell before coating with SCL | 3.20 ± 0.09 | 173 ± 13 | 156 ± 15c | 142 ± 17c |
| (95.6 ± 2.0) | (7.7 ± 0.6) | (6.9 ± 0.7) | (6.3 ± 0.8) | ||
| [4.24 ± 0.09] | [7.1 ± 0.5] | [6.4 ± 0.6] | [5.8 ± 0.7] | ||
| 5 | CIGS cell coated with SCL | 3.19 ± 0.09 | 163 ± 12 | 151 ± 11f | 143 ± 14b |
| (93.4 ± 1.9) | (7.2 ± 0.5) | (6.7 ± 0.5) | (6.3 ± 0.6) | ||
| [4.14 ± 0.08] | [6.7 ± 0.5] | [6.2 ± 0.5] | [5.9 ± 0.6] | ||
*Due to the corrections provided by the manufacturer after the article was prepared for publication current density J sc, power density PD max, and efficiency η must be increased 1.27 times. aExact exposure time was 3,245 ESH. bDue to the lack of experimental data, the values were estimated using the results of fitting experimental data in Figure 18. cExpected values were estimated using the results of fitting experimental data in Figure 18. dExact exposure time was 3,176 ESH. eExact exposure time was 6,037 ESH. fExact exposure time was 3,126 ESH.
After the article was prepared for publication the manufacturer of CIGS cells suggested that the active area of the cell was 17.77 cm2 instead of 22.5625 cm2 used in the computations. Correspondingly, the current density in Figure 17 and Table 2 as well as power density and efficiency in Table 2 should be increased 1.27 times.
Experimental evolution plots of Δη rel of the UV-exposed CIGS cells are presented in Figure 18. All the plots were fitted with function Δη rel(t) = [exp(Rt) − 1] × 100%, where fitting parameter R had the meaning of the efficiency evolution rate. Like in Figure 14, the graphs of the fitting functions were presented by the sets of three lines: the middle, thicker line and two thin marginal lines corresponding to the marginal values of R ± equal to the mean value R mean plus/minus the standard deviations σR of fitting R ± = R mean ± σR. For convenience of comparison, the fitting evolution graphs for all three types of CIGS cells were presented together in Figure 18d. The uncoated CIGS cell (Figure 18a and set 1 in Figure 18d) experienced significant performance degradation while the CORIN-coated (Figure 18b and set 2 in Figure 18d) and SCL-coated (Figure 18c and set 3 in Figure 18d) cells degraded less. UV caused performance degradation of the bare CIGS cell (Figure 18a and set 1 in Figure 18d) was explained in the literature by the erosion of the front electric conductors followed by the increase in their sheet resistance [51]. Photographs of the microscopic images of the front conductors of the studied CIGS cells in Figure 19e–h confirmed this hypothesis. UV exposure of the bare front conductors of SHJ (Figure 19a–d) and IMM cells (Figure 19i–l) resulted in fluffy edges. But the white electroconductive (made of silver paste) layer of the front conductor of a bare CIGS cell (Figure 19e) completely changed its color to dark yellow after ∼5,000 ESH of UV exposure (Figure 19f). This was more likely due to oxidation of silver. The CORIN-coated CIGS cell remained almost intact after ∼7,000 ESH (Figure 19g). The conductor of the SCL-coated cell remained partially intact after ∼5,000 ESH (Figure 19h). Slowing UV degradation down by CORIN and the SCL could thus be due to counter-UV shielding of the front conductors. The fact that the SCL provided weaker shielding of the front conductors than CORIN explains why the SCL-coated cell degraded a bit faster (but still slower than the bare cell). The SCL was less effective on the CIGS technology more likely due to the formation of pinholes in the CORIN because of the NP deposition, which would re-expose the silver top contacts. The silver contacts on the CIGS only experienced degradation due to the lack of a protective coating, as evidenced by the CORIN coated module. SHJ and IMM cells might have initial anti-UV coating preventing front conductors from complete degradation.
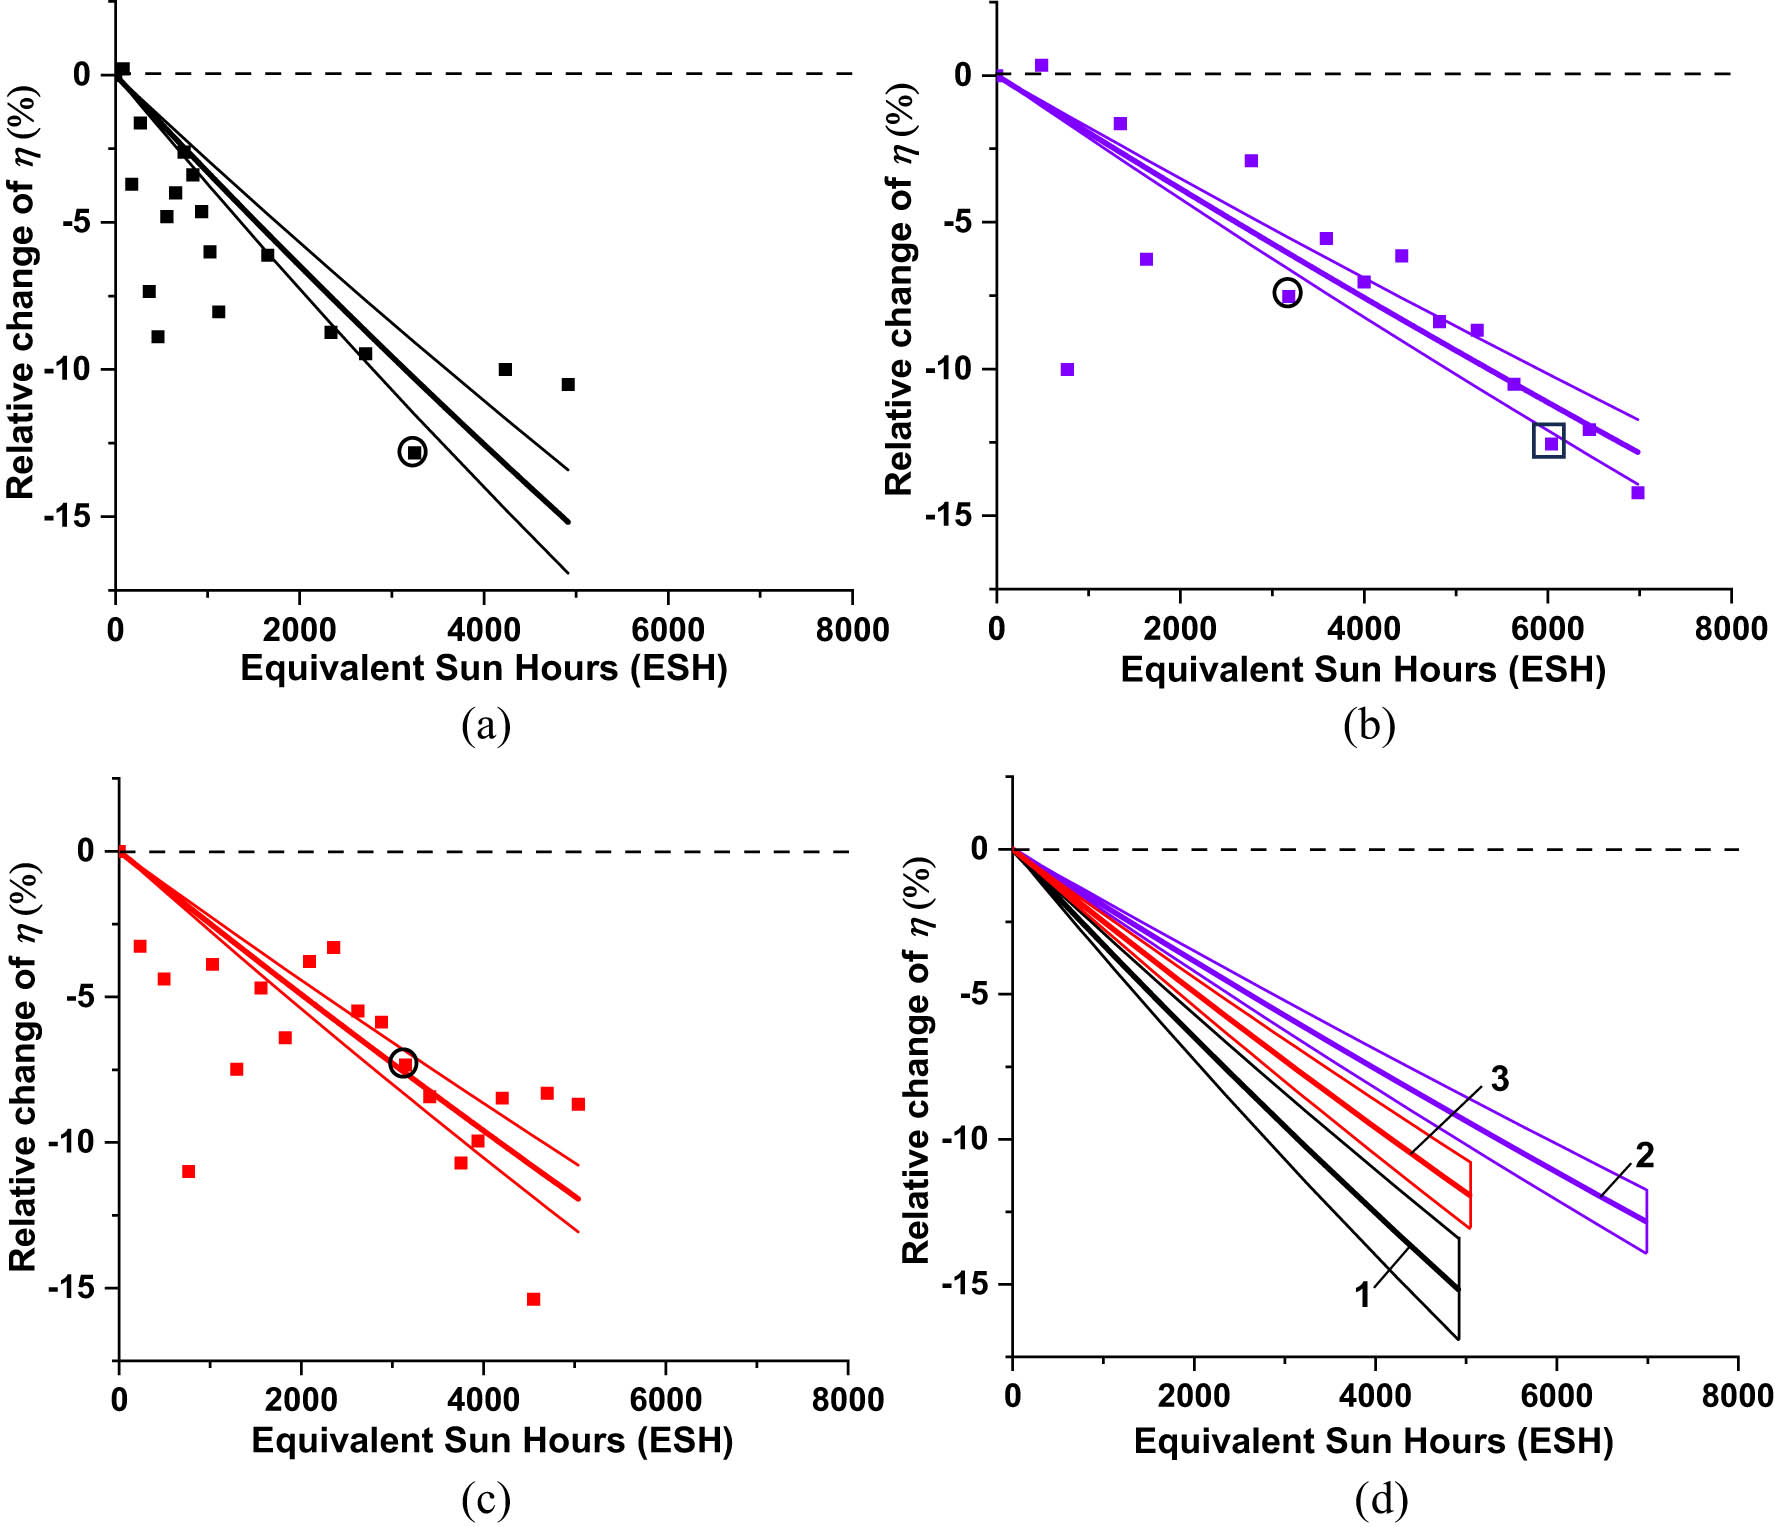
Experimental evolution plots of the relative efficiency change Δη rel of (a) bare CIGS cell, (b) CIGS cell coated with CORIN, and (c) CIGS cell coated with SCL. Solid lines are the graphs of the functions fitting the experimental points. Circles mark the experimental points corresponding to the data in Table 2 for ∼3,000 ESH exposure duration. A square marks the experimental point corresponding to the data in Table 2 for ∼6,000 ESH exposure duration. (d) For convenience of comparison, fitting graphs for all the cells are presented together in. Set of lines 1 corresponds to bare CIGS cell, while 2 corresponds to CIGS coated with CORIN, and 3 corresponds to CIGS coated with SCL.
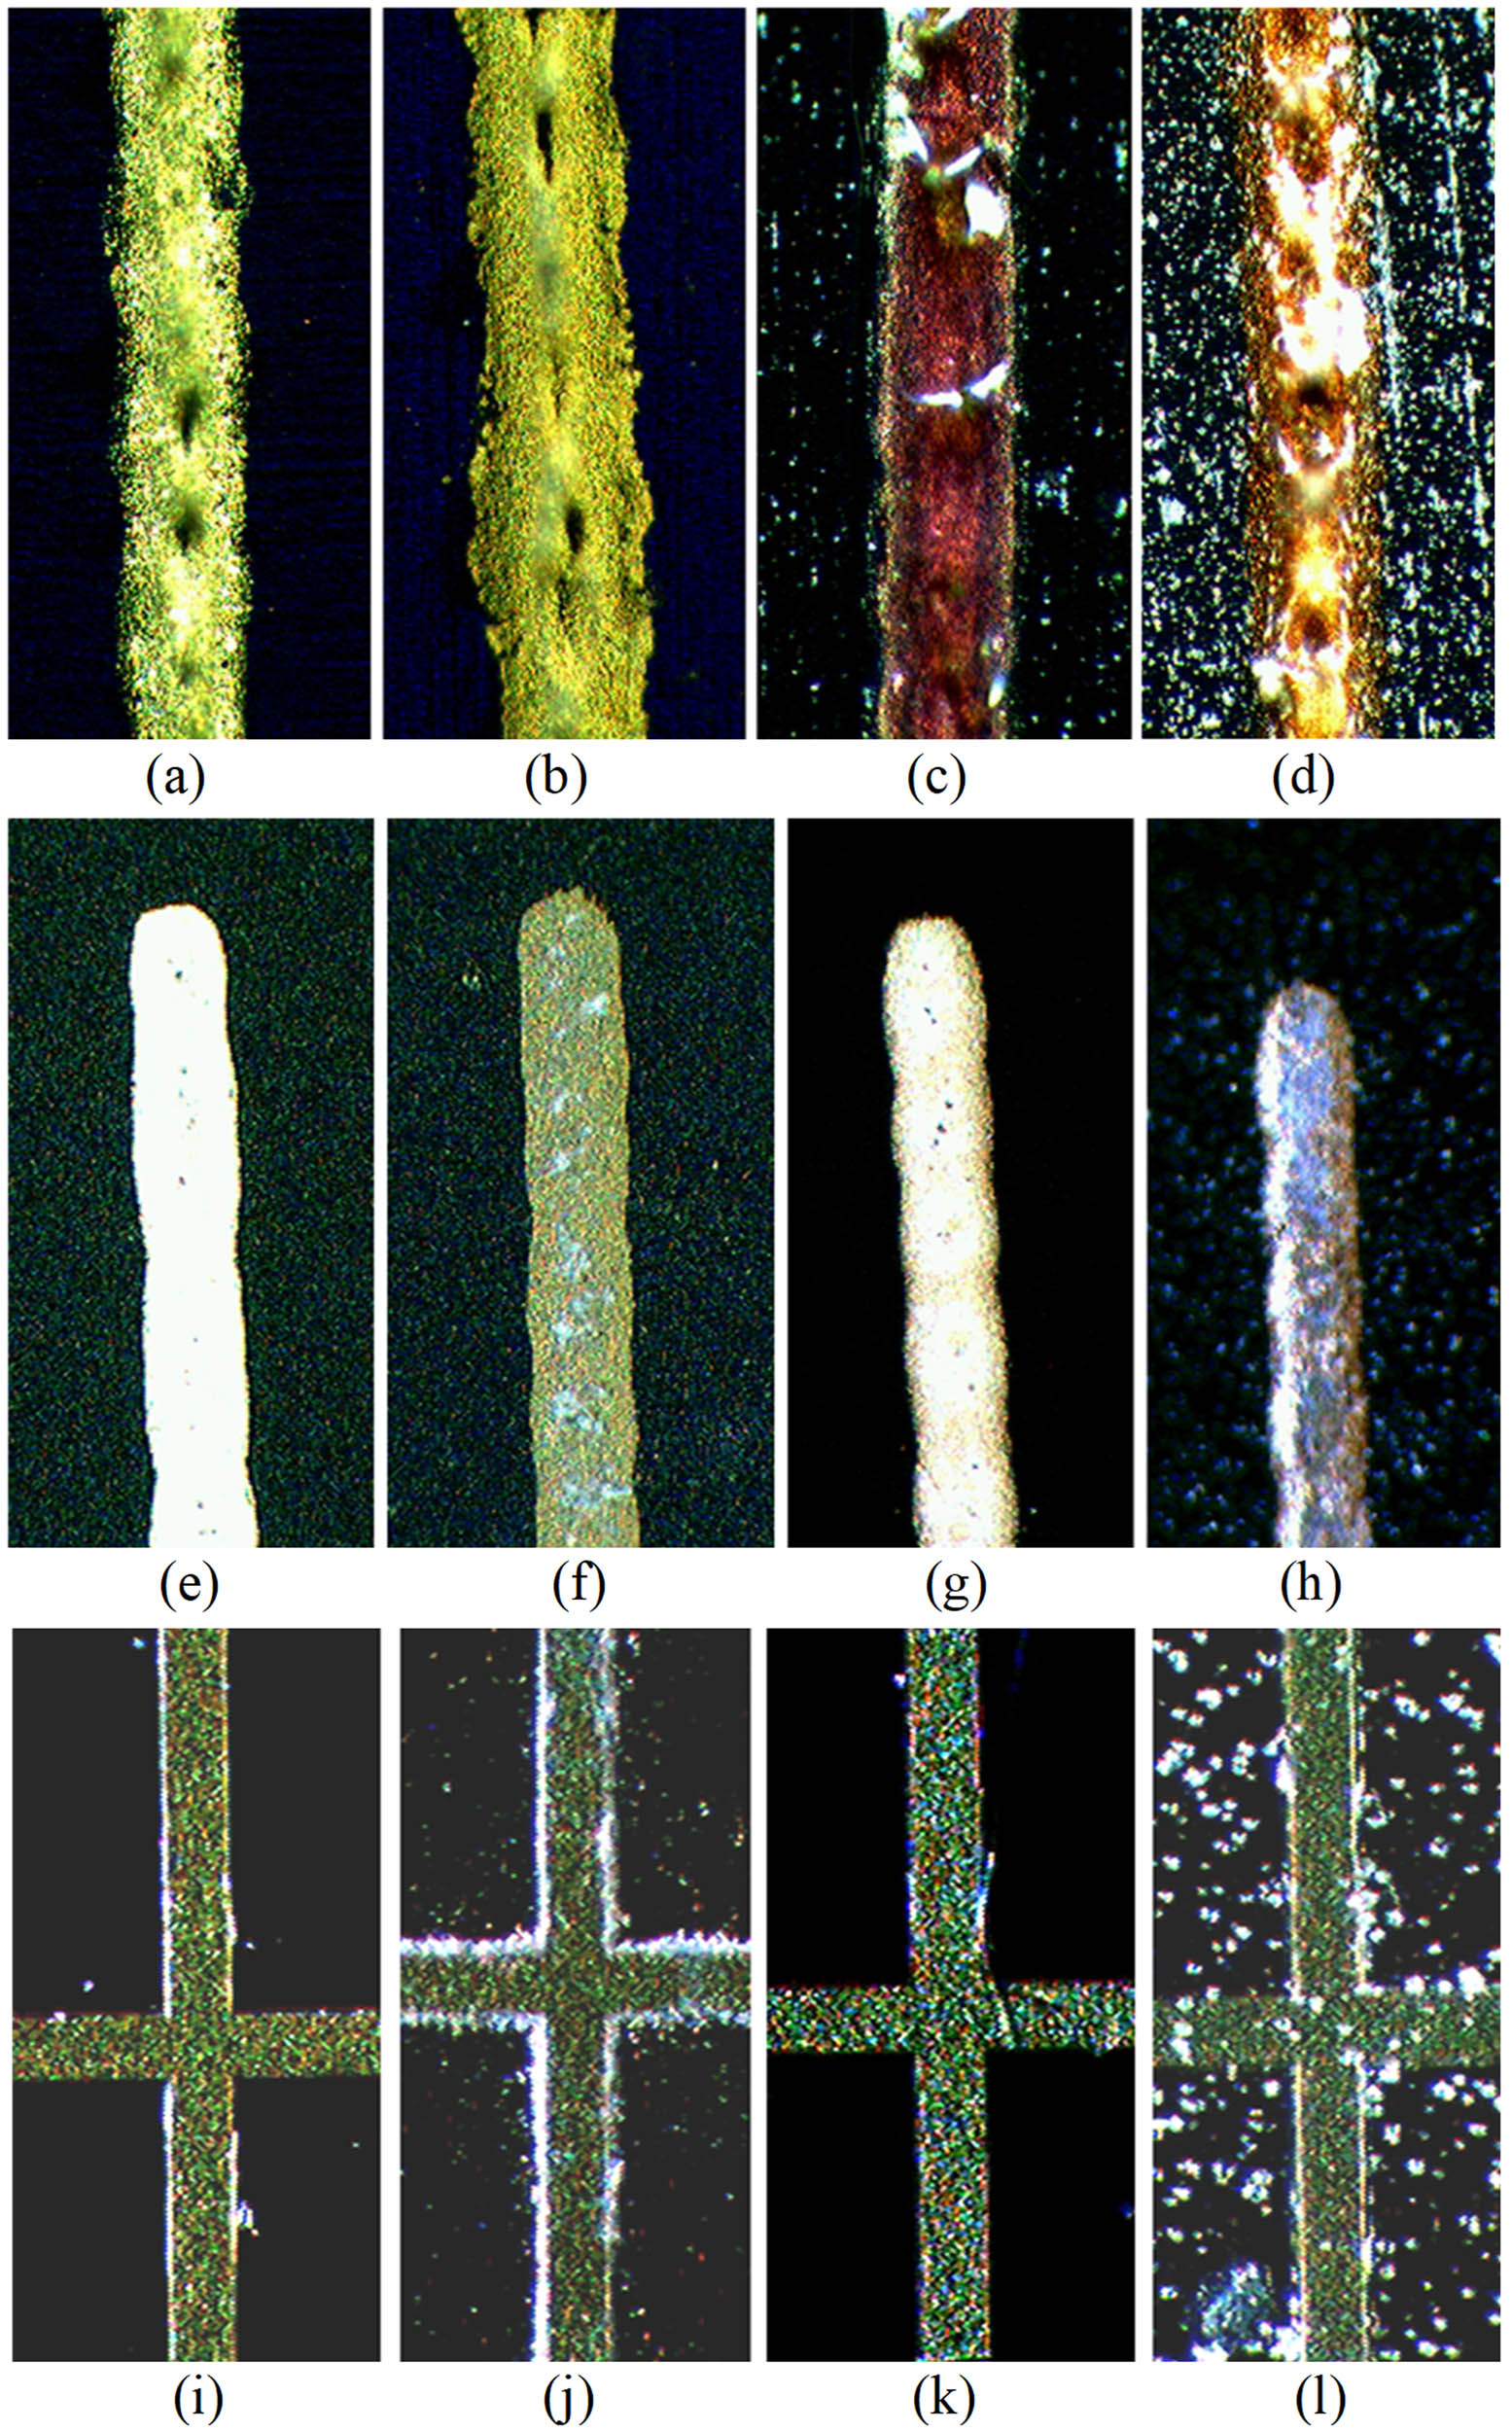
Microscopic images (40× magnification) of the front conductor of (a) bare unexposed SHJ cell, (b) bare SHJ cell UV-exposed for 5,294 ESH, (c) SHJ cell coated with two layers of CORIN and UV-exposed for 4,453 ESH, (d) SHJ cell coated with one layer of CORIN and SCL on the top and UV-exposed for 7,058 ESH, (e) bare unexposed CIGS cell, (f) bare CIGS cell UV-exposed for 4,913 ESH, (g) CORIN-coated CIGS cell exposed for 6,977 ESH, (h) SCL-coated CIGS cell exposed for 5,038 ESH, (i) bare unexposed IMM cell, (j) bare IMM cell UV-exposed for 6,870 ESH, (k) CORIN-coated IMM cell exposed for 6,736 ESH, and (l) SCL-coated IMM cell exposed for 5,693 ESH. Images (e)–(h) are enlarged ∼1.5 times with respect to images (a)–(d), images (i)–(l) are enlarged ∼2 times.
We also compared the I–V characteristics of three different CIGS cells, bare, CORIN-, and SCL-coated, before and after UV exposure for ∼3,000 ESH as shown in Figure 20. Due to corrections provided by the manufacturer, the current density in Figure 20 should be increased 1.27 times. The values of P max, PDmax, and η extracted from these characteristics are presented in Table 2, columns 4 and 5, rows 1, 3, and 5 (they must also be increased 1.27 times). Relative change Δη rel was negative for all three types of cells due to UV-induced aging, but the performance gap between the exposed bare CIGS cell and the coated cells (especially the CORIN-coated one) widened. Additionally, we put the experimental data for the CORIN-coated CIGS cell exposed for ∼6,000 ESH (data point marked with a square in Figure 18b) and the performance parameters of the would-be-uncoated and the true uncoated and coated cells for ∼3,000 and ∼6,000 ESH (estimated using the fitting functions in Figure 18) in Table 2, columns 5 and 6, rows 1–5. The data for the would-be-uncoated and the true uncoated cells showed good correlation.
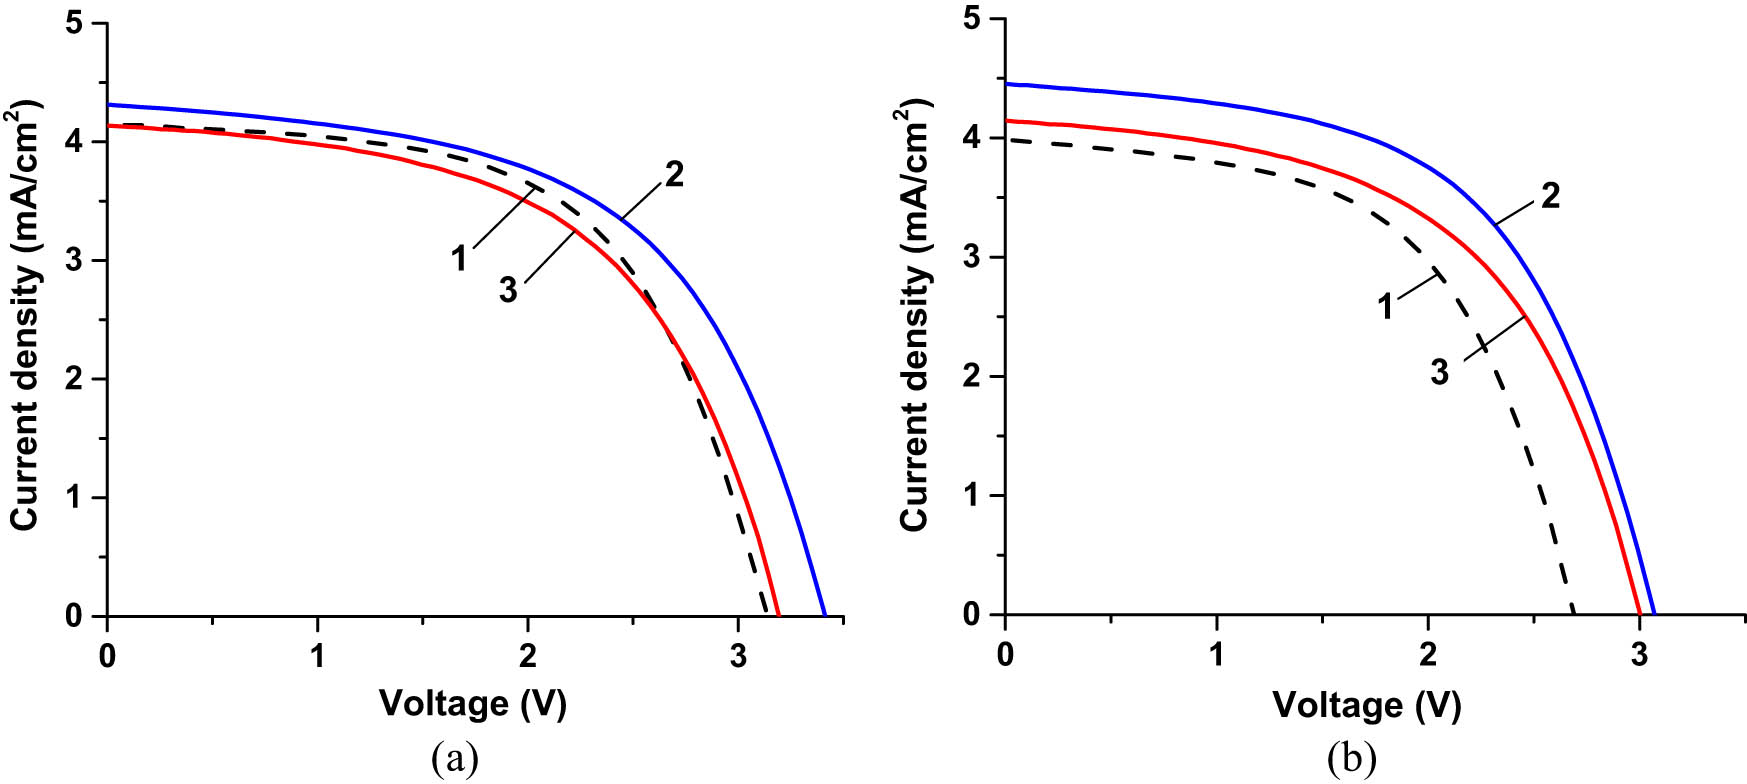
I–V characteristics of three different CIGS cells (a) before UV exposure and (b) after UV exposure for ∼3,000 ESH. Curves 1 correspond to the bare cell, curves 2 correspond to the cell coated with one layer of CORIN, and curves 3 correspond to the cell coated with the SCL. The actual exposure time of the bare cell was 3,245 ESH, CORIN-coated cell was 3,176 ESH, and SCL-coated cell was 3,126 ESH. During I–V measurements, the cells were illuminated by the solar simulator with an intensity of 1.367 Sun. Due to the corrections provided by the manufacturer after the article was prepared for publication, current density in (a) and (b) must be increased 1.27 times.
Figure 21 shows the photographs of a bare IMM cell at room illumination and the SCL-coated one under UV illumination. SCL on the top of the latter cell produced red PL attributed to the spectrum downshifting in the embedded NPs. The I–V characteristics of the IMM cells, uncoated and coated, before UV exposure are presented in Figure 22. The performance parameters of the cells extracted from the I–V characteristics are presented in Table 3, columns 3 and 4, rows 2–5. Both coatings brought down the photocurrent and the efficiency of the cells (though not significant relative to the statistical spread). Like in the case of the SHJ cells, reflectance measurements indicated that the coating-caused performance drop could be due to the increased reflection and scattering (especially in the case of the SCL) of the incident light.
(a) General view of a bare IMM cell from MicroLink; (b) an SCL-coated IMM cell illuminated with a 365 nm UV LED. Red PL in (b) was produced by the SCL.
(a) I–V characteristics of an unexposed IMM cell before coating (curve 1) and after coating with one layer of CORIN (curve 2). (b) I–V characteristics of an unexposed IMM cell before coating (curve 1) and after coating with the SCL (curve 2). Considering greater (relative to SHJ and CIGS) IMM cell dimensions (3.0 cm × 6.6 cm), the cells were illuminated at a maximal achievable for the solar simulator irradiance of 0.875 Sun (AM0 filter). This was less than 1.367 Sun used for SHJ and CIGS cells.
Performance parameters of the IMM cells extracted from their I–V characteristics
| Number of the row | Time of exposure | 0 ESH | ∼3,000 ESH | ∼6,000 ESH | |
|---|---|---|---|---|---|
| Parameter | V oc | P max | P max | P max | |
| (I sc) | (PDmax) | (PDmax) | (PDmax) | ||
| [J sc] | [η]a | [η] | [η] | ||
| Unit | V | mW | mW | mW | |
| (mA) | (mW/cm2) | (mW/cm2) | (mW/cm2) | ||
| [mA/cm2] | [%] | [%] | [%] | ||
| 1 | Uncoated IMM cell | 2.91 ± 0.02 | 376 ± 13 | 365 ± 13b | 364 ± 13c |
| (143.5 ± 2.4) | (18.9 ± 0.7) | (18.4 ± 0.7) | (18.3 ± 0.7) | ||
| [7.23 ± 0.12] | [27.2 ± 1.0] | [26.5 ± 1.0] | [26.4 ± 0.9] | ||
| 2 | IMM cell before coating with CORIN layer | 2.88 ± 0.02 | 353 ± 13 | 346 ± 14d | 336 ± 16d |
| (140.1 ± 2.3) | (17.8 ± 0.7) | (17.4 ± 0.7) | (17.0 ± 0.8) | ||
| [7.07 ± 0.12] | [25.6 ± 1.0] | [25.1 ± 1.0] | [24.4 ± 1.1] | ||
| 3 | IMM cell coated with CORIN layer | 2.93 ± 0.02 | 339 ± 12 | 327 ± 12e | 321 ± 12f |
| (132.3 ± 2.1) | (17.1 ± 0.6) | (16.5 ± 0.6) | (16.2 ± 0.5) | ||
| [6.68 ± 0.11] | [24.6 ± 0.9] | [23.8 ± 0.9] | [23.3 ± 0.9] | ||
| 4 | IMM cell before coating with SCL | 2.89 ± 0.02 | 377 ± 13 | 369 ± 15d | 359 ± 16d |
| (144.9 ± 2.3) | (19.0 ± 0.7) | (18.6 ± 0.8) | (18.1 ± 0.8) | ||
| [7.32 ± 0.12] | [27.3 ± 1.0] | [26.7 ± 1.1] | [26.1 ± 1.1] | ||
| 5 | IMM cell coated with SCL | 2.91 ± 0.02 | 350 ± 13 | 350 ± 12g | 351 ± 16h |
| (134.1 ± 2.2) | (17.7 ± 0.7) | (17.7 ± 0.6) | (17.8 ± 0.8) | ||
| [6.77 ± 0.11] | [25.5 ± 1.0] | [25.5 ± 0.9] | [25.6 ± 1.2] | ||
aEfficiency was measured at an irradiance of 0.875 Sun (87.5 mW/cm2) with AM0 filter in the solar simulator and at the temperature in the lab varying between 22 and 27°C. It was corrected to the true efficiency based on ASTM E948-16 Standard [49]. bExact exposure time was 3,026 ESH. cExact exposure time was 6,269 ESH. dExpected values were estimated using the results of fitting experimental data in Figure 23. eExact exposure time was 3,020 ESH. fExact exposure time was 6,037 ESH. gExact exposure time was 3,298 ESH. hDue to the lack of experimental data, the values were estimated using the results of fitting experimental data in Figure 23.
Figure 23 presents the experimental evolution plots of Δη rel of the UV-exposed IMM cells. All the plots were fitted with function Δη rel(t) = [exp(Rt) − 1] × 100 (%), with evolution rate R as a fitting parameter. Like in Figures 14 and 18, the graphs of the fitting functions were presented by the sets of three lines: the middle, thicker line and two thin marginal lines corresponding to the marginal values of R. For convenience, the fitting evolution graphs for all three types of IMM cells are presented together in Figure 23d. The uncoated IMM cell (Figure 23a and set 1 in Figure 23d) experienced performance degradation. The CORIN-coated (Figure 23b and set 2 in Figure 23d) experienced slightly less degradation while the SCL-coated one (Figure 23c and set 3 in Figure 23d) demonstrated performance stability.
Experimental evolution plots of the relative efficiency change Δη rel of (a) bare IMM cell, (b) IMM cell coated with CORIN, and (c) IMM cell coated with SCL. Solid lines are the graphs of the functions fitting the experimental points. Circles mark the experimental points corresponding to the data in Table 3 for ∼3,000 ESH exposure duration. Squares mark the experimental points corresponding to the data in Table 3 for ∼6,000 ESH exposure duration. (d) For convenience of comparison, fitting graphs for all the cells are presented together. Set of lines 1 corresponds to bare IMM cell, while 2 corresponds to IMM coated with CORIN, and 3 corresponds to IMM coated with SCL.
Figure 24 presents the I–V characteristics of different bare, CORIN-, and SCL-coated IMM cells before and after UV exposure for ∼3,000 ESH. The short circuit current density J sc of the bare cell remained relatively high and stable before and after exposure. But the open circuit voltage V oc of the bare cell as well as that of the CORIN-coated one degraded compared to the SCL-coated cell. Our measurements revealed that the SCL-coated cell reflected solar UV three to five times greater than the CORIN-coated and bare one, respectively. The stabilizing effect of the SCL on the IMM cell could thus be explained by fending off solar UV and keeping V oc from decreasing. Downshifted PL (indicated by 615 and 623 nm peaks in the spectrum in Figure 12) could also contribute to the SCL’s performance stabilizing role in the case of an IMM cell. The drop of V oc in PV cells has been explained in the literature by the generation of parasitic defect-related traps in the energy gap of the p–n junctions (our IMM cells had three p–n junctions) and narrowing the gap [52]. Answering why such phenomena took place in our case would require detailed investigation beyond the scope of this work. The values of P max, PDmax, and η extracted from I–V characteristics in Figure 24 are presented in Table 3, columns 4 and 5, rows 3 and 5. Additionally, we put the experimental data for the bare and CORIN-coated IMM cells exposed for ∼6,000 ESH (data points marked with squares in Figure 23a and b) and the performance parameters of the would-be-uncoated and the true uncoated and coated cells for ∼3,000 and ∼6,000 ESH (estimated using the fitting functions in Figure 23) in Table 3, columns 5 and 6, rows 1–5. The data for the would-be-uncoated and the true uncoated cells correlated well in terms of performance degradation with time of exposure.
I–V characteristics of three different IMM cells (a) before UV exposure and (b) after UV exposure for ∼3,000 ESH. Curves 1 correspond to the bare cell, curves 2 correspond to the cell coated with one layer of CORIN, and curves 3 correspond to the cell coated with the SCL. The actual exposure time of the bare cell was 3,026 ESH, while the CORIN-coated cell was 3,020 ESH and SCL-coated was 3,298 ESH. During I–V measurements, the cells were illuminated by the solar simulator with an intensity of 0.875 Sun.
In summary, Figure 25 presents the chart diagram of the degradation (negative) rates of the relative efficiency change Δη rel of all the investigated solar cells. Thin bars near zero correspond to the cases when there was no efficiency degradation of the cells. The rates are also presented in Table 4. All the bare cells tended to degrade under UV exposure. Bare IMM had the lowest degradation rate. CIGS cells, even coated, were prone to the fastest degradation probably due to UV-activated erosion of the front conductors. However, there might be a complication to account for that depends on the layer structure and composition of a particular type of CIGS. This relates to the UV/deep-blue activation or “boosting” of the front ZnO layer(s) which need UV to be sufficiently conductive [53]. CORIN or SCL might slow down the erosion of the front conductor by blocking UV but increase the loss of the UV-activated front ZnO conductivity. In the case of the CIGS cells used in this study, the front layer was indium tin oxide.
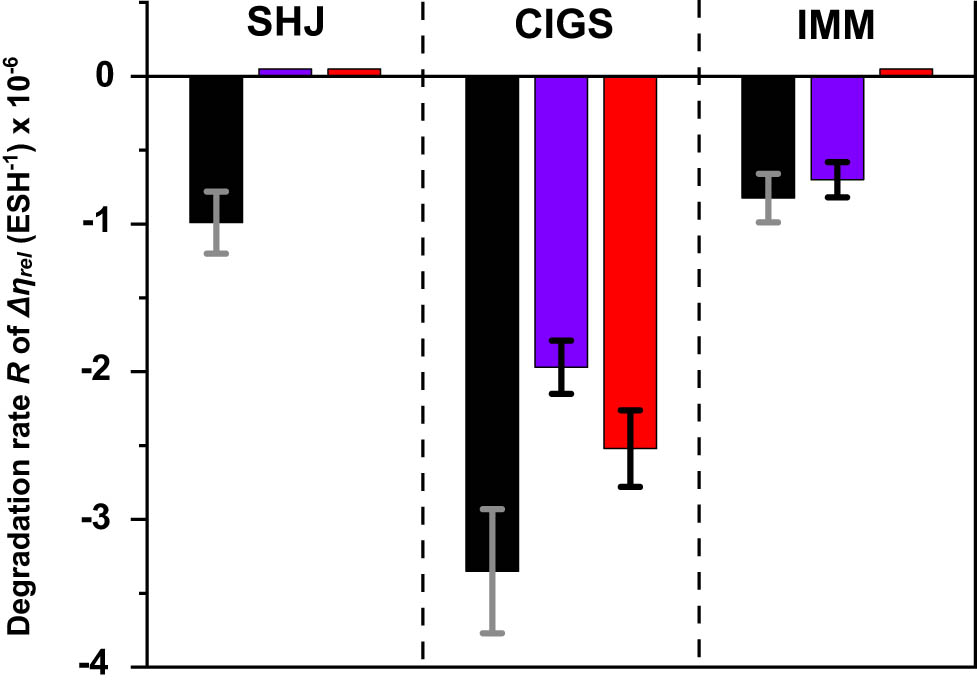
Chart diagram of the rates of the relative efficiency change Δη rel of the uncoated and coated solar cells studied in this work. The bars of black color (left from the center of each solar cell group) correspond to the bare cells, blue bars (center) correspond to CORIN-coated (two layers of CORIN in the case of SHJ) cells, red (right from the center) correspond to SCL-coated (CORIN layer and SCL on the top in the case of SHJ) ones. The error bars are presented by thin grey/black lines. Thin bars near zero correspond to the cases when there is no efficiency degradation of the cells.
Degradation rates of the Δη rel of the UV exposed solar cells
| Type of solar cell | UV degradation rate R of Δη rel (ESH−1) × 10−6 | ||
|---|---|---|---|
| No coating | CORIN | SCL | |
| SHJa | −(9.9 ± 2.1) | No degradation | No degradation |
| CIGS | −(33.5 ± 4.2) | −(19.7 ± 1.8) | −(25.2 ± 2.6) |
| IMM | −(8.2 ± 1.7) | −(7.0 ± 1.2) | No degradation |
aIn the case of SHJ cells, “CORIN” coating meant two layers of CORIN and “SCL” coating meant one layer of CORIN and SCL on the top.
The performance stabilizing effect of the SCL was observed for all three types of cells and always beyond the statistical spread of the rate. For the SHJ and IMM cells, the SCL turned degradation into zero or slight growth. For the CIGS cell, the SCL reduced the degradation rate by ∼25%. For the CIGS cell, CORIN performed as a better stabilizer than the SCL.
The data in Tables 1–3, columns 4 and 6 are aggregated and presented in Figure 26 in the form of schematic evolution plots of the efficiency η of all three types of solar cells. Numbers to the left from the plots are equal to the differences δη
BOL between the Beginning-of-Life (BOL) efficiencies
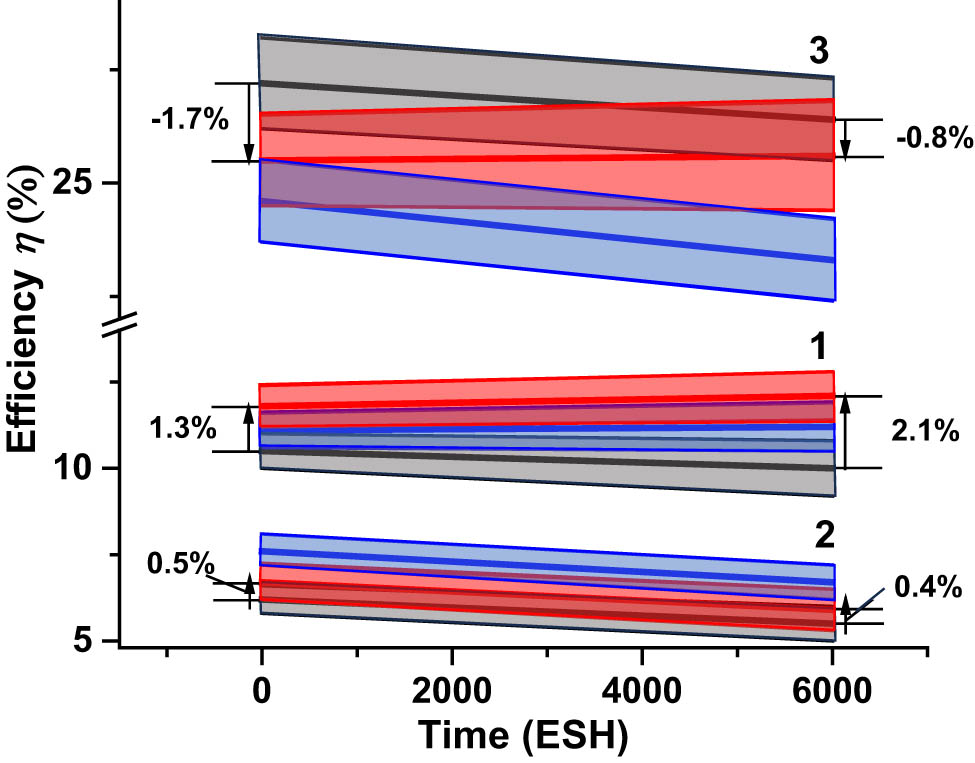
Evolution of the efficiency η of (1) SHJ, (2) GIGS, and (3) IMM cells with the time of UV exposure. Grey bars correspond to the uncoated cells, while blue bars correspond to the cells coated with CORIN (two layers of CORIN in the case of SHJ cell) and red bars correspond to the cells coated with SCL (CORIN layer and SCL on the top in the case of SHJ cell). The middle thick lines inside the bars correspond to the average efficiency. The border lines of the bars mark the statistical spreads. The graph is constructed by aggregating the data of Tables 1–3. Numerical values on both sides of the bars are equal to difference δη between the efficiency of the SCL-coated cells η (SCL) and the efficiency of the bare cells η (bare): δη = η (SCL) – η (bare). Vertical arrows up correspond to positive δη, arrows down correspond to negative δη. Due to the corrections provided by the manufacturer after the article was prepared for publication, the current density efficiency η of CIGS cells must be increased 1.27 times.
It must be mentioned that the SCL can also potentially protect solar cells from high-energy particles (electrons and protons) in space. The study of these features will be conducted soon.
4 Conclusion
The obtained results indicated that a polymer nanocomposite SCL made of a colorless and atomic-oxygen-stabilized polyimide with the embedded NPs of an Eu-doped fluoride could improve the UV stability of the coated SHJ, CIGS, and IMM solar cells. Hypothesis testing was conducted in an environment simulating open space (exposure to the sun-like UV in vacuum and performance testing with a solar simulator using AM0 filter). The UV exposure time varied from 0 to up to 7,000 ESH (corresponding to more than a year in space). All the tested solar cells are considered as good candidates for space power applications. The mechanism of converting solar UV in visible-NIR light was downshifting with ∼69 and ∼0.5% PLQY for the nano-powder and the SCL, respectively. The improvement of UV stability (in terms of reduction of the efficiency degradation rate) by the SCL was firmly (beyond the statistical spread) observed for all three types of the cells. The degradation of the SHJ and IMM cells was reversed to zero or slight growth while the degradation of the CIGS decreased by ∼25%. Possible mechanisms of improvement included absorption and reflection of harmful solar UV, shielding UV-sensitive front conductors (as in the case of CIGS cells), and the gradual improvement of the optical coupling over time. The positive impact of the downshifted PL on PV efficiency was shaded by the loss of the incident visible solar light due to reflection and scattering from the SCL. Possible, but small, positive contribution of the downshifted PL was indirectly observed in the case of the SHJ and IMM cells. To further improve the stabilizing effect and implement the increase in PV efficiency of the coated cells, the SCL will have to be set free of large-size light scattering impurities. The layer has also to be textured and antireflection-coated to minimize reflection of the incident visible solar light.
Qualitatively different behavior of each cell material visible in Figure 25 suggests that phenomenological compatibility of cell base compound and coating properties might be the most important “ingredient” of the combination; maybe each cell material has its own best coating. For instance, CORIN worked better for CIGS than SCL as a UV stabilizer but SCL was better than CORIN for SHJ and IMM. The future work will focus on the search for an optimal protective SCL coating for each type of PV cell. This will include the selection of suitable polymer base, spectrum downshifting phosphor, composition, concentration, and layer structure.
Since most space and low-orbit vehicles (such as Elon Musk’s Starlink constellation) rely on solar power, the proposed polymer nanocomposite layers that increase the operational lifetime and power efficiency of the coated solar panels have a great commercial potential.
-
Funding information: Dillard team appreciates the financial support from US Air Force Office of Scientific Research Grant Nos FA9550-18-1-0364 and FA9550-23-1-0611 and Army Research Office Grant No. W911NF-22-1-0128 and the partial support from Dillard University Minority Health and Health Disparity Research Center MHHDRC. Dr. Patel’s research was sponsored by the NSF Grant No. 2200426. Drs Sarkisov, Patel, and Fedoseyev also acknowledge the support from NASA contracts Nos 80NSSC22PB171 and 80NSSC22PB198.
-
Author contributions: Abdalla M. Darwish: conceptualization, investigation, and writing; Sergey S. Sarkisov: conceptualization, investigation, and writing – reviewing and editing; Brandon Graycol: investigation; Anja Hribljan: investigation; Darayas N. Patel: conceptualization and investigation; Alex Fedoseyev: conceptualization and investigation; David Hui: conceptualization; Paolo Mele: conceptualization; Giovanna Latronico: investigation; Kyu Cho: conceptualization; Anit Giri: conceptualization; and Brent Koplitz: conceptualization. All authors have accepted responsibility for the entire content of this manuscript and approved its submission. The views and conclusions contained in this document are those of the authors and should not be interpreted as representing the official policies, either expressed or implied, of the U.S. Government. The U.S. Government is authorized to reproduce and distribute reprints for Government purposes notwithstanding any copyright notation herein.
-
Conflict of interest: David Hui, who is the co-author of this article, is a current Editorial Board member of Nanotechnology Reviews. This fact did not affect the peer-review process. The authors declare no other conflict of interest.
References
[1] CORIN XLS Polyimide. Nexolve. 2023. https://hybridplastics.com/wp-content/uploads/2015/04/CORIN.pdf.Search in Google Scholar
[2] Finckenor MM, Rodman L, Farmer B. Analysis of fluorinated polyimides flown on the Materials International Space Station Experiment. NASA. 2015; NASA/TM. 2015;218205, https://ntrs.nasa.gov/api/citations/20150016168/downloads/20150016168.pdf.Search in Google Scholar
[3] CP1™ Polyimide. Nexolve. 2023. https://nexolve.com/wp-content/uploads/2021/10/TDS_CP1_Clear.pdf.Search in Google Scholar
[4] Optinox® SR Films and Coatings. Nexolve. 2023. https://nexolve.com/wp-content/uploads/2021/10/TDS_Optinox_SR.pdf.Search in Google Scholar
[5] Nexolve Essar™ Stretch 255 Polyimide. Shonghan Plastic Technology Co., Ltd. 2023. http://www.lookpolymers.com/polymer_NeXolve-Essar-Stretch-255-Polyimide.php.Search in Google Scholar
[6] Carr JA, Johnson L, Boyd D, Phillips B, Finckenor M, Farmer B, et al. LISA-T part three: The design and space environments testing of a thin-film power generation and communication array. Acta Astronaut. 2023;205:267–80.10.1016/j.actaastro.2023.02.001Search in Google Scholar
[7] Baker CC, Fontana J, Kim W, Bowman SR, Sanghera J, Ballato J, et al. Nanoparticle doping for high power fiber lasers at eye-safer wavelengths. Opt Express. 2017;25(12):3903–13915.10.1364/OE.25.013903Search in Google Scholar PubMed
[8] Wang X, Zhao S, Zhang Y, Sheng G. Controlled synthesis and tunable luminescence of NaYF4:Eu3+. J Rare Earth. 2010;28:222–4.10.1016/S1002-0721(10)60306-7Search in Google Scholar
[9] Xie A, Liu X, Xiong Y. Eu3+ doped K-Lu-F system optical materials: controlling synthesis, phase evolution, and optical properties. J Rare Earth. 2015;33(12):1261–7.10.1016/S1002-0721(14)60555-XSearch in Google Scholar
[10] Li S, Li Y, Sun J, Man X. Synthesis and photoluminescent characteristics of Eu3+-doped MMoO4 (M = Sr, Ba) nanophosphors by a hydrothermal method. J Rare Earth. 2017;35(4):347–55.10.1016/S1002-0721(17)60918-9Search in Google Scholar
[11] Zoghbi ME, Altenberg GA. Membrane protein reconstitution in nanodiscs for luminescence spectroscopy studies. Nanotech Rev. 2017;6(1):33–46.10.1515/ntrev-2016-0078Search in Google Scholar
[12] Geitenbeek RG, de Wijn HW, Meijerink A. Non-Boltzmann luminescence in NaYF4:Eu3+: Implications for luminescence thermometry. Phys Rev Appl. 2018;10:064006.10.1103/PhysRevApplied.10.064006Search in Google Scholar
[13] Han Q, Hao A, Gao W, Qi J, Wang Y, Dong J. Luminescence mechanism of Eu3+ ions doped NaYF4 nanocrystals via in situ time-resolved spectroscopy. Ceram Intern. 2020;46:11132–36.10.1016/j.ceramint.2020.01.133Search in Google Scholar
[14] Godlewski MM, Kaszewski J, Kielbik P, Olszewski J, Lipinski W, Slonska-Zielonka A, et al. New generation of oxide-based nanoparticles for the applications in early cancer detection and diagnostics. Nanotech Rev. 2020;9:274–302.10.1515/ntrev-2020-0022Search in Google Scholar
[15] Elkodous MA, El-Husseiny HM, El-Sayyad GS, Hashem AH, Doghish AS, Elfadil D, et al. Recent advances in waste-recycled nanomaterials for biomedical applications: Waste-to-wealth. Nanotech Rev. 2021;10:1662–739.10.1515/ntrev-2021-0099Search in Google Scholar
[16] Madani M, Hosny S, Alshangiti DM, Nady N, Alkhursani AA, Alkhaldi H, et al. Green synthesis of nanoparticles for varied applications: Green renewable resources and energy-efficient synthetic routes. Nanotech Rev. 2022;11:731–59.10.1515/ntrev-2022-0034Search in Google Scholar
[17] Duan H, Wang T, Su Z, Pang H, Chen C. Recent progress and challenges in plasmonic nanomaterials. Nanotech Rev. 2022;11:846–73.10.1515/ntrev-2022-0039Search in Google Scholar
[18] Elkodous MA, Hamad HA, Abdel Maksoud MIA, Ali GAM, El Abboubi M, Bedir AG, et al. Cutting-edge development in waste-recycled nanomaterials for energy storage and conversion applications. Nanotech Rev. 2022;11:2215–94.10.1515/ntrev-2022-0129Search in Google Scholar
[19] Patel D, Sarkisov S, Darwish A, Ballato J. Optical gain in capillary light guides filled with NaYF4: Yb3+, Er3+ nanocolloids. Opt Express. 2016;24(18):21147.10.1364/OE.24.021147Search in Google Scholar PubMed
[20] Wang Z-J, Tao F, Cai W-L, Yao L-Z, Li X-G. Hydrothermal synthesis of NaEuF4 spindle-like nanocrystals. Bull Mater Sci. 2011;34(7):1371–4.10.1007/s12034-011-0330-ySearch in Google Scholar
[21] Kesavulu CR, Kumar KK, Vijaya N, Lim KS, Jayasankar CK. Thermal, vibrational and optical properties of Eu3+-doped lead fluorophosphate glasses for red laser applications. Mater Chem Phys. 2013;141:903–11.10.1016/j.matchemphys.2013.06.021Search in Google Scholar
[22] Zhydachevskyy Y, Tsiurma V, Baran M, Lipinska L, Sybilski P, Suchoki A. Quantum efficiency of the down-conversion process in Bi3+/–Yb3+ co-doped Gd2O3. J Lumin. 2018;196:169–73.10.1016/j.jlumin.2017.12.042Search in Google Scholar
[23] Panday S. Triple-Junction Solar Cells for Space Exploration. LEDs & Solar Cell Course at UIUC. 2019. https://443.ece.illinois.edu/files/2019/05/SolarCellReportPandeyWaterMarked.pdf.Search in Google Scholar
[24] Li S, Pomaska M, Lambertz A, Duan W, Bittkau K, Qiu D, Yao Z, et al. Transparent-conductive-oxide-free front contacts for high-efficiency silicon heterojunction solar cells. Joule. 2021;5:1535–47.10.1016/j.joule.2021.04.004Search in Google Scholar
[25] Radha K. Development of four-terminal devices utilising thin-film solar cells. MS thesis. Delft, Netherlands: Delft University of Technology; 2018.Search in Google Scholar
[26] Poe G, Farmer B. Polyimide polymer with oligomeric silsesquioxane. U.S. patent 7619042B2; November 2009.Search in Google Scholar
[27] Poe G, Farmer B. Polymeric coating for protecting objects. U.S. patent 8053492B2; November 2011.Search in Google Scholar
[28] Darwish A, Sarkisov S, Mele P. Nano-composite thermo-electric energy converter and fabrication method thereof. U.S. patent 10283691B2; May 2019.Search in Google Scholar
[29] Darwish A, Sarkisov S. Method and apparatus for open-air pulsed laser deposition. U.S. patent 10316403B2; June 2019.Search in Google Scholar
[30] Darwish A, Sarkisov S. Multiple beam pulsed laser deposition of composite films. U.S. patent 11059128B2; July 2021.Search in Google Scholar
[31] Darwish AM, Sagapolutele MT, Sarkisov S, Patel D, Hui D, Koplitz B. Double beam pulsed laser deposition of composite films of poly (methyl methacrylate) and rare earth fluoride upconversion phosphors. Compos Part B – Eng. 2013;55:139–46.10.1016/j.compositesb.2013.06.013Search in Google Scholar
[32] Darwish AM, Wilson S, Sarkisov S, Patel D. Double beam pulsed laser deposition of polymer nanocomposite NaYF4:Tm3+, Yb3+ films for optical sensors and light emitting applications. In: Yin S, Guo R, editors. Photonic fiber and crystal devices: advances in materials and innovations in device applications VII. Proceedings of SPIE 8847. San Diego, CA. Bellingham, WA: SPIE; 2013 Sept. p. 884702.10.1117/12.2027144Search in Google Scholar
[33] Darwish AM, Burkett A, Blackwell A, Taylor K, Sarkisov S, Patel D, et al. Polymer-inorganic nano-composite thin film upconversion light emitters prepared by double-beam matrix assisted pulsed laser evaporation (DB-MAPLE) method. Compos Part B – Eng. 2015;68:355–64.10.1016/j.compositesb.2014.08.044Search in Google Scholar
[34] Darwish AM, Burkett A, Blackwell A, Taylor K, Walker V, Sarkisov S, et al. Efficient upconversion polymer-inorganic nanocomposite emitters prepared by the double beam matrix assisted pulsed laser evaporation (DB-MAPLE). In: Yin S, Guo R, editors. Photonic fiber and crystal devices: advances in materials and innovations in device applications VIII. Proceedings of SPIE 9200. Vol. 92000. San Diego, CA. Bellingham, WA: SPIE; 2014 Sept.10.1117/12.2063129Search in Google Scholar
[35] Darwish AM, Wilson S, Blackwell A, Taylor K, Sarkisov SS, Patel DN, et al. Ammonia sensor based on polymer-inorganic nano-composite thin film upconversion light emitter prepared by double-beam pulsed laser deposition. Am J Mater Sci. 2015;5(3A):8–15.Search in Google Scholar
[36] Darwish AM, Wilson S, Blackwell A, Taylor K, Sarkisov S, Patel D, et al. Polymer-inorganic nanocomposite thin film emitters, optoelectronic chemical sensors, and energy harvesters produced by multiple-beam pulsed laser deposition. In: Yin S, Guo R, editors. Photonic fiber and crystal devices: advances in materials and innovations in device applications IX: Proceedings of SPIE 9586. San Diego, CA. Bellingham, WA: SPIE; 2015 Aug. p. 958602.10.1117/12.2185498Search in Google Scholar
[37] Darwish AM, Wilson S, Blackwell A, Sarkisov S, Patel D, Mele P, et al. Multi-beam pulsed laser deposition: new method of making nanocomposite coatings. In: Yin S, Guo R, editors. Photonic fiber and crystal devices: advances in materials and innovations in device applications IX: Proceedings of SPIE 9586. San Diego, CA. Bellingham, WA: SPIE; 2015 Aug. p. 958605.10.1117/12.2214633Search in Google Scholar
[38] Darwish AM, Moorea S, Muhammad A, Sarkisov SS, Patel DN, Mele P, et al. Organic-inorganic nano-composite films for photonic applications made by multi-beam multi-target pulsed laser deposition with remote control of the plume directions. In: Yin S, Guo R, editors. Photonic fiber and crystal devices: advances in materials and innovations in device applications X: Proceedings of SPIE 9958. San Diego, CA. Bellingham, WA: SPIE; 2016 Sep. p. 995802.10.1117/12.2237538Search in Google Scholar
[39] Darwish AM, Moore S, Muhammad A, Sarkisov S, Patel D, Mele P, et al. Polymer nano-composite films with inorganic upconversion phosphor and electro-optic additives made by concurrent triple-beam matrix assisted and direct pulsed laser deposition. Compos Part B – Eng. 2017;109:82–90.10.1016/j.compositesb.2016.10.053Search in Google Scholar
[40] Darwish AM, Sarkisov SS, Patel DN. Concurrent multi-target laser ablation for making nano-composite films Chapter 6. In: Yang D, editor. Applications of laser ablation – Thin Film Deposition, Nanomaterial Synthesis and Surface Modification. Rijeka, Croatia: InTech; 2016. p. 129–48.10.5772/64816Search in Google Scholar
[41] Darwish AM, Sarkisov SS, Patel DN, Muhammad A, Thompson K, Johnson M, et al. Polymer nanocomposite luminescent films for solar energy harvesting made by concurrent multi-beam multi-target pulsed laser deposition. In: Yin S, Guo R, editors. Photonic fiber and crystal devices: advances in materials and innovations in device applications XII: Proceedings of SPIE 10755. San Diego, CA. Bellingham, WA: SPIE; 2018 Sep. p. 107552.Search in Google Scholar
[42] Darwish AM, Sarkisov SS, Patel DN. Nanocomposite luminescent solar concentrators: Optics for green energy. Asian J Phys. 2018;27(9–12):625–36.Search in Google Scholar
[43] Darwish AM, Sarkisov SS, Wilson J, Muhammad A, Thompson K, Patel DN, et al. Luminescent solar concentrators based on polymer nanocomposite films made by open-air pulsed laser deposition. In: Yin S, Guo R, editors. Photonic fiber and crystal devices: advances in materials and innovations in device applications XIII: Proceedings of SPIE 11123. San Diego, CA. Bellingham, WA: SPIE; 2019 Sep. p. 1112302.10.1117/12.2530359Search in Google Scholar
[44] Darwish AM, Sarkisov SS, Patel DN. Nanocomposite windows converting solar power into electricity for self-sustaining buildings. In: Bumajdad A, Bouhamra W, Alsayegh OA, Kamal HA, Alhajraf SF, editors. Gulf Conference on Sustainable Built Environment. Cham, Switzerland: Springer Nature Switzerland AG; 2020. p. 367–82.10.1007/978-3-030-39734-0_21Search in Google Scholar
[45] Darwish AM, Sarkisov SS, Wilson S, Collins E, Patel DN, Paolo Mele P, et al. Quantum cutting organic-inorganic nanocomposites. In: Yin S, Guo R, editors. Photonic Fiber and Crystal Devices: Advances in Materials and Innovations in Device Applications XV: Proceedings of SPIE 11826. San Diego, CA. Bellingham, WA: SPIE; 2021 August. p. 1182606.10.1117/12.2594612Search in Google Scholar
[46] Darwish AM, Sarkisov SS, Wilson S, Wilson J, Collins E, Patel DN, et al. Polymer nanocomposite sunlight spectrum down-converters made by open-air PLD. Nanotech Rev. 2020;9:1044–58.10.1515/ntrev-2020-0079Search in Google Scholar
[47] PVIV Series IV Station, User’s Manual. Newport. 2018. https://www.newport.com/medias/sys_master/software/software/h32/he9/9132470796318/MPVIV-IV-Station.pdf.Search in Google Scholar
[48] Application Note 47. The Challenge of Making Reliable Solar Cell Measurements. Newport Corporation Technology and Applications Center. 2020. https://www.astm.org/e0948-16r20.html.Search in Google Scholar
[49] ASTM E948-16 Standard. https://cdn.standards.iteh.ai/samples/106558/ee0b2a87bb964c6c9d2813036bb95c44/ASTM-E948-16-2020-pdf.Search in Google Scholar
[50] Sinha A, Qian J, Moffitt SL, Hurst K, Terwilliger K, Miller DC, et al. UV-induced degradation of high-efficiency silicon PV modules with different cell architectures. Prog Photovolt Res Appl. 2023;31:36–51.10.1002/pip.3606Search in Google Scholar
[51] Malm U. Modelling and degradation characteristics of thin-film CIGS solar cells. Ph. D. thesis. Uppsala, Sweden: Uppsala University; 2008.Search in Google Scholar
[52] Wang J. Open-circuit voltage, fill factor, and heterojunction band offset in semiconductor diode solar cells. EcoMat. 2022;4:e12263.10.1002/eom2.12263Search in Google Scholar
[53] Salhi B. The photovoltaic cell based on CIGS: Principles and technologies. Materials. 2022;15(5):1908.10.3390/ma15051908Search in Google Scholar PubMed PubMed Central
© 2024 the author(s), published by De Gruyter
This work is licensed under the Creative Commons Attribution 4.0 International License.
Articles in the same Issue
- Research Articles
- Tension buckling and postbuckling of nanocomposite laminated plates with in-plane negative Poisson’s ratio
- Polyvinylpyrrolidone-stabilised gold nanoparticle coatings inhibit blood protein adsorption
- Energy and mass transmission through hybrid nanofluid flow passing over a spinning sphere with magnetic effect and heat source/sink
- Surface treatment with nano-silica and magnesium potassium phosphate cement co-action for enhancing recycled aggregate concrete
- Numerical investigation of thermal radiation with entropy generation effects in hybrid nanofluid flow over a shrinking/stretching sheet
- Enhancing the performance of thermal energy storage by adding nano-particles with paraffin phase change materials
- Using nano-CaCO3 and ceramic tile waste to design low-carbon ultra high performance concrete
- Numerical analysis of thermophoretic particle deposition in a magneto-Marangoni convective dusty tangent hyperbolic nanofluid flow – Thermal and magnetic features
- Dual numerical solutions of Casson SA–hybrid nanofluid toward a stagnation point flow over stretching/shrinking cylinder
- Single flake homo p–n diode of MoTe2 enabled by oxygen plasma doping
- Electrostatic self-assembly effect of Fe3O4 nanoparticles on performance of carbon nanotubes in cement-based materials
- Multi-scale alignment to buried atom-scale devices using Kelvin probe force microscopy
- Antibacterial, mechanical, and dielectric properties of hydroxyapatite cordierite/zirconia porous nanocomposites for use in bone tissue engineering applications
- Time-dependent Darcy–Forchheimer flow of Casson hybrid nanofluid comprising the CNTs through a Riga plate with nonlinear thermal radiation and viscous dissipation
- Durability prediction of geopolymer mortar reinforced with nanoparticles and PVA fiber using particle swarm optimized BP neural network
- Utilization of zein nano-based system for promoting antibiofilm and anti-virulence activities of curcumin against Pseudomonas aeruginosa
- Antibacterial effect of novel dental resin composites containing rod-like zinc oxide
- An extended model to assess Jeffery–Hamel blood flow through arteries with iron-oxide (Fe2O3) nanoparticles and melting effects: Entropy optimization analysis
- Comparative study of copper nanoparticles over radially stretching sheet with water and silicone oil
- Cementitious composites modified by nanocarbon fillers with cooperation effect possessing excellent self-sensing properties
- Confinement size effect on dielectric properties, antimicrobial activity, and recycling of TiO2 quantum dots via photodegradation processes of Congo red dye and real industrial textile wastewater
- Biogenic silver nanoparticles of Moringa oleifera leaf extract: Characterization and photocatalytic application
- Novel integrated structure and function of Mg–Gd neutron shielding materials
- Impact of multiple slips on thermally radiative peristaltic transport of Sisko nanofluid with double diffusion convection, viscous dissipation, and induced magnetic field
- Magnetized water-based hybrid nanofluid flow over an exponentially stretching sheet with thermal convective and mass flux conditions: HAM solution
- A numerical investigation of the two-dimensional magnetohydrodynamic water-based hybrid nanofluid flow composed of Fe3O4 and Au nanoparticles over a heated surface
- Development and modeling of an ultra-robust TPU-MWCNT foam with high flexibility and compressibility
- Effects of nanofillers on the physical, mechanical, and tribological behavior of carbon/kenaf fiber–reinforced phenolic composites
- Polymer nanocomposite for protecting photovoltaic cells from solar ultraviolet in space
- Study on the mechanical properties and microstructure of recycled concrete reinforced with basalt fibers and nano-silica in early low-temperature environments
- Synergistic effect of carbon nanotubes and polyvinyl alcohol on the mechanical performance and microstructure of cement mortar
- CFD analysis of paraffin-based hybrid (Co–Au) and trihybrid (Co–Au–ZrO2) nanofluid flow through a porous medium
- Forced convective tangent hyperbolic nanofluid flow subject to heat source/sink and Lorentz force over a permeable wedge: Numerical exploration
- Physiochemical and electrical activities of nano copper oxides synthesised via hydrothermal method utilising natural reduction agents for solar cell application
- A homotopic analysis of the blood-based bioconvection Carreau–Yasuda hybrid nanofluid flow over a stretching sheet with convective conditions
- In situ synthesis of reduced graphene oxide/SnIn4S8 nanocomposites with enhanced photocatalytic performance for pollutant degradation
- A coarse-grained Poisson–Nernst–Planck model for polyelectrolyte-modified nanofluidic diodes
- A numerical investigation of the magnetized water-based hybrid nanofluid flow over an extending sheet with a convective condition: Active and passive controls of nanoparticles
- The LyP-1 cyclic peptide modified mesoporous polydopamine nanospheres for targeted delivery of triptolide regulate the macrophage repolarization in atherosclerosis
- Synergistic effect of hydroxyapatite-magnetite nanocomposites in magnetic hyperthermia for bone cancer treatment
- The significance of quadratic thermal radiative scrutinization of a nanofluid flow across a microchannel with thermophoretic particle deposition effects
- Ferromagnetic effect on Casson nanofluid flow and transport phenomena across a bi-directional Riga sensor device: Darcy–Forchheimer model
- Performance of carbon nanomaterials incorporated with concrete exposed to high temperature
- Multicriteria-based optimization of roller compacted concrete pavement containing crumb rubber and nano-silica
- Revisiting hydrotalcite synthesis: Efficient combined mechanochemical/coprecipitation synthesis to design advanced tunable basic catalysts
- Exploration of irreversibility process and thermal energy of a tetra hybrid radiative binary nanofluid focusing on solar implementations
- Effect of graphene oxide on the properties of ternary limestone clay cement paste
- Improved mechanical properties of graphene-modified basalt fibre–epoxy composites
- Sodium titanate nanostructured modified by green synthesis of iron oxide for highly efficient photodegradation of dye contaminants
- Green synthesis of Vitis vinifera extract-appended magnesium oxide NPs for biomedical applications
- Differential study on the thermal–physical properties of metal and its oxide nanoparticle-formed nanofluids: Molecular dynamics simulation investigation of argon-based nanofluids
- Heat convection and irreversibility of magneto-micropolar hybrid nanofluids within a porous hexagonal-shaped enclosure having heated obstacle
- Numerical simulation and optimization of biological nanocomposite system for enhanced oil recovery
- Laser ablation and chemical vapor deposition to prepare a nanostructured PPy layer on the Ti surface
- Cilostazol niosomes-loaded transdermal gels: An in vitro and in vivo anti-aggregant and skin permeation activity investigations towards preparing an efficient nanoscale formulation
- Linear and nonlinear optical studies on successfully mixed vanadium oxide and zinc oxide nanoparticles synthesized by sol–gel technique
- Analytical investigation of convective phenomena with nonlinearity characteristics in nanostratified liquid film above an inclined extended sheet
- Optimization method for low-velocity impact identification in nanocomposite using genetic algorithm
- Analyzing the 3D-MHD flow of a sodium alginate-based nanofluid flow containing alumina nanoparticles over a bi-directional extending sheet using variable porous medium and slip conditions
- A comprehensive study of laser irradiated hydrothermally synthesized 2D layered heterostructure V2O5(1−x)MoS2(x) (X = 1–5%) nanocomposites for photocatalytic application
- Computational analysis of water-based silver, copper, and alumina hybrid nanoparticles over a stretchable sheet embedded in a porous medium with thermophoretic particle deposition effects
- A deep dive into AI integration and advanced nanobiosensor technologies for enhanced bacterial infection monitoring
- Effects of normal strain on pyramidal I and II 〈c + a〉 screw dislocation mobility and structure in single-crystal magnesium
- Computational study of cross-flow in entropy-optimized nanofluids
- Significance of nanoparticle aggregation for thermal transport over magnetized sensor surface
- A green and facile synthesis route of nanosize cupric oxide at room temperature
- Effect of annealing time on bending performance and microstructure of C19400 alloy strip
- Chitosan-based Mupirocin and Alkanna tinctoria extract nanoparticles for the management of burn wound: In vitro and in vivo characterization
- Electrospinning of MNZ/PLGA/SF nanofibers for periodontitis
- Photocatalytic degradation of methylene blue by Nd-doped titanium dioxide thin films
- Shell-core-structured electrospinning film with sequential anti-inflammatory and pro-neurogenic effects for peripheral nerve repairment
- Flow and heat transfer insights into a chemically reactive micropolar Williamson ternary hybrid nanofluid with cross-diffusion theory
- One-pot fabrication of open-spherical shapes based on the decoration of copper sulfide/poly-O-amino benzenethiol on copper oxide as a promising photocathode for hydrogen generation from the natural source of Red Sea water
- A penta-hybrid approach for modeling the nanofluid flow in a spatially dependent magnetic field
- Advancing sustainable agriculture: Metal-doped urea–hydroxyapatite hybrid nanofertilizer for agro-industry
- Utilizing Ziziphus spina-christi for eco-friendly synthesis of silver nanoparticles: Antimicrobial activity and promising application in wound healing
- Plant-mediated synthesis, characterization, and evaluation of a copper oxide/silicon dioxide nanocomposite by an antimicrobial study
- Effects of PVA fibers and nano-SiO2 on rheological properties of geopolymer mortar
- Investigating silver and alumina nanoparticles’ impact on fluid behavior over porous stretching surface
- Potential pharmaceutical applications and molecular docking study for green fabricated ZnO nanoparticles mediated Raphanus sativus: In vitro and in vivo study
- Effect of temperature and nanoparticle size on the interfacial layer thickness of TiO2–water nanofluids using molecular dynamics
- Characteristics of induced magnetic field on the time-dependent MHD nanofluid flow through parallel plates
- Flexural and vibration behaviours of novel covered CFRP composite joints with an MWCNT-modified adhesive
- Experimental research on mechanically and thermally activation of nano-kaolin to improve the properties of ultra-high-performance fiber-reinforced concrete
- Analysis of variable fluid properties for three-dimensional flow of ternary hybrid nanofluid on a stretching sheet with MHD effects
- Biodegradability of corn starch films containing nanocellulose fiber and thymol
- Toxicity assessment of copper oxide nanoparticles: In vivo study
- Some measures to enhance the energy output performances of triboelectric nanogenerators
- Reinforcement of graphene nanoplatelets on water uptake and thermomechanical behaviour of epoxy adhesive subjected to water ageing conditions
- Optimization of preparation parameters and testing verification of carbon nanotube suspensions used in concrete
- Max-phase Ti3SiC2 and diverse nanoparticle reinforcements for enhancement of the mechanical, dynamic, and microstructural properties of AA5083 aluminum alloy via FSP
- Advancing drug delivery: Neural network perspectives on nanoparticle-mediated treatments for cancerous tissues
- PEG-PLGA core–shell nanoparticles for the controlled delivery of picoplatin–hydroxypropyl β-cyclodextrin inclusion complex in triple-negative breast cancer: In vitro and in vivo study
- Conduction transportation from graphene to an insulative polymer medium: A novel approach for the conductivity of nanocomposites
- Review Articles
- Developments of terahertz metasurface biosensors: A literature review
- Overview of amorphous carbon memristor device, modeling, and applications for neuromorphic computing
- Advances in the synthesis of gold nanoclusters (AuNCs) of proteins extracted from nature
- A review of ternary polymer nanocomposites containing clay and calcium carbonate and their biomedical applications
- Recent advancements in polyoxometalate-functionalized fiber materials: A review
- Special contribution of atomic force microscopy in cell death research
- A comprehensive review of oral chitosan drug delivery systems: Applications for oral insulin delivery
- Cellular senescence and nanoparticle-based therapies: Current developments and perspectives
- Cyclodextrins-block copolymer drug delivery systems: From design and development to preclinical studies
- Micelle-based nanoparticles with stimuli-responsive properties for drug delivery
- Critical assessment of the thermal stability and degradation of chemically functionalized nanocellulose-based polymer nanocomposites
- Research progress in preparation technology of micro and nano titanium alloy powder
- Nanoformulations for lysozyme-based additives in animal feed: An alternative to fight antibiotic resistance spread
- Incorporation of organic photochromic molecules in mesoporous silica materials: Synthesis and applications
- A review on modeling of graphene and associated nanostructures reinforced concrete
- A review on strengthening mechanisms of carbon quantum dots-reinforced Cu-matrix nanocomposites
- Review on nanocellulose composites and CNFs assembled microfiber toward automotive applications
- Nanomaterial coating for layered lithium rich transition metal oxide cathode for lithium-ion battery
- Application of AgNPs in biomedicine: An overview and current trends
- Nanobiotechnology and microbial influence on cold adaptation in plants
- Hepatotoxicity of nanomaterials: From mechanism to therapeutic strategy
- Applications of micro-nanobubble and its influence on concrete properties: An in-depth review
- A comprehensive systematic literature review of ML in nanotechnology for sustainable development
- Exploiting the nanotechnological approaches for traditional Chinese medicine in childhood rhinitis: A review of future perspectives
- Twisto-photonics in two-dimensional materials: A comprehensive review
- Current advances of anticancer drugs based on solubilization technology
- Recent process of using nanoparticles in the T cell-based immunometabolic therapy
- Future prospects of gold nanoclusters in hydrogen storage systems and sustainable environmental treatment applications
- Preparation, types, and applications of one- and two-dimensional nanochannels and their transport properties for water and ions
- Microstructural, mechanical, and corrosion characteristics of Mg–Gd–x systems: A review of recent advancements
- Functionalized nanostructures and targeted delivery systems with a focus on plant-derived natural agents for COVID-19 therapy: A review and outlook
- Mapping evolution and trends of cell membrane-coated nanoparticles: A bibliometric analysis and scoping review
- Nanoparticles and their application in the diagnosis of hepatocellular carcinoma
- In situ growth of carbon nanotubes on fly ash substrates
- Structural performance of boards through nanoparticle reinforcement: An advance review
- Reinforcing mechanisms review of the graphene oxide on cement composites
- Seed regeneration aided by nanomaterials in a climate change scenario: A comprehensive review
- Surface-engineered quantum dot nanocomposites for neurodegenerative disorder remediation and avenue for neuroimaging
- Graphitic carbon nitride hybrid thin films for energy conversion: A mini-review on defect activation with different materials
- Nanoparticles and the treatment of hepatocellular carcinoma
- Special Issue on Advanced Nanomaterials and Composites for Energy Conversion and Storage - Part II
- Highly safe lithium vanadium oxide anode for fast-charging dendrite-free lithium-ion batteries
- Recent progress in nanomaterials of battery energy storage: A patent landscape analysis, technology updates, and future prospects
- Special Issue on Advanced Nanomaterials for Carbon Capture, Environment and Utilization for Energy Sustainability - Part II
- Calcium-, magnesium-, and yttrium-doped lithium nickel phosphate nanomaterials as high-performance catalysts for electrochemical water oxidation reaction
- Low alkaline vegetation concrete with silica fume and nano-fly ash composites to improve the planting properties and soil ecology
- Mesoporous silica-grafted deep eutectic solvent-based mixed matrix membranes for wastewater treatment: Synthesis and emerging pollutant removal performance
- Electrochemically prepared ultrathin two-dimensional graphitic nanosheets as cathodes for advanced Zn-based energy storage devices
- Enhanced catalytic degradation of amoxicillin by phyto-mediated synthesised ZnO NPs and ZnO-rGO hybrid nanocomposite: Assessment of antioxidant activity, adsorption, and thermodynamic analysis
- Incorporating GO in PI matrix to advance nanocomposite coating: An enhancing strategy to prevent corrosion
- Synthesis, characterization, thermal stability, and application of microporous hyper cross-linked polyphosphazenes with naphthylamine group for CO2 uptake
- Engineering in ceramic albite morphology by the addition of additives: Carbon nanotubes and graphene oxide for energy applications
- Nanoscale synergy: Optimizing energy storage with SnO2 quantum dots on ZnO hexagonal prisms for advanced supercapacitors
- Aging assessment of silicone rubber materials under corona discharge accompanied by humidity and UV radiation
- Tuning structural and electrical properties of Co-precipitated and Cu-incorporated nickel ferrite for energy applications
- Sodium alginate-supported AgSr nanoparticles for catalytic degradation of malachite green and methyl orange in aqueous medium
- An environmentally greener and reusability approach for bioenergy production using Mallotus philippensis (Kamala) seed oil feedstock via phytonanotechnology
- Micro-/nano-alumina trihydrate and -magnesium hydroxide fillers in RTV-SR composites under electrical and environmental stresses
- Mechanism exploration of ion-implanted epoxy on surface trap distribution: An approach to augment the vacuum flashover voltages
- Nanoscale engineering of semiconductor photocatalysts boosting charge separation for solar-driven H2 production: Recent advances and future perspective
- Excellent catalytic performance over reduced graphene-boosted novel nanoparticles for oxidative desulfurization of fuel oil
- Special Issue on Advances in Nanotechnology for Agriculture
- Deciphering the synergistic potential of mycogenic zinc oxide nanoparticles and bio-slurry formulation on phenology and physiology of Vigna radiata
- Nanomaterials: Cross-disciplinary applications in ornamental plants
- Special Issue on Catechol Based Nano and Microstructures
- Polydopamine films: Versatile but interface-dependent coatings
- In vitro anticancer activity of melanin-like nanoparticles for multimodal therapy of glioblastoma
- Poly-3,4-dihydroxybenzylidenhydrazine, a different analogue of polydopamine
- Chirality and self-assembly of structures derived from optically active 1,2-diaminocyclohexane and catecholamines
- Advancing resource sustainability with green photothermal materials: Insights from organic waste-derived and bioderived sources
- Bioinspired neuromelanin-like Pt(iv) polymeric nanoparticles for cancer treatment
- Special Issue on Implementing Nanotechnology for Smart Healthcare System
- Intelligent explainable optical sensing on Internet of nanorobots for disease detection
- Special Issue on Green Mono, Bi and Tri Metallic Nanoparticles for Biological and Environmental Applications
- Tracking success of interaction of green-synthesized Carbopol nanoemulgel (neomycin-decorated Ag/ZnO nanocomposite) with wound-based MDR bacteria
- Green synthesis of copper oxide nanoparticles using genus Inula and evaluation of biological therapeutics and environmental applications
- Biogenic fabrication and multifunctional therapeutic applications of silver nanoparticles synthesized from rose petal extract
- Metal oxides on the frontlines: Antimicrobial activity in plant-derived biometallic nanoparticles
- Controlling pore size during the synthesis of hydroxyapatite nanoparticles using CTAB by the sol–gel hydrothermal method and their biological activities
- Special Issue on State-of-Art Advanced Nanotechnology for Healthcare
- Applications of nanomedicine-integrated phototherapeutic agents in cancer theranostics: A comprehensive review of the current state of research
- Smart bionanomaterials for treatment and diagnosis of inflammatory bowel disease
- Beyond conventional therapy: Synthesis of multifunctional nanoparticles for rheumatoid arthritis therapy