Photocatalytic degradation of methylene blue by Nd-doped titanium dioxide thin films
-
Liu Guodong
 ,
Fuerkaiti Xiaerding
,
Fuerkaiti Xiaerding

Abstract
In this work, Nd (0.5, 1.0, 1.5, and 2.0 at%)-doped TiO2 thin films were synthesized on Si (100) substrates using a sol–gel spin-coating technique. The formation of the anatase phase was demonstrated by X-ray diffraction and Raman spectroscopy. It was also demonstrated that the doping of the Nd element resulted in a TiO2 crystal structure. X-ray photoelectron spectroscopy proved that the doping of Nd element promoted the transfer of Ti4+ to Ti3+, which facilitates the photocatalytic performance of the TiO2 films. Scanning electron microscope and atomic force microscope demonstrated that all of the Nd-doped film surfaces showed different degrees of aggregation relative to the pure TiO2 film surface. It was verified that the doping of Nd altered the lattice structure of TiO2 thin films, resulting in lattice defects on the surface and changing the grain size of the films. Meanwhile, the lattice defects and changes in the chemical state affect the photocatalytic performance of TiO2 films, and the highest photoactivity was observed for an Nd doping concentration of 1.0 at%. Nd doping causes lattice defects conducive to the formation of more Ti3+ oxidation centers and reduces the photogenerated electron–hole recombination rate, resulting in the improved photocatalytic performance of TiO2 films.
1 Introduction
Industrial production generates a large amount of industrial effluent, which contains a large number of chemicals that are harmful to the environment and the human body [1,2]. General methods of sewage treatment cannot deal with this chemical substance, and some treatment methods also produce secondary pollution. Photocatalytic technology is an emerging, efficient, and energy-saving modern green technology that decomposes pollutants into non-toxic or less toxic substances by using light radiation under the action of a catalyst. At present, the semiconductor photocatalysts that are widely studied basically belong to wide-band n-type semiconductor oxides, and more than ten types of photocatalysts have been studied, such as TiO2 [3], ZnO [4,5], CdS [6], WO3 [7], Fe2O3 [8], SnO2 [9], Cu2O [10], and SiO2 [11]. All of these semiconductor oxides have a certain degree of photocatalytic degradation of organic matter; however, because most of the semiconductor oxide materials are prone to chemical or photochemical corrosion, they are not suitable to be used as photocatalysts for wastewater treatment, while TiO2 is widely used for its excellent catalytic performance, stable chemical performance, safety, non-toxicity, no side-effects, a long time of persistence, and so on. This makes TiO2 one of the most potential photocatalysts for current applications. However, the characteristics of TiO2’s wider forbidden bandwidth (band gap = 3.2 eV) and relatively high carrier recombination rate severely limit its photocatalytic activity [12,13]. In order to improve the photocatalytic activity of TiO2, researchers have made numerous attempts to improve the photocatalytic activity of TiO2 by doping TiO2 compounds with metals and non-metals [14,15,16,17].
Currently, rare earth element doping is one of the common methods to improve the photocatalytic performance of TiO2 thin films. This is due to the unique electronic structure of the rare earth elements, where the electrons in the 4f orbitals are shielded by the electrons in the 5s and 5p orbitals, thus stabilizing the domains in the atomic structure. Meanwhile, the energy levels of the outer 4f and 5d orbitals together form the conduction band. The special domain and the non-full filled 4f electronic structure allow the rare earth elements to possess optical and magnetic properties that are very different from those of other metallic and non-metallic elements. Due to the above properties, the rare earth elements of La [18], Er [19], Yb [20], Sm [21], Eu, Ce [22], Pr, Nd [23], and Gd [24] have been used to improve the photocatalytic activity of semiconductor oxides.
Regarding the thin film fabrication, the sol–gel, electrostatic spinning, magnetron sputtering, co-precipitation, complexation, and spray pyrolysis methods have been used for the deposition of TiO2 thin films. The sol–gel method is one of the most dominant techniques for the large-scale synthesis of thin films due to the advantages of low cost, short preparation cycle, and ease of large-scale industrialization [25]. Meanwhile, the solution coating method is a film-making technology that does not require a vacuum environment and has been widely used in microelectronic devices and surface coating because of the small size of the required equipment, the ability of film formation on the surface of a variety of substrates, and the ease of solving raw materials. Therefore, it is considered one of the common methods for TiO2 film preparation.
Among all the rare earth elements, Nd has been less studied; especially, the mechanism and optical properties need further study systematically. In addition, some studies in this field have shown that Nd has a great potential application in improving the photocatalytic degradation properties, such as transmission and absorption of TiO2 [26,27,28,29]. Therefore, the aim of our work is to synthesize TiO2 thin films using a cost-effective sol–gel spin-coating technique, to investigate the effect of Nd dopants on the structural, optical, and photocatalytic properties of TiO2 and to explore its application in wastewater treatment. For the Nd-doped TiO2 films, first, the crystal structure and surface morphology were examined, the optical properties were then studied, and finally, the photocatalytic activity for methylene blue (MB) degradation under artificial sunlight irradiation was investigated, and the possible mechanism was explained.
2 Experimental procedure
2.1 Preparation of thin films
The Nd-doped TiO2 films were prepared using the sol–gel method. A 0.2 M TiO2 solution was used with butyl titanate (Sigma Aldrich 99%), acetylacetone (Merck 99%), hydrochloric acid (Merck 37%), polyethylene glycol-2000, and neodymium(iii) nitrate hexahydrate (99.9%). Two solutions (solution A and solution B) were prepared in the first step. About 5 mL of butyl titanate (0.02 mol) was mixed with 20 mL of anhydrous ethanol and 1.5 mL of acetylacetone (0.015 mol) to prepare solution A. Solution B was prepared from 15 mL of anhydrous ethanol and 2 mL of deionized (0.11 mol) water. Then, solution A and solution B were stirred separately for 20 min, and then were mixed and stirred, and the pH of the solution was adjusted to about 1–2 with HCl. Afterward, polyethylene glycol (PEG-2000) 0.3 g (0.00016 mol) was added to increase the dopant ratios to 0.5, 1.0, 1.5 at%, and 2.0 at% Nd/Ti in the TiO2 precursor solution, and the final solution was subjected for hydrolytic condensation reaction for 24 h. Next, the cleaned silicon wafer as substrate (single-polished p-type (100) crystal direction, with a thickness of 725 μm ± 10 μm, size of 20 mm × 20 mm) was placed in a suction cup of the screeding machine, and the precursor solution was dripped on the silicon wafer and the spin coating was started with a low speed of 1,000 rpm and then at a high speed of 3,000 rpm. After spin-coating, the spin-coated sample was heated at 100°C for 5 min. Then, the above procedures were repeated 20 times. The spin-coated samples are then annealed under a nitrogen atmosphere. The homogenized spin-coated sample was placed in a high-temperature tube furnace (OTF-1200). The program was set to increase the temperature by 5°C every minute, and the final temperature was set to 700°C. After reaching the holding temperature, the temperature was maintained at 700°C for 30 min and then cooled naturally. Before thermal annealing, the tube was vacuumed to about −0.02 Pa, and then nitrogen gas was passed to the tube to about 0.04 Pa. The above steps were repeated two to three times, and then the gas flow meter (D08-3E) was turned on to adjust the gas flow rate to 120 cm3. The flow rate of the gas remained unchanged until the end of the annealing process. The sample preparation procedure is shown in Figure 1. For the transmission spectra measurement, the Nd-doped TiO2 samples were fabricated on the glass substrate, keeping all the conditions same as above.
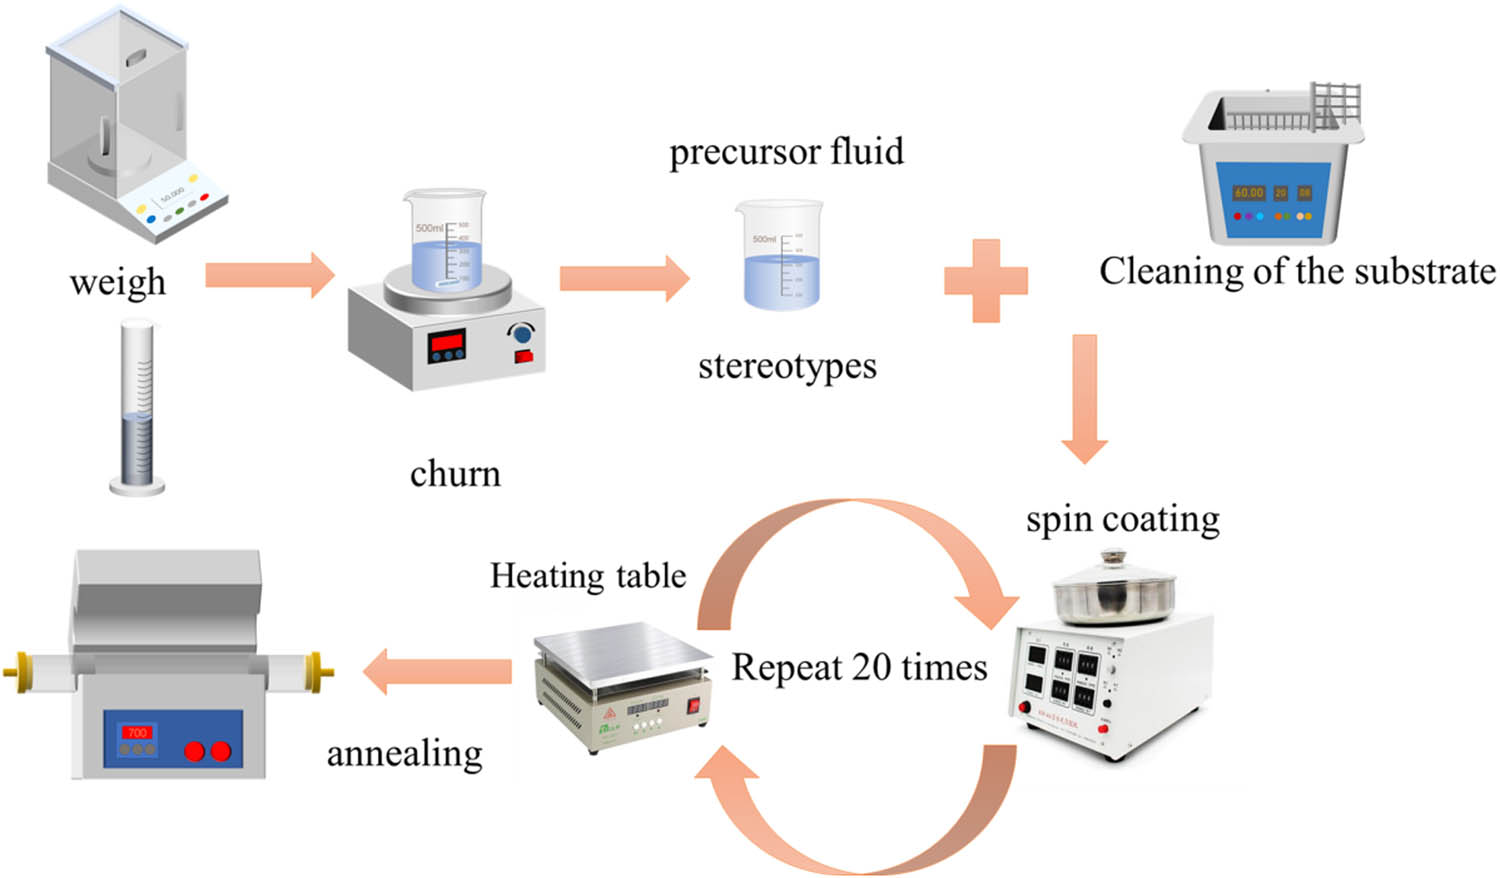
Thin film preparation process.
2.2 Characterization
After deposition, the necessary characterization was carried out to explore the physical properties of the TiO2 films. The crystal structure of the films was investigated using a Bruker D8 Advance X-ray diffractometer (XRD) (λ = 1.54 Å), Germany. The X-ray data of all the samples were recorded at a scanning speed of 2°/min between 20° and 60°. The thin film lattice structure of the films was also investigated using a Renishaw inVia Reflex Raman spectrometer (UK). The laser was selected to be 532 nm with a beam range of 100–3,500 cm−1. Changes in the chemical state of the films were investigated using a Thermo Fisher Scientific ESCALAB250Xi X-ray photoelectron spectrometer (USA). The surface morphology of the films was investigated using a Hitachi su8010 field emission scanning electron microscope (FESEM). The surface roughness of the thin films was investigated using a Bruker Dimension ICON atomic force microscope. Transmission spectra were obtained at room temperature using a LAMBDA 650 PerkinElmer UV-Vis spectrophotometer in the wavelength range of 200–800 nm.
2.3 Photocatalytic activity measurement
The photocatalytic activity of TiO2 films was investigated by determining the degradation of aqueous solutions of MB under visible light irradiation. MB, with a concentration of 5 mg/L was selected as a non-biodegradable organic pollutant in this study. The photocatalytic experiments were carried out in glass test tubes at room temperature. First, the adsorption–desorption equilibrium was established by the solution that was left in the dark for 30 min before light irradiation. Then, TiO2 films were immersed in MB solution, and the aqueous solution in the beaker was irradiated using a xenon lamp with a power of 350 W, where the xenon lamp light source was kept 10 cm above the beaker. The concentration of MB in the solution was monitored by collecting 4 mL of the irradiated solution every 2 h and recording the intensity of the UV-visible absorbance peaks as a function of reaction time:
where C 0 and A 0 are the initial concentration and absorbance of MB solution at 664 nm, respectively, and C and A are the concentration and absorbance of MB solution at 664 nm under UV irradiation at different times, respectively. The blank and dark experiments were corrected as the perturbations generated by the UV-vis radiation and film adsorption, respectively.
3 Results and discussion
3.1 XRD pattern analysis
Figure 2 shows the XRD patterns of the undoped and Nd-doped TiO2 thin film samples annealed at 700°C. The XRD curve of the undoped TiO2 thin film sample (curve a) at 2θ = 25.30, 37.79, and 48.03° corresponds to a TiO2 thin film with tetragonal geometry. The peaks match well with the card (JCPDS 84-1286). The peaks at 2θ = 27.44, 44.04, and 56.63° correspond to the rutile phase of TiO2 films (JCPDS-86-0148). Similar peaks are also observed in the XRD curve of the Nd-doped sample (b–e).
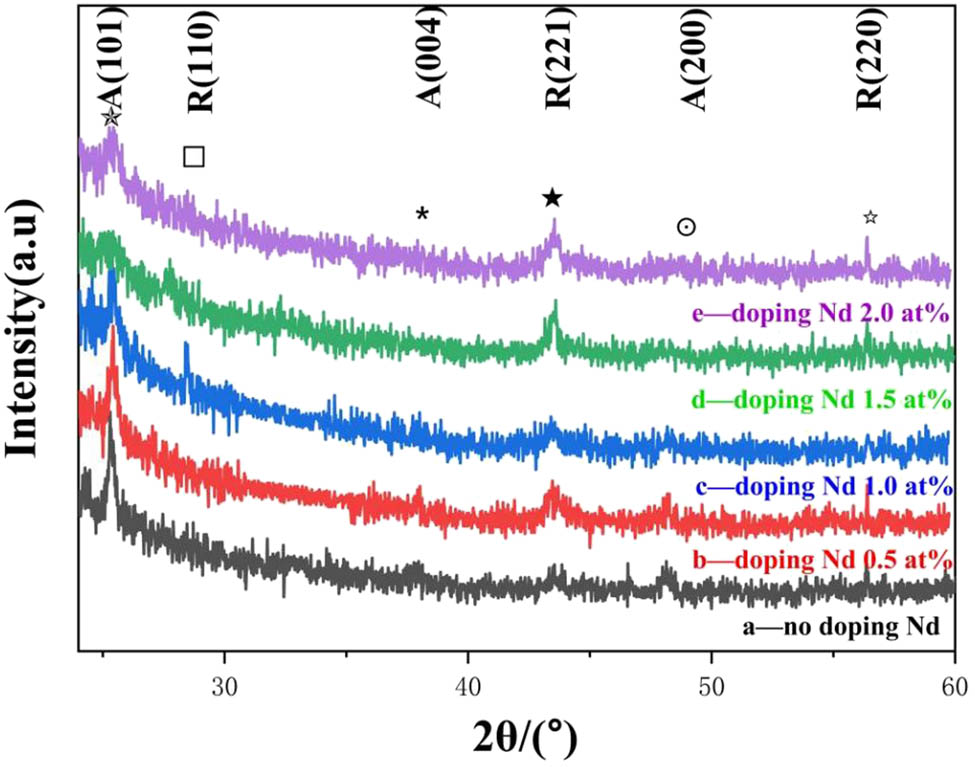
XRD spectra of the TiO2 film with Nd doping.
Compared to the undoped TiO2 thin film samples with Nd-doped samples, the diffraction intensity of the anatase diffraction peaks that decrease gradually can be observed, and the sharp peak pattern was changed to the dull peak pattern. Some of the diffraction peaks of the anatase phase almost disappeared in the TiO2 thin film sample, which was doped with 2% (curve e). The change in the diffraction peaks of the rutile phase with the increase of the doping ratio is exactly opposite to the change in the diffraction peaks of the anatase phase. The results indicate that doping leads to the deterioration of the crystallinity of the anatase phase and promotes the transformation of TiO2 from the anatase phase to the rutile phase. Meanwhile, we did not find any additional diffraction peaks that belong to the Nd elements or the related compounds and oxides, which can be attributed to the low percentage doping ratio or to indicate only a small amount of Nd3+ entering the TiO2 lattice instead of Ti4+ [30].
The crystallite size of the sample was calculated from the Scherrer equation (equation (2)) by selecting the diffraction peaks at the crystal plane (101) in the data analysis [31]:
where D is the average thickness of the grain that is in the direction perpendicular to the grain plane (Å), K is the Scherrer coefficient (K = 0.89 if β is the half-peak height and width of the diffraction peak, and K = 1 if β is the integral height and width of the diffraction peak), θ is the Bragg angle, γ is the X-ray wavelength with a value of 1.54056 Å. The values of the crystallite size, cell parameters, and cell volume for all samples are given in Table 1. It can be noted from the table that the grain size of the doped samples decreased as compared to the undoped samples. The values of the cell parameters and lattice size are compared with each other between the doped samples, and the grain size decreases with an increase of the doping percentage. The results showed that the sample size with a doping rate of 2% is increased, which corresponds to the trend of the diffraction peak of the 25.30° (101) anatase phase [31,32,33,34,35,36,37,38,39].
Cell parameters and lattice size values of undoped and doped TiO2 films
| Samples | Crystallite size (nm) | FWHM | a = b(Å) | c(Å) | c/a |
|---|---|---|---|---|---|
| TiO2 | 37.9 | 0.239 | 3.780 | 9.510 | 2.516 |
| At 0.5% Nd-TiO2 | 29.6 | 0.306 | 3.777 | 9.501 | 2.515 |
| At 1.0% Nd-TiO2 | 26.9 | 0.337 | 3.776 | 9.486 | 2.512 |
| At 1.5% Nd-TiO2 | 14.6 | 0.652 | 3.747 | 9.486 | 2.512 |
| At 2.0% Nd-TiO2 | 24.2 | 0.392 | 3.776 | 9.486 | 2.512 |
3.2 Raman profiling
Figure 3 shows the Raman spectra of the undoped TiO2 film and the doped TiO2 film with different doping ratios. With reference to the labeled Raman spectrogram data of the undoped TiO2 crystals [40], the anatase phase of TiO2 has six Raman vibrational modes: A1g + 2B1g + 3Eg, corresponding to the Raman peaks at 519 cm−1 (A1g + 2B1g, ν1 + ν2), 399 cm−1 (B1g, ν3), 640 cm−1 (Eg, ν4), 199 cm−1 (Eg, ν5), and 144 cm−1 (Eg, ν6). The rutile phase TiO2 has four Raman vibrational modes: A1g + B1g + B2g + Eg, corresponding to Raman peaks of 612 cm−1 (A1g, ν1), 143 cm−1 (B1g, ν2), 826 cm−1 (B2g, ν3), and 447 cm−1 (Eg, ν4) [14]. As shown in Figure 3, the deposited TiO2 films and their doped films on the silicon wafer substrate show obvious characteristic peaks of anatase and rutile phases, which are consistent with the XRD results. According to the literature, the vibrational peaks of anatase TiO2 in the Raman spectra represent the symmetric stretching vibrations, the symmetric bending vibrations, and the antisymmetric bending vibrations of the O–Ti–O bond, therefore reflecting the corresponding Eg, B1g, and A1g vibrational modes in the spectra [41]. The Eg mode is sensitive to the motion of the oxygen sub-lattice, the B1g mode is dominated by the Ti motion, and the A1g mode is also dominated by the same but opposite mode (antisymmetric). Since the Eg mode is particularly sensitive to the oxygen vacancy (Ov) defects, the variation of the Eg vibrational modes can be recognized as a direct indication of the presence of intrinsic defects in anatase TiO2 [42]. The Eg modes are sensitive to the motion of the oxygen sub-lattice, with the B1g mode dominated by Ti motion and the A1g mode dominated by the same but opposite mode (antisymmetric). As the Eg mode is particularly sensitive to Ov defects, changes in the Eg vibrational mode can be considered a direct indication of the presence of intrinsic defects in the anatase TiO2. Analysis of the spectrum in Figure 3 shows peaks at 144, 301, 399, 447, 525, and 639 cm−1. Since the silicon wafer was used as the substrate for the experiment, the 301 and 525 cm−1 peaks in the spectra represent the Raman peaks of SiO2 and Si, respectively. Therefore, the two peaks are not used as the object of analysis in the study. From the above Raman spectra, 144, 399, and 639 cm−1 in the spectrum represent the anatase phase, and 447 cm−1 represents the rutile phase. Since the peaks at 399, 447, and 639 cm−1 do not vary as much when compared to the 144 cm−1 peak, thus the main analysis is on the Eg 144 cm−1 peak. At the different doping ratios, the main Eg peaks of TiO2 films show no significant peak shift but the different changes in the intensity under the effect of the doping element Nd (Figure 3a). When the doping ratio reaches 0.5 at% (Figure 3b), the vibrational peak intensity of the main Eg peak decreases relative to that of the undoped sample. As the doping ratio continues to increase, the intensity of the main Eg peak increases, and reached at a maximum at 1.5 at% (Figure 3d) and decreased again at 2.0 at% (Figure 3e). The trend of the anatase phase in the Raman spectra is consistent with the trend of the anatase phase in the XRD spectra, which proves that a large number of crystal defects are generated in the crystal due to Nd doping, leading to a decrease in the crystallinity of the TiO2 film. As the position of the peaks in Figures 2 and 3 does not change significantly, the intensity of the peaks changes with the doping ratio and the corresponding trend [43]. The doping of Nd changes the long-range symmetric ordered structure of the TiO2 lattice to disordered (disordered structure can be shown in Section 3.4) [44]. The introduction of the dopant Nd also leads to the formation of defects in the Ti–O structure, which are explained in Section 3.3 [45,46,47,48].
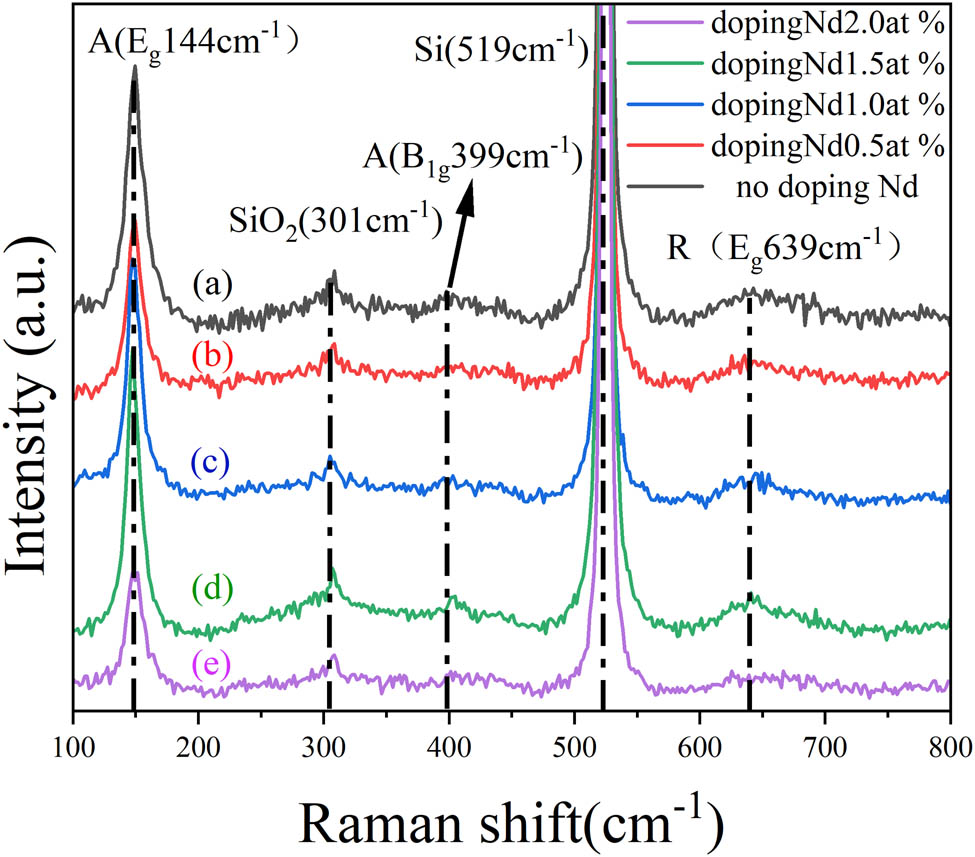
Raman spectra of the TiO2 films: (a) undoped film, (b), (c), (d), and (e) are the films doped with Nd at 0.5, 1.0, 1.5, and 2.0%, respectively.
3.3 X-ray photoelectron spectroscopy (XPS) pattern analysis
XPS can be used to analyze the changes in the chemical states of the elements of interest in a sample. In this study, the chemical states of Nd, Ti, and O were analyzed in all samples. All data analyses were calibrated against a peak of 284.80 eV for C 1s in element C as a standard peak. The measured spectral data of the sample films are shown in Figures 4–7.
X-ray photoelectron spectra of the TiO2 thin film: (a) chemical state of O and (b) chemical state of Ti.
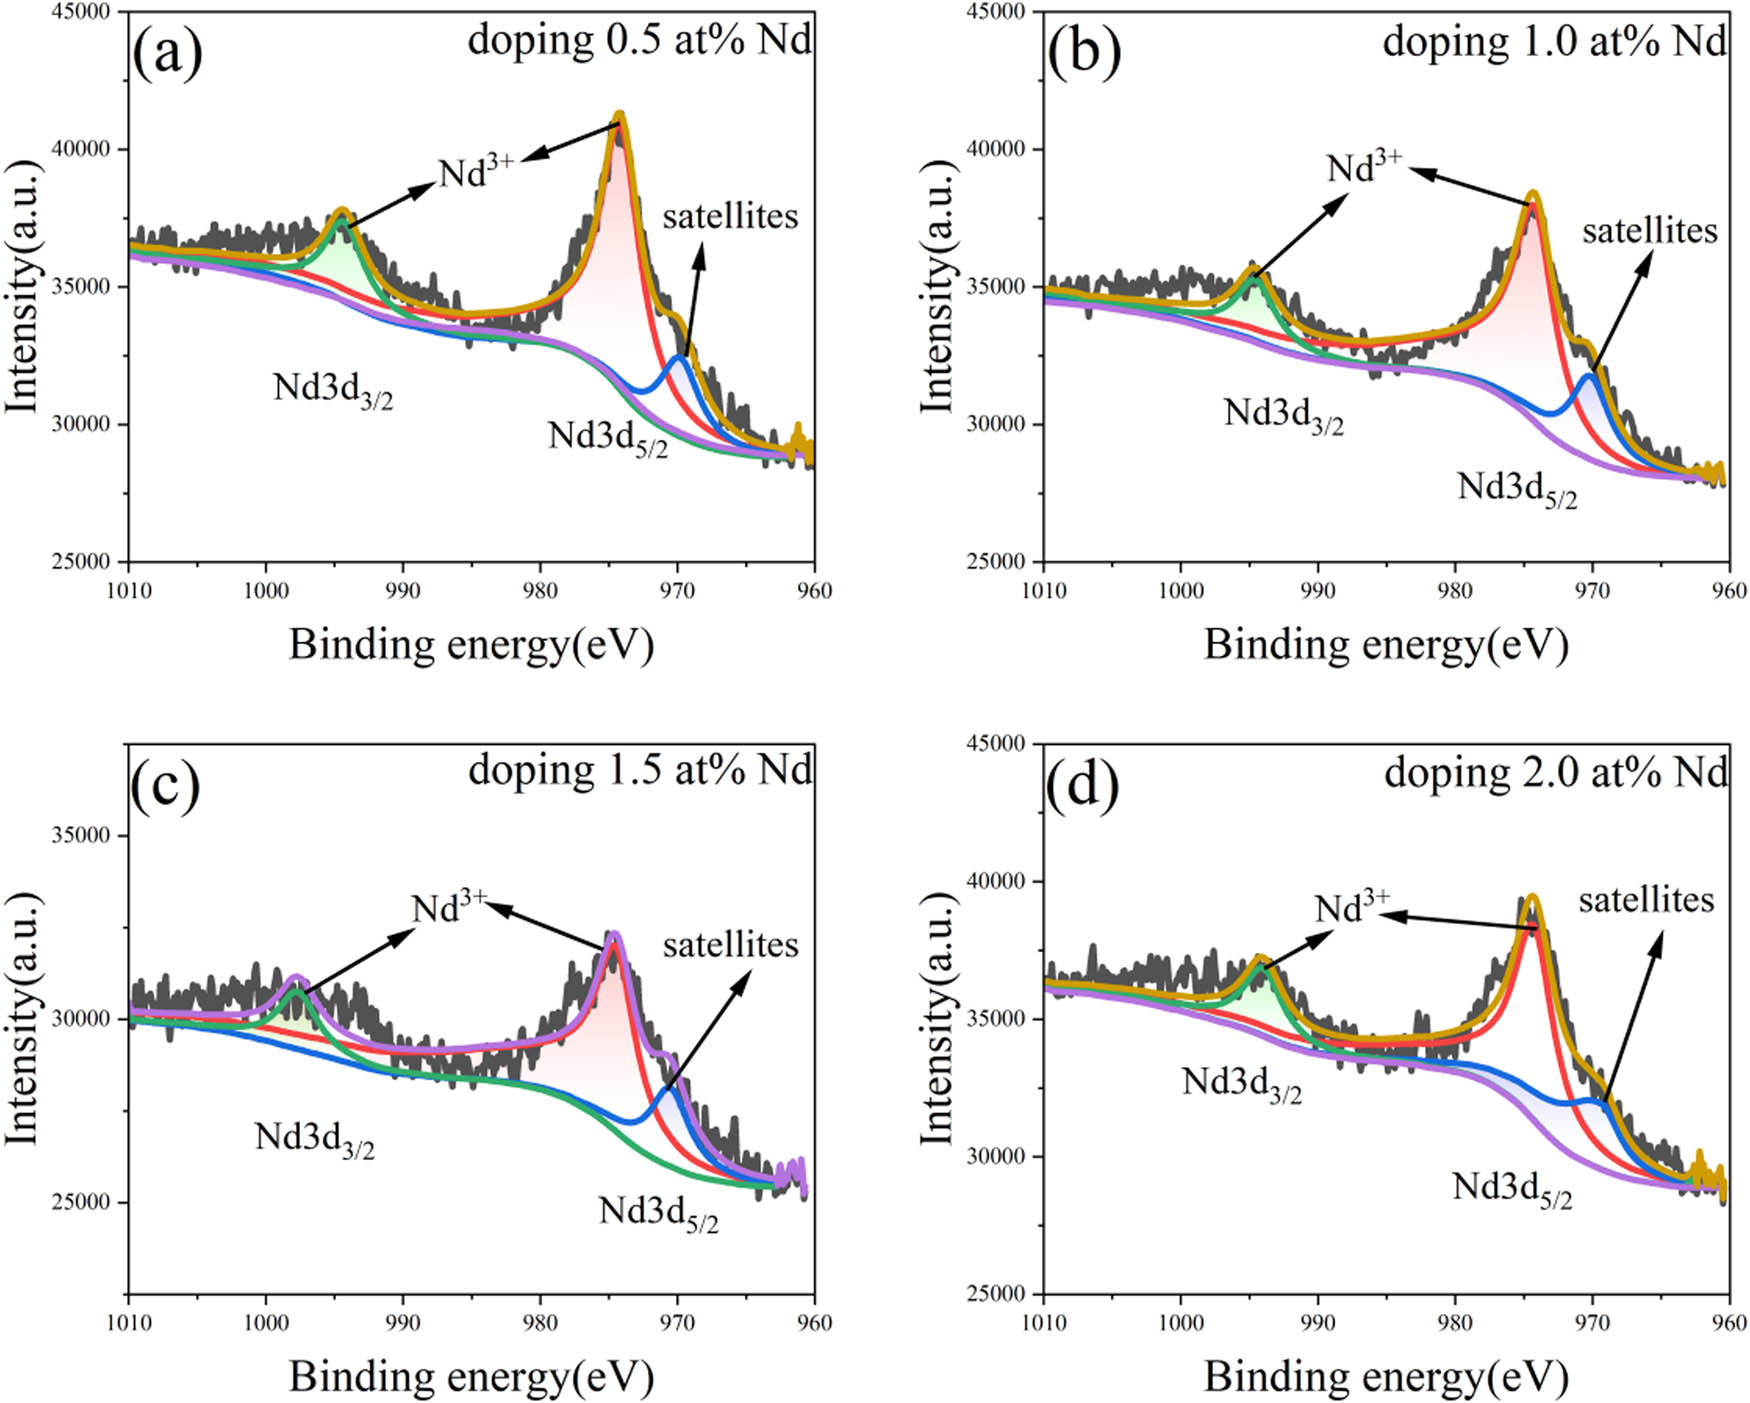
X-ray photoelectron spectra of Nd: (a) doped at 0.5% Nd-TiO2 film, (b) doped at 1.0% Nd-TiO2 film, (c) doped at 1.5% Nd-TiO2 film, and (d) doped at 2.0% Nd-TiO2 film.
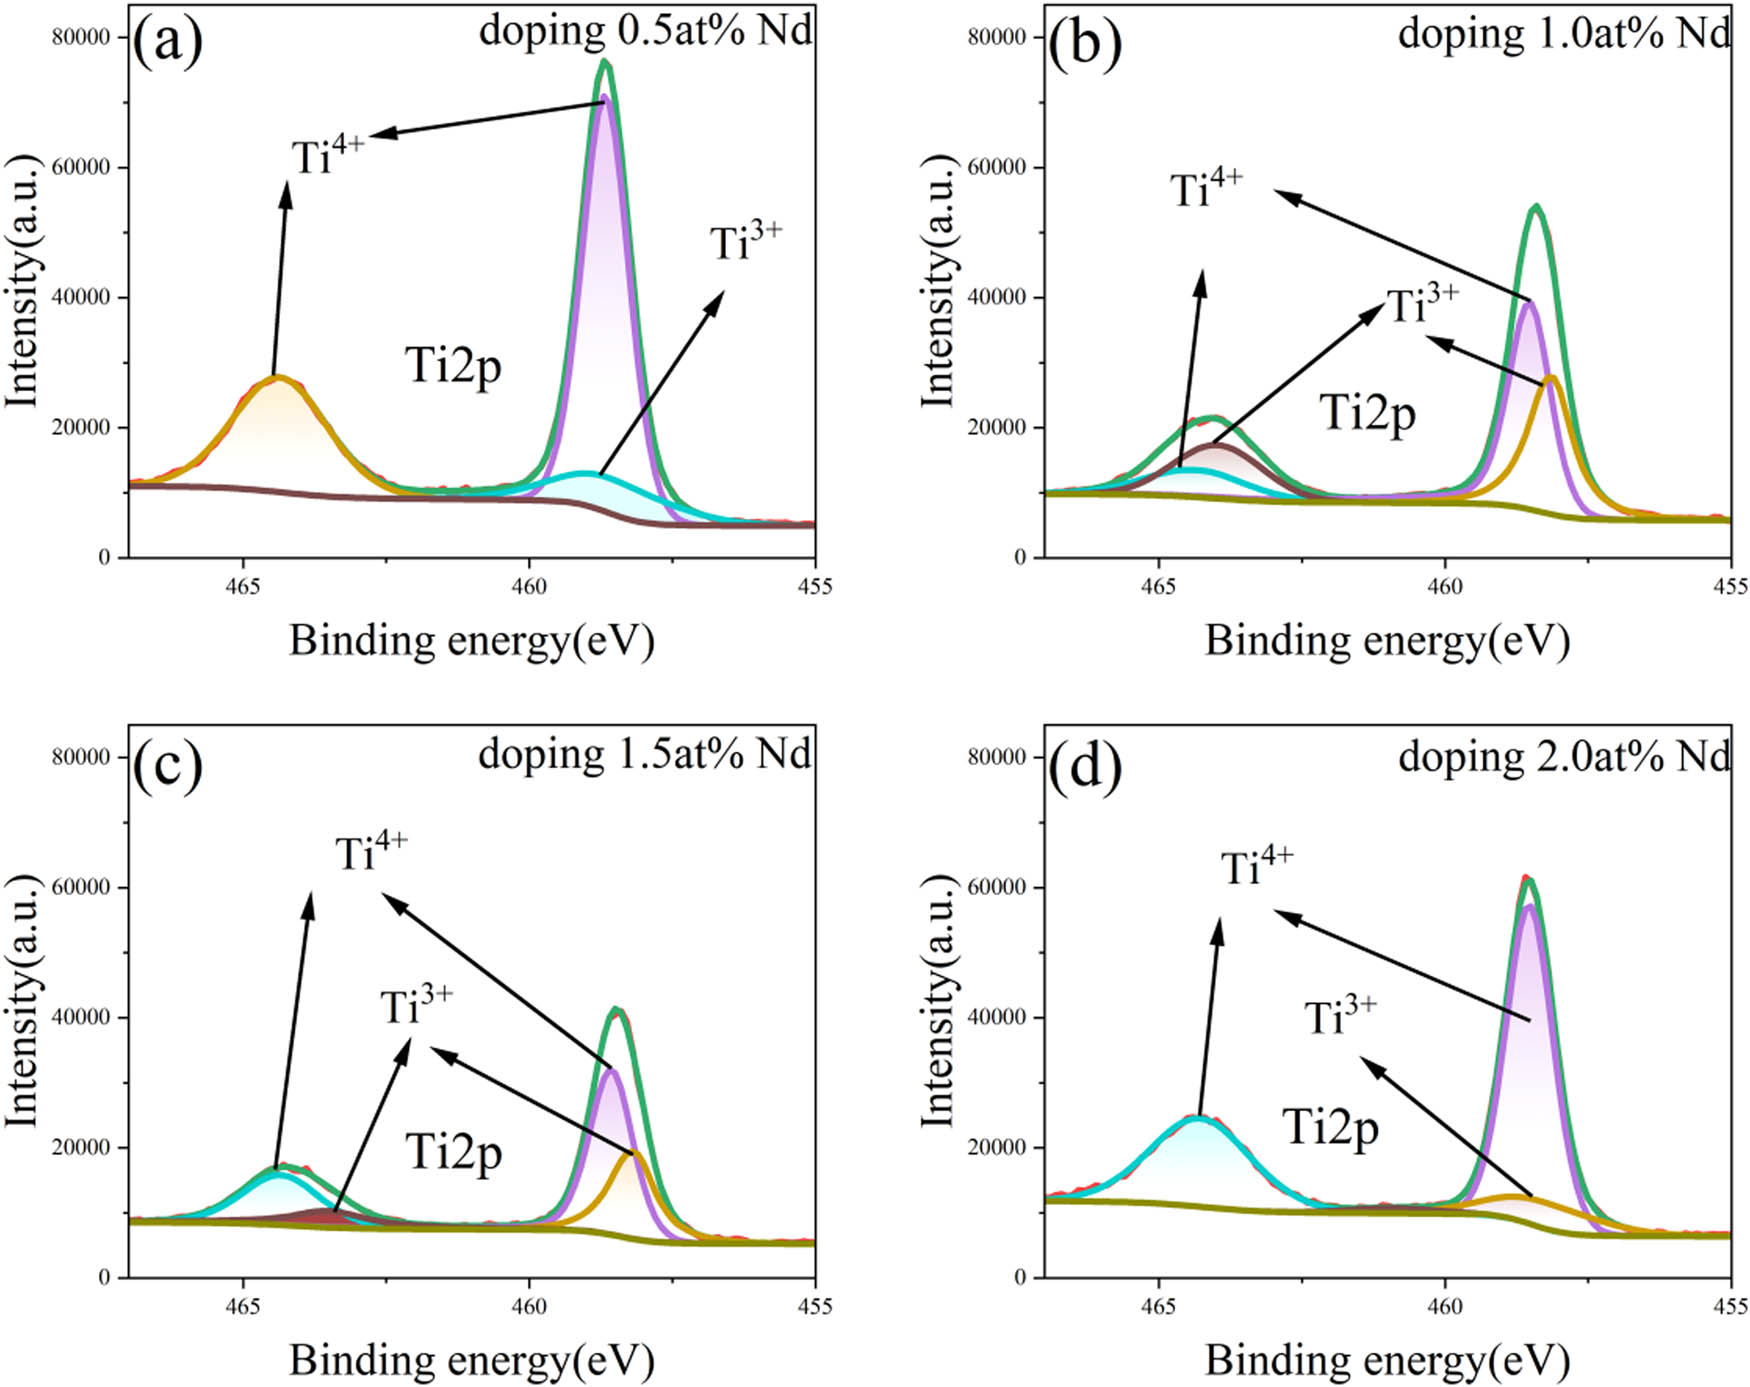
X-ray photoelectron spectra of Ti: (a) doped at 0.5% Nd-TiO2 film, (b) doped at 1.0% Nd-TiO2 film, (c) doped at 1.5% Nd-TiO2 film, and (d) doped at 2.0% Nd-TiO2 film.
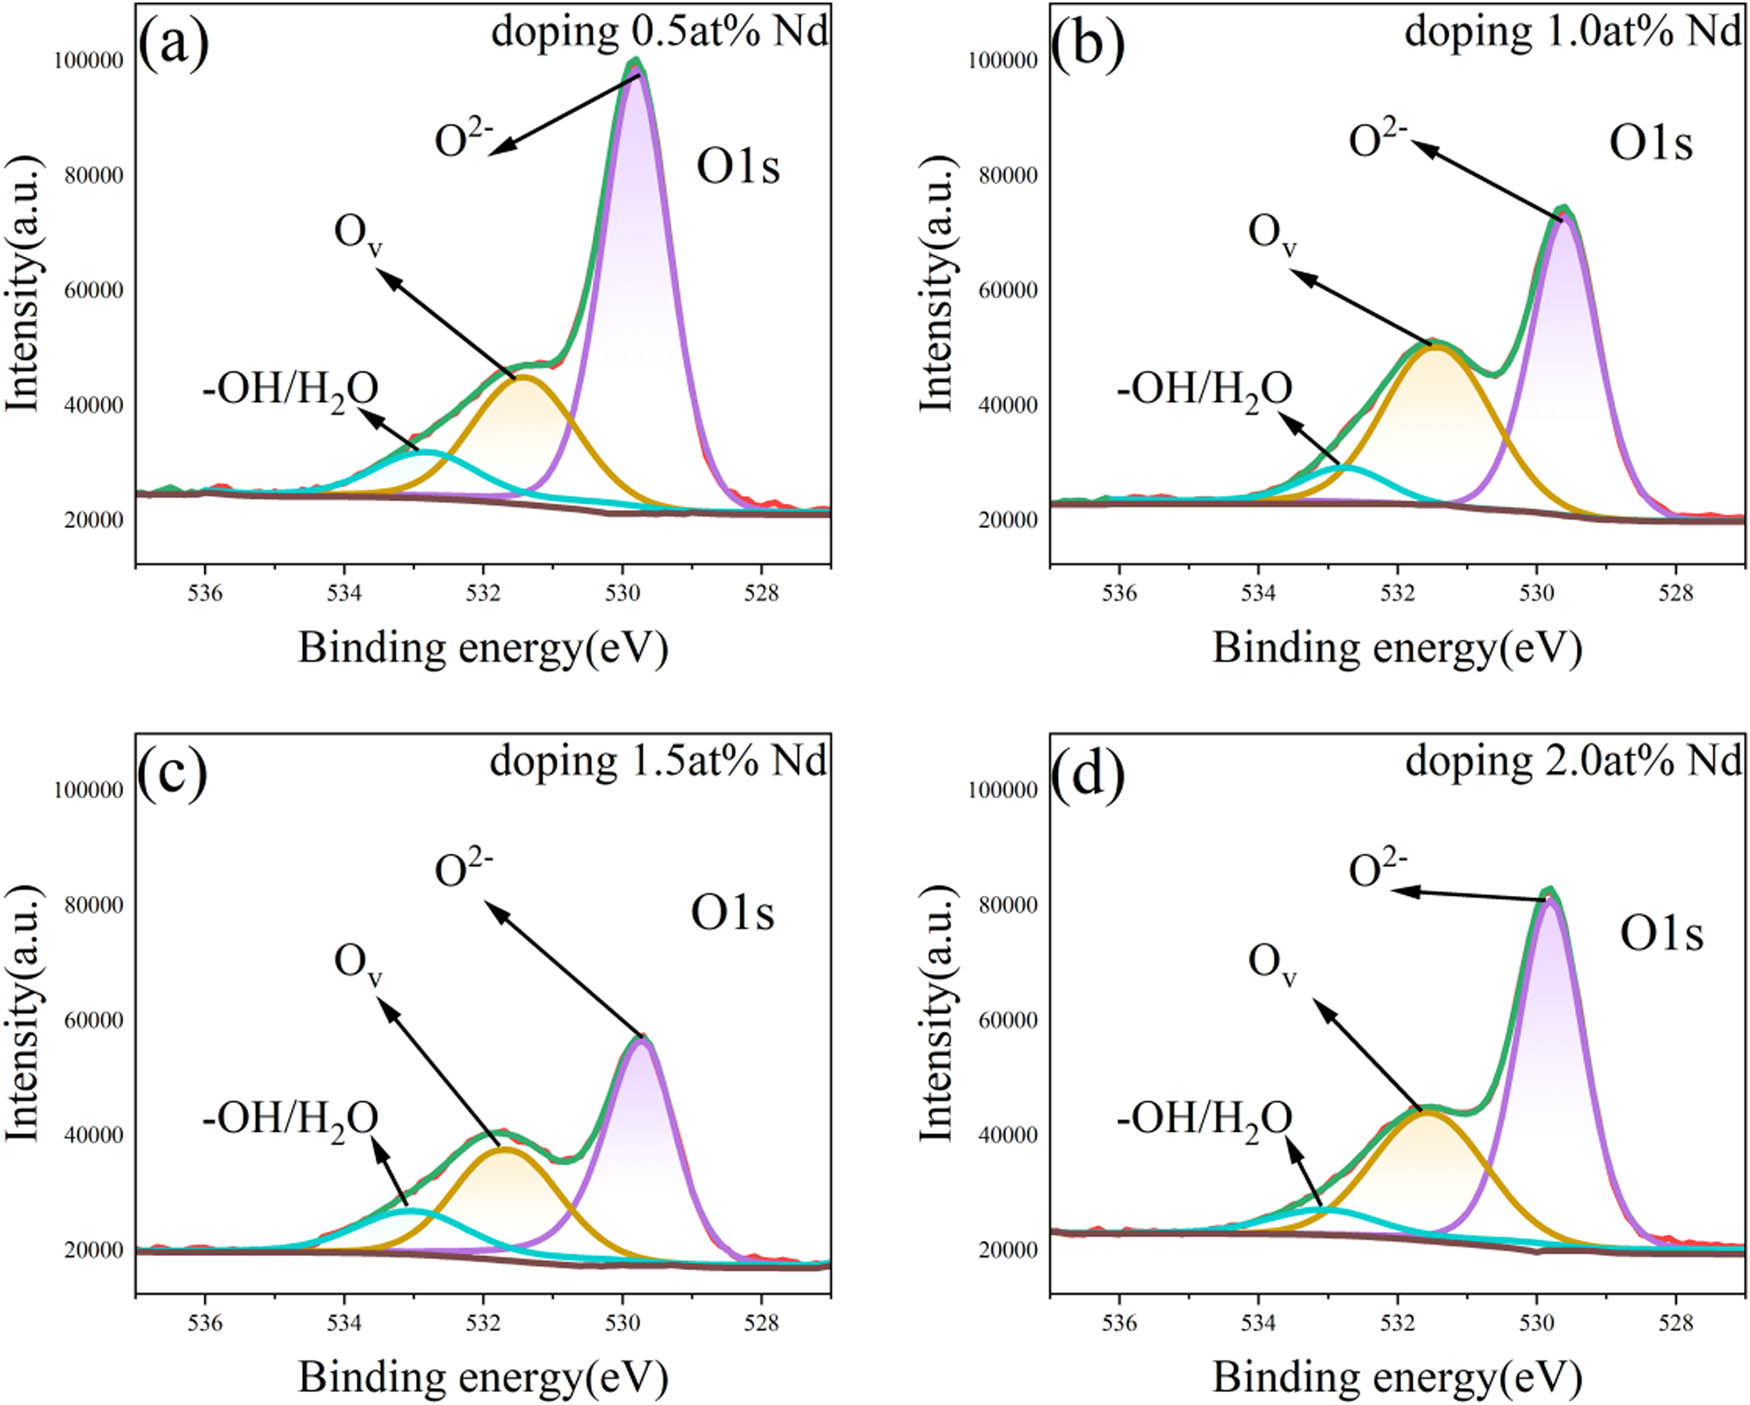
X-ray photoelectron spectra of O: (a) doped at 0.5% Nd-TiO2 film, (b) doped at 1.0% Nd-TiO2 film, (c) doped at 1.5% Nd-TiO2 film, and (d) doped at 2.0% Nd-TiO2 film.
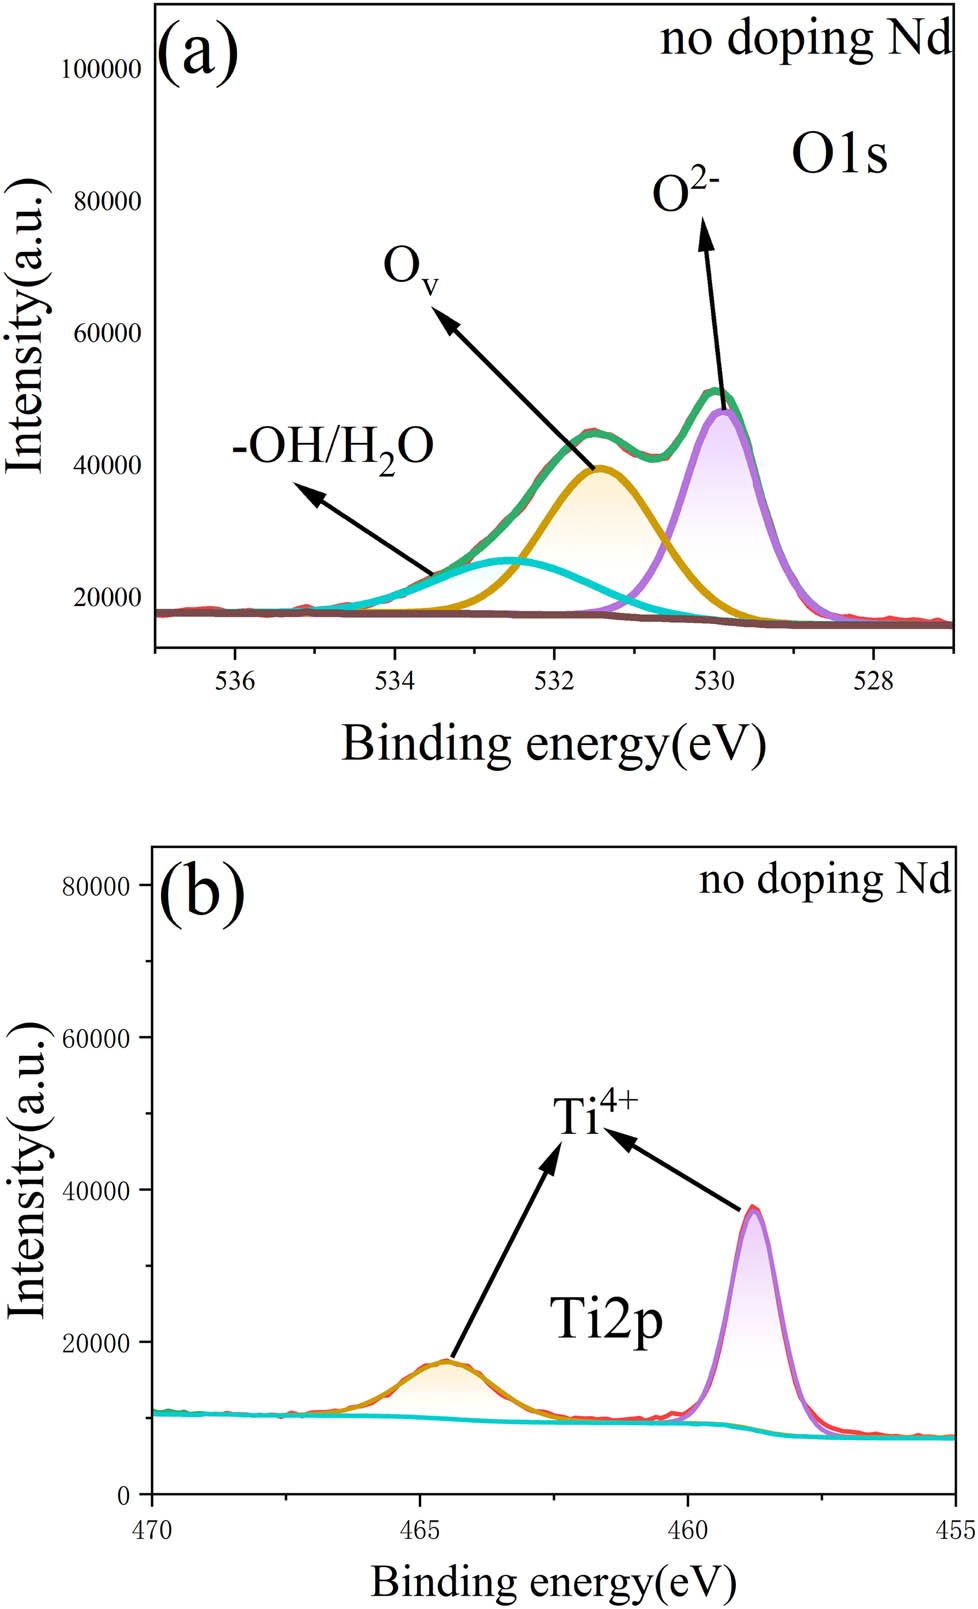
Figure 4 exhibits the XPS spectra of the undoped TIO2 films for the elements O (a) and Ti (b). Figure 5 corresponds to the XPS spectra of Nd; from spectra (a–d), it can be seen that all samples have two diffraction peaks, Nd 3d3/2 and Nd 3d5/2, which are due to the spin–orbit splitting of Nd3+ ions, and the appearance of the diffraction peaks proves that all the samples have been successfully doped with Nd3+ ions. Figures 6 and 7 exhibit the XPS profiles of Ti and O elements for all doped samples.
The spectra corresponding to the Ti element are shown in Figure 6. From the spectra, it can be seen that the two diffraction peaks, Ti 2p1/2 and Ti 2p3/2, appear in the spectra of all samples [49]. The presence of two peaks from the spin-orbit splitting of the Ti ions proves the presence of the Ti ions in all samples. The positions of all of the peaks in the samples are listed in Table 2. A comparative study of the peaks for all of the samples shows no significant shift in the peak positions in the TiO2 film (Figure 4a) and all doped samples (Figure 6b–e) as the doping ratio of Nd ions increases. At the same time, it can be concluded from the shift of the peaks in the plots that the Ti3+-related defects are present in the samples. The charge mechanism regarding the formation of Ti3+, which is related to defects, is shown in equation (3) [50]:
Peak positions of Ti and O chemical states in XPS patterns
| Samples | O2 (eV) | Ov (eV) | −OH/H2O (eV) | Ti4+ (eV) | Ti3+ (eV) | ||
|---|---|---|---|---|---|---|---|
| TiO2 | 529.90 | 531.41 | 532.61 | 458.82 | 464.82 | 458.55 | 464.08 |
| 0.5 at% Nd-TiO2 | 529.79 | 531.42 | 532.71 | 458.76 | 464.66 | 458.35 | 463.95 |
| 1.0 at% Nd-TiO2 | 529.73 | 531.57 | 533.0 | 458.62 | 464.66 | 458.25 | 463.90 |
| 1.5 at% Nd-TiO2 | 529.55 | 531.38 | 532.57 | 458.67 | 464.57 | 458.30 | 463.90 |
| 2.0 at% Nd-TiO2 | 529.80 | 531.50 | 532.84 | 458.55 | 464.62 | 458.24 | 463.94 |
With the different doping ratios, the area under the peaks corresponding to Ti 2p changes correspondingly compared to the spectra of the undoped TiO2 films, and the area of the peaks related to Ti3+ of the Nd-doped samples increases with increasing doping ratios. The highest peak area reached 1.0% Nd doping and then decreased. The results are matched by the variation of Ti4+. In contrast to the trend of Ti3+, the height and area of the peaks decrease when the proportion of Nd doping increases, and they reach a minimum of 1.5%. The height of the peak increases again when the proportion of Nd doping is at 2.0%.
Figure 7 shows the O 1s spectra of the undoped and Nd-doped TiO2 films. The O 1s spectrum consists of three peaks, the first of which corresponds to the bonding of O2− to the saturated Ti4+ ion. The second peak corresponds to the detachment of oxygen atoms (oxygen ions) from the matrix lattice, resulting in the formation of vacancies due to oxygen deficiency. The third peak, located near 533 eV is composed of loosely bound oxygen adsorbed on the surface of the TiO2 attached to hydroxyl or water, and the interstitial oxygen may also interact with these hydrogen/hydroxyl groups [30]. After doping with Nd, the height of the first peak of O 1s is significantly increased when the sample is doped at 0.5% and becomes the highest peak of all samples. As the doping percentage increases, the change in the peak decreases. The trend is consistent with the trend of the peak and the fitted area of Ti4+. The second peak represents the change in Ov in the sample, and its trend is consistent with the peak of Ti3+ and the fitted trend [49,51].
All samples were annealed in a tube furnace under N2 atmosphere and in an oxygen-free environment. Therefore, the O elements that could be detected in the samples could not have been obtained from the reaction of the samples with oxygen in the air. In this oxygen-free high-temperature (700°C) environment, not only are Ti–O bonds formed, but the organic molecules present in the precursor solution that are spin-coated on the silicon wafer substrates cause the electrons on the hydrogen in the organic-OH to undergo electron transfer to the oxygen in the environment. Therefore, an Ov is formed. The presence of the Ovs causes a change in the chemical state of the element Ti, prompting the reduction of Ti4+ to Ti3+. This results in the presence of Ovs and Ti3+ chemical states in the pure TiO2 film samples. From the above analysis, with the addition of Nd ions, the Ov and Ti3+ chemical states also change. This result confirms the interaction between Nd and Ti in the titanium matrix, that the addition of Nd also reduces Ti4+ to Ti3+, and that Nd ions favor the generation of the Ovs in TiO2 films.
In the present study, the influencing factor is mainly the dopant ion, while the changes in the Ov and Ti3+ chemical state can be explained by the electronegativity of the dopant ion and the matrix. This is because the electrons in the energy level orbitals are subject to the strong Coulombic interactions of the nucleus and have a certain binding energy on the one hand, and to the shielding effect of the outer electrons on the other. When the density of the outer core electrons decreases, the shielding effect decreases and the binding energy of the inner core electrons increases. Conversely, the binding energy decreases. According to the electronegativity defined by Pauling, it is known that the electronegativity values of element Nd, element Ti and element O are 1.14, 1.54 and 3.44, respectively [52], and the electrons of the Nd atom are transferred to the titanium atom. This increases the electron density of the titanium atom, increases the shielding effect, and reduces the binding energy of the inner electrons. The electron density of the Nd atom decreases, the shielding effect is weakened, and the binding energy of the inner core electrons increases.
As a portion of Nd ions enter the TiO2 film lattice at high temperatures to substitute Ti ions, at the same time the valence band electrons of Nd atoms are transferred to Ti atoms due to electronegativity. In order to maintain charge neutrality, the increase of Ovs in the system is promoted. Therefore, Nd3+ can produce a change in the Ovs by breaking the local electrostatic equilibrium, replacing the position of the Ti ion, thus maintaining charge neutrality. Therefore, Nd–O–Ti valence bonds are formed in the lattice of the TiO2 films, and a stable lattice structure is produced. The surface morphology of the film changes as the doping ratio increases, and the ratio of Ti3+ to Ov also changes [53]. It is clear from the literature that the increase in Ti3+ and Ov improves the photocatalytic performance of the samples. The peak and ratio of Ti3+ and Ovs reach the maximum at a doping ratio of 1.0%. The performance of photocatalytic degradation in this study corresponds to Ti3+ and OVs. This also corresponds to the trend of (101) for the anatase phase in XRD and Eg (144 cm−1) in the Raman spectra, which is consistent with the above data analysis.
The Ov and Ti3+ defects were quantified using the following relationships (equations (4) and (5)), and the atomic concentrations of these defects are recorded in Table 3:
Area ratio of Ti and O chemical states in XPS patterns
| Samples | O2− (Conc.%) | Ov (Conc.%) | −OH/H2O (Conc.%) | Ti4+ (Conc.%) | Ti3+ (Conc.%) |
|---|---|---|---|---|---|
| TiO2 | 0.381 | 0.439 | 0.180 | 0.547 | 0.453 |
| 0.5 at% Nd-TiO2 | 0.680 | 0.218 | 0.102 | 0.631 | 0.369 |
| 1.0 at% Nd-TiO2 | 0.543 | 0.326 | 0.131 | 0.383 | 0.617 |
| 1.5 at% Nd-TiO2 | 0.472 | 0.387 | 0.141 | 0.404 | 0.596 |
| 2.0 at% Nd-TiO2 | 0.592 | 0.320 | 0.088 | 0.707 | 0.293 |
According to Figure 3 and Tables 2 and 3, it can be concluded that in the undoped sample, there are Ov and Ti3+ related defects in the sample due to the organic residues at high annealing temperatures and the electronegativity difference between Ti and O [54]. In the doped samples, the defects are enhanced due to the electronegativity difference between Ti and Nd. Ultimately, the electron migration in the valence band due to the electronegativity of the doped ions is more favorable to the increased Ov and Ti3+ states in the corresponding samples, and the Ov and Ti3+ states in the samples reduce the probability of recombination of holes with electrons, thus improving the photocatalytic degradation performance of the samples.
3.4 FESEM and AFM analysis
Figures 8 and 9 show the Scanning electron microscope (SEM) and atomic force microscope (AFM) images of the undoped and doped samples, which display the variation of surface morphology and surface roughness of the Nd-doped TiO2 films. Figure 8 demonstrates the uniform porous macrostructure of undoped TiO2 films (a). The surface morphology transforms to granular with protrusions when the doping ratio is gradually increased to at 0.5%. As the doping percentage increases, the morphology of the particles also changes. The particles start to aggregate when the doping is at 1.0% (c), and all particles agglomerate together when the doping is at 2.0% (e). Correspondingly, the morphological changes shown in Figure 5 are consistent with the demonstration by the SEM images.
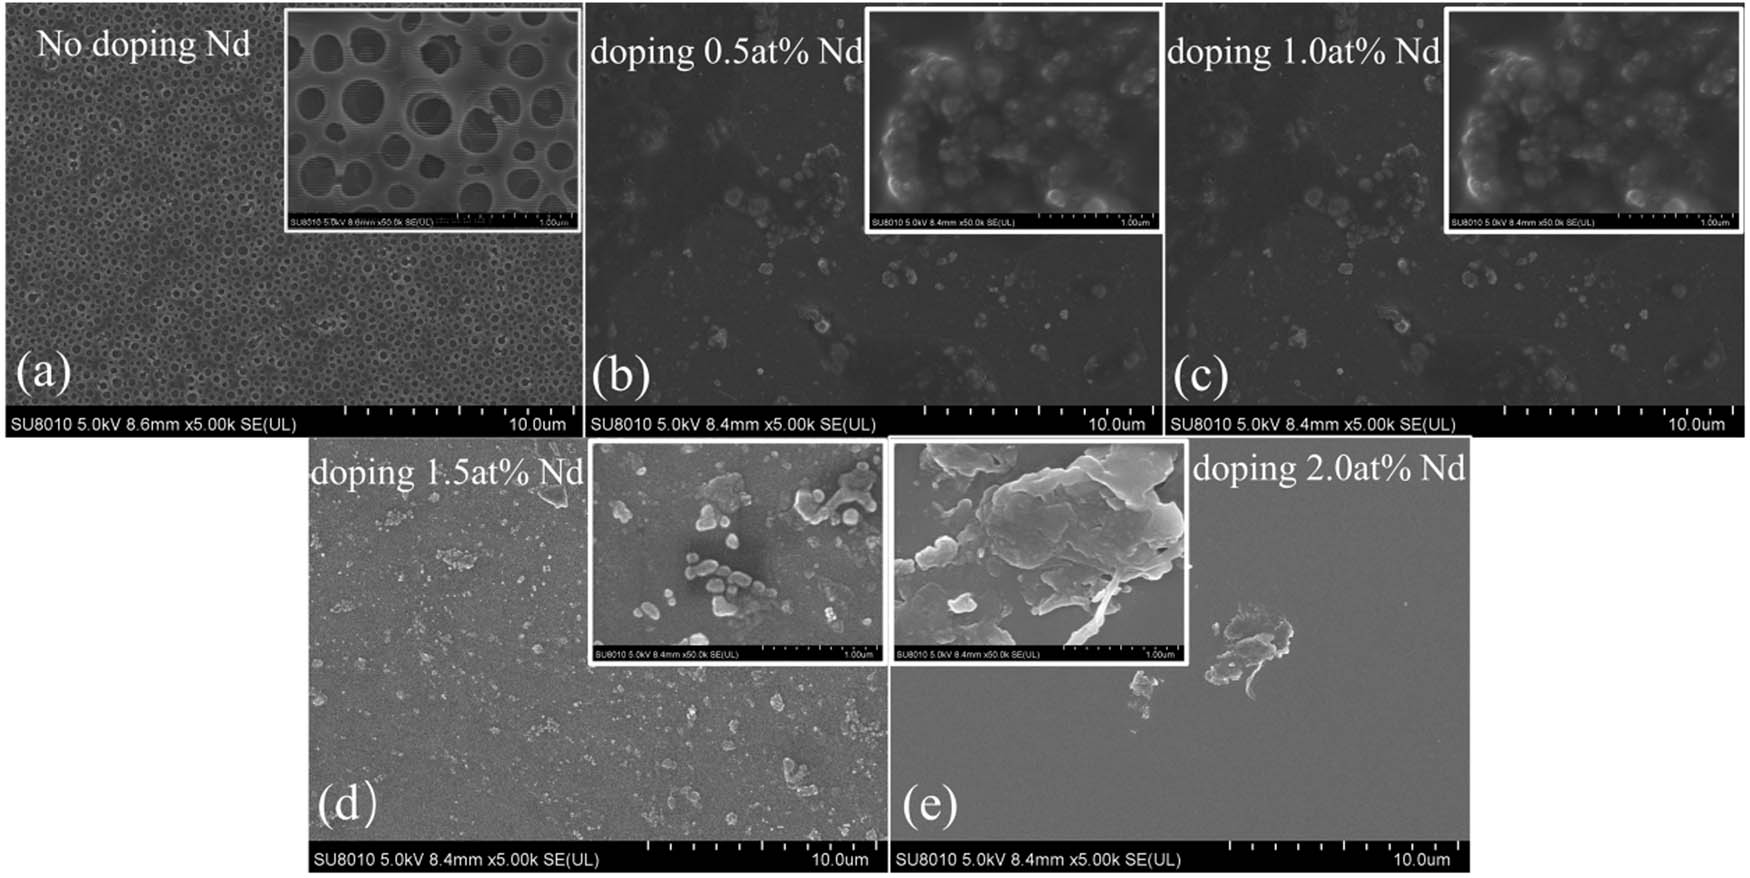
SEM images of (a) undoped TiO2 film, (b) doped 0.5 at% NdTiO2 film, (c) doped 1.0 at% Nd-TiO2 film, (d) doped 1.5 at% Nd-TiO2 film, and (e) doped 2.0 at% Nd-TiO2 film.
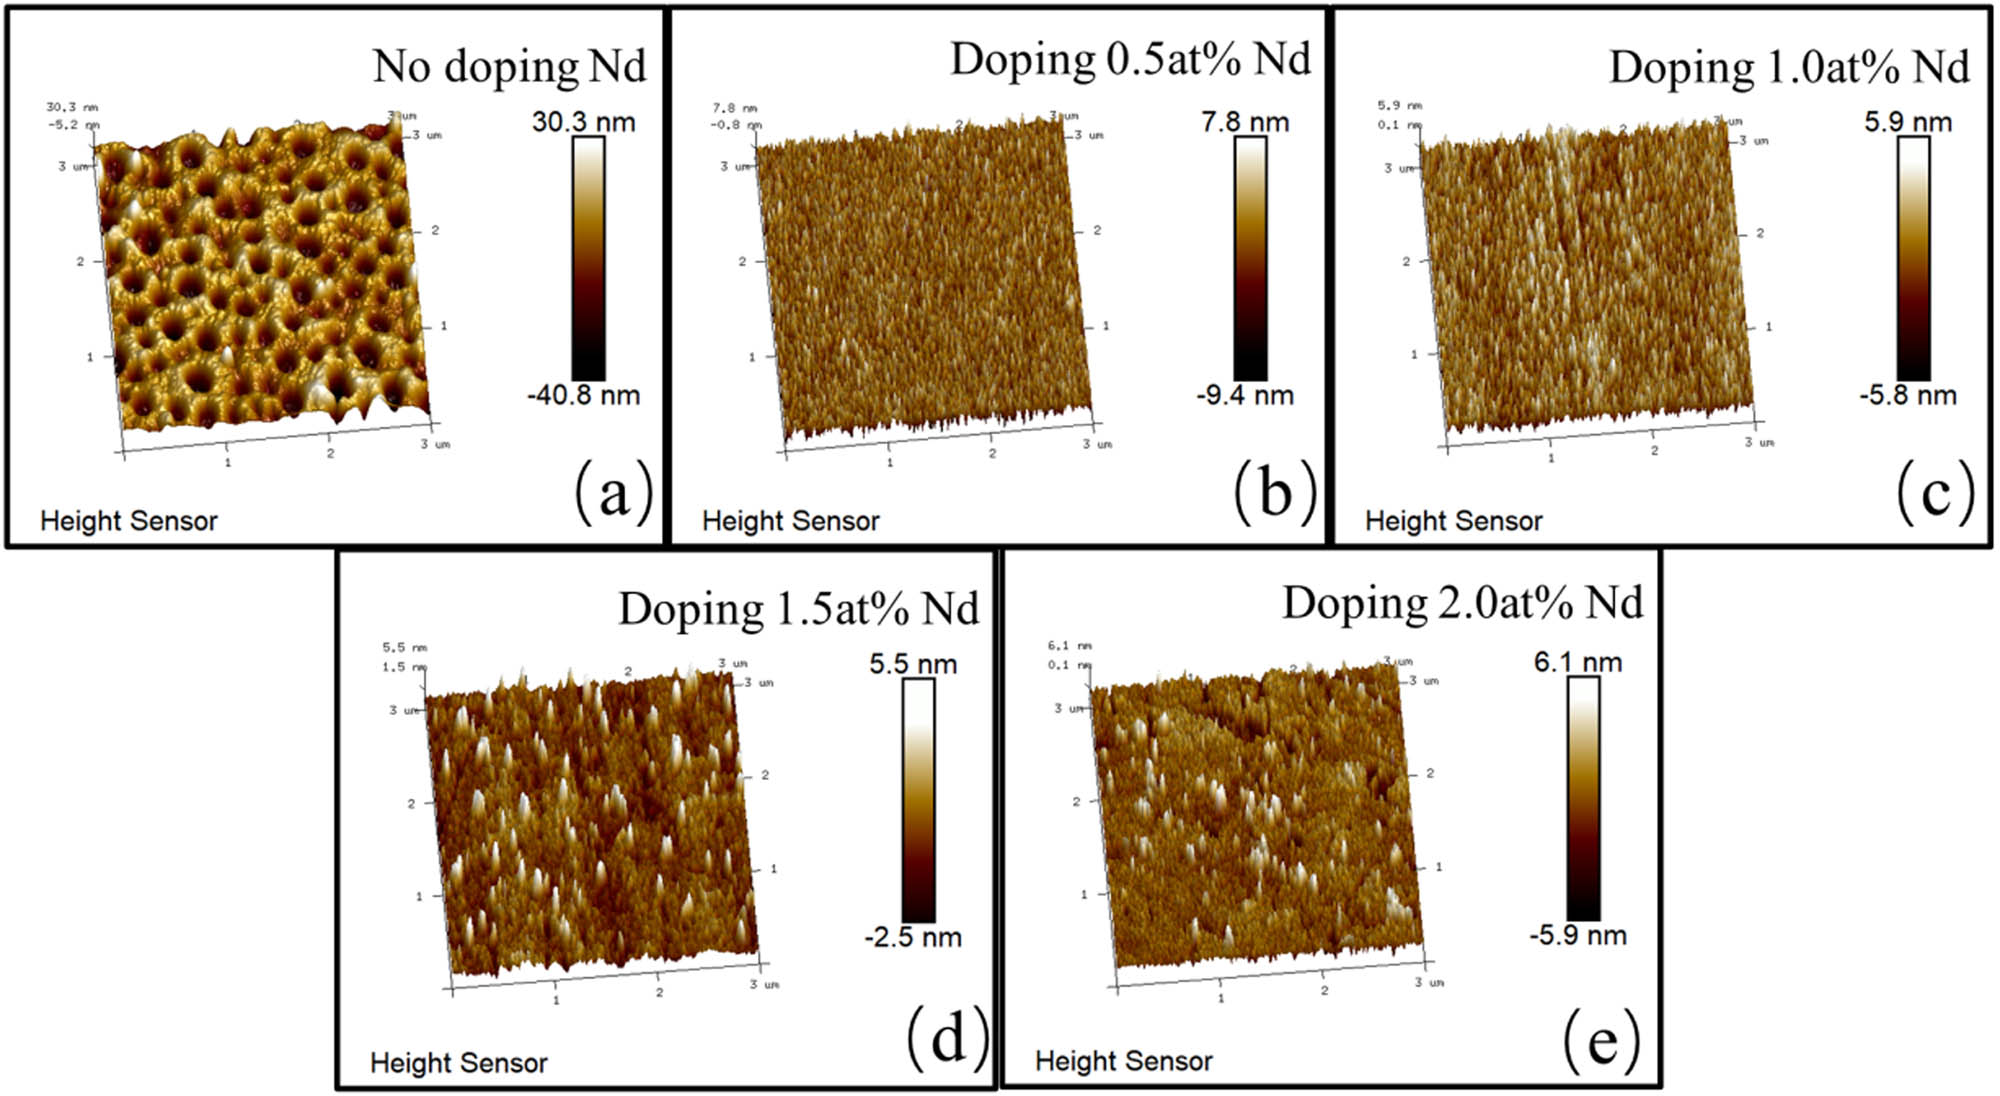
AFM images of (a) undoped TiO2 film, (b) doped 0.5 at% NdTiO2 film, (c) doped 1.0 at% Nd-TiO2 film, (d) doped 1.5 at% Nd-TiO2 film, and (e) doped 2.0 at% Nd-TiO2 film.
Meanwhile, we can estimate the roughness variation of the sample using AFM, as shown in Table 4. According to the literature, there are four main modes of doped films, and some researchers believe that the ions of dopants may exist mainly in TiO2 with four forms: 1) one is aggregated to the surface of TiO2 in the form of crystallite of oxides; 2) one is stepped uniformly to the surface of TiO2 in the form of crystallite of oxides, 3) one is into the lattice gap of TiO2, and 4) substitution of Ti ions in the lattice [37,38,39,40,41,42]. Since the radius of the Nd3+ ion is much larger than that of TiO2, the doping of Nd ions changes the lattice structure of TiO2. As can be seen in Figures 8 and 9, the doping of Nd ions resulted in a large number of lattice defects in the lattice, changing the surface morphology of the films. The presence of the first or second form will mainly occur when Nd3+ is doped. Excess Nd3+ will eventually appear on the surface of the grains or at the grain boundaries. The dopant located at the grain boundaries hinders the interaction between the grains, increasing the dopant ratio, and the crystallinity of the anatase phase decreases instead of the crystallinity of the rutile phase increase. With the continued increase in the proportion of Nd doping (doping from 0.0 to 0.5 at%), neodymium ions do not continue to take the place of titanium ions in the titanium dioxide lattice. As the doping ratio continues to increase (doping from 0.5 to 2.0 at%), all Nd ions that cannot be substituted will accumulate on the surface of the film. This result is consistent with the change in the surface morphology as shown in the SEM images, while the change in the roughness of the sample as shown in e Table 4, and the trend is also consistent with the trend of the crystallite size in Table 1.
Estimated roughness values of the samples from AFM
| Samples | TiO2 | 0.5 at% Nd | 1.0 at% Nd | 1.5 at% Nd | 2.0 at% Nd |
|---|---|---|---|---|---|
| R a (nm) | 7.870 | 1.830 | 1.270 | 0.567 | 0.990 |
| R q (nm) | 10.30 | 2.35 | 1.61 | 0.81 | 1.40 |
| R max (nm) | 73.5 | 28.6 | 17.0 | 13.8 | 19.1 |
3.5 Optical analysis
The UV-Visible transmission and absorption spectra of all the samples are shown in Figure 10(a) and (b), respectively, and the band gaps of the samples at different doping concentrations are shown in Figure 10(c). From the figure, it can be seen that Nd doping affects the intrinsic transmittance and intrinsic absorbance of TiO2. As shown in Figure 10(a), the position of the transmission fringes of the UV-Vis transmission spectra of the undoped and doped TiO2 films are shifted. The transmittance of the films increases with the gradual increase in the amount of doped Nd [33,34,55]. As can be seen from the figure, the transmittance of Nd-doped TiO2 films significantly increased in the 370–550 nm band region compared to the undoped TiO2 film [56,57,58]. It can be seen that the energy levels of TiO2 films with different doping levels are lower than those of pure TiO2 films in the region of 350–450 nm; from (b), it can be seen that the absorption edge of Nd-doped TiO2 films is blue-shifted [45,47]. The known intrinsic absorptivity data can be used to calculate the band gap of the sample by the intercept method. Based on the principle that the bandwidth Eg is inversely proportional to semiconductor absorption threshold λ g as follows:
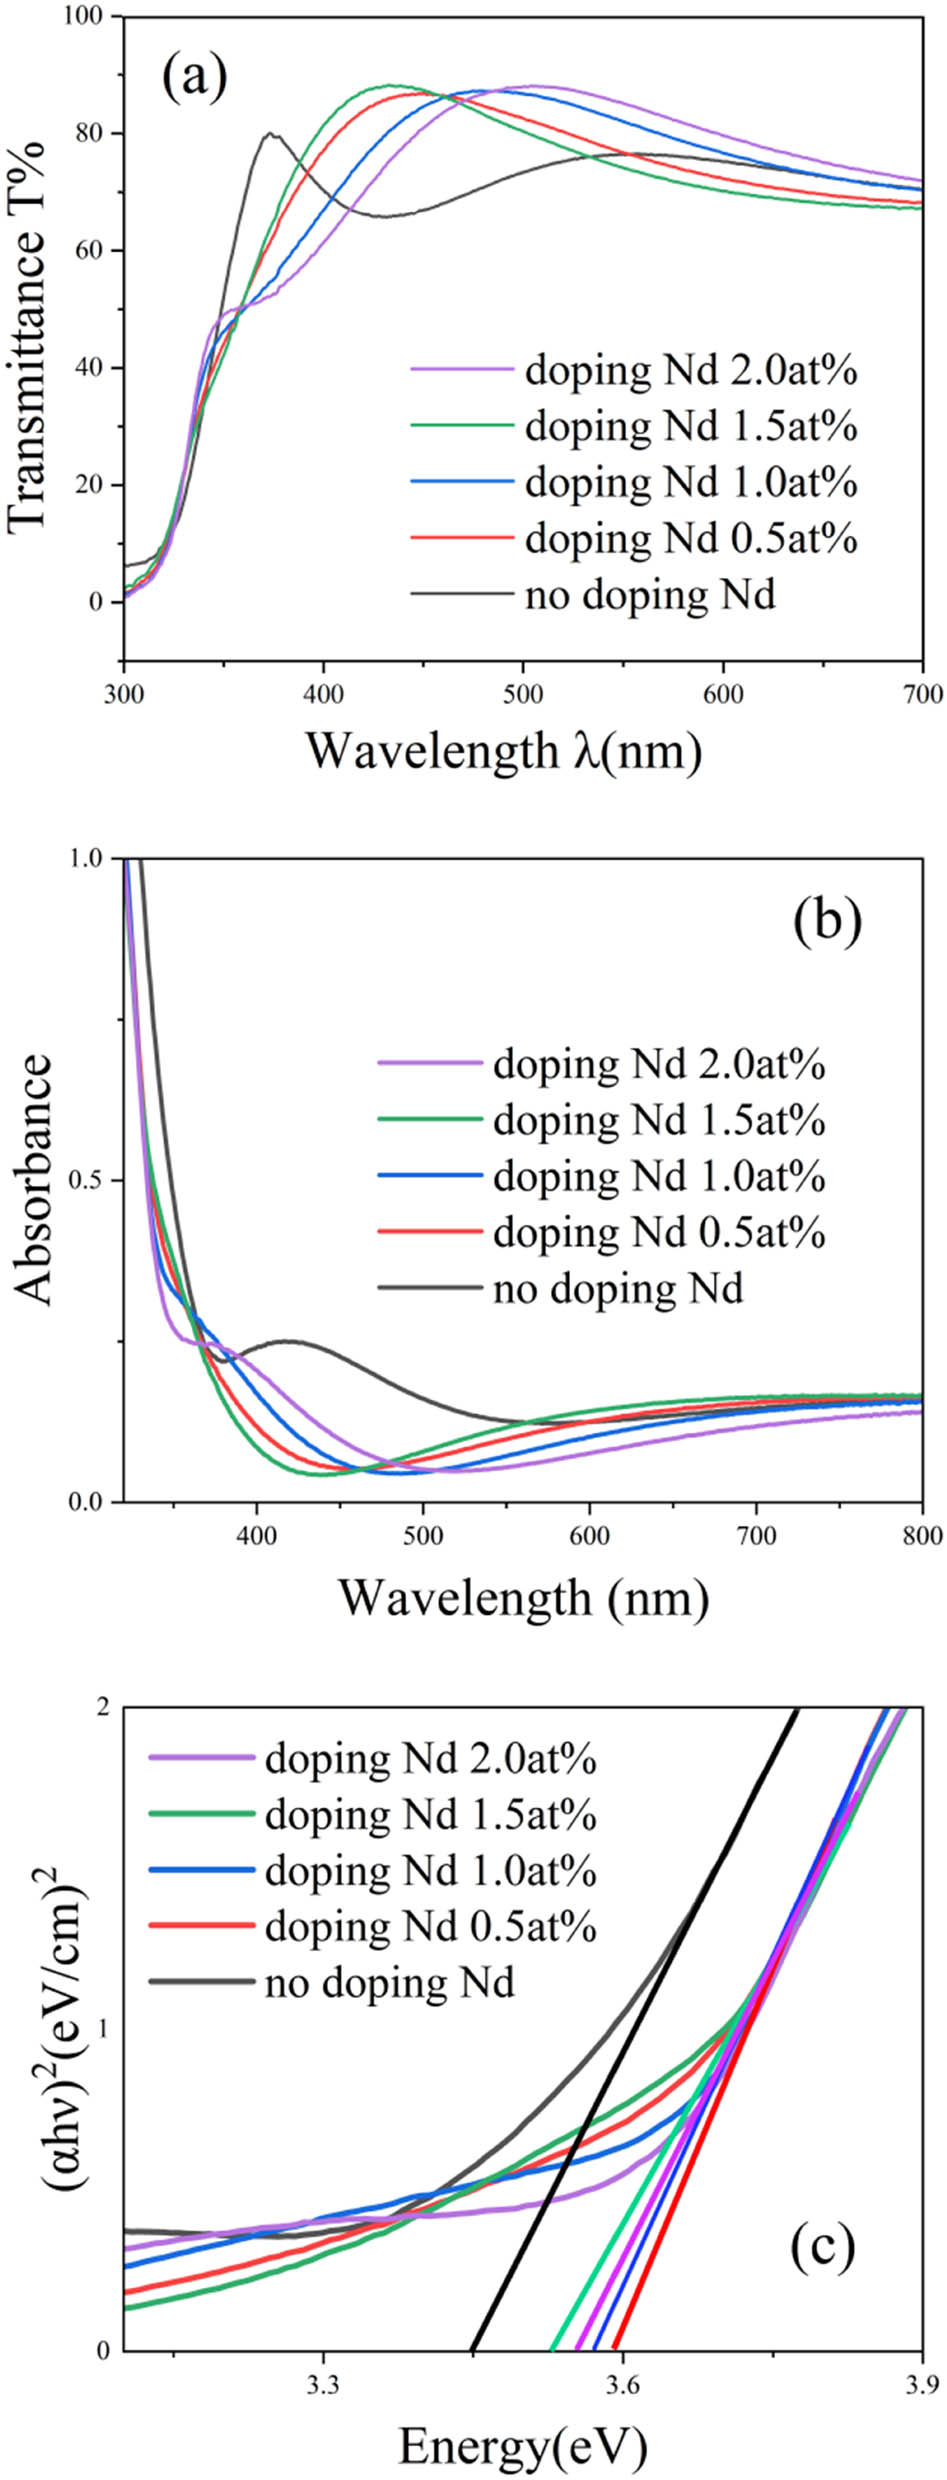
(a) Transmittance spectra of the sample with different doping concentrations. (b) Absorbance spectra of the sample for MB solution and (c) band gap of the sample with different doping concentrations.
Therefore, Eg can be obtained through the acquisition of λ g. From the UV-vis DRS (UV-Vis diffuse reflectance) spectra, the wavelength–absorption curve is differentiated once, and then an intercept is made at the extreme point (the slope is the value of the longitudinal coordinate of the extreme point), and the intersection point of the intercept and the transverse coordinate is λ g. Substituting into the above equation, we can obtain the forbidden bandwidth of the material, i.e., E g. The calculated values of undoped, 0.5, 1.0, 1.5, and 2.0% Nd are 3.444, 3.599, 3.615, 3.573, and 3.553 eV, respectively. Based on the above data, the trend of the bandgap size is as follows: Nd-doped Nd 1.0 at% > 0.5 at% > 1.5 at% > 2.0 at% > TiO2. From the above analysis, it is known that the doping of the Nd element leads to an increase of the band gap. From Table 1, it is known that the doping of Nd ions leads to smaller lattice size, and from the theory of size quantum effect, it is known that the smaller the grain, the wider the band gap, and the larger the absorption band edge displacement. The doping of Nd ions reduces the size of the TiO2 crystallite. The reduction of the grain size makes the energy gap wider, which makes the valence band potential more positive, and the conduction band potential becomes more negative, which, in fact, increases the oxidation–reduction capacity of the photogenerated electrons and holes and improves the activity of the semiconductor photocatalytic degradation of the organic compounds.
Figure 11 shows the curves of the remaining percentage of Nd-doped TiO2 films degrading MB in the visible light as a function of time and examines the rate of MB degradation by the films over a period of 12 h. The Nd-doped TiO2 films also show a tendency to degrade MB faster and then slower. The highest degradation rate of 67.4% was achieved after 12 h when the Nd doping level was 1.0 at% of the sample. When the doping amount was higher than 1.0%, the degradation efficiency decreased instead, which was attributed to the fact that the excessive doping of Nd changed the film structure and reduced the photocatalytic efficiency instead. As can be seen from Figure 11, the results of the photocatalytic activity with doping amounts are 1.0 at% TiO2 > 0.5 at% TiO2 > 2.0 at% TiO2 > 1.5 at% TiO2 > TiO2. The results of photocatalytic performance are in agreement with the results of the data analyses in the above sections.
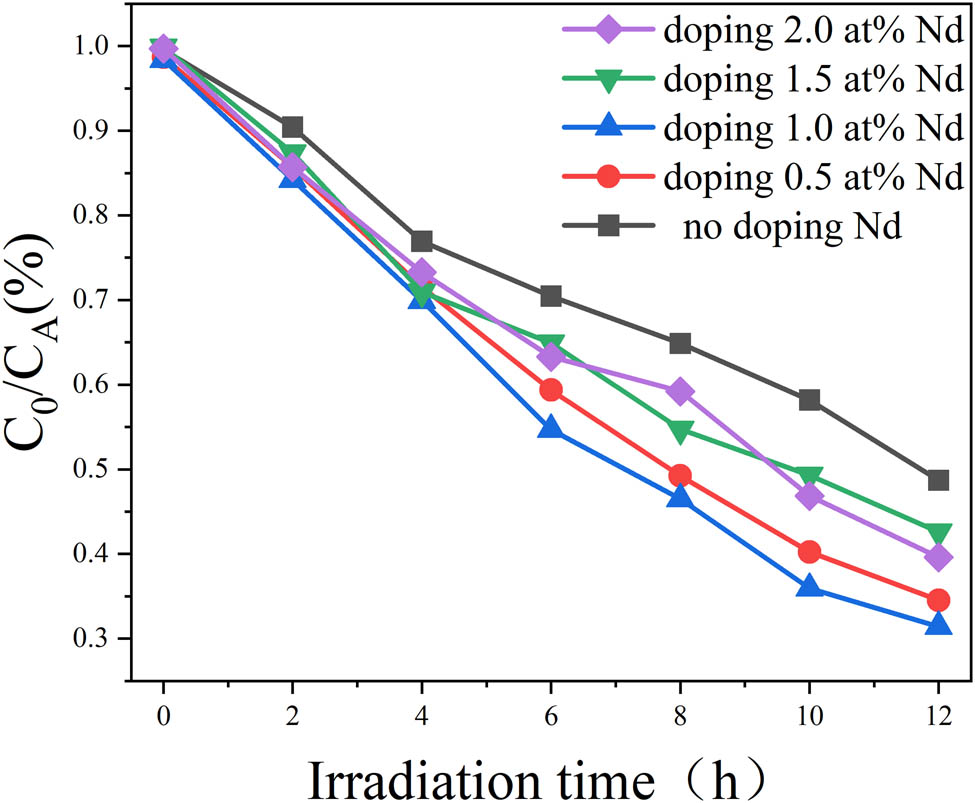
Residual percentage of visible light degradation of MB by Nd-doped TiO2 films.
4 Conclusion
In this work, the sol–gel method was used to prepare Nd3+ ion-doped TiO2 films, which were annealed at 700°C. The crystalline phase of the films was altered by doping of Nd ions, and the crystallinity was reduced. The surface morphology of the films was changed, and a large number of lattice defects were generated, which promoted the generation of a large number of Ti3+ oxidation centers. Meanwhile, the doping of Nd3+ ions reduces the crystallite size. This change in the physical properties of Nd-doped TiO2 films reduced the photogenerated electron–hole recombination rate and redox capacity, which greatly improved the photocatalytic performance of the TiO2 catalysts. The ability of MB degradation under artificial sunlight makes Nd-doped TiO2 film a potential material candidate for improving wastewater treatment.
Acknowledgments
Thin work was supported by the Natural Science Foundation (Grant No: 2021D01C037) and Special Training Program (Grant No: 2020D03001) of Science and Technology Department of Xinjiang, China.
-
Funding information: This work was supported by the Natural Science Foundation (Grant No: 2021D01C037) and the Special Training Program (Grant No: 2020D03001) of the Science and Technology Department of Xinjiang, China.
-
Author contributions: Liu Guodong performed characterization of optical properties (absorption spectra measurement and photocatalytic measurements). Mamatrishat Mamat supervised the whole work and reviewed and revised the manuscript. Fuerkaiti Xiaerding supervised the experimental work and was mainly responsible for XPS data analysis. He also reviewed and revised the manuscript. Wang Zhen supervised the experimental work and was mainly responsible for the Raman spectra measurement and data analysis. He also reviewed and revised the manuscript. All authors have accepted responsibility for the entire content of this manuscript and approved its submission.
-
Conflict of interest: The authors state no conflict of interest.
References
[1] Guo Q, Zhou C, Ma Z, Yang X. Fundamentals of TiO2 photocatalysis: concepts, mechanisms, and challenges. Adv Mater. 2019;31(50):e1901997.10.1002/adma.201901997Search in Google Scholar PubMed
[2] Moretti E, Cattaruzza E, Flora C, Talon A, Casini E, Vomiero A. Photocatalytic performance of Cu-doped titania thin films under UV light irradiation. Appl Surf Sci. 2021;553:149535.10.1016/j.apsusc.2021.149535Search in Google Scholar
[3] Bai S, Zhang N, Gao C, Xiong Y. Defect engineering in photocatalytic materials. Nano Energy. 2018;53:296–336.10.1016/j.nanoen.2018.08.058Search in Google Scholar
[4] Islam MR, Rahman M, Farhad SFU, Podder J. Structural, optical and photocatalysis properties of sol–gel deposited Al-doped ZnO thin films. Surf Interfaces. 2019;16:120–6.10.1016/j.surfin.2019.05.007Search in Google Scholar
[5] Ghos BC, Farhad SFU, Patwary MAM, Majumder S, Hossain MA, Tanvir NI, et al. Influence of the substrate, process conditions, and postannealing temperature on the properties of ZnO thin films grown by the successive ionic layer adsorption and reaction method. ACS Omega. 2021;6(4):2665–74.10.1021/acsomega.0c04837Search in Google Scholar PubMed PubMed Central
[6] Xu H-Q, Yang S, Ma X, Huang J, Jiang H-L. Unveiling charge-separation dynamics in CdS/metal–organic framework composites for enhanced photocatalysis. ACS Catal. 2018;8(12):11615–21.10.1021/acscatal.8b03233Search in Google Scholar
[7] Yang J, Xiao J, Cao H, Guo Z, Rabeah J, Brückner A, et al. The role of ozone and influence of band structure in WO3 photocatalysis and ozone integrated process for pharmaceutical wastewater treatment. J Hazard Mater. 2018;360:481–9.10.1016/j.jhazmat.2018.08.033Search in Google Scholar PubMed
[8] Wang M, Deng K, Lü W, Deng X, Li K, Shi Y, et al. Rational design of multifunctional Fe@γ‐Fe2O3@H‐TiO2 nanocomposites with enhanced magnetic and photoconversion effects for wide applications: from photocatalysis to imaging‐guided photothermal cancer therapy. Adv Mater. 2018;30(13):1706747.10.1002/adma.201706747Search in Google Scholar PubMed
[9] You H, Liu R, Liang C, Yang S, Wang F, Lu X, et al. Gold nanoparticle doped hollow SnO2 supersymmetric nanostructures for improved photocatalysis. J Mater Chem A. 2013;1(12):4097–104.10.1039/c3ta01099fSearch in Google Scholar
[10] Farhad SFU, Cherns D, Smith JA, Fox NA, Fermín DJ. Pulsed laser deposition of single phase n- and p-type Cu2O thin films with low resistivity. Mater & Des. 2020;193:108848.10.1016/j.matdes.2020.108848Search in Google Scholar
[11] Tian Y, Li W, Zhao C, Wang Y, Zhang B, Zhang Q. Fabrication of hollow mesoporous SiO2-BiOCl@PANI@Pd photocatalysts to improve the photocatalytic performance under visible light. Appl Catal B: Environ. 2017;213:136–46.10.1016/j.apcatb.2017.05.026Search in Google Scholar
[12] Fujishima A, Rao TN, Tryk DA. Titanium dioxide photocatalysis. J Photochem Photobiol C: Photochem Rev. 2000;1(1):1–21.10.1016/S1389-5567(00)00002-2Search in Google Scholar
[13] Scandurra R, Scotto d’Abusco A, Longo G. A review of the effect of a nanostructured thin film formed by titanium carbide and titanium oxides clustered around carbon in graphitic form on osseointegration. Nanomaterials (Basel). 2020;10(6):1233.10.3390/nano10061233Search in Google Scholar PubMed PubMed Central
[14] Bhatti AS, Rehan I, Sultana S, Khan N, Qamar Z, Rehan K. Tunability of morphological properties of Nd-doped TiO2thin films. Mater Res Express. 2016;3(11):116410.10.1088/2053-1591/3/11/116410Search in Google Scholar
[15] Kayani ZN, Abid HA, Nazli H, Shahid A, Riaz S, Naseem S. Mg doped TiO2 thin films: Optical, dielectric, photocatalytic, magnetic and antibacterial studies. Mater Sci Eng: B. 2023;297:116674.10.1016/j.mseb.2023.116674Search in Google Scholar
[16] Kayani ZN, Ashfaq M, Riaz S, Naseem S. Impact of Cu on structural, optical, dielectric properties and antibacterial activity of TiO2 thin films. Opt Mater. 2022;132:112809.10.1016/j.optmat.2022.112809Search in Google Scholar
[17] Kayani ZN, Iqbal A, Bashir Z, Riaz S, Naseem S. Effect of K contents on the efficiency of K-doped TiO2 thin films for smart window applications. Inorg Chem Commun. 2023;151:110560.10.1016/j.inoche.2023.110560Search in Google Scholar
[18] Umar M, Mahmood N, Awan SU, Fatima S, Mahmood A, Rizwan S. Rationally designed La and Se co-doped bismuth ferrites with controlled bandgap for visible light photocatalysis. RSC Adv. 2019;9(30):17148–56.10.1039/C9RA03064FSearch in Google Scholar
[19] Ahmad I, Mazhar ME, Usmani MN, Mehmood M, Abbas W, Akhtar N, et al. Auto-combustion synthesis of pure and Er, Dy co-doped ZnO nanomaterials for efficient methyl orange degradation using solar and visible light photocatalysis. Mater Res Express. 2019;6(7):075044.10.1088/2053-1591/ab1562Search in Google Scholar
[20] Bai L, Jiang W, Gao C, Zhong S, Zhao L, Li Z, et al. Facet engineered interface design of NaYF4:Yb,Tm upconversion nanocrystals on BiOCl nanoplates for enhanced near-infrared photocatalysis. Nanoscale. 2016;8(45):19014–24.10.1039/C6NR05720ASearch in Google Scholar PubMed
[21] Du W, Zhu Z, Zhang X, Wang D, Liu D, Qian X, et al. RE/ZrO2 (RE=Sm, Eu) composite oxide nano-materials: Synthesis and applications in photocatalysis. Mater Res Bull. 2013;48(10):3735–42.10.1016/j.materresbull.2013.05.114Search in Google Scholar
[22] Li X, Zhai Y, Ma P, Zhao R. Preparation and Photocatalysis of Nano-Zn/Ce Composite Oxides. Aust J Chem. 2014;67(4):657–62.10.1071/CH13448Search in Google Scholar
[23] Jing L, Xu Y, Xie M, Wu C, Zhao H, Wang J, et al. LnVO4 (Ln=La, Ce, Pr, Nd, etc.)-based photocatalysts: Synthesis, design, and applications. J Mater Sci Technol. 2024;177:10–43.10.1016/j.jmst.2023.07.064Search in Google Scholar
[24] Rajagopal S, Thangudu S, Hwang KC. Synthesis of high yield, crystalline and thermally stable rare earth (Sm, Eu, Gd) oxide square nanoplates for near-infrared light activatable photocatalysis. Catal Sci Technol. 2023;13(12):3701–8.10.1039/D3CY00184ASearch in Google Scholar
[25] Cheng M, Xiao C, Xie Y. Photocatalytic nitrogen fixation: the role of defects in photocatalysts. J Mater Chem A. 2019;7(34):19616–33.10.1039/C9TA06435DSearch in Google Scholar
[26] Zhu X, Song H, Feng W, Wen G, Li H, Zhou J. Photocurrent response and photocatalytic activity of Nd-doped TiO2 thin films prepared by sol-gel method. J Adv Oxid Technol. 2017;20(1):20161090.10.1515/jaots-2016-0190Search in Google Scholar
[27] Yao LF, Tang X, Yan XP, Li L. Preparation and photocatalytic activity of Nd3+ and CTAB Co-doped nanometer TiO2 thin films. Key Eng Mater. 2013;562–565:858–63.10.4028/www.scientific.net/KEM.562-565.858Search in Google Scholar
[28] Capan R, Ray AK. Dielectric measurements on sol–gel derived titania films. J Electron Mater. 2017;46(11):6646–52.10.1007/s11664-017-5670-ySearch in Google Scholar
[29] Nair RV, Gummaluri VS, Matham MV, Vijayan C. A review on optical bandgap engineering in TiO2 nanostructures via doping and intrinsic vacancy modulation towards visible light applications. J Phys D: Appl Phys. 2022;55(31):313003.10.1088/1361-6463/ac6135Search in Google Scholar
[30] Kompa A, Murari MS, Kekuda D, Mahesha MG. Low concentration rare earth doping (Nd) and its effect on structural properties of titania thin films. Ceram Int. 2021;47(10):13480–7.10.1016/j.ceramint.2021.01.206Search in Google Scholar
[31] Doyle S, Ryan L, McCarthy MM, Modreanu M, Schmidt M, Laffir F, et al. Combinatorial ALD for the growth of ZnO/TiO2 nanolaminates and mixed ZnO/TiO2nanostructured films. Mater Adv. 2022;3(6):2896–907.10.1039/D1MA00726BSearch in Google Scholar
[32] Al-Maliki FJ, Al-Lamey NH. Synthesis of Tb-doped titanium dioxide nanostructures by sol–gel method for environmental photocatalysis applications. J Sol-Gel Sci Technol. 2016;81(1):276–83.10.1007/s10971-016-4190-1Search in Google Scholar
[33] Bokare A, Pai M, Athawale AA. Surface modified Nd doped TiO2 nanoparticles as photocatalysts in UV and solar light irradiation. Sol Energy. 2013;91:111–9.10.1016/j.solener.2013.02.005Search in Google Scholar
[34] Du J, Wu Q, Zhong S, Gu X, Liu J, Guo H, et al. Effect of hydroxyl groups on hydrophilic and photocatalytic activities of rare earth doped titanium dioxide thin films. J Rare Earths. 2015;33(2):148–53.10.1016/S1002-0721(14)60395-1Search in Google Scholar
[35] Gomes GHM, de Jesus MAML, Ferlauto AS, Viana MM, Mohallem NDS. Characterization and application of niobium-doped titanium dioxide thin films prepared by sol–gel process. Appl Phys A. 2021;127(8):641.10.1007/s00339-021-04781-6Search in Google Scholar
[36] Hojamberdiev M, Vargas R, Bhati VS, Torres D, Kadirova ZC, Kumar M. Unraveling the photoelectrochemical behavior of Ni-modified ZnO and TiO2 thin films fabricated by RF magnetron sputtering. J Electroanal Chem. 2021;882:115009.10.1016/j.jelechem.2021.115009Search in Google Scholar
[37] Khan MI, Mehmood B, Mustafa GM, Humaiyoun K, Alwadai N, Almuqrin AH, et al. Effect of silver (Ag) ions irradiation on the structural, optical and photovoltaic properties of Mn doped TiO2 thin films based dye sensitized solar cells. Ceram Int. 2021;47(11):15801–6.10.1016/j.ceramint.2021.02.152Search in Google Scholar
[38] Mazur M, Morgiel J, Wojcieszak D, Kaczmarek D, Kalisz M. Effect of Nd doping on structure and improvement of the properties of TiO2 thin films. Surf Coat Technol. 2015;270:57–65.10.1016/j.surfcoat.2015.03.019Search in Google Scholar
[39] Mustafa A, Bououdina M, Al-Najar B, Souier T, Bensouici F, Belache B. Physical and photocatalytic properties of Nd codoped (Ag, Cu)TiO2 thin films. Surf Eng. 2020;37(6):784–94.10.1080/02670844.2020.1813517Search in Google Scholar
[40] Ali A, Yassitepe E, Ruzybayev I, Ismat Shah S, Bhatti AS. Improvement of (004) texturing by slow growth of Nd doped TiO2 films. J Appl Phys. 2012;112(11):113505.10.1063/1.4767361Search in Google Scholar
[41] Ma HL, Yang JY, Dai Y, Zhang YB, Lu B, Ma GH. Raman study of phase transformation of TiO2 rutile single crystal irradiated by infrared femtosecond laser. Appl Surf Sci. 2007;253(18):7497–500.10.1016/j.apsusc.2007.03.047Search in Google Scholar
[42] Sahoo S, Arora AK, Sridharan V. Raman line shapes of optical phonons of different symmetries in anatase TiO2 nanocrystals. J Phys Chem C. 2009;113(39):16927–33.10.1021/jp9046193Search in Google Scholar
[43] Zhang J, Li M, Feng Z, Chen J, Li C. UV Raman spectroscopic study on TiO2. I. Phase transformation at the surface and in the bulk. J Phys Chem B. 2006;110(2):927–35.10.1021/jp0552473Search in Google Scholar PubMed
[44] Choi HC, Jung YM, Kim SB. Size effects in the Raman spectra of TiO2 nanoparticles. Vib Spectrosc. 2005;37(1):33–8.10.1016/j.vibspec.2004.05.006Search in Google Scholar
[45] Dascalu I, Calderon-Moreno JM, Osiceanu P, Bratan V, Hornoiu C, Somacescu S. Amorphous ZnO modified anatase TiO2 thin films templated by tripropylamine and their electrical properties. Thin Solid Films. 2021;729:138697.10.1016/j.tsf.2021.138697Search in Google Scholar
[46] Guan S, Watabe T, Hao L, Yoshida H, Cheng Y, Zhou K, et al. Enhanced photocatalytic activity of potassium-doped titania photocatalyst films with nanosheet structure. Mater Lett. 2019;242:174–8.10.1016/j.matlet.2019.01.136Search in Google Scholar
[47] He F, Meng A, Cheng B, Ho W, Yu J. Enhanced photocatalytic H2-production activity of WO3/TiO2 step-scheme heterojunction by graphene modification. Chin J Catal. 2020;41(1):9–20.10.1016/S1872-2067(19)63382-6Search in Google Scholar
[48] Kompa A, Mahesha MG, Kekuda D. Spectroscopic investigation of defects in spin coated titania based thin films for photocatalytic applications. J Solid State Chem. 2021;303:122488.10.1016/j.jssc.2021.122488Search in Google Scholar
[49] Babadi AS, Tang-Kong R, McIntyre PC. Link between gas phase reaction chemistry and the electronic conductivity of atomic layer deposited titanium oxide thin films. J Phys Chem Lett. 2021;12(14):3625–32.10.1021/acs.jpclett.1c00115Search in Google Scholar PubMed
[50] Bharti B, Kumar S, Lee HN, Kumar R. Formation of oxygen vacancies and Ti3+ state in TiO2 thin film and enhanced optical properties by air plasma treatment. Sci Rep. 2016;6:32355.10.1038/srep32355Search in Google Scholar PubMed PubMed Central
[51] Mohajernia S, Andryskova P, Zoppellaro G, Hejazi S, Kment S, Zboril R, et al. Influence of Ti3+ defect-type on heterogeneous photocatalytic H2 evolution activity of TiO2. J Mater Chem A. 2020;8(3):1432–42.10.1039/C9TA10855FSearch in Google Scholar
[52] Sessa F, Rahm M. Electronegativity equilibration. J Phys Chem A. 2022;126(32):5472–82.10.1021/acs.jpca.2c03814Search in Google Scholar PubMed PubMed Central
[53] Li J, Jia S, Sui G, Du L, Li B. Preparation of hollow Nd/TiO2 sub-microspheres with enhanced visible-light photocatalytic activity. RSC Adv. 2017;7(55):34857–65.10.1039/C7RA05228FSearch in Google Scholar
[54] Wang S, Ao X, Bai L. Correction: Preparation and photocatalytic application of a S, Nd double doped nano-TiO2 photocatalyst. RSC Adv. 2018;8(66):38002.10.1039/C8RA90087FSearch in Google Scholar PubMed PubMed Central
[55] Labreche F, Berbadj A, Brihi N, Karima R, Jamoussi B. Green photoluminescence, structural and optical properties of Nd-TiO2 thin films. Optik. 2018;172:63–71.10.1016/j.ijleo.2018.06.131Search in Google Scholar
[56] Liang J, Wang J, Song K, Wang X, Yu K, Liang C. Enhanced photocatalytic activities of Nd-doped TiO2 under visible light using a facile sol-gel method. J Rare Earths. 2020;38(2):148–56.10.1016/j.jre.2019.07.008Search in Google Scholar
[57] Maimaiti M, Zhao B, Mamat M, Tuersun Y, Mijiti A, Wang Q, et al. The structural, optical and photocatalytic properties of the TiO2 thin films. Mater Res Express. 2019;6(8):086408.10.1088/2053-1591/ab1853Search in Google Scholar
[58] Reszczyńska J, Grzyb T, Sobczak JW, Lisowski W, Gazda M, Ohtani B, et al. Visible light activity of rare earth metal doped (Er3+, Yb3+ or Er3+/Yb3+) titania photocatalysts. Appl Catal B: Environ. 2015;163:40–9.10.1016/j.apcatb.2014.07.010Search in Google Scholar
© 2024 the author(s), published by De Gruyter
This work is licensed under the Creative Commons Attribution 4.0 International License.
Articles in the same Issue
- Research Articles
- Tension buckling and postbuckling of nanocomposite laminated plates with in-plane negative Poisson’s ratio
- Polyvinylpyrrolidone-stabilised gold nanoparticle coatings inhibit blood protein adsorption
- Energy and mass transmission through hybrid nanofluid flow passing over a spinning sphere with magnetic effect and heat source/sink
- Surface treatment with nano-silica and magnesium potassium phosphate cement co-action for enhancing recycled aggregate concrete
- Numerical investigation of thermal radiation with entropy generation effects in hybrid nanofluid flow over a shrinking/stretching sheet
- Enhancing the performance of thermal energy storage by adding nano-particles with paraffin phase change materials
- Using nano-CaCO3 and ceramic tile waste to design low-carbon ultra high performance concrete
- Numerical analysis of thermophoretic particle deposition in a magneto-Marangoni convective dusty tangent hyperbolic nanofluid flow – Thermal and magnetic features
- Dual numerical solutions of Casson SA–hybrid nanofluid toward a stagnation point flow over stretching/shrinking cylinder
- Single flake homo p–n diode of MoTe2 enabled by oxygen plasma doping
- Electrostatic self-assembly effect of Fe3O4 nanoparticles on performance of carbon nanotubes in cement-based materials
- Multi-scale alignment to buried atom-scale devices using Kelvin probe force microscopy
- Antibacterial, mechanical, and dielectric properties of hydroxyapatite cordierite/zirconia porous nanocomposites for use in bone tissue engineering applications
- Time-dependent Darcy–Forchheimer flow of Casson hybrid nanofluid comprising the CNTs through a Riga plate with nonlinear thermal radiation and viscous dissipation
- Durability prediction of geopolymer mortar reinforced with nanoparticles and PVA fiber using particle swarm optimized BP neural network
- Utilization of zein nano-based system for promoting antibiofilm and anti-virulence activities of curcumin against Pseudomonas aeruginosa
- Antibacterial effect of novel dental resin composites containing rod-like zinc oxide
- An extended model to assess Jeffery–Hamel blood flow through arteries with iron-oxide (Fe2O3) nanoparticles and melting effects: Entropy optimization analysis
- Comparative study of copper nanoparticles over radially stretching sheet with water and silicone oil
- Cementitious composites modified by nanocarbon fillers with cooperation effect possessing excellent self-sensing properties
- Confinement size effect on dielectric properties, antimicrobial activity, and recycling of TiO2 quantum dots via photodegradation processes of Congo red dye and real industrial textile wastewater
- Biogenic silver nanoparticles of Moringa oleifera leaf extract: Characterization and photocatalytic application
- Novel integrated structure and function of Mg–Gd neutron shielding materials
- Impact of multiple slips on thermally radiative peristaltic transport of Sisko nanofluid with double diffusion convection, viscous dissipation, and induced magnetic field
- Magnetized water-based hybrid nanofluid flow over an exponentially stretching sheet with thermal convective and mass flux conditions: HAM solution
- A numerical investigation of the two-dimensional magnetohydrodynamic water-based hybrid nanofluid flow composed of Fe3O4 and Au nanoparticles over a heated surface
- Development and modeling of an ultra-robust TPU-MWCNT foam with high flexibility and compressibility
- Effects of nanofillers on the physical, mechanical, and tribological behavior of carbon/kenaf fiber–reinforced phenolic composites
- Polymer nanocomposite for protecting photovoltaic cells from solar ultraviolet in space
- Study on the mechanical properties and microstructure of recycled concrete reinforced with basalt fibers and nano-silica in early low-temperature environments
- Synergistic effect of carbon nanotubes and polyvinyl alcohol on the mechanical performance and microstructure of cement mortar
- CFD analysis of paraffin-based hybrid (Co–Au) and trihybrid (Co–Au–ZrO2) nanofluid flow through a porous medium
- Forced convective tangent hyperbolic nanofluid flow subject to heat source/sink and Lorentz force over a permeable wedge: Numerical exploration
- Physiochemical and electrical activities of nano copper oxides synthesised via hydrothermal method utilising natural reduction agents for solar cell application
- A homotopic analysis of the blood-based bioconvection Carreau–Yasuda hybrid nanofluid flow over a stretching sheet with convective conditions
- In situ synthesis of reduced graphene oxide/SnIn4S8 nanocomposites with enhanced photocatalytic performance for pollutant degradation
- A coarse-grained Poisson–Nernst–Planck model for polyelectrolyte-modified nanofluidic diodes
- A numerical investigation of the magnetized water-based hybrid nanofluid flow over an extending sheet with a convective condition: Active and passive controls of nanoparticles
- The LyP-1 cyclic peptide modified mesoporous polydopamine nanospheres for targeted delivery of triptolide regulate the macrophage repolarization in atherosclerosis
- Synergistic effect of hydroxyapatite-magnetite nanocomposites in magnetic hyperthermia for bone cancer treatment
- The significance of quadratic thermal radiative scrutinization of a nanofluid flow across a microchannel with thermophoretic particle deposition effects
- Ferromagnetic effect on Casson nanofluid flow and transport phenomena across a bi-directional Riga sensor device: Darcy–Forchheimer model
- Performance of carbon nanomaterials incorporated with concrete exposed to high temperature
- Multicriteria-based optimization of roller compacted concrete pavement containing crumb rubber and nano-silica
- Revisiting hydrotalcite synthesis: Efficient combined mechanochemical/coprecipitation synthesis to design advanced tunable basic catalysts
- Exploration of irreversibility process and thermal energy of a tetra hybrid radiative binary nanofluid focusing on solar implementations
- Effect of graphene oxide on the properties of ternary limestone clay cement paste
- Improved mechanical properties of graphene-modified basalt fibre–epoxy composites
- Sodium titanate nanostructured modified by green synthesis of iron oxide for highly efficient photodegradation of dye contaminants
- Green synthesis of Vitis vinifera extract-appended magnesium oxide NPs for biomedical applications
- Differential study on the thermal–physical properties of metal and its oxide nanoparticle-formed nanofluids: Molecular dynamics simulation investigation of argon-based nanofluids
- Heat convection and irreversibility of magneto-micropolar hybrid nanofluids within a porous hexagonal-shaped enclosure having heated obstacle
- Numerical simulation and optimization of biological nanocomposite system for enhanced oil recovery
- Laser ablation and chemical vapor deposition to prepare a nanostructured PPy layer on the Ti surface
- Cilostazol niosomes-loaded transdermal gels: An in vitro and in vivo anti-aggregant and skin permeation activity investigations towards preparing an efficient nanoscale formulation
- Linear and nonlinear optical studies on successfully mixed vanadium oxide and zinc oxide nanoparticles synthesized by sol–gel technique
- Analytical investigation of convective phenomena with nonlinearity characteristics in nanostratified liquid film above an inclined extended sheet
- Optimization method for low-velocity impact identification in nanocomposite using genetic algorithm
- Analyzing the 3D-MHD flow of a sodium alginate-based nanofluid flow containing alumina nanoparticles over a bi-directional extending sheet using variable porous medium and slip conditions
- A comprehensive study of laser irradiated hydrothermally synthesized 2D layered heterostructure V2O5(1−x)MoS2(x) (X = 1–5%) nanocomposites for photocatalytic application
- Computational analysis of water-based silver, copper, and alumina hybrid nanoparticles over a stretchable sheet embedded in a porous medium with thermophoretic particle deposition effects
- A deep dive into AI integration and advanced nanobiosensor technologies for enhanced bacterial infection monitoring
- Effects of normal strain on pyramidal I and II 〈c + a〉 screw dislocation mobility and structure in single-crystal magnesium
- Computational study of cross-flow in entropy-optimized nanofluids
- Significance of nanoparticle aggregation for thermal transport over magnetized sensor surface
- A green and facile synthesis route of nanosize cupric oxide at room temperature
- Effect of annealing time on bending performance and microstructure of C19400 alloy strip
- Chitosan-based Mupirocin and Alkanna tinctoria extract nanoparticles for the management of burn wound: In vitro and in vivo characterization
- Electrospinning of MNZ/PLGA/SF nanofibers for periodontitis
- Photocatalytic degradation of methylene blue by Nd-doped titanium dioxide thin films
- Shell-core-structured electrospinning film with sequential anti-inflammatory and pro-neurogenic effects for peripheral nerve repairment
- Flow and heat transfer insights into a chemically reactive micropolar Williamson ternary hybrid nanofluid with cross-diffusion theory
- One-pot fabrication of open-spherical shapes based on the decoration of copper sulfide/poly-O-amino benzenethiol on copper oxide as a promising photocathode for hydrogen generation from the natural source of Red Sea water
- A penta-hybrid approach for modeling the nanofluid flow in a spatially dependent magnetic field
- Advancing sustainable agriculture: Metal-doped urea–hydroxyapatite hybrid nanofertilizer for agro-industry
- Utilizing Ziziphus spina-christi for eco-friendly synthesis of silver nanoparticles: Antimicrobial activity and promising application in wound healing
- Plant-mediated synthesis, characterization, and evaluation of a copper oxide/silicon dioxide nanocomposite by an antimicrobial study
- Effects of PVA fibers and nano-SiO2 on rheological properties of geopolymer mortar
- Investigating silver and alumina nanoparticles’ impact on fluid behavior over porous stretching surface
- Potential pharmaceutical applications and molecular docking study for green fabricated ZnO nanoparticles mediated Raphanus sativus: In vitro and in vivo study
- Effect of temperature and nanoparticle size on the interfacial layer thickness of TiO2–water nanofluids using molecular dynamics
- Characteristics of induced magnetic field on the time-dependent MHD nanofluid flow through parallel plates
- Flexural and vibration behaviours of novel covered CFRP composite joints with an MWCNT-modified adhesive
- Experimental research on mechanically and thermally activation of nano-kaolin to improve the properties of ultra-high-performance fiber-reinforced concrete
- Analysis of variable fluid properties for three-dimensional flow of ternary hybrid nanofluid on a stretching sheet with MHD effects
- Biodegradability of corn starch films containing nanocellulose fiber and thymol
- Toxicity assessment of copper oxide nanoparticles: In vivo study
- Some measures to enhance the energy output performances of triboelectric nanogenerators
- Reinforcement of graphene nanoplatelets on water uptake and thermomechanical behaviour of epoxy adhesive subjected to water ageing conditions
- Optimization of preparation parameters and testing verification of carbon nanotube suspensions used in concrete
- Max-phase Ti3SiC2 and diverse nanoparticle reinforcements for enhancement of the mechanical, dynamic, and microstructural properties of AA5083 aluminum alloy via FSP
- Advancing drug delivery: Neural network perspectives on nanoparticle-mediated treatments for cancerous tissues
- PEG-PLGA core–shell nanoparticles for the controlled delivery of picoplatin–hydroxypropyl β-cyclodextrin inclusion complex in triple-negative breast cancer: In vitro and in vivo study
- Conduction transportation from graphene to an insulative polymer medium: A novel approach for the conductivity of nanocomposites
- Review Articles
- Developments of terahertz metasurface biosensors: A literature review
- Overview of amorphous carbon memristor device, modeling, and applications for neuromorphic computing
- Advances in the synthesis of gold nanoclusters (AuNCs) of proteins extracted from nature
- A review of ternary polymer nanocomposites containing clay and calcium carbonate and their biomedical applications
- Recent advancements in polyoxometalate-functionalized fiber materials: A review
- Special contribution of atomic force microscopy in cell death research
- A comprehensive review of oral chitosan drug delivery systems: Applications for oral insulin delivery
- Cellular senescence and nanoparticle-based therapies: Current developments and perspectives
- Cyclodextrins-block copolymer drug delivery systems: From design and development to preclinical studies
- Micelle-based nanoparticles with stimuli-responsive properties for drug delivery
- Critical assessment of the thermal stability and degradation of chemically functionalized nanocellulose-based polymer nanocomposites
- Research progress in preparation technology of micro and nano titanium alloy powder
- Nanoformulations for lysozyme-based additives in animal feed: An alternative to fight antibiotic resistance spread
- Incorporation of organic photochromic molecules in mesoporous silica materials: Synthesis and applications
- A review on modeling of graphene and associated nanostructures reinforced concrete
- A review on strengthening mechanisms of carbon quantum dots-reinforced Cu-matrix nanocomposites
- Review on nanocellulose composites and CNFs assembled microfiber toward automotive applications
- Nanomaterial coating for layered lithium rich transition metal oxide cathode for lithium-ion battery
- Application of AgNPs in biomedicine: An overview and current trends
- Nanobiotechnology and microbial influence on cold adaptation in plants
- Hepatotoxicity of nanomaterials: From mechanism to therapeutic strategy
- Applications of micro-nanobubble and its influence on concrete properties: An in-depth review
- A comprehensive systematic literature review of ML in nanotechnology for sustainable development
- Exploiting the nanotechnological approaches for traditional Chinese medicine in childhood rhinitis: A review of future perspectives
- Twisto-photonics in two-dimensional materials: A comprehensive review
- Current advances of anticancer drugs based on solubilization technology
- Recent process of using nanoparticles in the T cell-based immunometabolic therapy
- Future prospects of gold nanoclusters in hydrogen storage systems and sustainable environmental treatment applications
- Preparation, types, and applications of one- and two-dimensional nanochannels and their transport properties for water and ions
- Microstructural, mechanical, and corrosion characteristics of Mg–Gd–x systems: A review of recent advancements
- Functionalized nanostructures and targeted delivery systems with a focus on plant-derived natural agents for COVID-19 therapy: A review and outlook
- Mapping evolution and trends of cell membrane-coated nanoparticles: A bibliometric analysis and scoping review
- Nanoparticles and their application in the diagnosis of hepatocellular carcinoma
- In situ growth of carbon nanotubes on fly ash substrates
- Structural performance of boards through nanoparticle reinforcement: An advance review
- Reinforcing mechanisms review of the graphene oxide on cement composites
- Seed regeneration aided by nanomaterials in a climate change scenario: A comprehensive review
- Surface-engineered quantum dot nanocomposites for neurodegenerative disorder remediation and avenue for neuroimaging
- Graphitic carbon nitride hybrid thin films for energy conversion: A mini-review on defect activation with different materials
- Nanoparticles and the treatment of hepatocellular carcinoma
- Special Issue on Advanced Nanomaterials and Composites for Energy Conversion and Storage - Part II
- Highly safe lithium vanadium oxide anode for fast-charging dendrite-free lithium-ion batteries
- Recent progress in nanomaterials of battery energy storage: A patent landscape analysis, technology updates, and future prospects
- Special Issue on Advanced Nanomaterials for Carbon Capture, Environment and Utilization for Energy Sustainability - Part II
- Calcium-, magnesium-, and yttrium-doped lithium nickel phosphate nanomaterials as high-performance catalysts for electrochemical water oxidation reaction
- Low alkaline vegetation concrete with silica fume and nano-fly ash composites to improve the planting properties and soil ecology
- Mesoporous silica-grafted deep eutectic solvent-based mixed matrix membranes for wastewater treatment: Synthesis and emerging pollutant removal performance
- Electrochemically prepared ultrathin two-dimensional graphitic nanosheets as cathodes for advanced Zn-based energy storage devices
- Enhanced catalytic degradation of amoxicillin by phyto-mediated synthesised ZnO NPs and ZnO-rGO hybrid nanocomposite: Assessment of antioxidant activity, adsorption, and thermodynamic analysis
- Incorporating GO in PI matrix to advance nanocomposite coating: An enhancing strategy to prevent corrosion
- Synthesis, characterization, thermal stability, and application of microporous hyper cross-linked polyphosphazenes with naphthylamine group for CO2 uptake
- Engineering in ceramic albite morphology by the addition of additives: Carbon nanotubes and graphene oxide for energy applications
- Nanoscale synergy: Optimizing energy storage with SnO2 quantum dots on ZnO hexagonal prisms for advanced supercapacitors
- Aging assessment of silicone rubber materials under corona discharge accompanied by humidity and UV radiation
- Tuning structural and electrical properties of Co-precipitated and Cu-incorporated nickel ferrite for energy applications
- Sodium alginate-supported AgSr nanoparticles for catalytic degradation of malachite green and methyl orange in aqueous medium
- An environmentally greener and reusability approach for bioenergy production using Mallotus philippensis (Kamala) seed oil feedstock via phytonanotechnology
- Micro-/nano-alumina trihydrate and -magnesium hydroxide fillers in RTV-SR composites under electrical and environmental stresses
- Mechanism exploration of ion-implanted epoxy on surface trap distribution: An approach to augment the vacuum flashover voltages
- Nanoscale engineering of semiconductor photocatalysts boosting charge separation for solar-driven H2 production: Recent advances and future perspective
- Excellent catalytic performance over reduced graphene-boosted novel nanoparticles for oxidative desulfurization of fuel oil
- Special Issue on Advances in Nanotechnology for Agriculture
- Deciphering the synergistic potential of mycogenic zinc oxide nanoparticles and bio-slurry formulation on phenology and physiology of Vigna radiata
- Nanomaterials: Cross-disciplinary applications in ornamental plants
- Special Issue on Catechol Based Nano and Microstructures
- Polydopamine films: Versatile but interface-dependent coatings
- In vitro anticancer activity of melanin-like nanoparticles for multimodal therapy of glioblastoma
- Poly-3,4-dihydroxybenzylidenhydrazine, a different analogue of polydopamine
- Chirality and self-assembly of structures derived from optically active 1,2-diaminocyclohexane and catecholamines
- Advancing resource sustainability with green photothermal materials: Insights from organic waste-derived and bioderived sources
- Bioinspired neuromelanin-like Pt(iv) polymeric nanoparticles for cancer treatment
- Special Issue on Implementing Nanotechnology for Smart Healthcare System
- Intelligent explainable optical sensing on Internet of nanorobots for disease detection
- Special Issue on Green Mono, Bi and Tri Metallic Nanoparticles for Biological and Environmental Applications
- Tracking success of interaction of green-synthesized Carbopol nanoemulgel (neomycin-decorated Ag/ZnO nanocomposite) with wound-based MDR bacteria
- Green synthesis of copper oxide nanoparticles using genus Inula and evaluation of biological therapeutics and environmental applications
- Biogenic fabrication and multifunctional therapeutic applications of silver nanoparticles synthesized from rose petal extract
- Metal oxides on the frontlines: Antimicrobial activity in plant-derived biometallic nanoparticles
- Controlling pore size during the synthesis of hydroxyapatite nanoparticles using CTAB by the sol–gel hydrothermal method and their biological activities
- Special Issue on State-of-Art Advanced Nanotechnology for Healthcare
- Applications of nanomedicine-integrated phototherapeutic agents in cancer theranostics: A comprehensive review of the current state of research
- Smart bionanomaterials for treatment and diagnosis of inflammatory bowel disease
- Beyond conventional therapy: Synthesis of multifunctional nanoparticles for rheumatoid arthritis therapy