
Pitting corrosion induced on high-strength high carbon steel wire in high alkaline deaerated chloride electrolyte
-
Siaw Foon Lee
 ,
Jose Fullea García
,
Jose Fullea García

Abstract
Electrochemical response causing pitting corrosion of high-strength high carbon steel wire in deaerated electrolyte at pH 13.4 due to different chloride ion (Cl−) concentrations was investigated using open circuit potential, cyclic potentiodynamic polarization, and anodic potentiostatic application (APA) within the passive zone. Results showed that the higher the Cl− concentration, the more negative the corrosion potential becomes. In the high alkaline pH 13.4 without the presence of free oxygen gas the Cl− concentration could reach up to 1 M not showing pitting potential. An inverse relationship between anodic potentials (APs) and Cl− concentrations was found and the rate of corrosion within passive period was almost a constant, not influenced by the Cl− concentrations. Faraday´s law failed to predict the mass loss when active pitting corrosion occurred. Green rust and hydrogen gas were observed during active pitting corrosion under APA. Pitting corrosion mechanism in the deaerated high alkaline electrolyte was then proposed. This work deduces that in the deaerated electrolyte at pH 13.4 with the presence of Cl−, it is essential to apply the APs within the safety margin on the high-strength high carbon steel wire to avoid active pitting corrosion and hydrogen embrittlement.
Graphical abstract

1 Introduction
Reinforcing steels embedded in traditional concrete structures, such as bridges and flyovers, are protected from corrosion using either the cathodic protection that needs the use of other metal as an anode in the sacrificial passive system [1,2], or the anodic protection that applies anodic current to the reinforcing steel [3]. With the increase in daily load, wind load, and earthquake, high-strength high carbon steel wire (HSHCsw) has started to be widely incorporated in the concrete structure to increase its durability.
Until now, the studies on HSHCsw are mainly from the aspect of corrosion fatigue analysis [4,5], stress corrosion cracking [6], strain influence on corrosion [7], hydrogen embrittlement [8], and the stability of the passive layer developed under mechanical stress [9]. Anodic protection involving raising the potential of the protected metal to its passive zone for the formation of a passive thin layer on its surface has not been performed on HSHCsw embedded in concrete until present. Thus, it is of great interest to study the range of anodic potentials (APs) and the duration that could be adopted in the function of Cl− concentrations to avoid uncontrolled application that would lead to structural breakdown.
It is known that a newly made concrete has a pH of about 12.5–13.2 due to the release of calcium hydroxide during hydration and the presence of sodium and potassium hydroxides in the pore solution [10]. The high pH range of concrete can prevent steel corrosion by promoting the formation of gamma ferric oxide (γ-Fe2O3) acting as passive film [11,12]. If the passivation is not disturbed, the protection of embedded steel will continue and the durability of concrete structure could last forever.
In reality, the concrete is porous [13,14] and susceptible to the ingress of Cl− especially from the marine environment and de-icing salt in cold climates during its service [15]. In addition, Cl− under a threshold level could have been introduced into concrete through the use of recycled aggregates [16] and the mixing of water during concrete manufacturing. Many studies have shown that the presence of Cl− can lead to the initiation of pitting corrosion on the steel [17] at the pH range of concrete. For instance, the absorption of Cl− via intergranular boundaries of the passive layer will lead to the breakdown of the film [18]. In the case of TiN inclusion used to increase the drawability of steel, the steel matrix surrounding TiN will undergo anodic dissolution when it is exposed to NaCl electrolyte. Due to the fact that it is insoluble and electronic conductor, these properties allow TiN to act as cathodic site and will remain in the inner part of the pit. Thus, an occluded passive film is hardly formed to fully cover up TiN and a step-like pit will then be formed. Due to an extreme gradient of a high Cl− concentration in the electrolyte, a large influx of aggressive Cl− would appear between the inner pit and NaCl bulk electrolyte [19]. On top of that, the combination of Cl− and the passive oxide could form Cl− complexes leading to the volume expansion and the breakdown of the film [20].
However, Scott [21] reported that the passivation on bare steel rods can be maintained in Cl− contaminated saturated Ca(OH)2 or cement-saturated solutions provided that free oxygen gas is excluded from the steel surface. On the other hand, Hausmann [22] showed that there exists a critical Cl− concentration that should not be surpassed in the oxygen free Ca(OH)2 saturated electrolyte for the steel surface not showing any corrosion.
In view of the above facts, HSHCsw with 0.82% carbon, Young’s modulus of 200 GPa and yield strength of 1,300 MPa, extensively used in the construction in Spain, was adopted in this work. First, the open circuit potential (OCP) measurement and the cyclic potentiodynamic polarization (CPP) were performed on HSHCsw to investigate its sustainability to which limit of the amount of Cl− could be present in a high alkaline deaerated electrolyte without leading to pitting corrosion. With the obtained range of the allowable limit of Cl− concentration, anodic potentiostatic application (APA) within the passive zone was applied on HSHCsw for 48 h. The purpose was to view how the presence of the Cl− amount could influence the selection of the range of anodic potentials (APs) and the rate of corrosion during the passive period before pitting corrosion starting to take place in APA. The comparison between the gravimetrically-calculated and theoretically-calculated mass loss was made. The mechanism leading to pitting corrosion under APA in very high alkaline deaerated electrolyte was also proposed. This work could provide a thorough information in reducing the risk of accidentally implementing the AP outside the safety margin that could lead to the structural breakdown under anodic protection.
2 Experimental method
2.1 Materials and electrolytes
As-received HSHCsw of plain surface with a diameter of 8 mm from the company of EMESA (Arteixo, La Coruña, Spain) was adopted in this study with its chemical composition presented in Table 1. The steel wire was cut into 10 cm long. Before the electrochemical measurements, the steel wires were ultrasonically cleaned in a cleaning solution for around two minutes to remove zinc phosphate (ZnPO4) that was coated on its surface during fabrication. The cleaning solution is made from hydrochloric acid and water in a proportion of 1:1 together with a corrosion inhibitor called hexamethylenetetramine of 3 g/L. The steel wires were then rinsed in the running tap water and dried in air with a hair dryer. The clean steel wires were covered with adhesive tapes on both sides, as shown in Figure 1, with the exposed surface of 3 cm in length. As soon as the steel wires were dried with the hair dryer, an air-formed film of gamma ferric oxide (γ-Fe2O3) with a thickness of 10–20 Å was formed on the steel surface [23,24]. All steel wires were kept in a sealed bag to avoid the humidity in the air before they were used in the test the following day.
Chemical composition of HSHCsw adopted in this study
| C% | Mn% | Si% | P% | S% | Cr% | Fe% |
|---|---|---|---|---|---|---|
| 0.82 | 0.65 | 0.17 | <0.015 | 0.022 | 0.28 | 98.04 |

Sample of HSHCsw with black-colour adhesive tapes on both sides.
Electrolyte at pH 13.4 was made by dissolving saturated Ca(OH)2 and 0.5 M KOH in distilled water. Different amounts of NaCl was added to the electrolyte in order to have the Cl− concentration of 0.1 M, 0.25 M (brackish water), 0.5 M (sea water), 1 M (severe marine environment), and 2 M and 3 M (extremely severe marine environment).
2.2 Electrochemical measurements
Figure 2 shows the schematic drawing of the electrochemical cell used in this study. The cell had four holes on the top of the airtight cover to allow the introduction of the reference electrode, the counter electrode, the working electrode, and the tube of nitrogen gas into the electrolyte. In the electrochemical measurement, the working electrode was the HSHCsw, the counter electrode and the reference electrode were a graphite rod and Ag/AgCl in saturated KCl, respectively. Before the steel wire was introduced in the cell, nitrogen gas was bubbled through the electrolyte for 20 min to purge oxygen gas from the electrolyte until the oxygen concentration of electrolyte reached ≤0.5 ppm, which was measured using the Clark electrode. A flowmeter was used to control the flow rate of nitrogen gas that was able to maintain the oxygen concentration of electrolyte at ≤0.5 ppm throughout the electrochemical test.

Schematic drawing of the electrochemical cell.
The corrosion potential (E corr) of the steel wire was measured continuously for 3 days using OCP measurement and the equipment used was the Agilent 34970A data logger. The measurement of E corr was started straight away after the steel was introduced into the deaerated electrolyte. As for CPP and APA, the ACM instruments with serial no. 1127 and the Gill AC with serial no. 1127 sequencer software were employed. For CPP measurement, the potential starting from −900 to +600 mV as a reverse potential at a scan rate of 10 mV/min was applied to the steel wire. Application of CPP allows the determination of whether HSHCsw would undergo domains of immunity, active E corr, passive and transpassive with pitting potential (E pit) caused by Cl− in deaerated electrolyte at pH 13.4. Thus, additional tests of CPP in the extremely severe marine environment of 2 and 3 M Cl− deaerated electrolyte were also performed to examine their influence on the passivation of steel wire. The CPP curves were reversed at +600 mV for the purpose of the uniformity of potential scale in CPP-curve comparison under different Cl− concentrations in the deaerated electrolyte. For APA, APs with an interval of 50 mV within the determined passive region were applied to the steel wire for 48 h. All tests were performed at the room temperature of 21°C. After APA test, the electrolytes were analysed to find out the quantity of Fe2+/Fe3+ escaped into the deaerated electrolytes during the test using the inductively coupled plasma (ICP) technique. The instruments used was Varian 725-ES Optical Emission Spectrometer ICPE, with the potential being set to be 1.40 kW, the plasma flow of 15 L/min, auxiliary flow of 1.50 L/min, and the mist flow of 0.80 L/min. The unit shown by ICP technique was in ppm and then converted into gram. The surface morphology was examined under the light microscope (Nikon SMZ-2T Japan) with eyepiece at 10×/16. The microstructure of corrosion products was studied under the scanning electron microscope (SEM) (S-4800, Hitachi) and the energy dispersive X-ray spectroscopy (EDS) was performed on them.
3 Results and discussion
3.1 E corr
Figure 3 shows E corr of HSHCsw at open circuit in 4 different Cl− concentrations over a 3-day period in the deaerated electrolyte at pH 13.4. The four curves have the same characteristic trend, which is, the E corr drift towards positive direction on immersion [25], then reverse and towards negative, eventually drift back towards more positive, and finally all reach a constant value of around −400 mV. Steel wire showing different shifts of E corr in the time range of 2–65 h is mainly due to the different Cl− concentrations, not due to the absence of free oxygen gas on the steel wire surface [22]. In this work, an air-formed film γ-Fe2O3 [24] was present on the surface before it was introduced into the electrolyte. On immersion, the air-formed film tends to breakdown at its weak points and Fe dissolves into Fe2+ through anodic reaction at these points. Due to the fact that free oxygen gas is completely purged from the electrolyte by the continuous flow of N2, the cathodic reaction involving oxygen gas and water does not really takes place on the steel wire surface to produce OH− as shown by the chemical reaction of ½O2 + H2O + 2e− = 2OH− [19]. Instead, the released Fe2+ immediately combines with OH− coming from the deaerated electrolyte to form passive film ferrous hydroxide (Fe(OH)2) to reinforce the weak points found at the air-formed film. This explains why E corr moves towards positive direction within the first minute of immersion, as seen in the built-in magnifying graph on the right top in Figure 3. However, the coexistence of Cl− in the electrolyte can induce more weak points at the air-formed film, and thus, it causes E corr drift towards negative direction. It can be seen that the higher the concentration of Cl− is, the more negative the E corr becomes.

E corr of HSHCsw at open circuit in deaerated electrolytes at pH 13.4 at 0.1, 0.25, 0.5, and 1 M Cl− over a 3-day period. Right top is the magnifying graph of the first hour of immersion.
At 1 M Cl−, due to a considerably high Cl− concentration that leads to the generation of relatively high susceptible areas in the air-formed film, the E corr takes longer time to reach −400 mV. The maximum negative value of E corr reached was −793 mV vs Ag/AgCl, saturated KCl, which is equivalent to −594 mV vs standard hydrogen electrode (SHE). From the Pourbaix diagram of steel [26] in Figure 4, −594 mV vs SHE still falls within the passivation zone of steel, not in the small zone of corrosion that appeared at very high alkaline pH. Somehow, due to the high alkaline and deaerated conditions, the formation of passive film becomes faster than the attack of Cl− with time. Thus, all the E corr move back towards positive direction and settle at around −400 mV.
![Figure 4
Pourbaix diagram for steel showing the zone of immunity, corrosion, and passivation. Equation for (a): E(water → H2) = 0.000 – 0.0591 pH. Equation for (b) E(water → O2) = 1.228 – 0.0591 pH [26].](/document/doi/10.1515/ntrev-2022-0060/asset/graphic/j_ntrev-2022-0060_fig_004.jpg)
Pourbaix diagram for steel showing the zone of immunity, corrosion, and passivation. Equation for (a): E(water → H2) = 0.000 – 0.0591 pH. Equation for (b) E(water → O2) = 1.228 – 0.0591 pH [26].
During the test, the steel wire surfaces were inspected visually for any possible appearance of rust. It was found that at the end of the test the steel wires remained bright. In order to ensure that no tiny dots of rust appeared on the surface that failed to be spotted visually, the steel wires were examined under the light microscope after the tests, again no visible corrosion was noticed on the steel wire surface with the Cl− concentration as high as 1 M in the deaerated electrolyte at pH 13.4. The absence of oxygen gas and the presence of high concentration of OH− kept the produced Fe(OH)2 as it was without being oxidised further to ferric compound that having a cubic structure indistinguishable from the air-formed film at room temperature [11,27].
3.2 CPP
Figure 5 shows the CPP curves of steel wires at four different Cl− concentrations in deaerated electrolyte at pH 13.4. No cathodic cleaning at −1,200 mV was performed in order to maintain the air-formed film of γ-Fe2O3 on the surfaces of all steel wires before the scanning started. It can be seen that for Cl− concentrations below 0.5 M, the corresponding current densities of reverse curves (dotted lines) are lower than those of forward curves (solid lines), the reverse curve (dotted line) superimposed on the forward curve (solid line) only at 1 M Cl−. All the curves reveal negative hysteresis loops with the repassivation potential (E rep) above the active E corr on the CPP curves [28]. In addition, no sudden increase in current densities related with E pit is seen on the CPP curves. All these curve characteristics reveal that no pitting corrosions took place on the steel wire surface during the CPP scanning [29]. There was no sharp increase in the current for Cl− concentration below 1 M even at +237 mV (vs Ag/AgCl, sat KCl), at which the oxygen gas is theoretically produced from water. It is because that the high pH 13.4 together with the continuous flowing of nitrogen gas to purge the generated oxygen gas do not encourage active pitting corrosion on the steel surface. All steel wires remained bright throughout the test and no visible corrosion was noticed under the light microscope after the test. Since the potential is scanned from cathodic condition, the active E corr on the CPP curves become more negative than the constant E corr achieved at open circuit as shown in Figure 3, which are in agreement with previous study [30].

CPP of HSHCsw in deaerated electrolytes at pH 13.4 at 0.1, 0.25, 0.5, and 1 M Cl−. A complete CPP from −900 to +600 and then back to −900 mV was performed for each Cl− concentration. Forward curves are plotted as solid lines and reverse curves are plotted as dotted lines for easy viewing and comparing.
According to Figure 3, the achieved constant E corr at open circuit is −400 mV. Thus, the passive current densities at −400 mV on CPP in Figure 5 are noted and they are 1, 1.8, 4, and 4.8 × 10⁻⁶ A/cm2 for 0.1, 0.25, 0.5, and 1 M Cl−, respectively. These values are in fact lower when compared to the passive current density of 3 × 10⁻⁵ A/cm2 reported by Shi et al. [30] for low alloyed and low carbon reinforcing steels at 0.1 M Cl− in aerated simulated concrete pore solution.
In addition, CPP scan was also performed on the steel wire at 2 and 3 M Cl− with E pit shown at +395 and +67 mV vs Ag/AgCl, respectively, as seen in Figure 6, which are equivalent to +600 and +272 mV vs SHE, respectively. According to the Pourbaix diagram for steel in Figure 4, it is obvious that E pit at 2 M Cl− falls in the oxygen evolution region and that of 3 M Cl− falls in the passivation region. It can be seen that the generation of oxygen gas from the oxygen evolution reaction (E oe) (4OH− → O2 + 2H2O + 4e−) [29,31] at + 395 mV vs Ag/AgCl is higher than the purging of oxygen gas by nitrogen gas. Thus, the presence of oxygen gas together with Cl− in the electrolyte encourage pitting corrosion to take place on the steel wire surface at 2 M Cl−. This fact is supported by the report of Scott [21] that the presence of oxygen gas in the electrolyte at pH 12 together with a high Cl− concentration could force a steel to corrode. However, at 3 M Cl−, E pit occurs even without the presence of free oxygen gas this could be due to that a critical Cl− concentration has been surpassed in the deaerated electrolyte [22] or the formation of soluble complex ions between Cl− and cations leading to the breakdown of passive film [32].

CPP of HSHCsw in deaerated electrolytes at pH 13.4 at 2 and 3 M Cl−.
Both CPP curves at 2 and 3 M Cl− present a big positive hysteresis loop, indicating the occurrence of lots of pitting corrosions on the steel wire surface [33]. Such big positive hysteresis loop makes the reserve anodic current struggle to decrease or to stop pit propagation at the beginning of the reverse scan. Finally, at 2 M Cl−, the reserve anodic current changes to reverse cathodic current at E rep falling in the transition region of the corresponding forward curve at −670 mV [34, 35], while at 3 M Cl−, E rep fall in the cathodic region of the corresponding forward curve at −574 mV [36]. The big hysteresis loop together with E rep not falling in the passive region indicate the difficulty in repassivating all the active pits to restore a complete passive layer [33], and also, there possibly exists a high tendency of HSHCsw under further attack of pitting corrosion.
It is obvious that HSHCsw is susceptible to pitting corrosions at both 2 and 3 M Cl− deaerated electrolytes at pH 13.4. However, it is more corrosion resistant at 2 M Cl− because E pit at 2 M Cl− is higher than E pit at 3 M Cl− [36] and the plateau of passive region at 2 M is also wider than 3 M Cl− [37].
3.3 APA
The purpose of APA within the passive zone is to regenerate passive film on the steel surface in order to decrease the rate of corrosion. However, the application of APA without proper control would lead to severe corrosion. Since E
pit for Cl− concentration below 1 M is not shown in the CPP in Figure 5, the potential that would lead to the theoretical decomposition of water to oxygen gas based on the equation shown in Figure 4 is calculated and thus used as the upper limit in order to preserve the deaerated condition in the electrolyte. It is found to be
Table 2 shows the gravimetric (Exp) and the theoretical mass loss (Theo) of HSHCsw after the 48 h APA in deaerated electrolyte at pH 13.4 at 0.1, 0.25, 0.5, and 1 M Cl−, calculated based on the equations (1) and (2) in Section 3.3.1. The bold digits referring to that pitting corrosion was observed on the steel wire after the 48 h APA test. The ICP technique showed that the maximum quantity of Fe2+/Fe3+ detected in the electrolyte was 3.5 × 10⁻⁶ g for the cases that had pitting corrosions after 48 h. This value is negligible and this indicates that all the released Fe2+/Fe3+ involve in the precipitation as solid oxides on the HSHCsw surface. Most of the steel wires that did not show pitting corrosion had quantity of Fe2+/Fe3+ below the detected value (<LD).
Gravimetric (Exp) and theoretical mass loss (Theo) of HSHCsw and the released Fe2+/Fe3+ in the deaerated electrolytes at pH 13.4 after 48 h APA measurement
| Anodic potential (mV) | |||||||||
|---|---|---|---|---|---|---|---|---|---|
| Cl− (M) | −400 | −350 | −300 | −250 | −200 | −100 | 0 | +100 | |
| 0.10 | Exp (g) | 0.0018 | 0.0052 | 0.0027 | 0.0064 | 0.0071 | 0.1111 | ||
| Theo (g) | 0.0004 | 0.0006 | 0.0002 | 0.0004 | 0.0007 | 0.0861 | |||
| Fe2+/Fe3+ (×10−6 g) | <LD | <LD | 0.0031 | <LD | <LD | 0.0870 | |||
| 0.25 | Exp (g) | 0.0040 | 0.0046 | 0.0024 | 0.0058 | 1.4854 | |||
| Theo (g) | 0.0004 | 0.0004 | 0.0006 | 0.0006 | 1.5897 | ||||
| Fe2+/Fe3+ (×10−6 g) | <LD | <LD | <LD | <LD | 1.0430 | ||||
| 0.50 | Exp (g) | 0.0032 | 0.0048 | 0.0081 | 0.8164 | 2.7193 | |||
| Theo (g) | 0.0006 | 0.0011 | 0.0008 | 0.8846 | 2.7248 | ||||
| Fe2+/Fe3+ (×10−6 g) | <LD | 0.0025 | <LD | 0.5636 | 1.5530 | ||||
| 1.00 | Exp (g) | 0.0030 | 0.1553 | 0.1796 | 2.8013 | 4.1319 | |||
| Theo (g) | 0.0017 | 0.1567 | 0.1836 | 2.9354 | 5.0391 | ||||
| Fe2+/Fe3+ (×10−6 g) | 0.0179 | 0.1633 | 0.0397 | 1.6115 | 3.5000 | ||||
Bold digits refer to steel wire having pitting corrosions and <LD refer to below the detected value.
3.3.1 Relationship between AP, passive period, rate of corrosion, mass loss, and Cl− concentration
The 48 h AP that induced pitting corrosion on HSHCsw as shown in Table 2 (bold digits) is plotted versus the corresponding Cl− concentration in Figure 7, with −400 mV marked as E corr. The curve can be represented by a second-degree polynomial equation as y = 469.61x 2 – 1029.7x + 208.48 with R 2 being 0.995. This equation can only be used as an interpolation for a range of Cl− concentration between 0.1 and 1 M in deaerated electrolyte at pH 13.4 in this study. It shows that HSHCsw will not corrode in the presence of Cl− when the AP below the curve is applied within the time frame of 48 h. However, if the AP above the curve is applied, pitting corrosion will develop on HSHCsw. At 1 M Cl−, the AP that does not lead to pitting corrosion has a narrow margin, around 50 mV from E corr. Thus, APA within passive zone to reproduce passive film to reduce the rate of corrosion on the steel wire surface will not work well when the presence of Cl− concentration is very high or in the old concrete that has narrow passive zone due to pH lower than 11.5 [38].

Relationship between AP inducing pitting corrosion on HSHCsw within 48 h time frame and Cl− concentration in deaerated electrolyte at pH 13.4 with the interpolation equation being applied only to the range of Cl− concentration from 0.1 to 1 M, with −400 mV marked as E corr as in Figure 3. The rate of corrosion corresponding to each point on the curve is calculated based on equation (3) in this article.
The curves of anodic current density (I a) against time for HSHCsw showing no pitting corrosion at 0.1 M and 0.25 M Cl− at −200 mV (electrochemical conditions below the curve in Figure 7) are displayed in Figure 8. It is found that I a oscillates between 0.3 and 1 µA/cm2 and between 1 and 2.5 µA/cm2 at 0.1 and 0.25 M Cl−, respectively, higher than that reported by other reinforcing steel in the aerated electrolyte [25]. Although this is the case, no pittings are generated on HSHCsw. It is mainly because AP is applied within the passive region, in addition to the high alkaline deaerated electrolyte. Furthermore, continuous repassivation is found occurring on HSHCsw during APA because lots of current transients are clearly seen on the curves.

Anodic current density (I a) of HSHCsw at 0.1 and 0.25 M Cl− when the AP is polarized at −200 mV (in the zone of no pitting corrosion in Figure 7), in the deaerated electrolyte at pH 13.4.
Figure 9(1(a), 2(a), 3(a), and 4(a)) shows the I a vs time for 0.1, 0.25, 0.5, and 1 M Cl−, respectively, corresponding to the points plotted on the curve of AP versus Cl− in Figure 7 that provides the second-degree polynomial equation as y = 469.61x 2 – 1029.7x + 208.48 with R 2 being 0.995. The passive period in the graph is referred to the duration before the generation of active pitting corrosion. It can be seen that pitting corrosion does not appear immediately upon the application of AP; instead, it took some time to appear. A sudden drop in the I a after 30 h at 0.25 M Cl− in Figure 9(2(a)) was because of a thick layer of solid oxides formed on the whole steel wire surface starting to act as a protective layer in preventing further active pitting corrosion.
The passive period versus AP for 0.5 and 1 M Cl− was then plotted in Figure 10. A non-linear relationship between the passive period and AP is obtained. Somehow, it is clear that the passive period decreases when AP becomes more positive, and increases when the Cl− concentration becomes less.

I a of HSHCsw during 48 h in deaerated electrolyte at pH 13.4 and its corresponding surface morphology (light microscope: 15×) at: (1a and 1b) 0.1 M Cl− and +100 mV, (2a and 2b) 0.25 M Cl− and +0 mV, (3a and 3b) 0.5 M Cl− and −200 mV, and (4a and 4b) 1 M Cl− and −350 mV, corresponding to the points plotted on the curve in Figure 7.

Relationship of passive period vs AP for HSHCsw in deaerated electrolyte at pH 13.4 at 0.5 and 1 M Cl−.
Since steel wire is usually embedded in the concrete structure and the APA involves the dissolution of iron to form passive film, it is interesting to find out theoretically the amount of iron that has been consumed during the APA application. Thus, the gravimetric mass loss of corroded HSHCsw from the APA and the theoretical mass loss calculated using Faraday´s law is compared. The gravimetric mass loss, m e, was obtained by subtracting the mass of HSHCsw after the test, m 1, from that before the test, m 0, in grams.
The theoretical mass loss in grams, m F, was calculated using Faraday´s law as below:
where M is the molecular weight of metal (M = 56 g/mol for Fe), z is the valence number of ion (z = 2 for Fe), F is the Faraday constant (F = 96,485 C/mol), I is the density of current in A/cm2, and t is the corrosion duration in seconds. “It” was calculated by integrating the curve of I a against time obtained from the APA as exemplified in Figure 9(1(a), 2(a), 3(a), and 4(a)). The relationship between the gravimetrically and the theoretically calculated mass loss of HSHCsw versus the Cl− concentration at different APs is shown in Figure 11. From the comparison, it can be seen that Faraday´s law is only valid to predict the mass loss of HSHCsw when no severe pitting corrosion occurs. The prediction starts to deviate when severe corrosion occurs, especially at 1 M Cl− at +0 mV where the theoretically-calculated mass loss of HSHCsw is 21.96% higher than the gravimetrically-calculated value.

Gravimetrically-calculated (solid line) and theoretically-calculated (dotted line) mass loss of HSHCsw vs Cl− concentration at different APAs within passive zone that lasted for 48 h.
Due to the fact that the prediction of mass loss from Faraday´s law is only valid when there is no severe pitting corrosions, the rate of corrosion (R corr) in g/m2/h of each point on the curve in Figure 7 was then calculated within the passive period using the following equation:
where A is the specimens area in square meters, t is the passive period as defined in Figure 9(1(a), 2(a), 3(a) and 4(a)), and m F is the mass loss within the passive period that was calculated using Faraday´s law in equation (2). The calculated rates of corrosion before the occurrence of active pitting corrosion is found between 0.023 and 0.042 g/m2/h, no track of the influence of the different Cl− concentration on it. These rates of corrosion of HSHCsw in deaerated electrolyte at pH 13.4 when no pitting corrosion occurs under APA are a lot lower than the rate of corrosion of stainless steel under the stand-alone polyaniline (PANI) protection in 5 M H2SO4, which is 0.833 g/m2/h [39].
The pit morphologies corresponding to the points plotted on the curve of AP versus Cl− in Figure 7 on HSHCsw at different Cl− concentrations after APA, viewed under the light microscope (15×), are displayed in Figure 9(1(b), 2(b), 3(b), and 4(b)). It is different from small individual pits shown on the steel immersed in alkaline electrolyte at pH 12.5 under OCP [40]. Here many tiny or small pits are found amidst big and connected pits with no profound depth. The influence of Cl− concentration together with AP on the number and the size of pits is evident. It can be seen that under both electrochemical conditions, which are the same AP but with the increase in Cl− concentration or the same Cl− concentration but with the increase in AP, will widen the pit size and cause the pits to be connected to each other and finally to become general corrosion.
The pit shapes of HSHCsw shown in Figure 9(4(b)) are similar to the reported pit shape of stainless steel and carbon steel [41]. Due to the fact that the pits were obtained after 48 h AP application, the pit depths are around between 0.18 mm (180 μm) and 0.29 mm (290 μm), which are deeper than the pit depth of stainless steels obtained from CPP [29,31], or carbon steel under 150 mV potentiostatics at pH 3.8 for 24 h [41]. For the case that undergoes severe corrosion leading to a complete general corrosion after 48 h AP application as shown in Figure 9(2(b)), the diameter of HSHCsw becomes around 0.44 mm (440 μm) less than the original one, which is 8 mm.
Figure 12(a) shows the light micrograph (60×) of the as-received surface morphology of steel wire and Figure 12(b)–(d) shows the pits that appear on the steel wire surface at 1 M Cl− and −200 mV, at 1 M Cl− and −350 mV as well as at 0.5 M Cl− and −200 mV, respectively. Comparing with the as-received surface morphology, Figure 12(b) reveals a lot of tiny pits due to the attack of Cl− on the passive film [42]. The tiny pits within a big pit is also observed in Figure 12(c), which is not considered as the reported step-like pit in TiN inclusion [19] as Fe2+ and Fe3+ are soluble when iron undergoes oxidation. Thus, an occluded cover will be definitely formed to cover completely the big pit that contains tiny pits inside. Under active pitting corrosion, the tiny pits will merge to form even bigger pits, as shown in Figure 12(d). From the graphs of I a vs time and light micrographs in Figure 9 as well as Figure 12, respectively, it can be deduced that when active pitting corrosions accidentally take place in APA, the individual tiny pit will not propagate deep into the steel wire to cause embrittlement [43,44]. Instead, they will tend to merge to form bigger pits leading to pseudo-general corrosions shown in Figure 9(2(b)). The expansion of corrosion products will also lead to the initiation of crevice-inducing pits, encouraging more pseudo-general corrosions to take place on the steel wire surface [45].

The light micrograph (60×) of the surface morphology of steel wire – (a) as-received, (b) pits at 1 M Cl− and −200 mV, (c) pits at 1 M Cl− and −350 mV, and (d) pits at 0.5 M Cl− and −200 mV.
3.3.2 Corrosion products and pit corrosion mechanism
Figure 13a shows the corrosion product produced on HSHCsw in the deaerated electrolyte (≤0.5 ppm) at pH 13.4 at 1 M Cl− and −350 mV under the continuous flow of nitrogen gas. Semino and Galvele [46] reported that lepidocrocite (γ-Fe2O3·H2O) oxide films (yellow brown) was the corrosion product formed on the pure iron in deaerated neutral NaCl electrolytes when AP below the E pit was applied. However, from the colours of the corrosion product in this work, it is deduced that green rusts consisting of ferrous hydroxide Fe(OH)2 (white) and ferric hydroxide Fe(OH)3 (greenish) [47] actually appear on HSHCsw in the deaerated pH 13.4 electrolytes with the presence of NaCl.

(a) Green rust – corrosion products of HSHCsw in deaerated (≤0.5 ppm in oxygen gas content) pH 13.4 electrolyte at 1 M Cl− and −350 mV taken by digital camera. (b) Hydrogen gas produced during active pitting corrosion taken by boroscope. (c) Brownish corrosion products (light microscope: 15×) – obtained after the green rust was exposed to air for some time. (d) SEM images of magnetite Fe3O4. (e) SEM images of magnetite Fe3O4 and maghemite γ-Fe2O3. (f) The EDS spectrum of magnetite Fe3O4. (g) The EDS spectrum of maghemite γ-Fe2O3.
Small bubbles are seen among the green rusts or on the steel wire surface close to the green rusts under active AP corrosion, as shown in Figure 13b, which was taken using borescope. The produced bubbles cannot be oxygen gas coming from the dissociation of water as the applied AP was well below the line b in the Pourbaix diagram in Figure 4. It is hydrogen gas as proposed by previous study [48].
When the electrochemical test was finished, the steel wire with green rust was removed from the deaerated electrolyte and left to expose to air at the room temperature of 21°C. The green rust was observed changing to dark brownish corrosion products, as shown in Figure 13(c). SEM image in Figure 13(d) and (e) shows that the corrosion products are a mix of magnetite Fe3O4 [49,50,51] and maghemite γ-Fe2O3 [52]. The EDS spectra in Figure 13(f) for magnetite Fe3O4 and Figure 13(g) for maghemite γ-Fe2O3 reveal the presence of the element Cl in the corrosion products supporting the fact that Cl− induced depassivation and also penetrated the passive film [53]. Very little of Na+ and K+ were present in the corrosion products due to the repulsive effect from the Fe2+ and Fe3+ inside the pits [53].
From the study of the corrosion products, the production of bubbles, and pit morphology, a schematic diagram of the pitting corrosion propagation as shown in Figure 14 together with the corresponding pitting corrosion mechanism under APA are proposed. At the beginning, the application of AP causes Fe to dissolve into Fe2+ at the weak areas of air-formed passive film, as shown in Figure 14(a). The released Fe2+ will combine immediately with OH− coming from the electrolyte to form the passive film of Fe(OH)2, in Figure 14(b), to cover the weak point.
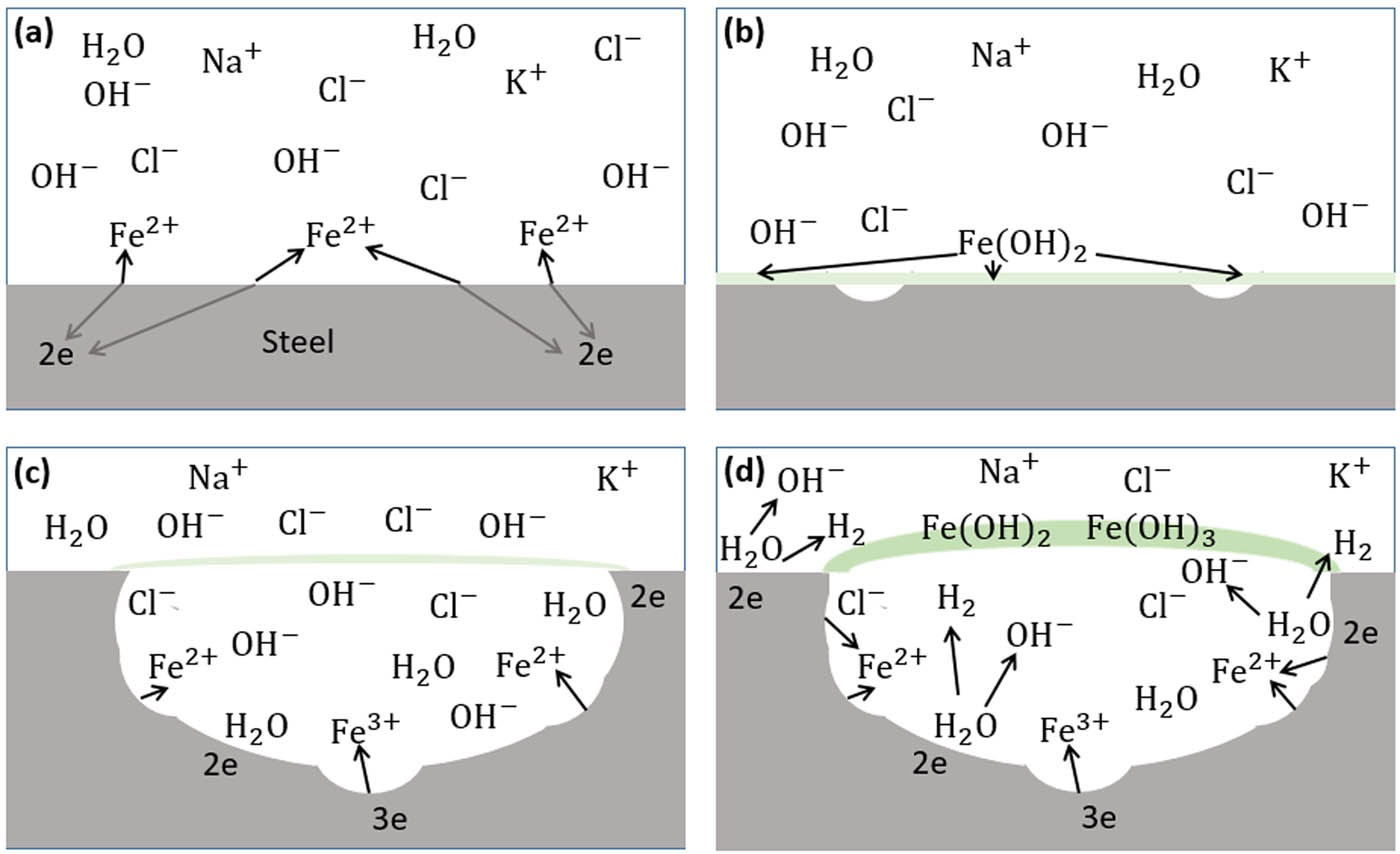
Schematic diagram of pitting corrosion mechanism under anodic potentiostatic application (APA). (a) Fe dissolving to Fe2+ at weak area of air-formed passive film. (b) Fe2+ combined with OH− forming Fe(OH)2 passive film. (c) Further dissolution of Fe to Fe2+ and Fe3+ and penetration of Cl− and OH− from bulk to trapped electrolyte. (d) Formation of green rust (Fe(OH)2 + Fe(OH)3) and H2.
With further APA leading to active pitting corrosion, Fe from the bottom and the wall of the pit will dissolve not only into Fe2+ but also into Fe3+. The dissolution of Fe from the pit wall will thus widen the pit size until individual pits connect to each other [40]. Due to the fact that the passive film is porous and the gradient concentration of Cl− and OH− existing between the bulk electrolyte and the trapped electrolyte, anions will penetrate the passive film and diffuse inside the pits [40], as shown in Figure 14(c). The generated Fe2+ and Fe3+ within the pits will react with OH− in the trapped electrolyte as the chemical reaction below to form the green rust.
In the alkaline medium, H2O inside the trapped electrolyte or in the bulk electrolyte will go through the following reaction with electrons that reach the steel wire surface to produce H2 [48] as shown in Figure 14(d).
The generation of H2 inside the trapped electrolyte together with Cl− can cause local acidification. For iron, it proved theoretically and experimentally that a pH value of 3–4 can exist inside the trapped electrolyte of active pits [54]. When the green rusts become thick and impermeable leading to a complete consumption of the trapped electrolyte, I a will drop as shown in Figure 9(2(a)) and the active corrosions will then terminate for the moment.
4 Conclusion
HSHCsw immersed in the high alkaline of pH 13.4 deaerated electrolyte (≤0.5 ppm) with different Cl− concentrations of 0.1, 0.25, 0.5, 1, 2 and 3 M was investigated for the possibility of pitting corrosion induced on the steel wire surface using the OCP, CPP, and APA. This study has shown that
HSHCsw can sustain in the presence of Cl− as high as 1 M without pitting corrosion under the condition of OCP.
An inverse relationship between APs and Cl− concentrations is found and can be represented with an interpolated second-degree polynomial equation as y = 469.61x 2 – 1029.7x + 208.48 with R 2 being 0.995, only for a range of Cl− concentration between 0.1 and 1 M. This indicates that that HSHCsw will not corrode in the presence of Cl− when AP below the curve is applied within the 48 h time frame. However, the application of AP above the curve will lead to the development of pitting corrosion on HSHCsw.
The theoretical prediction of mass loss after 48 h APA using Faraday´s law will not be valid in the case of severe corrosion.
The corrosion products generated in the deaerated electrolyte at pH 13.4 during the APA are mainly Fe(OH)3 (greenish) and Fe(OH)2 (white) with hydrogen gas produced in adjacent areas or within active pits. The corrosion products will be turned into magnetite Fe3O4 and maghemite γ-Fe2O3 when they are exposed to air.
If the AP is accidentally applied outside the safety margin during the service of anodic protection, the initially generated corrosion will be pitting corrosion. However, further application of AP will not cause the pits to develop deep into the steel leading to embrittlement. The covering of corrosion products on the steel surface encouraging crevice corrosion together with the continuous AP application will induce the merging of pits and the dissolution of Fe from the pit wall. Thus, these phenomena will finally cause the initially generated pitting corrosions to appear as general corrosions on the steel surface.
Acknowledgements
David Hui appreciates the past and ongoing supports from NACE (New Orleans Section). The useful discussions with Charles Speed are acknowledged.
-
Funding information: Authors would like to thank the JAEDOC programme from the Spanish Research Council – El Consejo Superior de Investigaciones Científicas (CSIC).
-
Author contributions: All authors have accepted responsibility for the entire content of this manuscript and approved its submission.
-
Conflict of interest: David Hui, who is the co-author of this article, is a current Editorial Board member of Nanotechnology Reviews. This fact did not affect the peer-review process. The authors declare no other conflict of interest.
References
[1] Kamde DK, Manickam K, Pillai RG, Sergi G. Long-term performance of galvanic anodes for the protection of steel reinforced concrete structures. J Build Eng. 2021;42(103049):1–14.10.1016/j.jobe.2021.103049Search in Google Scholar
[2] Prasad NKR, Pathak AS, Kundu S, Panchal P, Mondal K. The novel approach of sacrificial cathodic protection of mild steel in simulated concrete pore solution and concrete mortar by high phosphorus pig iron anodes. J Mater Res Technol. 2021;14:582–608.10.1016/j.jmrt.2021.06.070Search in Google Scholar
[3] Silva RS, Aleman C, Ferreira CA, Armelin E, Ferreira JZ, Meneguzzi A. Smart paint for anodic protection of steel. Prog Org Coat. 2015;78:116–23.10.1016/j.porgcoat.2014.10.002Search in Google Scholar
[4] Xue S, Shen R, Chen W, Miao R. Corrosion fatigue failure analysis and service life prediction of high strength steel wire. Eng Fail Anal. 2020;110(104440):1–10.10.1016/j.engfailanal.2020.104440Search in Google Scholar
[5] Cui C, Chen A, Ma R. An improved continuum damage mechanics model for evaluating corrosion–fatigue life of high-strength steel wires in the real service environment. Int J Fatigue. 2020;135(105540):1–9.10.1016/j.ijfatigue.2020.105540Search in Google Scholar
[6] Lv M, Chen X, Li Z, Du M. Effect of sulfate-reducing bacteria on hydrogen permeation and stress corrosion cracking behavior of 980 high-strength steel in seawater. J Mater Sci Technol. 2021;92:109–19.10.1016/j.jmst.2021.02.039Search in Google Scholar
[7] Chen A, Yang Y, Ma R, Li L, Tian H, Pan Z. Experimental study of corrosion effects on high-strength steel wires considering strain influence. Constr Build Mater. 2020;240(117910):1–12.10.1016/j.conbuildmat.2019.117910Search in Google Scholar
[8] Sanchez J, Lee SF, Martin-Rengel MA, Fullea J, Andrade C, Ruiz-Hervías J. Measurement of hydrogen and embrittlement of high strength steels. Eng Fail Anal. 2016;59:467–77.10.1016/j.engfailanal.2015.11.001Search in Google Scholar
[9] Díaz B, Freire L, Nóvoa XR, Pérez MC. Electrochemical behaviour of high strength steel wires in the presence of chlorides. Electrochim Acta. 2009;54(22):5190–8.10.1016/j.electacta.2009.01.017Search in Google Scholar
[10] Jain A, Gencturk B, Pirbazari M, Dawood M, Belarbi A, Sohail MG, et al. Influence of pH on chloride binding isotherms for cement paste and its components. Cem Concr Res. 2021;143(106378):1–16.10.1016/j.cemconres.2021.106378Search in Google Scholar
[11] Mayne JEO, Menter JW. The mechanism of inhibition of the corrosion of iron in sodium hydroxide solution. Part II. J Chem Soc. 1954;99–103.10.1039/jr9540000099Search in Google Scholar
[12] Wang X-P, Shao M, Ye C-Q, Dong S-G, Du R-G, Lin C-J. Study on effect of chloride ions on corrosion behavior of reinforcing steel in simulated polluted concrete pore solutions by scanning micro-reference electrode technique. J Electroanal Chem. 2021;895(115454):1–11.10.1016/j.jelechem.2021.115454Search in Google Scholar
[13] Lee SF, Jacobsen S. Study of interfacial microstructure, fracture energy, compressive energy and debonding load of steel fiber-reinforced mortar. Mater Struct. 2011;44:1451–65.10.1617/s11527-011-9710-4Search in Google Scholar
[14] Wang XH, Jacobsen S, He JY, Zhang ZL, Lee SF, Lein HL. Application of nanoindentation testing to study of the interfacial transition zone in steel fiber reinforced mortar. Cem Concr Res. 2009;39:701–15.10.1016/j.cemconres.2009.05.002Search in Google Scholar
[15] Sáez del Bosque IF, Van den Heede P, De Belie N, Sánchez de Rojas MI, Medina C. Freeze-thaw resistance of concrete containing mixed aggregate and construction and demolition waste-additioned cement in water and de-icing salts. Constr Build Mater. 2020;259(119772):1–15.10.1016/j.conbuildmat.2020.119772Search in Google Scholar
[16] Guo K, Miao H, Liu L, Zhou J, Liu M. Effect of graphene oxide on chloride penetration resistance of recycled concrete. Nanotechnol Rev. 2019;8:681–9.10.1515/ntrev-2019-0059Search in Google Scholar
[17] Li D, Wei R, Li L, Guan X, Mi X. Pitting corrosion of reinforcing steel bars in chloride contaminated concrete. Constr Build Mater. 2019;199:359–68.10.1016/j.conbuildmat.2018.12.003Search in Google Scholar
[18] Liu J-C, Park S, Nagao S, Nogi M, Koga H, Ma J-S, et al. The role of Zn precipitates and Cl− anions in pitting corrosion of Sn–Zn solder alloys. Corros Sci. 2015;92:263–71.10.1016/j.corsci.2014.12.014Search in Google Scholar
[19] Chen H, Lu L, Huang Y, Li X. Insight into TiN inclusion induced pit corrosion of interstitial free steel exposed to aerated NaCl solution. J Mater Res Technol. 2021;13:13–24.10.1016/j.jmrt.2021.04.046Search in Google Scholar
[20] Wang Y, Li MY, Zhu F, Dong WT, Zhang XY, Sun LL. Pitting corrosion mechanism of Cl−- and S2−-induced by oxide inclusions in Fe-based amorphous metallic coatings. Surf Coat Technol. 2020;385(125449):1–13.10.1016/j.surfcoat.2020.125449Search in Google Scholar
[21] Scott GN. Corrosion protection properties of portland cement concrete. J Am Water Work Assoc. 1965;57(8):1038–52.10.1002/j.1551-8833.1965.tb01495.xSearch in Google Scholar
[22] Hausmann DA. Steel corrosion in concrete – How does it occur. Mater Prot. 1967;19–23.Search in Google Scholar
[23] Gulbransen EA. Thin oxide films on Iron. Trans Electrochem Soc. 1942;81:327–39.10.1149/1.3071383Search in Google Scholar
[24] Zhang B, San XY, Wei XX, Wu B, Zheng SJ, Zhou YT, et al. Quasi-in-situ observing the growth of native oxide film on the FeCr15Ni15 austenitic alloy by TEM. Corros Sci. 2018;140:1–7.10.1016/j.corsci.2018.06.029Search in Google Scholar
[25] Abd El Aal EE, Abd El Wanees S, Diab A, Abd El Haleem SM. Environmental factors affecting the corrosion behavior of reinforcing steel III. Measurement of pitting corrosion currents of steel in Ca(OH)2 solutions under natural corrosion conditions. Corros Sci. 2009;51(8):1611–8.10.1016/j.corsci.2009.04.006Search in Google Scholar
[26] Pourbaix M. Atlas of electrochemical equilibria in aqueous solutions. Houston: Pergamon Press Ltd; 1966.Search in Google Scholar
[27] Umar A, Ibrahim AA, Kumar R, Albargi H, Alsaiari MA, Ahmed F. Cubic shaped hematite (α-Fe2O3) micro-structures composed of stacked nanosheets for rapid ethanol sensor application. Sens Actuat B-Chem. 2021;326(128851):1–9.10.1016/j.snb.2020.128851Search in Google Scholar
[28] Tait WS. Chapter 5 – Electrochemical corrosion basics. In: Kutz M, editor. Handbook of environmental degradation of materials. 3rd edn. New York: William Andrew Applied Science Publishers; 2018. p. 97–11510.1016/B978-0-323-52472-8.00005-8Search in Google Scholar
[29] Alvarez SM, Bautista A, Velasco F. Corrosion behaviour of corrugated lean duplex stainless steels in simulated concrete pore solutions. Corros Sci. 2011;53(5):1748–55.10.1016/j.corsci.2011.01.050Search in Google Scholar
[30] Shi J, Sun W, Jiang J, Zhang Y. Influence of chloride concentration and pre-passivation on the pitting corrosion resistance of low-alloy reinforcing steel in simulated concrete pore solution. Constr Build Mater. 2016;111:805–13.10.1016/j.conbuildmat.2016.02.107Search in Google Scholar
[31] Moser RD, Singh PM, Kahn LF, Kurtis KE. Chloride-induced corrosion resistance of high-strength stainless steels in simulated alkaline and carbonated concrete pore solutions. Corros Sci. 2012;57:241–53.10.1016/j.corsci.2011.12.012Search in Google Scholar
[32] Hoar TP, Jacob WR. Breakdown of passivity of stainless steel by halide Ions. Nature. 1967;216(5122):1299–301.10.1038/2161299a0Search in Google Scholar
[33] Amin MA, Hassan HH, Abd El Rehim SS. On the role of NO2− ions in passivity breakdown of Zn in deaerated neutral sodium nitrite solutions and the effect of some inorganic inhibitors – potentiodynamic polarization, cyclic voltammetry, SEM and EDX studies. Electrochim Acta. 2008;53:2600–9.10.1016/j.electacta.2007.10.034Search in Google Scholar
[34] Bellezze T, Giuliani G, Roventi G. Study of stainless steels corrosion in a strong acid mixture. Part 1: cyclic potentiodynamic polarization curves examined by means of an analytical method. Corros Sci. 2018;130:113–25.10.1016/j.corsci.2017.10.012Search in Google Scholar
[35] Ormellese M, Lazzari L, Goidanich S, Fumagalli G, Brenna A. A study of organic substances as inhibitors for chloride-induced corrosion in concrete. Corros Sci. 2009;51:2959–68.10.1016/j.corsci.2009.08.018Search in Google Scholar
[36] Finsgara M, Fassbender S, Hirth S, Milosev I. Electrochemical and XPS study of polyethyleneimines of different molecular sizes as corrosion inhibitors for AISI 430 stainless steel in near-neutral chloride media. Mater Chem Phys. 2009;116:198–206.10.1016/j.matchemphys.2009.03.010Search in Google Scholar
[37] Yuan X, Wang X, Cao Y, Yang H. Natural passivation behavior and its influence on chloride-induced corrosion resistance of stainless steel in simulated concrete pore solution. J Mater Res Technol. 2020;9(6):12378–90.10.1016/j.jmrt.2020.08.056Search in Google Scholar
[38] Liu M, Cheng X, Li X, Zhou C, Tan H. Effect of carbonation on the electrochemical behavior of corrosion resistance low alloy steel rebars in cement extract solution. Constr Build Mater. 2017;130:193–201.10.1016/j.conbuildmat.2016.10.003Search in Google Scholar
[39] Zhong L, Xiao S, Hu J, Zhu H, Gan F. Application of polyaniline to galvanic anodic protection on stainless steel in H2SO4 solutions. Corros Sci. 2006;48:3960–8.10.1016/j.corsci.2006.04.019Search in Google Scholar
[40] Wang Y, Cheng G, Wu W, Qiao Q, Li Y, Li X. Effect of pH and chloride on the micro-mechanism of pitting corrosion for high strength pipeline steel in aerated NaCl solutions. Appl Surf Sci. 2015;349:746–56.10.1016/j.apsusc.2015.05.053Search in Google Scholar
[41] Mohammed S, Hua Y, Barker R, Neville A. Investigating pitting in X65 carbon steel using potentiostatic polarisation. Appl Surf Sci. 2017;423:25–32.10.1016/j.apsusc.2017.06.015Search in Google Scholar
[42] Zhang S, Li Y, Wei Y, Liu B, Du H, Wei H, et al. Synergistic effect of chloride ions and filmed surface on pitting in the pseudo-passivation behavior of carbon steel. Vacuum. 2021;185(110042):1–4.10.1016/j.vacuum.2020.110042Search in Google Scholar
[43] Dong F, Venezuela J, Li H, Shi Z, Zhou Q, Chen L, et al. Effect of vanadium and rare earth microalloying on the hydrogen embrittlement susceptibility of a Fe-18Mn-0.6C TWIP steel studied using the linearly increasing stress test. Corros Sci. 2021;185(109440):1–17.10.1016/j.corsci.2021.109440Search in Google Scholar
[44] Kim K-S, Kang J-H, Kim S-J. Carbon effect on hydrogen diffusivity and embrittlement in austenitic stainless steels. Corros Sci. 2021;180(109226):1–9.10.1016/j.corsci.2020.109226Search in Google Scholar
[45] Dong ZH, Shi W, Guo XP. Initiation and repassivation of pitting corrosion of carbon steel in carbonated concrete pore solution. Corros Sci. 2011;53:1322–30.10.1016/j.corsci.2010.12.028Search in Google Scholar
[46] Semino CJ, Galvele JR. Passivity breakdown of high purity iron and AISI 4340 steel in 0.5M NaCl solution. Corros Sci. 1976;16(5):297–306.10.1016/0010-938X(76)90115-3Search in Google Scholar
[47] Ya V, Martin N, Chou Y-H, Chen Y-M, Choo K-H, Chen S-S, et al. Electrochemical treatment for simultaneous removal of heavy metals and organics from surface finishing wastewater using sacrificial iron anode. J Taiwan Inst Chem Eng. 2018;83:107–14.10.1016/j.jtice.2017.12.004Search in Google Scholar
[48] Huang Y, Liu X, Zhang Q, Xu Y, Kunte H-J, De, et al. Hydrogen release from carbon steel in chloride solution under anodic polarization. Int J Hydrog Energy. 2020;45:3307–15.10.1016/j.ijhydene.2019.11.218Search in Google Scholar
[49] Targhoo A, Amiri A, Baghayeri M. Magnetic nanoparticles coated with poly(p-phenylenediamine-co-thiophene) as a sorbent for preconcentration of organophosphorus pesticides. Microchim Acta. 2018;185(15):1–8.10.1007/s00604-017-2560-1Search in Google Scholar PubMed
[50] Mahdavi M, Bin Ahmad M, Haron MJ, Namvar F, Nadi B, Rahman MZA, et al. Synthesis, surface modification and characterisation of biocompatible magnetic iron oxide nanoparticles for biomedical applications. Molecules. 2013;18:7533–48.10.3390/molecules18077533Search in Google Scholar PubMed PubMed Central
[51] Ma P, Luo Q, Chen J, Gan Y, Du J, Ding S, et al. Intraperitoneal injection of magnetic Fe3O4-nanoparticle induces hepatic and renal tissue injury via oxidative stress in mice. Int J Nanomed. 2012;7:4809–18.10.2147/IJN.S34349Search in Google Scholar PubMed PubMed Central
[52] Chougale UM, Fulari VJ. Facile synthesis of maghemite nanoflakes arrays for supercapacitor application. Mater Sci Semicond Process. 2014;27:682–8.10.1016/j.mssp.2014.08.015Search in Google Scholar
[53] Shi J, Li M, Wu M, Ming J. Role of red mud in natural passivation and chloride-induced depassivation of reinforcing steels in alkaline concrete pore solutions. Corros Sci. 2021;190(109669):1–16.10.1016/j.corsci.2021.109669Search in Google Scholar
[54] Galvele JR. Transport Processes and mechanism of pitting of metals. J Electrochem Soc. 1976;123(4):464–74.10.1149/1.2132857Search in Google Scholar
© 2022 Siaw Foon Lee et al., published by De Gruyter
This work is licensed under the Creative Commons Attribution 4.0 International License.
Articles in the same Issue
- Research Articles
- Theoretical and experimental investigation of MWCNT dispersion effect on the elastic modulus of flexible PDMS/MWCNT nanocomposites
- Mechanical, morphological, and fracture-deformation behavior of MWCNTs-reinforced (Al–Cu–Mg–T351) alloy cast nanocomposites fabricated by optimized mechanical milling and powder metallurgy techniques
- Flammability and physical stability of sugar palm crystalline nanocellulose reinforced thermoplastic sugar palm starch/poly(lactic acid) blend bionanocomposites
- Glutathione-loaded non-ionic surfactant niosomes: A new approach to improve oral bioavailability and hepatoprotective efficacy of glutathione
- Relationship between mechano-bactericidal activity and nanoblades density on chemically strengthened glass
- In situ regulation of microstructure and microwave-absorbing properties of FeSiAl through HNO3 oxidation
- Research on a mechanical model of magnetorheological fluid different diameter particles
- Nanomechanical and dynamic mechanical properties of rubber–wood–plastic composites
- Investigative properties of CeO2 doped with niobium: A combined characterization and DFT studies
- Miniaturized peptidomimetics and nano-vesiculation in endothelin types through probable nano-disk formation and structure property relationships of endothelins’ fragments
- N/S co-doped CoSe/C nanocubes as anode materials for Li-ion batteries
- Synergistic effects of halloysite nanotubes with metal and phosphorus additives on the optimal design of eco-friendly sandwich panels with maximum flame resistance and minimum weight
- Octreotide-conjugated silver nanoparticles for active targeting of somatostatin receptors and their application in a nebulized rat model
- Controllable morphology of Bi2S3 nanostructures formed via hydrothermal vulcanization of Bi2O3 thin-film layer and their photoelectrocatalytic performances
- Development of (−)-epigallocatechin-3-gallate-loaded folate receptor-targeted nanoparticles for prostate cancer treatment
- Enhancement of the mechanical properties of HDPE mineral nanocomposites by filler particles modulation of the matrix plastic/elastic behavior
- Effect of plasticizers on the properties of sugar palm nanocellulose/cinnamon essential oil reinforced starch bionanocomposite films
- Optimization of nano coating to reduce the thermal deformation of ball screws
- Preparation of efficient piezoelectric PVDF–HFP/Ni composite films by high electric field poling
- MHD dissipative Casson nanofluid liquid film flow due to an unsteady stretching sheet with radiation influence and slip velocity phenomenon
- Effects of nano-SiO2 modification on rubberised mortar and concrete with recycled coarse aggregates
- Mechanical and microscopic properties of fiber-reinforced coal gangue-based geopolymer concrete
- Effect of morphology and size on the thermodynamic stability of cerium oxide nanoparticles: Experiment and molecular dynamics calculation
- Mechanical performance of a CFRP composite reinforced via gelatin-CNTs: A study on fiber interfacial enhancement and matrix enhancement
- A practical review over surface modification, nanopatterns, emerging materials, drug delivery systems, and their biophysiochemical properties for dental implants: Recent progresses and advances
- HTR: An ultra-high speed algorithm for cage recognition of clathrate hydrates
- Effects of microalloying elements added by in situ synthesis on the microstructure of WCu composites
- A highly sensitive nanobiosensor based on aptamer-conjugated graphene-decorated rhodium nanoparticles for detection of HER2-positive circulating tumor cells
- Progressive collapse performance of shear strengthened RC frames by nano CFRP
- Core–shell heterostructured composites of carbon nanotubes and imine-linked hyperbranched polymers as metal-free Li-ion anodes
- A Galerkin strategy for tri-hybridized mixture in ethylene glycol comprising variable diffusion and thermal conductivity using non-Fourier’s theory
- Simple models for tensile modulus of shape memory polymer nanocomposites at ambient temperature
- Preparation and morphological studies of tin sulfide nanoparticles and use as efficient photocatalysts for the degradation of rhodamine B and phenol
- Polyethyleneimine-impregnated activated carbon nanofiber composited graphene-derived rice husk char for efficient post-combustion CO2 capture
- Electrospun nanofibers of Co3O4 nanocrystals encapsulated in cyclized-polyacrylonitrile for lithium storage
- Pitting corrosion induced on high-strength high carbon steel wire in high alkaline deaerated chloride electrolyte
- Formulation of polymeric nanoparticles loaded sorafenib; evaluation of cytotoxicity, molecular evaluation, and gene expression studies in lung and breast cancer cell lines
- Engineered nanocomposites in asphalt binders
- Influence of loading voltage, domain ratio, and additional load on the actuation of dielectric elastomer
- Thermally induced hex-graphene transitions in 2D carbon crystals
- The surface modification effect on the interfacial properties of glass fiber-reinforced epoxy: A molecular dynamics study
- Molecular dynamics study of deformation mechanism of interfacial microzone of Cu/Al2Cu/Al composites under tension
- Nanocolloid simulators of luminescent solar concentrator photovoltaic windows
- Compressive strength and anti-chloride ion penetration assessment of geopolymer mortar merging PVA fiber and nano-SiO2 using RBF–BP composite neural network
- Effect of 3-mercapto-1-propane sulfonate sulfonic acid and polyvinylpyrrolidone on the growth of cobalt pillar by electrodeposition
- Dynamics of convective slippery constraints on hybrid radiative Sutterby nanofluid flow by Galerkin finite element simulation
- Preparation of vanadium by the magnesiothermic self-propagating reduction and process control
- Microstructure-dependent photoelectrocatalytic activity of heterogeneous ZnO–ZnS nanosheets
- Cytotoxic and pro-inflammatory effects of molybdenum and tungsten disulphide on human bronchial cells
- Improving recycled aggregate concrete by compression casting and nano-silica
- Chemically reactive Maxwell nanoliquid flow by a stretching surface in the frames of Newtonian heating, nonlinear convection and radiative flux: Nanopolymer flow processing simulation
- Nonlinear dynamic and crack behaviors of carbon nanotubes-reinforced composites with various geometries
- Biosynthesis of copper oxide nanoparticles and its therapeutic efficacy against colon cancer
- Synthesis and characterization of smart stimuli-responsive herbal drug-encapsulated nanoniosome particles for efficient treatment of breast cancer
- Homotopic simulation for heat transport phenomenon of the Burgers nanofluids flow over a stretching cylinder with thermal convective and zero mass flux conditions
- Incorporation of copper and strontium ions in TiO2 nanotubes via dopamine to enhance hemocompatibility and cytocompatibility
- Mechanical, thermal, and barrier properties of starch films incorporated with chitosan nanoparticles
- Mechanical properties and microstructure of nano-strengthened recycled aggregate concrete
- Glucose-responsive nanogels efficiently maintain the stability and activity of therapeutic enzymes
- Tunning matrix rheology and mechanical performance of ultra-high performance concrete using cellulose nanofibers
- Flexible MXene/copper/cellulose nanofiber heat spreader films with enhanced thermal conductivity
- Promoted charge separation and specific surface area via interlacing of N-doped titanium dioxide nanotubes on carbon nitride nanosheets for photocatalytic degradation of Rhodamine B
- Elucidating the role of silicon dioxide and titanium dioxide nanoparticles in mitigating the disease of the eggplant caused by Phomopsis vexans, Ralstonia solanacearum, and root-knot nematode Meloidogyne incognita
- An implication of magnetic dipole in Carreau Yasuda liquid influenced by engine oil using ternary hybrid nanomaterial
- Robust synthesis of a composite phase of copper vanadium oxide with enhanced performance for durable aqueous Zn-ion batteries
- Tunning self-assembled phases of bovine serum albumin via hydrothermal process to synthesize novel functional hydrogel for skin protection against UVB
- A comparative experimental study on damping properties of epoxy nanocomposite beams reinforced with carbon nanotubes and graphene nanoplatelets
- Lightweight and hydrophobic Ni/GO/PVA composite aerogels for ultrahigh performance electromagnetic interference shielding
- Research on the auxetic behavior and mechanical properties of periodically rotating graphene nanostructures
- Repairing performances of novel cement mortar modified with graphene oxide and polyacrylate polymer
- Closed-loop recycling and fabrication of hydrophilic CNT films with high performance
- Design of thin-film configuration of SnO2–Ag2O composites for NO2 gas-sensing applications
- Study on stress distribution of SiC/Al composites based on microstructure models with microns and nanoparticles
- PVDF green nanofibers as potential carriers for improving self-healing and mechanical properties of carbon fiber/epoxy prepregs
- Osteogenesis capability of three-dimensionally printed poly(lactic acid)-halloysite nanotube scaffolds containing strontium ranelate
- Silver nanoparticles induce mitochondria-dependent apoptosis and late non-canonical autophagy in HT-29 colon cancer cells
- Preparation and bonding mechanisms of polymer/metal hybrid composite by nano molding technology
- Damage self-sensing and strain monitoring of glass-reinforced epoxy composite impregnated with graphene nanoplatelet and multiwalled carbon nanotubes
- Thermal analysis characterisation of solar-powered ship using Oldroyd hybrid nanofluids in parabolic trough solar collector: An optimal thermal application
- Pyrene-functionalized halloysite nanotubes for simultaneously detecting and separating Hg(ii) in aqueous media: A comprehensive comparison on interparticle and intraparticle excimers
- Fabrication of self-assembly CNT flexible film and its piezoresistive sensing behaviors
- Thermal valuation and entropy inspection of second-grade nanoscale fluid flow over a stretching surface by applying Koo–Kleinstreuer–Li relation
- Mechanical properties and microstructure of nano-SiO2 and basalt-fiber-reinforced recycled aggregate concrete
- Characterization and tribology performance of polyaniline-coated nanodiamond lubricant additives
- Combined impact of Marangoni convection and thermophoretic particle deposition on chemically reactive transport of nanofluid flow over a stretching surface
- Spark plasma extrusion of binder free hydroxyapatite powder
- An investigation on thermo-mechanical performance of graphene-oxide-reinforced shape memory polymer
- Effect of nanoadditives on the novel leather fiber/recycled poly(ethylene-vinyl-acetate) polymer composites for multifunctional applications: Fabrication, characterizations, and multiobjective optimization using central composite design
- Design selection for a hemispherical dimple core sandwich panel using hybrid multi-criteria decision-making methods
- Improving tensile strength and impact toughness of plasticized poly(lactic acid) biocomposites by incorporating nanofibrillated cellulose
- Green synthesis of spinel copper ferrite (CuFe2O4) nanoparticles and their toxicity
- The effect of TaC and NbC hybrid and mono-nanoparticles on AA2024 nanocomposites: Microstructure, strengthening, and artificial aging
- Excited-state geometry relaxation of pyrene-modified cellulose nanocrystals under UV-light excitation for detecting Fe3+
- Effect of CNTs and MEA on the creep of face-slab concrete at an early age
- Effect of deformation conditions on compression phase transformation of AZ31
- Application of MXene as a new generation of highly conductive coating materials for electromembrane-surrounded solid-phase microextraction
- A comparative study of the elasto-plastic properties for ceramic nanocomposites filled by graphene or graphene oxide nanoplates
- Encapsulation strategies for improving the biological behavior of CdS@ZIF-8 nanocomposites
- Biosynthesis of ZnO NPs from pumpkin seeds’ extract and elucidation of its anticancer potential against breast cancer
- Preliminary trials of the gold nanoparticles conjugated chrysin: An assessment of anti-oxidant, anti-microbial, and in vitro cytotoxic activities of a nanoformulated flavonoid
- Effect of micron-scale pores increased by nano-SiO2 sol modification on the strength of cement mortar
- Fractional simulations for thermal flow of hybrid nanofluid with aluminum oxide and titanium oxide nanoparticles with water and blood base fluids
- The effect of graphene nano-powder on the viscosity of water: An experimental study and artificial neural network modeling
- Development of a novel heat- and shear-resistant nano-silica gelling agent
- Characterization, biocompatibility and in vivo of nominal MnO2-containing wollastonite glass-ceramic
- Entropy production simulation of second-grade magnetic nanomaterials flowing across an expanding surface with viscidness dissipative flux
- Enhancement in structural, morphological, and optical properties of copper oxide for optoelectronic device applications
- Aptamer-functionalized chitosan-coated gold nanoparticle complex as a suitable targeted drug carrier for improved breast cancer treatment
- Performance and overall evaluation of nano-alumina-modified asphalt mixture
- Analysis of pure nanofluid (GO/engine oil) and hybrid nanofluid (GO–Fe3O4/engine oil): Novel thermal and magnetic features
- Synthesis of Ag@AgCl modified anatase/rutile/brookite mixed phase TiO2 and their photocatalytic property
- Mechanisms and influential variables on the abrasion resistance hydraulic concrete
- Synergistic reinforcement mechanism of basalt fiber/cellulose nanocrystals/polypropylene composites
- Achieving excellent oxidation resistance and mechanical properties of TiB2–B4C/carbon aerogel composites by quick-gelation and mechanical mixing
- Microwave-assisted sol–gel template-free synthesis and characterization of silica nanoparticles obtained from South African coal fly ash
- Pulsed laser-assisted synthesis of nano nickel(ii) oxide-anchored graphitic carbon nitride: Characterizations and their potential antibacterial/anti-biofilm applications
- Effects of nano-ZrSi2 on thermal stability of phenolic resin and thermal reusability of quartz–phenolic composites
- Benzaldehyde derivatives on tin electroplating as corrosion resistance for fabricating copper circuit
- Mechanical and heat transfer properties of 4D-printed shape memory graphene oxide/epoxy acrylate composites
- Coupling the vanadium-induced amorphous/crystalline NiFe2O4 with phosphide heterojunction toward active oxygen evolution reaction catalysts
- Graphene-oxide-reinforced cement composites mechanical and microstructural characteristics at elevated temperatures
- Gray correlation analysis of factors influencing compressive strength and durability of nano-SiO2 and PVA fiber reinforced geopolymer mortar
- Preparation of layered gradient Cu–Cr–Ti alloy with excellent mechanical properties, thermal stability, and electrical conductivity
- Recovery of Cr from chrome-containing leather wastes to develop aluminum-based composite material along with Al2O3 ceramic particles: An ingenious approach
- Mechanisms of the improved stiffness of flexible polymers under impact loading
- Anticancer potential of gold nanoparticles (AuNPs) using a battery of in vitro tests
- Review Articles
- Proposed approaches for coronaviruses elimination from wastewater: Membrane techniques and nanotechnology solutions
- Application of Pickering emulsion in oil drilling and production
- The contribution of microfluidics to the fight against tuberculosis
- Graphene-based biosensors for disease theranostics: Development, applications, and recent advancements
- Synthesis and encapsulation of iron oxide nanorods for application in magnetic hyperthermia and photothermal therapy
- Contemporary nano-architectured drugs and leads for ανβ3 integrin-based chemotherapy: Rationale and retrospect
- State-of-the-art review of fabrication, application, and mechanical properties of functionally graded porous nanocomposite materials
- Insights on magnetic spinel ferrites for targeted drug delivery and hyperthermia applications
- A review on heterogeneous oxidation of acetaminophen based on micro and nanoparticles catalyzed by different activators
- Early diagnosis of lung cancer using magnetic nanoparticles-integrated systems
- Advances in ZnO: Manipulation of defects for enhancing their technological potentials
- Efficacious nanomedicine track toward combating COVID-19
- A review of the design, processes, and properties of Mg-based composites
- Green synthesis of nanoparticles for varied applications: Green renewable resources and energy-efficient synthetic routes
- Two-dimensional nanomaterial-based polymer composites: Fundamentals and applications
- Recent progress and challenges in plasmonic nanomaterials
- Apoptotic cell-derived micro/nanosized extracellular vesicles in tissue regeneration
- Electronic noses based on metal oxide nanowires: A review
- Framework materials for supercapacitors
- An overview on the reproductive toxicity of graphene derivatives: Highlighting the importance
- Antibacterial nanomaterials: Upcoming hope to overcome antibiotic resistance crisis
- Research progress of carbon materials in the field of three-dimensional printing polymer nanocomposites
- A review of atomic layer deposition modelling and simulation methodologies: Density functional theory and molecular dynamics
- Recent advances in the preparation of PVDF-based piezoelectric materials
- Recent developments in tensile properties of friction welding of carbon fiber-reinforced composite: A review
- Comprehensive review of the properties of fly ash-based geopolymer with additive of nano-SiO2
- Perspectives in biopolymer/graphene-based composite application: Advances, challenges, and recommendations
- Graphene-based nanocomposite using new modeling molecular dynamic simulations for proposed neutralizing mechanism and real-time sensing of COVID-19
- Nanotechnology application on bamboo materials: A review
- Recent developments and future perspectives of biorenewable nanocomposites for advanced applications
- Nanostructured lipid carrier system: A compendium of their formulation development approaches, optimization strategies by quality by design, and recent applications in drug delivery
- 3D printing customized design of human bone tissue implant and its application
- Design, preparation, and functionalization of nanobiomaterials for enhanced efficacy in current and future biomedical applications
- A brief review of nanoparticles-doped PEDOT:PSS nanocomposite for OLED and OPV
- Nanotechnology interventions as a putative tool for the treatment of dental afflictions
- Recent advancements in metal–organic frameworks integrating quantum dots (QDs@MOF) and their potential applications
- A focused review of short electrospun nanofiber preparation techniques for composite reinforcement
- Microstructural characteristics and nano-modification of interfacial transition zone in concrete: A review
- Latest developments in the upconversion nanotechnology for the rapid detection of food safety: A review
- Strategic applications of nano-fertilizers for sustainable agriculture: Benefits and bottlenecks
- Molecular dynamics application of cocrystal energetic materials: A review
- Synthesis and application of nanometer hydroxyapatite in biomedicine
- Cutting-edge development in waste-recycled nanomaterials for energy storage and conversion applications
- Biological applications of ternary quantum dots: A review
- Nanotherapeutics for hydrogen sulfide-involved treatment: An emerging approach for cancer therapy
- Application of antibacterial nanoparticles in orthodontic materials
- Effect of natural-based biological hydrogels combined with growth factors on skin wound healing
- Nanozymes – A route to overcome microbial resistance: A viewpoint
- Recent developments and applications of smart nanoparticles in biomedicine
- Contemporary review on carbon nanotube (CNT) composites and their impact on multifarious applications
- Interfacial interactions and reinforcing mechanisms of cellulose and chitin nanomaterials and starch derivatives for cement and concrete strength and durability enhancement: A review
- Diamond-like carbon films for tribological modification of rubber
- Layered double hydroxides (LDHs) modified cement-based materials: A systematic review
- Recent research progress and advanced applications of silica/polymer nanocomposites
- Modeling of supramolecular biopolymers: Leading the in silico revolution of tissue engineering and nanomedicine
- Recent advances in perovskites-based optoelectronics
- Biogenic synthesis of palladium nanoparticles: New production methods and applications
- A comprehensive review of nanofluids with fractional derivatives: Modeling and application
- Electrospinning of marine polysaccharides: Processing and chemical aspects, challenges, and future prospects
- Electrohydrodynamic printing for demanding devices: A review of processing and applications
- Rapid Communications
- Structural material with designed thermal twist for a simple actuation
- Recent advances in photothermal materials for solar-driven crude oil adsorption