Fractal analysis of retinal vasculature in relation with retinal diseases – an machine learning approach
-
Deepika Venkataramani
 ,
Jeyalakshmi Veeranan
,
Jeyalakshmi Veeranan

Abstract
Diabetic retinopathy (DR) is caused by diabetes mellitus. Vision loss occurs as a result of DR. The goal of this study was to use the DIARETDB-1, DIARETDB-0, STARE, MESSIDOR, E-ophtha-EX, and E-ophtha-MA databases to do Fourier fractal analysis and see how it is related to retinal illnesses. Following the extraction and inversion of colour channels, blood vessel augmentation was conducted. For the blood vessel enhanced image, the fractal dimension was determined. For DR patients and normal patients, measures such as standard deviation, mean, and significance were calculated. In the E-ophtha-EX database, significance was realized. In the DIARETDB-1, STARE, and DIARETDB-0 databases, the mean fractal value for normal patients is higher than for DR patients. The STARE database’s forecast of the association between fractal dimensions and various retinal disorders and the E-ophtha-EX database’s accomplishment of significance are the study’s main highlights. This study also improved the robustness of the blood vessel extraction there and increased the accuracy of its diagnosis.
1 Introduction
Many important eye diseases as well as systemic diseases manifest themselves in the retina. Diseases such as diabetic retinopathy (DR), glaucoma, and macular degeneration are predominant. DR is caused by changes in the blood vessels of the retina and prolonged type-2 diabetes. It is common in both the genders. The indications of DR are hard and soft exudates, microaneurysms, macular edema, neovascularization, and haemorrhages. The abnormal permeability of retinal blood vessel results in formation of microaneurysm. Computer-aided diagnosis has served as a boon for early detection and diagnosis for retinal diseases. It helps the physician to enhance his diagnostic opinion on image interpretation and proceed with appropriate treatment. Retinal imaging helps to assess retinal vasculature, identify retinal lesions, and analyse the retinal morphology and shape to diagnose DR. Multifarious structure in retina is due to non-linear retinal branching pattern. Vascular changes in retina are related to DR, hypertension, and risk of macular edema [1–8]. Long-term diabetes leads to DR which in turn leads to vision loss [9,10]. Retinal images have been evaluated to spot vascular and non-vascular pathologies in retina. To inhibit vision loss, deviations in blood vessel pattern can be identified quickly [11,12].
Analysis of retinal images is very important for diagnosing the diseases related to the eye. Early recognition of these changes in the blood vessel patterns makes it possible to provide early intervention so as to prevent blindness. Diagnosing the prognosis of DR is very important for deciding the course of the treatment and the stage of DR. Early detection and monitoring the progress of the disease are crucial aspects in DR and this forms the motivation of this study. There is a lack of a suitable diagnostic method for analysing the retinal images. So, there is a dire need to examine the retinal images precisely for effective diagnosis and treatment. Diagnosis of DR requires a predictive modelling approach. Fractal dimensions play a vital role in analysing the various medical data as well as images. Its effectiveness is also good in diagnosing retinal diseases. Moreover, no trials have been carried out so far to study the behaviour of fractals in blood vessel enhanced retinal images. Hence in this study it was proposed to use fractal dimensions for analysing blood vessel enhanced retinal images.
Measurement of fractal dimension of retina can be indicated using DR [11–13]. Few studies show that fractal dimension is low for pathological images [14–16]. A fractal is a kind of geometric representation. Fractals allow the description of entities which divide frequently [17,18]. Fractal analysis is done to estimate fractal characters. Fractal dimensions are useful in analysing the structural differences and abnormalities. Fractals are of two types which include the monofractals, which are ordinary fractals, and multifractals, which are a grouping of monofractals. These multifractals give rise to an exponential value. Fractal dimension is obtained as a single value in the case of monofractals. Box counting, Hausdorff fractal dimension (HFD), Fourier fractal dimension (FFD), and modified Hausdorff fractal dimension are the frequently used fractal analysis techniques [19–22]. They are widely used in various medical applications. Box counting is used for lung cancer detection [23]. FFD is used for quantifying electroencephalograms for a group of children with problem of attention [24].
Monofractals are preferred in this study as a single value would serve as a threshold and help in differentiating between the diseased and normal images. In retinal image analysis, the blood vessels in the image have to be extracted or enhanced to aid better visualization and prediction. Existing studies focus on retinal image analysis using HFD. Application of HFD to retinal images requires the process of blood vessel extraction. But blood vessel extraction is a time-consuming process and may end up in computational complexity. Moreover, HFD may not yield better accuracy in detection for certain types of retinal images. Hence, in this study it was proposed to implement analysis of retinal images using FFD. FFD can be applied to the enhanced retinal images to aid in precise diagnosis. The present study overcomes these shortcomings. The computational time was less and better detection of minute blood vessels was achieved which in turn contributed in diagnosing the presence or absence of DR. This study also contributes to non-linearity as the presence or absence of retinal diseases vary in every individual depending on the location of abnormality/lesions in the retinal images. The distribution of data points contributing to abnormality is widely distributed over the feature space. Machine learning algorithms play a vital role in prediction of diseases. Machine learning algorithms function based on the input features. In retinal images, machine learning algorithms help to predict the retinal diseases as well. Fractal dimensions can be applied on the retinal images and the obtained fractal values can be used as input to the machine learning algorithms for better prediction of retinal diseases.
2 Related work
Techniques used for retinal image analysis were broadly studied. Neuro-fuzzy technique was used to detect exudates. First, the RGB image was converted to grayscale then features were extracted using the fuzzy technique. These features were given as input to layers of artificial neural network, and exudates were obtained. Accuracy of 95.4% was achieved in this method [25]. Naive Bayesian was used to detect microaneurysms. Image was pre-processed and Hessian matrix was used to segment the blood vessels. After segmentation of blood vessels, only microaneurysms were present. Features of microaneurysms were extracted using directional local contrast and the extracted features were given as input for Naive Bayesian, support vector machine (SVM), and k-NN. Naive Bayesian performed well in obtaining microaneurysms only [26].
Variational mode decomposition (VMD) and textural features to detect haemorrhages. To the input image, VMD was applied and four modes were obtained. Texture features were applied and haemorrhage features were extracted. The extracted features were given separately for classifiers like SVM, linear discriminant analysis, feedforward neural network, k-NN, and Naive Bayesian which help to obtain haemorrhages. It helped in distinguishing healthy and unhealthy retinas, achieving higher accuracy. Accuracy of 100% was achieved for k-NN, SVM, and Naïve Bayes [27]. The existing studies focused on segmenting the lesions and detecting the symptoms of DR. But there is a need to detect the disease so that it could serve as an efficient preliminary diagnostic technique.
In medical image diagnostics, use of fractal analysis has greatly contributed in enhancing the accuracy of detection and classification of abnormalities. Katz method was used in fractal analysis for detecting the disorders in the brain. Electroencephalography (EEG) data were recorded. The recorded data were pre-processed using band pass filtering. Katz fractal dimension was used to compute the pre-processed EEG signal. The fractal dimension values were subjected to T-test and the correlation was obtained. It can be used only for signals [28]. Box counting method was used for lung cancer detection. The fractal dimension of tumour region was determined using Box counting. U-test was applied to the fractal features and good significance was achieved. Limited samples were used in their work [29].
Higuchis method was used for haemodynamic activity characterization. MRI brain image was pre-processed with spatial smoothing with Gaussian Kernel. Principal component analysis was used to analyse the different activities of the brain. Higuchis fractal dimension was used to detect the activities which have higher frequencies. Then significance test was done for activities which correspond to higher fractal frequencies [30]. The above survey indicates that fractal analysis has aided in image interpretation, diagnosis, and decision making.
Use of fractal analysis methods in retinal images was extensively studied. Detection of the blood vessel by matched filtering and morphological opening is performed and the fractal dimension is calculated by Box counting. The value of fractal dimension is used to classify DR. The fractal dimension value was higher for retinopathy patients when compared to normal patients [31].
Computer-aided methodology and edge enhancement was used for retinal blood vessel extraction. Box counting was used for fractal dimensions. Fractal dimension was calculated in different layers like retinal nerve fibre layer, inner nuclear layer, outer plexiform layer, outer segment photoreceptors, retinal pigment epithelial layer, combined outer nuclear layer and inner segment, and ganglion cell layer and inner plexiform layer. Normal and mild DR patients were taken for analysis. Smaller fractal values were observed in all layers of mild DR retina [32].
Box counting was used for detecting DR. The comparison was done between the groups for normal images, hypertensive retinopathy, and proliferative DR. Limited sample was used for analysis in this study and correlation with demographic and diagnostic parameters was not performed [33]. The studies show that fractal analysis will be helpful in detecting the presence and absence of retinal diseases.
3 Research methods
The retinal input images from the databases need to pre-processed for better visualization. So blood vessel enhancement was applied on the images and FFD was used as the testing approach to analyse the images. Statistical parameters such as significance, mean, and standard deviation were calculated for predicting the retinal diseases. T-test was used to validate the significance (Figure 1).
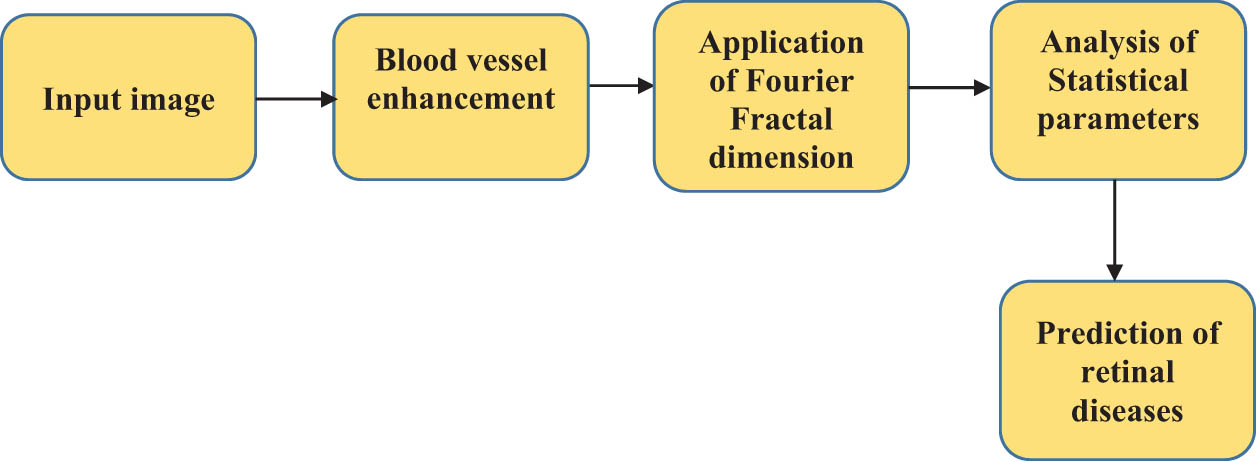
Flow diagram of the proposed system.
The proposed study comprises of images from DIARETDB-1, DIARETDB0, STARE, MESSIDOR, E-ophtha-EX, and E-ophtha-MA databases. Forty five degree retinal images were used in this study. DIARETDB-1 database contains 89 colour fundus images. Among this, 84 images are DR images containing slight non-proliferative signs (microaneurysms) and the remaining five are normal images. No signs of DR is found in normal images. Image acquisition was performed with a digital fundus camera which had a 50o degree field of view (FOV) with varying image settings. The collected dataset is denoted as calibration level 1 fundus images. DIARETDB-0 database contains 130 colour fundus images of which 110 images are abnormal images with the indications of DR and the remaining 20 images are normal images. The abnormal images had the presence of hard and soft exudates, haemorrhages, microaneurysms, and neovascularization. Image acquisition was performed with a digital fundus camera which had a 50o FOV. The collected dataset is denoted as calibration level 0 fundus images.
E-ophtha-EX database comprises of 35 images without lesions and 47 images with exudates. E-ophtha-MA database comprises of 233 images without lesions and 148 images with small haemorrhages or microaneurysms. MESSIDOR database contains 1,200 images of which 13 images were duplicated. So, this study utilized 1,187 images of which 546 images were normal images, 417 images were DR images, and 224 images were DR with macular edema. STARE database includes 402 images consisting of images with background DR, proliferative DR, hypertensive retinopathy, choroidal neovascularization, and age-related macular degeneration (ARMD).
3.1 Blood vessel enhancement
Contrast enhancement is very important as it helps in better visualization and enhances the clarity of the minute information available in the image. In retinal images, the blood vessels are minute structures which has to be enhanced for enabling better diagnosis and prediction of the underlying abnormalities. Adaptive histogram equalization (AHE) helps in enhancement. But on the flipside, it amplifies the noise in homogeneous regions thus creating ambiguity [34]. In retinal images, the retinal structures and minute blood vessels have to be preserved for better performance. But AHE amplifies these minute structures also resulting in overamplification. Contrast limited adaptive histogram equalization (CLAHE) resolves this problem by avoiding overamplification. Clip limit, a user defined value is used by CLAHE to constrain enhancement by clipping the histogram. CLAHE helps in enhancing blood vessels thus improving prediction and diagnosis. CLAHE is implemented in the following manner:
Square neighbourhood is specified to evaluate the histogram in the neighbourhood block.
A transformation function is generated with the help of histogram equalization.
Mapping of gray level is carried out for every pixel individually.
The histogram gets updated every time without recalculating the histogram for the entire pixels available in the new neighbourhood.
Centre of the neighbourhood is moved to the nearby pixel location and the procedure is repeated.
In this study, the input image is an RGB image from which the green channel was extracted. Green channel inversion was done to enable further processing. CLAHE is applied on the inverted green channel blood vessels. Green channel was selected because blood vessels and major features of the image were highlighted in this channel very clearly. It helped in enhancing the visual aspects of the image. Blood vessel extraction is difficult for poor quality images and so blood vessel enhancement is preferred over blood vessel extraction.
3.2 Analysis of fractal dimensions
3.2.1 FFD
FFD is extensively applied in the analysis of medical images. It is less sensitive to noise and removes the necessity for image segmentation. FFD is not affected by the problems such as background noise, uneven illumination, and poor contrast. Generation of Fourier transform of a given image f(x, y) is the primary step in computation of FFD. Fourier transform for an image of size (N × N) is calculated as
where F(a, b) indicates the Fourier transformation with a and b changing from 1 to N.
Fourier transform’s magnitude is specified as
Here F is sampled from the centre of the image. Fourier transform is calculated on a circle with radius ω (ω denotes overall frequency) to get the spectrum of the image. Calculation of FFD is performed by predicting the relationship between M and ω. A logarithmic scale is used to plot this relationship which aids in the computation of FFD. FFD is correlated with the slope
In this study, FFD was applied for each contrast enhanced blood vessel image. FFD value was calculated for each and every image.
3.3 Analysis of statistical parameters
Statistical analysis was made using Statistical Package for Social Sciences. Mean, standard deviation, and significance were calculated for normal patients and DR affected patients in all the datasets. Significance, i.e. p-value was computed for DR patients with respect to normal patients. If the p-value is less than 0.05 and 0.001, then the significance is achieved. T-test was done to calculate significance. Mean and standard deviation [35] were used to differentiate normal and abnormal skin. T-test and significance (p-value) [36] were used to identify the factors which influenced the body mass index. In the present study mean, standard deviation, and significance were useful in differentiating normal and affected patients.
4 Results
The retinal images were taken individually from all the databases and were subjected to contrast enhancement using CLAHE. Input image is shown in Figure 2. Blood vessel enhanced image is shown in Figure 3.
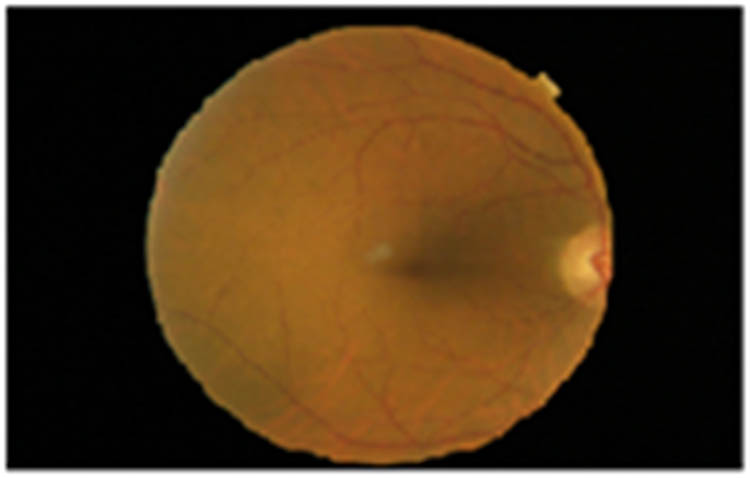
Input image.
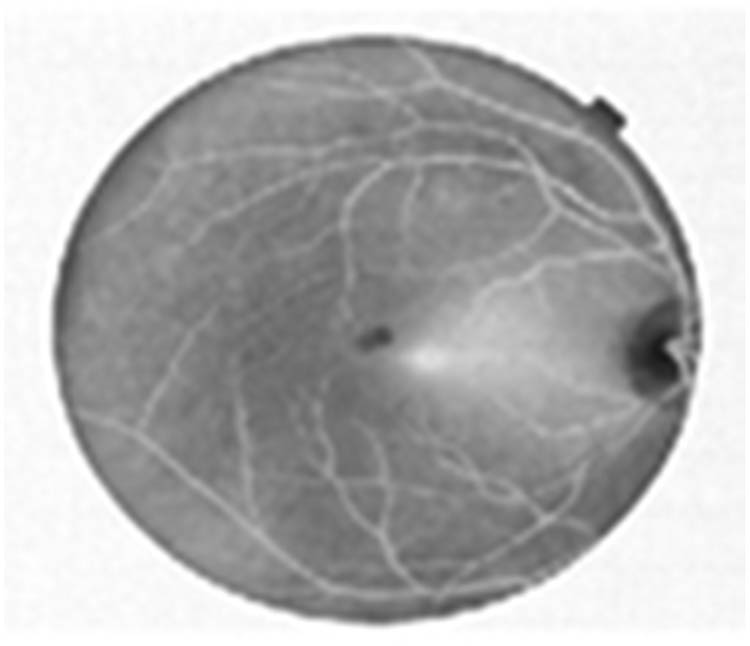
Blood vessel enhanced image using CLAHE.
FFD was applied to the blood vessel enhanced images. Table 1 shows standard deviation and mean for DR in DIARETDB-0.
Standard deviation and mean for DR in DIARETDB-0
| Statistical parameter | DR (p-value = 0.057) | |
|---|---|---|
| Presence | Absence | |
| Number | 110 | 20 |
| Mean ± standard deviation | −2.41 ± 0.139 | −2.349 ± 0.069 |
From Table 1 it can be inferred that in DIARETDB-0 database normal patient had higher fractal value than DR patients. If the fractal value lies between −2.35 and −2.41 then the patient is affected by DR else it is normal. Table 2 represents the standard deviation and mean for DR in DIARETDB-1.
Standard deviation and mean for DR in DIARETDB-1
| Statistical parameter | DR (p-value = 0.5816) | |
|---|---|---|
| Presence | Absence | |
| Number | 84 | 5 |
| Mean ± standard deviation | −2.38 ± 0.117 | −2.35 ± 0.1337 |
From Table 2 it can be inferred that in DIARETDB-1 database normal patient had higher fractal value than DR affected patients. If the fractal value lies between −2.35 and −2.38 then the patient is affected by DR else it is normal. Table 3 shows standard deviation and mean for DR in E-ophtha-EX.
Standard deviation and mean for DR in E-ophtha-EX
| Statistical parameter | DR (p-value = 0.0276) | |
|---|---|---|
| Presence | Absence | |
| Number | 47 | 35 |
| Mean ± standard deviation | −2. 39 ± 0.137 | −2.458 ± 0.134 |
From Table 3 it can be inferred that in E-ophtha-EX database normal patient had lesser fractal value than patients affected with DR. Statistical significance was achieved in this database. If the fractal value lies between −2.39 and −2.458 then the patient is considered as normal. If the fractal value falls above −2.39, i.e. if the fractal value for an eye is −2.38 it means then the patient is affected by DR. Table 4 shows standard deviation and mean for DR and normal patients in E-ophtha-MA database.
Standard deviation and mean for DR in E-ophtha-MA
| Statistical parameter | DR (p-value = 0.1638) | |
|---|---|---|
| Presence | Absence | |
| Number | 148 | 233 |
| Mean ± standard deviation | −2.45 ± 0.137 | −2.47 ± 0.136 |
From Table 4 it can be inferred that normal patient had lesser fractal value than DR affected patients. If the fractal value lies between −2.45 and −2.47 then the patient is normal. If the fractal value lies above −2.45, i.e. if the fractal value for an eye is −2.44 it means then the patient is affected by DR. Table 5 shows standard deviation and mean for DR and DR with macular edema in MESSIDOR database.
Standard deviation and mean for DR and DR with macular edema in MESSIDOR
| Statistical parameter | DR | DR with macular edema | ||
|---|---|---|---|---|
| Presence | Absence | Presence | Absence | |
| Number | 417 | 546 | 224 | 546 |
| Mean ± standard deviation | −2.492 ± 0.118 | −2.464 ± 0.126 | −2.5 ± 0.121 | −2.464 ± 0.126 |
From Table 5 it can be inferred that mean fractal value was high for normal images and low for DR and DR with macular edema risk. If the fractal value lies between −2.464 and −2.5 then the patient is affected by DR and DR with macular edema. If the fractal value lies above −2.464, i.e. if the fractal value for an eye is −2.461 it means then the patient is normal.
DIARETDB-0, DIARETDB-1, and MESSIDOR databases consist of proliferative DR images which is an advanced stage of DR. Hence normal patients had a higher fractal value than patients affected with DR in these databases. On the flip side, E-ophtha-MA and E-ophtha-EX databases do not contain proliferative DR images and so the normal patient had lesser fractal value than DR affected patients.
Figure 4 shows the graph of mean fractal value for normal and DR images in MESSIDOR, E-ophtha-EX, E-ophtha-MA, DIARETDB-1, and DIARETDB-0 databases.
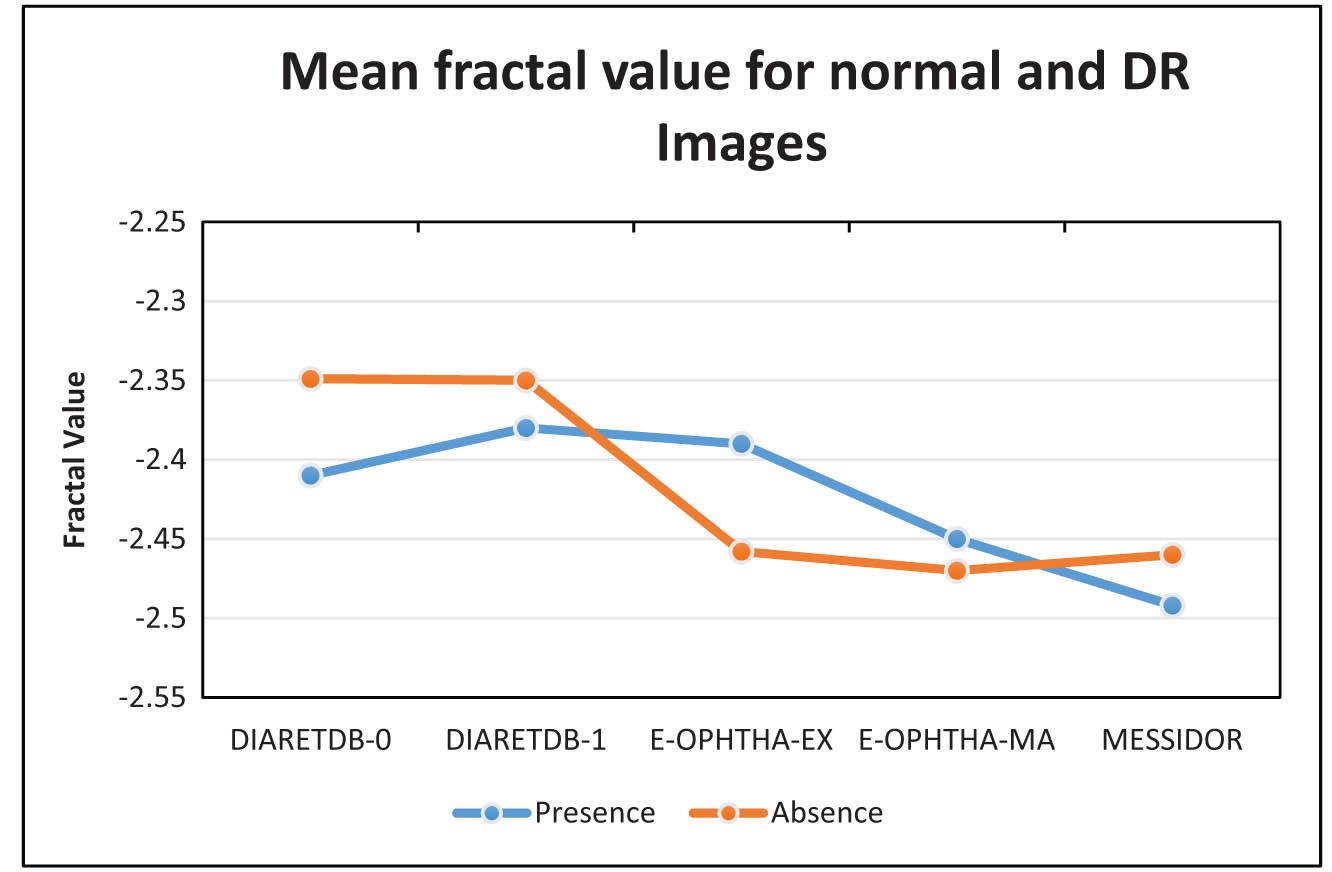
Mean fractal value for normal and DR images.
The proposed study also focused on effective retinal disease prediction. Among all the retinal image databases, STARE database comprises of retinal images with various diseases apart from the normal images. Hence in this study FFD was applied to the images in STARE database in order to analyse the presence of various retinal diseases. Mean fractal value and standard deviation were calculated for retinal images with various diseases to help in disease prediction.
From Table 6 it can be inferred that normal retina is having high fractal value than pathological images. If fractal value is above −2.5 ± 0.138 it can be predicted that the person is having some complications in retina. In general, demographic/diagnostic parameters can be correlated with fractals. But this study contains datasets from public databases. The public databases possess only images and it does not possess details about the demographic and diagnostic parameters. So, in this study it was not possible to correlate the obtained retinal fractals with demographic/diagnostic parameters.
Standard deviation and mean fractal dimension of retinal images with various diseases
| Number | Disease | Mean ± standard deviation |
|---|---|---|
| 37 | Normal | −2.5 ± 0.138 |
| 53 | Background DR | −2.6 ± 0.139 |
| 25 | Proliferative DR | −2.627 ± 0.163 |
| 12 | Hypertensive retinopathy | −2.674 ± 0.213 |
| 36 | Choroidal neovascularization and ARMD | −2.74 ± 0.108 |
| 18 | Retinitis | −2.7 ± 0.148 |
5 Discussion
FFD [19] was focused in this work since it does not require blood vessel extraction. This is because blood vessel extraction is time consuming than blood vessel enhancement. Blood vessel extraction is prone to error because of inter-observer variation and changes due to image colour and contrast. In this study blood vessel enhancement has helped in reducing the time complexity and aiding a better prediction on combining it with FFD.
Box counting [16,21,33] method degrades the image as it has artefacts like poor contrast, uneven illumination, and background noise. FFD is more robust to noise and performs well even with images that have poor contrast. In this study, there was a need to enhance the blood vessels. So FFD which is less sensitive to noise was used and it helped in better disease prediction.
Box counting [16,21,33] showed normal patients had a higher fractal value than patients affected with DR. In the current analysis, normal patients had higher value of fractals than DR affected patients in DiaretDB-0, DiaretDB-1, and MESSIDOR databases. HFD was used to differentiate between retinopathy and non-retinopathy patients [37].
FFD [38] showed the differentiation in MESSIDOR database between normal and affected patients. In the present study, FFD showed differentiation between normal and affected patients in DIARETDB-1, DIARETDB-0, MESSIDOR, STARE, E-ophtha-MA, and E-ophtha-EX databases.
The magnitude response spectrum of the FFD is used as a feature extraction method to classify blood vessels [39]. In the present study slope of FFD is used as a value to predict the presence and absence of disease. This has extensively contributed in reducing the noise and helped in differentiating between the normal and abnormal cases.
Blood vessel extraction approach was used to determine vascular alterations and expedite accurate identification of pathological symptoms in retinal images [40,41]. In the present study, blood vessel enhancement was used to aid better diagnosis and visualization of blood vessels to detect the underlying abnormalities using fractal techniques.
6 Conclusion
A broad analysis of fractal relationship with DR in various databases was analysed in this study. The study contributed significantly in differentiating the incidence and absence of DR based on the mean fractal value. The major contribution of this work was achievement of significance for E-ophtha-EX database and prediction of retinal diseases in STARE database. Normal patient had a higher fractal value than patients affected with DR in DIARETDB-1, DIARETDB-0, and MESSIDOR databases. Normal patients had lesser fractal value in STARE, E-ophtha-MA, and E-ophtha-EX databases. This study also helped in predicting the relationship of fractal dimensions with various diseases of the retina in STARE database. If the fractal value goes beyond −2.5, it can be predicted that the patient is affected by a retinal disease. The present work reduced the effort of blood vessel extraction thereby making it more robust and enhancing its efficiency in precise diagnosis. Reduction in computational complexity and accuracy in prediction are the advantages of this study. The future study can analyse the effect of fractal dimensions in 200o retinal images that would aid in prediction of diseases like cataract, glaucoma, and intraocular melanoma. Deep learning techniques can be explored for detection of disease symptoms and its analysis.
Acknowledgments
The authors sincerely thank Mrs R. Janani Surya, Statistician, Sankara Nethralaya, Chennai for helping in statistical analysis.
-
Funding information: The authors state no funding involved.
-
Author contributions: All authors have accepted responsibility for the entire content of this manuscript and approved its submission.
-
Conflict of interest: The authors state no conflict of interest.
References
[1] Liew G, Wang JJ, Cheung N, Zhang YP, Hsu W, Lee ML, et al. The retinal vasculature as a fractal: methodology, reliability, and relationship to blood pressure. Ophthalmology. 2008;115(11):1951–6.10.1016/j.ophtha.2008.05.029Suche in Google Scholar PubMed
[2] Klein BE, Klein R, McBride PE, Cruickshanks KJ, Palta M, Knudtson MD, et al. Cardiovascular disease, mortality, and retinal microvascular characteristics in type 1 diabetes: Wisconsin epidemiologic study of diabetic retinopathy. Arch Intern Med. 2004;164(17):1917–24.10.1001/archinte.164.17.1917Suche in Google Scholar PubMed
[3] Cheung N, Rogers SL, Donaghue KC, Jenkins AJ, Tikellis G, Wong TY. Retinal arteriolar dilation predicts retinopathy in adolescents with type 1 diabetes. Diabetes Care. 2008;31(9):1842–6.10.2337/dc08-0189Suche in Google Scholar PubMed PubMed Central
[4] Klein R, Klein BE, Moss SE, Wong TY, Hubbard L, Cruickshanks KJ, et al. The relation of retinal vessel caliber to the incidence and progression of diabetic retinopathy: XIX: the Wisconsin Epidemiologic Study of Diabetic Retinopathy. Arch Ophthalmol. 2004;122(1):76–83.10.1001/archopht.122.1.76Suche in Google Scholar PubMed
[5] Alibrahim E, Donaghue KC, Rogers S, Hing S, Jenkins AJ, Chan A, et al. Retinal vascular caliber and risk of retinopathy in young patients with type 1 diabetes. Ophthalmology. 2006;113(9):1499–503.10.1016/j.ophtha.2006.05.009Suche in Google Scholar PubMed
[6] Klein R, Klein BE, Moss SE, Wong TY. Retinal vessel caliber and microvascular and macrovascular disease in type 2 diabetes: XXI: the wisconsin epidemiologic study of diabetic retinopathy. Ophthalmology. 2007;114(10):1884–92.10.1016/j.ophtha.2007.02.023Suche in Google Scholar PubMed
[7] Deepika V, JeyaLakshmi V, Latha P, Raman R, Srinivasalu S, Raman S, et al. Comparison of various fractal analysis methods for retinal images. Biomed Signal Process Control. 2021;63:102245.10.1016/j.bspc.2020.102245Suche in Google Scholar
[8] Imani E, Javidi M, Pourreza HR. Improvement of retinal blood vessel detection using morphological component analysis. Comput Methods Prog Biomed. 2015;118(3):263–79.10.1016/j.cmpb.2015.01.004Suche in Google Scholar PubMed
[9] Sussman EJ, Tsiaras WG, Soper KA. Diagnosis of diabetic eye disease. JAMA. 1982;247(23):3231–4.10.1001/jama.1982.03320480047025Suche in Google Scholar
[10] Wong TY, Klein R, Sharrett AR, Schmidt MI, Pankow JS, Couper DJ, et al. Retinal arteriolar narrowing and risk of diabetes mellitus in middle-aged persons. JAMA. 2002;287(19):2528–33.10.1001/jama.287.19.2528Suche in Google Scholar PubMed
[11] Lee SJ, McCarty CA, Taylor HR, Keeffe JE. Costs of mobile screening for diabetic retinopathy: a practical framework for rural populations. Aus J Rural Health. 2001;9(4):186–92.10.1046/j.1038-5282.2001.00356.xSuche in Google Scholar
[12] Bernardes R, Serranho P, Lobo C. Digital ocular fundus imaging: a review. Ophthalmology. 2011;226(4):161–81.10.1159/000329597Suche in Google Scholar
[13] Taylor HR, Keeffe JE. World blindness: a 21st century perspective. Br J Ophthalmol. 2001;85(3):261–6.10.1136/bjo.85.3.261Suche in Google Scholar
[14] Wong TY, Klein R, Couper DJ, Cooper LS, Shahar E, Hubbard LD, et al. Retinal microvascular abnormalities and incident stroke: the atherosclerosis risk in communities study. Lancet. 2001;358(9288):1134–40.10.1016/S0140-6736(01)06253-5Suche in Google Scholar
[15] Wong TY, Klein R, Sharrett AR, Duncan BB, Couper DJ, Tielsch JM, et al. Retinal arteriolar narrowing and risk of coronary heart disease in men and women: the atherosclerosis risk in communities study. JAMA. 2002;287(9):1153–9.10.1001/jama.287.9.1153Suche in Google Scholar PubMed
[16] Avakian A, Kalina RE, Sage EH, Rambhia AH, Elliott KE, Chuang EL, et al. Fractal analysis of region-based vascular change in the normal and non-proliferative diabetic retina. Curr Eye Res. 2002;24(4):274–80.10.1076/ceyr.24.4.274.8411Suche in Google Scholar PubMed
[17] Patton N, Aslam TM, MacGillivray T, Deary IJ, Dhillon B, Eikelboom RH, et al. Retinal image analysis: concepts, applications and potential. Prog Retinal Eye Res. 2005;25(1):99–127.10.1016/j.preteyeres.2005.07.001Suche in Google Scholar PubMed
[18] Masters BR. Fractal analysis of the vascular tree in the human retina. Ann Rev Biomed Eng. 2004;6:427–52.10.1146/annurev.bioeng.6.040803.140100Suche in Google Scholar PubMed
[19] Azemin MC, Kumar DK, Wong TY, Kawasaki R, Mitchell P, Wang JJ. Robust methodology for fractal analysis the retinal vasculature. IEEE Trans Med Imaging. 2010;30(2):243–50.10.1109/TMI.2010.2076322Suche in Google Scholar PubMed
[20] Moghaddam RF, Cheriet M. Modified Hausdorff fractal dimension (MHFD). ArXiv, abs/150503493Suche in Google Scholar
[21] Grauslund J, Green A, Kawasaki R, Hodgson L, Sjolie AK, Wong TY. Retinal vascular fractals and microvascular and macrovascular complications in type 1 diabetes. Ophthalmology. 2010;117(7):1400–5.10.1016/j.ophtha.2009.10.047Suche in Google Scholar PubMed
[22] Cheung CY, Ong S, Ikram MK, Ong YT, Chen CP, Venketasubramanian N, et al. Retinal vascular fractal dimension is associated with cognitive dysfunction. J Stroke Cerebrovasc Dis. 2014;23(1):43–50.10.1016/j.jstrokecerebrovasdis.2012.09.002Suche in Google Scholar PubMed
[23] Punithavathy M, Poobal S, Ramya MM. Performance evaluation of machine learning techniques in lung cancer classification from PET/CT images. FME Trans. 2019;47(3):418–23.10.5937/fmet1903418PSuche in Google Scholar
[24] Sebastin MV, Navascues MA. A relation between fractal dimension and fourier transform-electroencephalographic study using spectral and fractal parameters. Int J Comput Math. 2008;85(3):657–65.10.1080/00207160701286141Suche in Google Scholar
[25] Jeyapriya J, Umadevi KS. Detection of exudates using neuro-fuzzy technique. Int J Electr Eng Educ. 2020;0(0):1–10.10.1177/0020720919897554Suche in Google Scholar
[26] Long SC, Chen J, Hu A, Liu H, Chen Z, Zheng DC. Microaneurysms detection in color fundus images using machine learning based on directional local contrast. Bio Med Eng OnLine. 2020;19(21):1–23.10.1186/s12938-020-00766-3Suche in Google Scholar PubMed PubMed Central
[27] Lahmiri S, Shmuel A. Variational mode decomposition-based approach for accurate classification of color fundus images with hemorrhages. Opt Laser Technol. 2017;96:243–8.10.1016/j.optlastec.2017.05.012Suche in Google Scholar
[28] Ravandi SY, Arezooji DM, Matinnia N, Shamsaei F, Ahmadpanah M, Ghaleiha A, et al. Complexity of information processing in obsessive-compulsive disorder based on fractal analysis of EEG signal. Excli J. 2021;20:642–54.Suche in Google Scholar
[29] Al-Kadi OS. Prediction of FDG-PET stage and uptake for non-small cell lung cancer on non-contrast enhanced CT scans via fractal analysis. Clin Imaging. 2020;65:54–9.10.1016/j.clinimag.2020.03.005Suche in Google Scholar PubMed
[30] Porcaro C, Mayhew SD, Marino M, Mantini D, Bagshaw AP. Characterisation of haemodynamic activity in resting state networks by fractal analysis. Int J Neural Sys. 2020;30(12):1–15.2050061.10.1142/S0129065720500616Suche in Google Scholar PubMed
[31] Safitri DW, Juniati D. Classification of diabetic retinopathy using fractal dimension analysis of eye fundus image. Int Conf Math Pure Appl Comput. 2017;1867:020011.10.1063/1.4994414Suche in Google Scholar
[32] Gao W, Debuc DC, Zakharov V, Tatrai E, Somfai G, Myakinin O, et al. Two-dimensional fractal analysis of retinal tissue of healthy and diabetic eyes with optical coherence tomography. J Biomed Photonics Eng. 2016;2(4):040302.10.18287/JBPE16.02.040302Suche in Google Scholar
[33] Popovic N, Radunovic M, Badnjar J, Popovic T. Fractal dimension and lacunarity analysis of retinal microvascular morphology in hypertension and diabetes. Microvasc Res. 2018;118:36–43.10.1016/j.mvr.2018.02.006Suche in Google Scholar PubMed
[34] Singala N, Singh N. Blood vessel contrast enhancement techniques for retinal images. Int J Adv Res Comput Sci. 2017;8(5):709–12.Suche in Google Scholar
[35] Afdhal A, Zulfikar Z, Zulhelmi Z, Arif TY. Image investigation using higher moment statistics and edge detection for recognizing abnormal skin. Bull Electr Eng Inform. 2020;9(1):109–20.10.11591/eei.v9i1.1287Suche in Google Scholar
[36] Hoseini SH, Nakhli MP, Soltani A. Neural network model of estimation of body mass index on indirect input factors. Bull Electr Eng Inform. 2013;2(3):218–24.10.12928/eei.v2i3.207Suche in Google Scholar
[37] Deepika V, JeyaLakshmi V, Latha P, Raman R, Kiruthika V, Raman S, et al. Relationship of fractal analysis in retinal microvascularity with demographic and diagnostic parameters. Microvasc Res. 2022;139:104237.10.1016/j.mvr.2021.104237Suche in Google Scholar PubMed
[38] Relan D, Jain D, Mittal V. Robustness of fourier fractal analysis in differentiating subgroups of retinal images. J Discrete Math Sci Cryptogr. 2019;22(9):101–11.10.1080/09720529.2019.1576332Suche in Google Scholar
[39] Ding Y, Ward WOC, Duan J, Auer DP, Gowland P, Bai L. Retinal vasculature classification using novel multifractal features. Phys Med Biol. 2015;60(21):8365–79.10.1088/0031-9155/60/21/8365Suche in Google Scholar PubMed
[40] Bhardwaj C, Jain S, Sood M. Performance analysis of retinal features for diabetic retinopathy characterisation and diagnosis. Int J Bus Syst Res. 2021;15(2):253–70.10.1504/IJBSR.2021.113412Suche in Google Scholar
[41] Bhardwaj C, Jain S, Sood M. Retinal blood vessel localization to expedite PDR diagnosis. Period Eng Nat Sci. 2020;8(3):1233–46.Suche in Google Scholar
© 2022 Deepika Venkataramani et al., published by De Gruyter
This work is licensed under the Creative Commons Attribution 4.0 International License.
Artikel in diesem Heft
- Research Articles
- Fractal approach to the fluidity of a cement mortar
- Novel results on conformable Bessel functions
- The role of relaxation and retardation phenomenon of Oldroyd-B fluid flow through Stehfest’s and Tzou’s algorithms
- Damage identification of wind turbine blades based on dynamic characteristics
- Improving nonlinear behavior and tensile and compressive strengths of sustainable lightweight concrete using waste glass powder, nanosilica, and recycled polypropylene fiber
- Two-point nonlocal nonlinear fractional boundary value problem with Caputo derivative: Analysis and numerical solution
- Construction of optical solitons of Radhakrishnan–Kundu–Lakshmanan equation in birefringent fibers
- Dynamics and simulations of discretized Caputo-conformable fractional-order Lotka–Volterra models
- Research on facial expression recognition based on an improved fusion algorithm
- N-dimensional quintic B-spline functions for solving n-dimensional partial differential equations
- Solution of two-dimensional fractional diffusion equation by a novel hybrid D(TQ) method
- Investigation of three-dimensional hybrid nanofluid flow affected by nonuniform MHD over exponential stretching/shrinking plate
- Solution for a rotational pendulum system by the Rach–Adomian–Meyers decomposition method
- Study on the technical parameters model of the functional components of cone crushers
- Using Krasnoselskii's theorem to investigate the Cauchy and neutral fractional q-integro-differential equation via numerical technique
- Smear character recognition method of side-end power meter based on PCA image enhancement
- Significance of adding titanium dioxide nanoparticles to an existing distilled water conveying aluminum oxide and zinc oxide nanoparticles: Scrutinization of chemical reactive ternary-hybrid nanofluid due to bioconvection on a convectively heated surface
- An analytical approach for Shehu transform on fractional coupled 1D, 2D and 3D Burgers’ equations
- Exploration of the dynamics of hyperbolic tangent fluid through a tapered asymmetric porous channel
- Bond behavior of recycled coarse aggregate concrete with rebar after freeze–thaw cycles: Finite element nonlinear analysis
- Edge detection using nonlinear structure tensor
- Synchronizing a synchronverter to an unbalanced power grid using sequence component decomposition
- Distinguishability criteria of conformable hybrid linear systems
- A new computational investigation to the new exact solutions of (3 + 1)-dimensional WKdV equations via two novel procedures arising in shallow water magnetohydrodynamics
- A passive verses active exposure of mathematical smoking model: A role for optimal and dynamical control
- A new analytical method to simulate the mutual impact of space-time memory indices embedded in (1 + 2)-physical models
- Exploration of peristaltic pumping of Casson fluid flow through a porous peripheral layer in a channel
- Investigation of optimized ELM using Invasive Weed-optimization and Cuckoo-Search optimization
- Analytical analysis for non-homogeneous two-layer functionally graded material
- Investigation of critical load of structures using modified energy method in nonlinear-geometry solid mechanics problems
- Thermal and multi-boiling analysis of a rectangular porous fin: A spectral approach
- The path planning of collision avoidance for an unmanned ship navigating in waterways based on an artificial neural network
- Shear bond and compressive strength of clay stabilised with lime/cement jet grouting and deep mixing: A case of Norvik, Nynäshamn
- Communication
- Results for the heat transfer of a fin with exponential-law temperature-dependent thermal conductivity and power-law temperature-dependent heat transfer coefficients
- Special Issue: Recent trends and emergence of technology in nonlinear engineering and its applications - Part I
- Research on fault detection and identification methods of nonlinear dynamic process based on ICA
- Multi-objective optimization design of steel structure building energy consumption simulation based on genetic algorithm
- Study on modal parameter identification of engineering structures based on nonlinear characteristics
- On-line monitoring of steel ball stamping by mechatronics cold heading equipment based on PVDF polymer sensing material
- Vibration signal acquisition and computer simulation detection of mechanical equipment failure
- Development of a CPU-GPU heterogeneous platform based on a nonlinear parallel algorithm
- A GA-BP neural network for nonlinear time-series forecasting and its application in cigarette sales forecast
- Analysis of radiation effects of semiconductor devices based on numerical simulation Fermi–Dirac
- Design of motion-assisted training control system based on nonlinear mechanics
- Nonlinear discrete system model of tobacco supply chain information
- Performance degradation detection method of aeroengine fuel metering device
- Research on contour feature extraction method of multiple sports images based on nonlinear mechanics
- Design and implementation of Internet-of-Things software monitoring and early warning system based on nonlinear technology
- Application of nonlinear adaptive technology in GPS positioning trajectory of ship navigation
- Real-time control of laboratory information system based on nonlinear programming
- Software engineering defect detection and classification system based on artificial intelligence
- Vibration signal collection and analysis of mechanical equipment failure based on computer simulation detection
- Fractal analysis of retinal vasculature in relation with retinal diseases – an machine learning approach
- Application of programmable logic control in the nonlinear machine automation control using numerical control technology
- Application of nonlinear recursion equation in network security risk detection
- Study on mechanical maintenance method of ballasted track of high-speed railway based on nonlinear discrete element theory
- Optimal control and nonlinear numerical simulation analysis of tunnel rock deformation parameters
- Nonlinear reliability of urban rail transit network connectivity based on computer aided design and topology
- Optimization of target acquisition and sorting for object-finding multi-manipulator based on open MV vision
- Nonlinear numerical simulation of dynamic response of pile site and pile foundation under earthquake
- Research on stability of hydraulic system based on nonlinear PID control
- Design and simulation of vehicle vibration test based on virtual reality technology
- Nonlinear parameter optimization method for high-resolution monitoring of marine environment
- Mobile app for COVID-19 patient education – Development process using the analysis, design, development, implementation, and evaluation models
- Internet of Things-based smart vehicles design of bio-inspired algorithms using artificial intelligence charging system
- Construction vibration risk assessment of engineering projects based on nonlinear feature algorithm
- Application of third-order nonlinear optical materials in complex crystalline chemical reactions of borates
- Evaluation of LoRa nodes for long-range communication
- Secret information security system in computer network based on Bayesian classification and nonlinear algorithm
- Experimental and simulation research on the difference in motion technology levels based on nonlinear characteristics
- Research on computer 3D image encryption processing based on the nonlinear algorithm
- Outage probability for a multiuser NOMA-based network using energy harvesting relays