Nonlinear reliability of urban rail transit network connectivity based on computer aided design and topology
-
Ya Li


Abstract
Rail transit network is the backbone of the transport network. In this article, a topology nonlinear model based on L-space and P-space is proposed to understand the unreliability of urban rail transit network in computer-aided design. The proposed model requires different characteristics of rail transit according to L-space and P-space. The experiment result shows that the degree value of the network is relatively small in the L-space. In the L-space, more than 80% of the nodes have degree 2, and the degree distribution is very concentrated. In P-space, the overall degree value of the network is higher, and the distribution area is wider. Experiment results have proved that the aggregation coefficient of more than 85% of the nodes in the Shanghai rail transit network is 1, which provides a basis for the comparison of different trains and the research on the changes in future urban trains.
1 Introduction
With the development and prosperity of China’s social economy and economy, the scale of cities is also expanding. In mega and super large cities, the existing traffic network cannot meet the growing traffic demand gradually. The phenomenon of traffic congestion is becoming more and more serious. There are more and more traffic accidents, and people’s desire for green transportation is becoming more and more urgent. As a large environment, urban rail transit has become an important part of urban transportation. It has also become an important choice for urban residents due to its advantages of scale, safety, environmental protection, tourism, and energy saving. As of the end of 2017, a total of 34 cities across the country have opened urban rail lines, with a total of 165 lines in operation, of which 32 new lines have been added, an increase of 879.9 km, and a cumulative operating mileage of 5032.7 miles [1]. In recent years, with the continuous expansion of urban railways, many cities have also entered the era of network operation from single line operation, and there are hundreds of rail transit stations in cities. Although urban rail transit has the incomparable efficiency, safety, and punctuality of other transportation modes, which provides great convenience for residents to travel, it is precisely because of the huge network that once an emergency occurs, urban rail transit cannot operate normally, it will have a major impact on traffic in the entire city. Therefore, under the new situation of urban rail transit network, higher requirements are placed on the reliability and flexibility of rail transit to respond to emergencies [2]. How to judge the reliability of urban rail transit network connection, so as to carry out the functional layout and optimization of the network, has become one of the hotspots of modern railway network research to provide theoretical basis for the construction and transformation of urban railways. Aiming at the urban rail transit network in different stages of development, the reliability of its network connectivity is analyzed and researched, which also provides a new perspective for the study of modern urban rail transit network.
2 Literature review
In the past, the research on network traffic mainly focused on the research of roads, mostly on the improvement of traffic organization with the goal of achieving business results, and did not study the form of the entire network facilities. Xu et al. believed that in recent years, complex network theory has gradually begun to be applied in the research of transportation network and has become more and more extensive. The research on the basic theory of transportation network combined with complex network theory not only has important guiding significance for the planning practice of transportation network, but also promotes the application research of complex network theory [3]. Wu et al. compared the subway networks between Boston and Vienna by choosing three metrics: clustering coefficient, average length, and average vertex degree [4].
Luan et al. established the world’s largest virtual subway network in 2006. Combined with relevant theories, they verified that the degree distribution of network characteristic parameters is an exponential distribution, and proposed that the network can be evaluated according to the change in degree value [5]. In 2008, Hua and Ong selected the Seoul Metro Network in South Korea, analyzed its network characteristic values such as network efficiency, maximum Dalian Tong subgraph, and degree distribution, and also verified that the node degree presents the characteristics of exponential distribution [6]. In 2010, a survey of several urban rail networks found that all types of urban rail are available on a small global, no-scale basis [7].
Later, in 2019, the authors understood the characteristics of Shanghai urban rail transit network through the network topology itself. They put forward the calculation method of network feature analysis, and calculated the eigenvalues of each network based on Space L and Space P topology by using complex network theory. This theory is also able to find the degree of distribution, characteristic path length, and aggregation coefficient in the network. Finally, it is concluded that the integration of Shanghai urban rail transit network is large and the road length is small [8].
In 2012, Yang et al. analyzed the topology of the domestic metropolitan area network at the physical level of the metropolitan area network based on the complex network theory, and came to the conclusion that the average distance of the domestic metropolitan area network is the shortest. The Space L model is larger and the clustering coefficients are located on the soles of the feet. The distribution of degree is similar to Poisson distribution, and the node and medium are linearly correlated. It is considered that under specific attacks, the propagation speed of faults in metro network is faster, and after propagation to a certain extent, the effect of subsequent attacks is less [9].
In 2014, Lin selected the rail transit networks in Beijing, Shanghai, and Guangzhou for topology abstraction, analyzed and explained the basic structure of the network, by calculating the variability of the measured parameters of various network characteristics. After random and selective attacks, the security of railway transportation is evaluated, and finally the stops and vehicles are isolated to the main stations in the urban rail transit network [10]. Xu and Li studied the changes in urban rail transit network connectivity reliability through three different attack strategies and network attack strategies in 2012 [11].
In 2013, Jiang et al. developed a new model to test the network connectivity reliability of urban rail transit through the maximum connectivity subgraph of Shanghai rail transit network and the change in network efficiency before and after stops were used to measure optimization [12]. In 2014, Li et al. analyzed the connectivity reliability of Beijing Metro network by analyzing the static characteristic parameters of the network, such as degree and intermediate index, and established the network topology model based on point and edge [13].
Similarly, in 2014, Xu et al. took Beijing Metro as an example, by analyzing the changes in network characteristic parameters before and after the attack, they obtained the nodes and lines with high importance in Beijing urban rail transit network [14]. The public transport topology proposed by Zhang has been investigated in 22 cities in Poland, and it is found that the distribution of high-rise buildings conforms to the exponential distribution law [15]. The Boston subway has always been the forerunner of the world’s small network capabilities, and analyzed its effectiveness and fault tolerance through network efficiency [16].
Due to the relatively narrow distribution range of urban rail transit entity network structure (line network), the current research tends to adopt a research method similar to the public transport network to prove that it has the characteristics of complex network. But in fact, in the urban rail transit network, the body line network is the basis of network operation, and the simple study of the abstract operation network cannot fully reflect its network characteristics.
Therefore, using complex network theory and graph theory, this article analyzes the two network topologies of Space L and Space P of subway network. This article also studies the characteristic indexes of subway network under different topologies, and reveals the characteristics of different topologies. The network topology is shown in Figure 1.
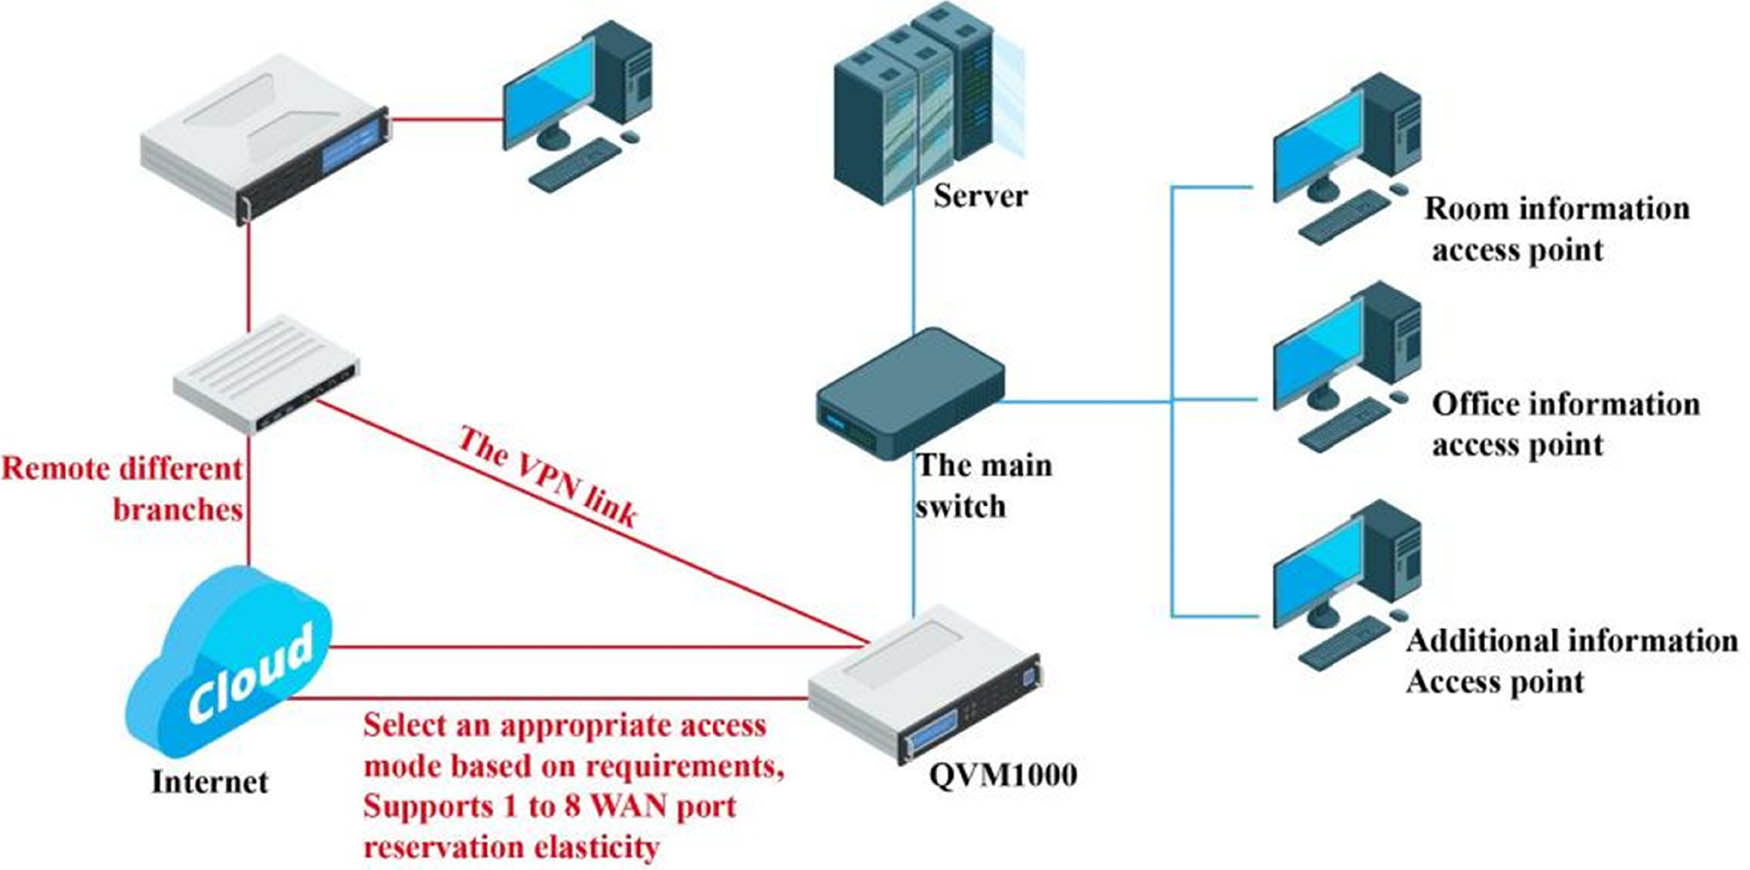
Network topology.
The network has many characteristics, and the description of its characteristics is realized by some specific properties. At present, in the existing research, there are the following geometric quantities: degree, diameter, path length, and clustering coefficient. These geometric quantities can describe the structural characteristics of different aspects of the network, and can comprehensively summarize the inherent characteristics of the network.
3 Research methods
In order to determine the characteristics and legitimacy of urban railways in China, Shanghai, which is currently very efficient in rail transit, is selected. The following points are proposed for research needs.
Definition 1
Degree: The degree of a base in a network represents all edges connected to a node.
Definition 2
Determining the 2-degree distribution: The
Definition 3
Cumulative range distribution: The rank distribution represents the nonlinear probability distribution function
Definition 4
Define a 4-node clustering factor: In the network, node
Definition 5
Network clustering coefficient: As shown in Eq. (3), the clustering coefficient of all networks is the average of the clustering coefficients of all nodes in the network:
Definition 6
L-Location and P-Location: There are various representations of urban rail transit networks. The characteristics of these networks can be explored separately to explore the topological patterns of the same traffic.
L-Space (SpaceL): A station is considered a station, if two stations are adjacent in a lane, and they have connecting edges;
P-Space (SpaceP): A station is considered a station, if two stations have direct rail, they are connected, and otherwise the stations are not connected. It is not difficult to see that the network created by the SpaceL method is a sub-network of the network created by the SpaceP method.
In order to better understand the line interconnections in the entire Shanghai rail transit network, the line interconnections in the railway lines were identified. Imagine a line as a network node, such as Shanghai Rail Transit Line 1 is at 1 point, Line 2 is at 2 point, and the adjacency matrix is obtained [17]. After obtaining the adjacency matrix, it is analyzed by MATLAB, and the node degree and average degree of the line network topology are obtained.
4 Result analysis
Through analysis, some eigenvalues of the network topology are obtained. The highest point of the entire topology is 10, which is line 4, that is, line 10 that can be changed from line 4 to other 11 lines, because line 4 is a line. The minimum value is 1, i.e., only row 5 is connected to row 1, i.e., row 5 can be moved to row 1 after one pass. The total area of the network is 6.33, that is to say, one line connects 6.33 lines on average, which represents the change and access of the entire network [18]. The clustering coefficients of each network node are shown in Table 1. The average network clustering coefficient is 0.7745, and all networks are relatively compact.
Node clustering coefficient of line network topology
| Line node | 1 | 2 | 3 | 4 | 5 | 6 | 7 | 8 | 9 | 10 | 11 | 12 |
|---|---|---|---|---|---|---|---|---|---|---|---|---|
| Clustering coefficient
|
0.7 | 0.7 | 0.8 | 0.7 | 0 | 1 | 0.8 | 0.8 | 0.9 | 1 | 1 | 1 |
4.1 Adjacency matrix in L space and P space of Shanghai rail transit network
The adjacency matrix of complex networks is defined as L and P. Obtain the connection matrix
If there is a direct rail transit line between nodes i and j from P (regardless of whether it passes through other stations in the middle),
4.2 Analysis of topological structure characteristics of Shanghai rail transit network
The different personal values of the network are obtained by running the adjacency matrix, and these personal values are mainly: degree and degree distribution, shorter method and classification, group coefficient, etc.
4.2.1 Degree and degree distribution
From the map topology analysis,
At L position: the maximum number of nodes in the network, namely, Century Avenue station is 7. Historically, this station was the intersection of Lines 2, 4, 6, and 9, and the entrance must have been Line 8. However, since the intermediate station of line 4 and line 6 from Lancun road to Century Avenue is called Pu circuit, it is considered to be the same station, so the entire network has a maximum of 7 network nodes. The minimum number of network nodes is 1, which is the origin and destination of each line. The average rank of the entire network is 2.1968, that is, each node is connected to 2.19 adjacent nodes on average, which is due to the relatively small number of nodes in rail transit lines [20,21,22,23,24].
At P position: the highest point 104 of the network, namely, Century Avenue station, that is, starting from Ji Avenue station, you can take the subway to 104 stations directly, which is consistent with the situation that Century Avenue station is the largest hub node of Shanghai rail. The lowest degree is 5, which is the node degree of line 13. This is because line 13 only opens 5 stations from Jinshajiang Road to Jinyun Road, so the degree of the whole line is low. The entire network has an average of 30.856 stations, that is, starting from 1 station, the average number of stations is 30.8 without any change, which is divided at the stations of most lines of Line 20–35.
Figure 2a and b shows the frequency distribution of node degrees at point L and position P in the network. At the L position, the occurrence rate of node degree 2 is the largest, close to 80%, that is, if a node is arbitrarily selected from the network, the probability of degree 2 is about 80%. This is because in L space, except for transfer stations and start and end stations, other nodes are only connected with the front and rear stations of the line, so the stations with degree 2 are the most. Compared with L space, the degree under P space is large, and it is mainly concentrated between 20 and 50, and the distribution is relatively scattered [25,26].
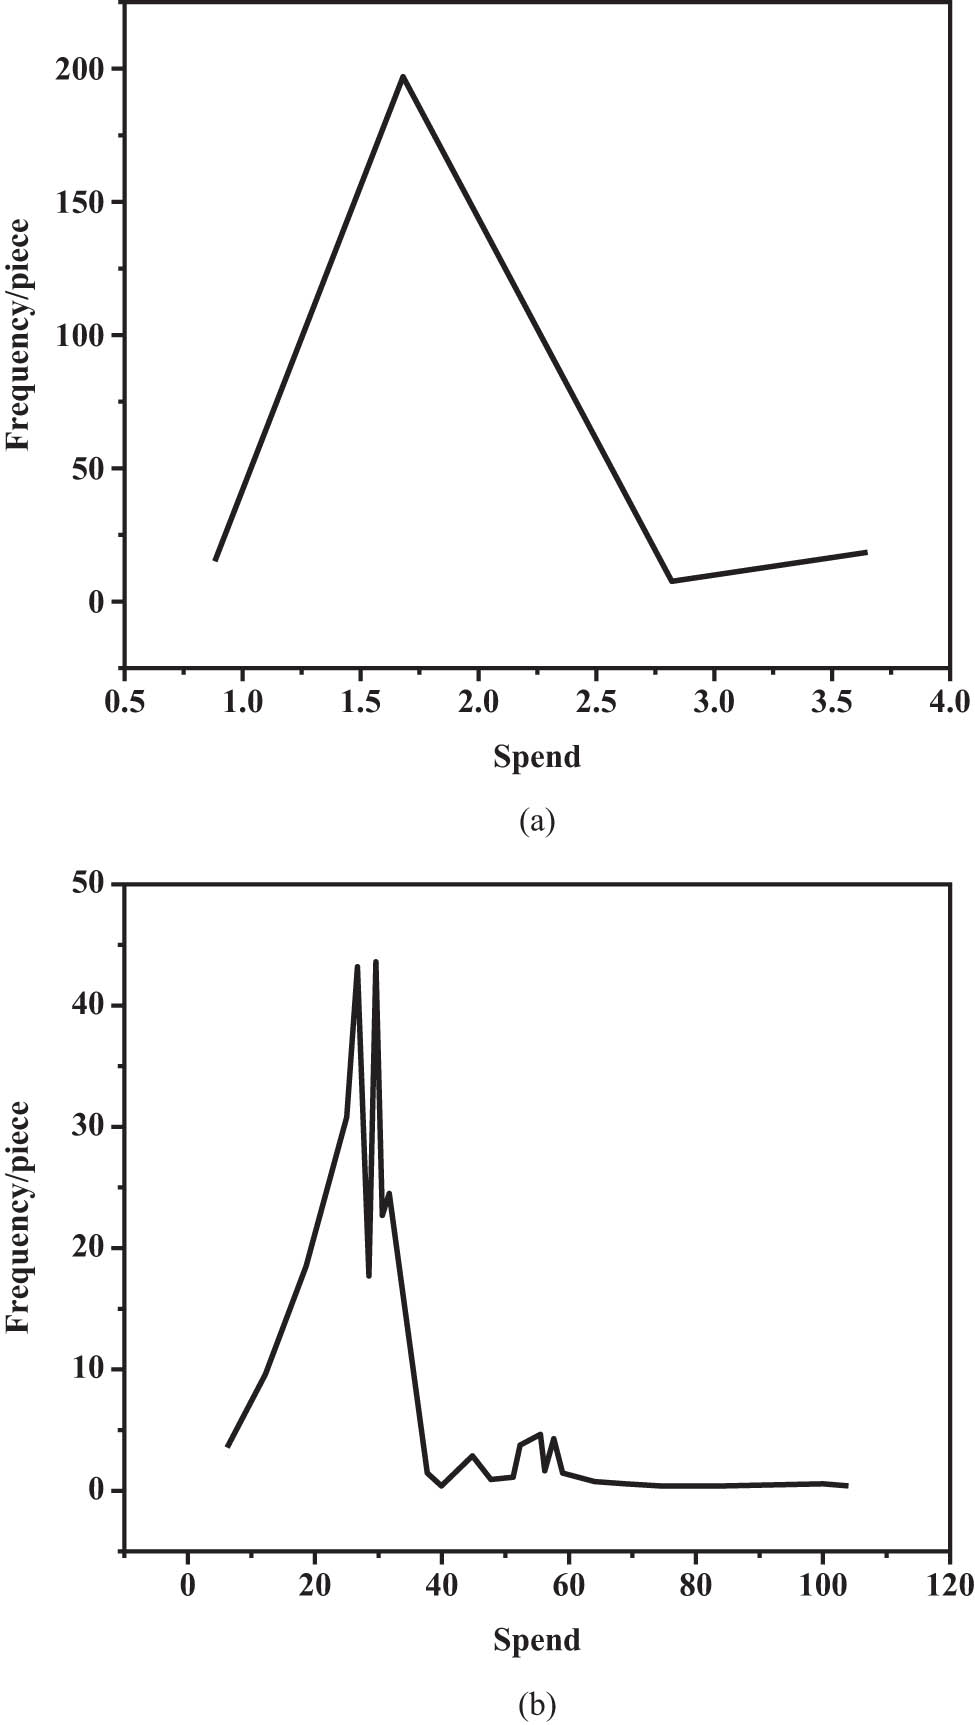
Frequency distribution of node degree in network. (a) L space and (b) P space.
Figure 3a and b shows the equation distributions for the L and P position equations, respectively. The results show about classification of exponential division type, which is also similar to the previous network degree distribution.
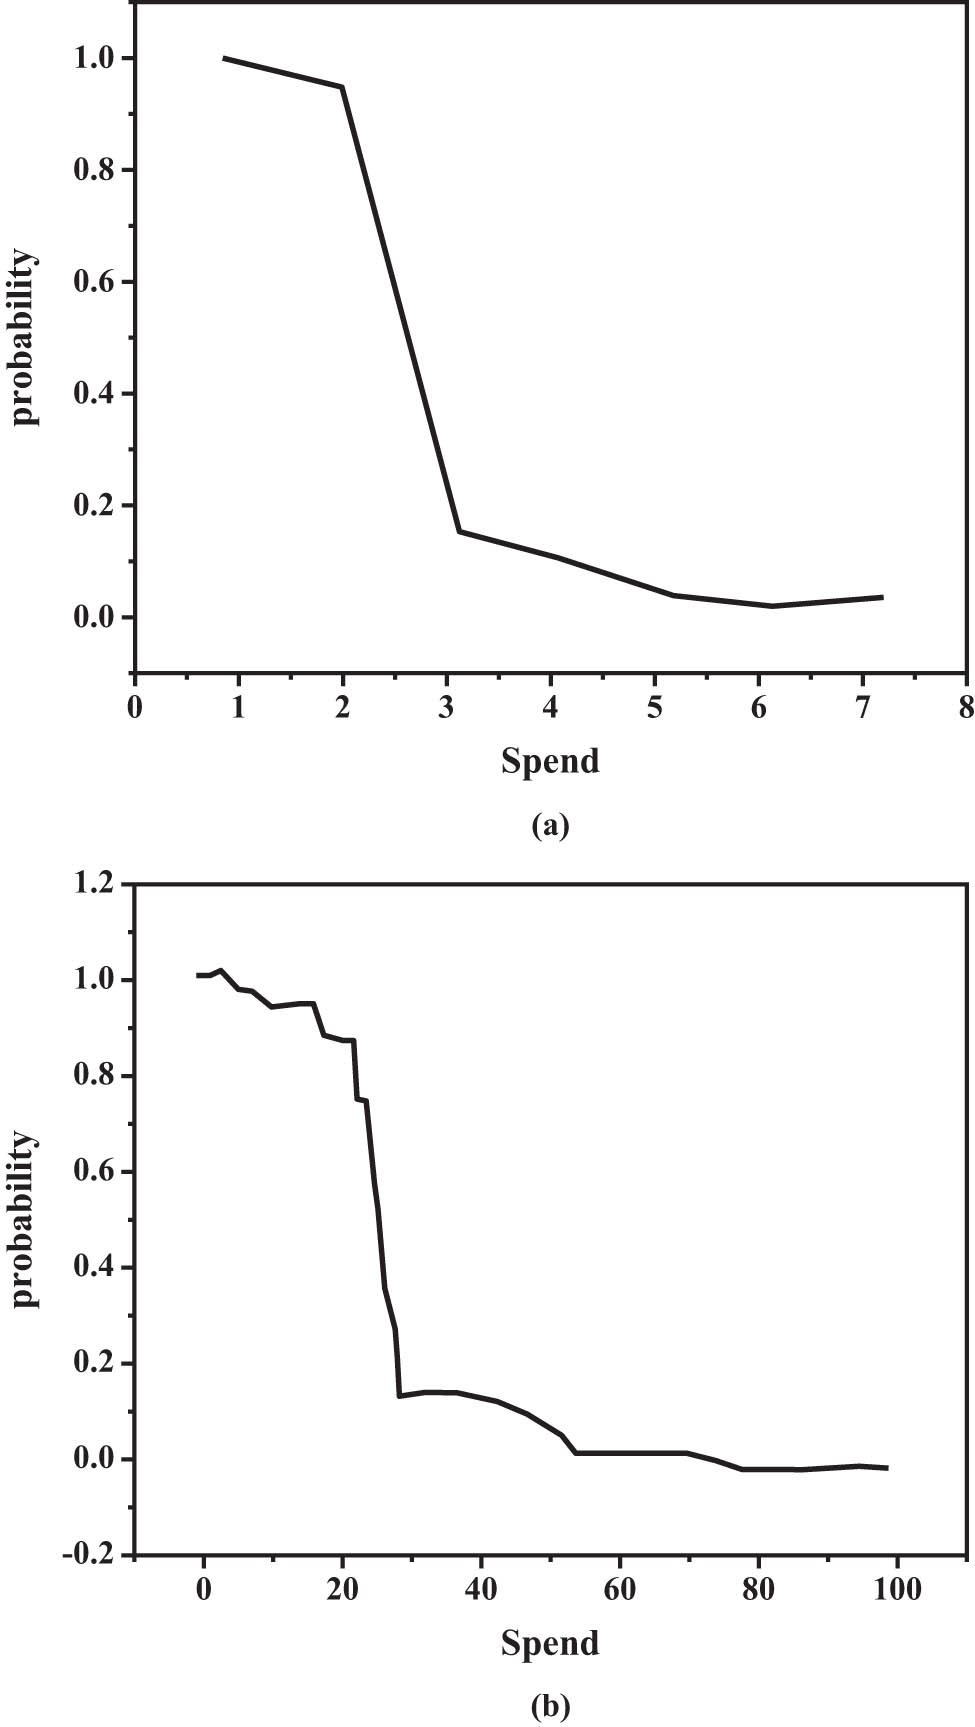
Cumulative probability of node degree in different spaces. (a) L space and (b) P space.
4.2.2 Shortest path analysis
At position L, the shortest maximum value in the network is 42, that is, 42 stations need to pass from Gangcheng road of line 6 to Anting of line 11, of which the bifurcation of line 11 is calculated as the whole line, that is, line 11 reaches Jiading new city – Baiyin road – Jiading West – Jiading North – Shanghai Race yard – Changji East Road – Shanghai Auto City – Anting. The average shortest path of the network is 14.519, that is, it takes an average of 14–15 stations to reach any other station from any station. As can be seen from Figure 4, the shortest paths of nodes are usually divided between 5 and 30, that is, starting from any station, the average probability of reaching the destination through 5–30 stations is the highest. In P space, the maximum and minimum distance is 4, that is, it takes three transfers from one node to another. For example, the stations from Century Avenue to Gangcheng road from line 5 to line 6 need three transfers, so their minimum distance is 4. The shortest path distance is 1, i.e., the shortest path from one of the nodes to all other paths is 1. The average shortest distance of the network is 2.1464, that is, at position P, the average distance from one point in the network to another is only 2.1464.
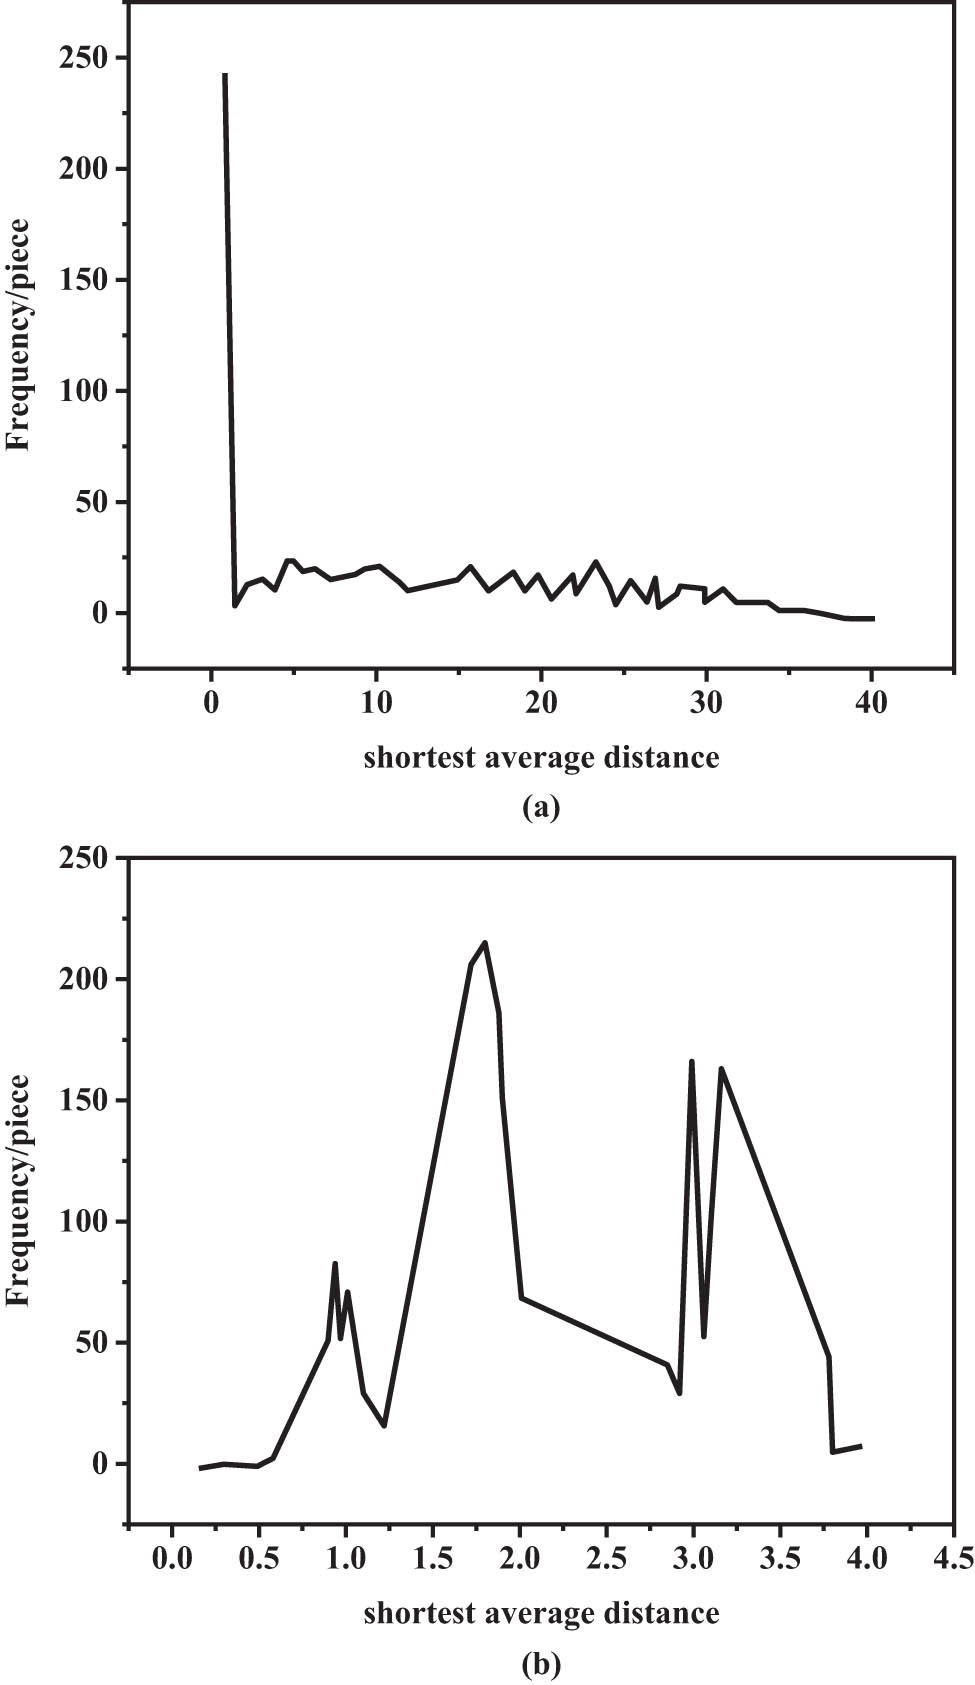
Frequency of path length in (a) L space and (b) P space.
4.3 Analysis results of urban rail transit network in L and P space
By analyzing the coefficients of previous degree and classification, shortest method, and group, it can be seen that the topological properties of various networks in L space and P space are quite different. The two methods have their own characteristics for describing the properties of networks. For example, a level tester in the L position can know the number of lines adjacent to the network, while in the P position it can know the number of stations that the network node can directly reach without changing. Analysis of the shortest path at distance L tells the number of stations between that station and another station, while the shortest path at distance P tells any other station how many passes.
4.4 Suggestions
The urban rail transit network of many cities in my country is in the expansion stage. Due to various limitations, the main purpose of studying the reliability of urban rail transit network connection is not how to rebuild the entire urban rail transit network, but to put forward planning suggestions for new lines and optimization measures for daily operation and passenger flow organization based on the existing urban rail transit network. From the comments above, the following points can be improved:
Optimize the network structure from the perspective of planning:
By calculating the benefits of the sample model, it can be seen that with the continuous expansion of the urban train crossing scale, the reliability of the network connection is also improving. With the further development of the city, more lines will be built to join the original cable network in the later stage, and some ordinary stations will be “upgraded” to transfer stations, and the importance of transfer stations is obvious. This traffic volume also affects the importance of its adjacent stations, which means that the importance of most of the stations in the network will gradually increase to some extent, and thus the network reliability of all urban train transportation will increase. Therefore, in the planning stage of the new line of the urban rail transit network, how to choose the new interchange station will have a positive impact on the reliability of all urban rail transit networks.
Strengthen the early warning of key stations and lines:
In the sample model, when a higher priority site is attacked, the reliability of the network connection is greatly reduced. Therefore, in order to improve the operation efficiency of urban railways, it is necessary to strengthen the protection of stations, which is of greater importance. First of all, in order to ensure the safety and stability of the facilities and equipment in the parking lot, special personnel should be arranged to inspect and manage the facilities and equipment in the parking lot to avoid affecting the daily operation of the station. The second is to strengthen the employee training, carry out continuous training on employee safety, improve employee quality, and enhance trust through the ideas of good employees. Finally, strengthen the commuting capacity of key stations. Commuters at major stations will increase further during morning and evening rush hours or on weekends. This will lead to low site performance and affect the reliability of all network connections.
Complete station emergency plan
Computational results on the sample model show that the connection reliability of the network is very low at the beginning of the attack and gradually becomes flat after the attack phase. Therefore, in the early stage of failure, the first emergency plan is activated to process the connected lines, which can prevent the transmission of the faulty node. The main task of the railway is to use various markings according to the actual situation of the urban railway, formulate emergency plans, and eliminate them in time and during an emergency.
5 Conclusion
Taking the Shanghai subway network as an example, the statistical analysis of the Space L and Space P topology models shows that one line of the Shanghai rail transit network connects 6.33 lines on average, and the average coefficient of the network cluster is 0.7745. The entire network is more compact. In space L, the degree value of the network is small; more than 80% of the nodes have degree 2. The degree distribution is very concentrated, and the length of the shortest path is also large. Overall, the whole network representation actually needs to be passed from one point to another. The average value of the points in the network or the integration of the network is the smallest which is close to 0. This is the basis for a comparative study of various trains in the future urban train transformation. In order to reduce the amount of calculation, this article mainly selects some sites in central Shanghai as one of the endpoints of the connecting line. In future studies, connections between other lines can be considered, and the line endpoints do not need to be fixed.
Acknowledgment
College Humanities and Social Sciences project of Henan Provincial Department of Education “Study on the impact of the opening of new urban rail transit lines on the operation of existing lines – Taking Zhengzhou Metro as an example.” The project number: 2022-ZZJH-056.
-
Author contributions: The author have accepted responsibility for the entire content of this manuscript and approved its submission.
-
Conflict of interest: The author states no conflict of interest.
References
[1] Yan L, Cengiz K, Sharma A. An improved image processing algorithm for automatic defect inspection in TFT-LCD TCON. Nonlinear Eng. 2021;10(1):293–303.10.1515/nleng-2021-0023Suche in Google Scholar
[2] Shao W, Zhang J, Zhao X, Liu W. Robustness assessments of urban rail transit networks based on network utilization. IEEE Access. 2021;9:129161–7.10.1109/ACCESS.2021.3113351Suche in Google Scholar
[3] Xu W, Zhao P, Ning L. Last train delay management in urban rail transit network: bi-objective MIP model and genetic algorithm. KSCE J Civ Eng. 2018;22(4):1436–45.10.1007/s12205-017-1786-0Suche in Google Scholar
[4] Wu S, Zhu Y, Li N, Wang Y, Sun DJ. Urban rail transit system network reliability analysis based on a coupled map lattice model. J Adv Transp. 2021;2021(4 Pt 2):1–9.10.1155/2021/5548956Suche in Google Scholar
[5] Luan X, Cheng L, Song Y, Sun C. Performance evaluation and alternative optimization model of light rail transit network projects: a real case perspective. Can J Civ Eng. 2019;46(9):836–46.10.1139/cjce-2018-0505Suche in Google Scholar
[6] Hua W, Ong GP. Effect of information contagion during train service disruption for an integrated rail-bus transit system. Public Transp. 2018;10(3):571–94.10.1007/s12469-018-0192-4Suche in Google Scholar
[7] Gao C, Fan Y, Jiang S, Deng Y, Li X. Dynamic robustness analysis of a two-layer rail transit network model. IEEE Trans Intell Transp Syst. 2021;23:6509–24.10.1109/TITS.2021.3058185Suche in Google Scholar
[8] Yin H, Wu J, Liu Z, Yang X, Qu Y, Sun H. Optimizing the release of passenger flow guidance information in urban rail transit network via agent-based simulation. Appl Math Model. 2019;72(AUG.):337–55.10.1016/j.apm.2019.02.003Suche in Google Scholar
[9] Yang Y, Liu J, Shang P, Chen X, Cao J. Temporal and spatial evolution of passenger flow in an urban rail transit network during station closure. IEEE Access. 2021;9:29623–40.10.1109/ACCESS.2021.3059756Suche in Google Scholar
[10] Lin X. The optimization strategy of data driven urban rail transit network. Adv Appl Math. 2020;9(6):919–24.10.12677/AAM.2020.96109Suche in Google Scholar
[11] Xu H, Li Y. Robustness analysis of urban rail transit network. Int J Perform Eng. 2019;15(10):2762–2.10.23940/ijpe.19.10.p23.27622771Suche in Google Scholar
[12] Jiang X, Feng J, Jia F. Modeling and simulation of passenger distribution in large-scale urban rail transit network. Tiedao Xuebao/J China Railw Soc. 2019;40(11):9–18.Suche in Google Scholar
[13] Li M, Wang H, Wang H. Resilience assessment and optimization for urban rail transit networks: a case study of Beijing subway network. IEEE Access. 2019;7:71221–34.10.1109/ACCESS.2019.2919105Suche in Google Scholar
[14] Xu W, Zhao P, Ning L, Zhang H. A timetable rescheduling model based on random delay scenarios for last trains in an urban rail transit network. Tiedao Xuebao/J China Railw Soc. 2018;40(8):28–33.Suche in Google Scholar
[15] Zhang J. Agent-based optimizing match between passenger demand and service supply for urban rail transit network with netlogo. IEEE Access. 2021;9:32064–80.10.1109/ACCESS.2021.3060816Suche in Google Scholar
[16] Li CJ, Liu GP. Consensus for heterogeneous networked multi-agent systems with switching topology and time-varying delays. J Frankl Inst. 2018;355(10):4198–217.10.1016/j.jfranklin.2018.04.003Suche in Google Scholar
[17] Dhiman G, Kumar V, Kaur A, Sharma A. Don: deep learning and optimization-based framework for detection of novel coronavirus disease using x-ray images. Interdiscip Sci Comput Life Sci. 2021;13:260–72.10.1007/s12539-021-00418-7Suche in Google Scholar
[18] Linul E, Serban DA, Marsavina L. Influence of cell topology on mode i fracture toughness of cellular structures. Phys Mesomech. 2018;21(2):178–86.10.1134/S1029959918020121Suche in Google Scholar
[19] Raj M, Manimegalai P, Ajay P, Amose J. Lipid Data Acquisition for devices Treatment of Coronary Diseases Health stuff on the Internet of Medical Things. J Phys: Conf Ser. 2021;1937:012038.10.1088/1742-6596/1937/1/012038Suche in Google Scholar
[20] Li L, Diao Y, Liu X. Ce-Mn mixed oxides supported on glass-fiber for low-temperature selective catalytic reduction of NO with NH3. J Rare Earths. 2014;32:409–15.10.1016/S1002-0721(14)60086-7Suche in Google Scholar
[21] Hillier C, Balyan V. Error Detection and Correction On-Board Nanosatellites Using Hamming Codes. J Electr Comput Eng. 2019;2019:3905094–15.10.1155/2019/3905094Suche in Google Scholar
[22] Babalola OP, Balyan V. Efficient Channel Coding for Dimmable Visible Light Communications System. IEEE Access. 2020;8:215100–06.10.1109/ACCESS.2020.3041431Suche in Google Scholar
[23] Balyan V, Daniels R. Resource allocation for NOMA based networks using relays: cell centre and cell edge users. Int J Smart Sens Intell Syst. 2020;13(1):18–8.10.21307/ijssis-2020-031Suche in Google Scholar
[24] Balyan V. Outage Probability of Cognitive Radio Network Utilizing Non Orthogonal Multiple Access. 7th International Conference on Signal Processing and Integrated Networks (SPIN); 2020 Feb 27–28; Noida, India; IEEE; 2020. p. 751–5.10.1109/SPIN48934.2020.9071401Suche in Google Scholar
[25] Huang R, Zhang S, Zhang W, Yang X. Progress of zinc oxide-based nanocomposites in the textile industry. IET Collab Intell Manuf. 2021;3(3):281–9.10.1049/cim2.12029Suche in Google Scholar
[26] Yao S, Zou J, Jiang J, Shen Z. Analysis and forecast of urban rail transit network based on LTE signaling. J Phys Conf Ser. 2021;1948(1):012031.10.1088/1742-6596/1948/1/012031Suche in Google Scholar
© 2022 Ya Li, published by De Gruyter
This work is licensed under the Creative Commons Attribution 4.0 International License.
Artikel in diesem Heft
- Research Articles
- Fractal approach to the fluidity of a cement mortar
- Novel results on conformable Bessel functions
- The role of relaxation and retardation phenomenon of Oldroyd-B fluid flow through Stehfest’s and Tzou’s algorithms
- Damage identification of wind turbine blades based on dynamic characteristics
- Improving nonlinear behavior and tensile and compressive strengths of sustainable lightweight concrete using waste glass powder, nanosilica, and recycled polypropylene fiber
- Two-point nonlocal nonlinear fractional boundary value problem with Caputo derivative: Analysis and numerical solution
- Construction of optical solitons of Radhakrishnan–Kundu–Lakshmanan equation in birefringent fibers
- Dynamics and simulations of discretized Caputo-conformable fractional-order Lotka–Volterra models
- Research on facial expression recognition based on an improved fusion algorithm
- N-dimensional quintic B-spline functions for solving n-dimensional partial differential equations
- Solution of two-dimensional fractional diffusion equation by a novel hybrid D(TQ) method
- Investigation of three-dimensional hybrid nanofluid flow affected by nonuniform MHD over exponential stretching/shrinking plate
- Solution for a rotational pendulum system by the Rach–Adomian–Meyers decomposition method
- Study on the technical parameters model of the functional components of cone crushers
- Using Krasnoselskii's theorem to investigate the Cauchy and neutral fractional q-integro-differential equation via numerical technique
- Smear character recognition method of side-end power meter based on PCA image enhancement
- Significance of adding titanium dioxide nanoparticles to an existing distilled water conveying aluminum oxide and zinc oxide nanoparticles: Scrutinization of chemical reactive ternary-hybrid nanofluid due to bioconvection on a convectively heated surface
- An analytical approach for Shehu transform on fractional coupled 1D, 2D and 3D Burgers’ equations
- Exploration of the dynamics of hyperbolic tangent fluid through a tapered asymmetric porous channel
- Bond behavior of recycled coarse aggregate concrete with rebar after freeze–thaw cycles: Finite element nonlinear analysis
- Edge detection using nonlinear structure tensor
- Synchronizing a synchronverter to an unbalanced power grid using sequence component decomposition
- Distinguishability criteria of conformable hybrid linear systems
- A new computational investigation to the new exact solutions of (3 + 1)-dimensional WKdV equations via two novel procedures arising in shallow water magnetohydrodynamics
- A passive verses active exposure of mathematical smoking model: A role for optimal and dynamical control
- A new analytical method to simulate the mutual impact of space-time memory indices embedded in (1 + 2)-physical models
- Exploration of peristaltic pumping of Casson fluid flow through a porous peripheral layer in a channel
- Investigation of optimized ELM using Invasive Weed-optimization and Cuckoo-Search optimization
- Analytical analysis for non-homogeneous two-layer functionally graded material
- Investigation of critical load of structures using modified energy method in nonlinear-geometry solid mechanics problems
- Thermal and multi-boiling analysis of a rectangular porous fin: A spectral approach
- The path planning of collision avoidance for an unmanned ship navigating in waterways based on an artificial neural network
- Shear bond and compressive strength of clay stabilised with lime/cement jet grouting and deep mixing: A case of Norvik, Nynäshamn
- Communication
- Results for the heat transfer of a fin with exponential-law temperature-dependent thermal conductivity and power-law temperature-dependent heat transfer coefficients
- Special Issue: Recent trends and emergence of technology in nonlinear engineering and its applications - Part I
- Research on fault detection and identification methods of nonlinear dynamic process based on ICA
- Multi-objective optimization design of steel structure building energy consumption simulation based on genetic algorithm
- Study on modal parameter identification of engineering structures based on nonlinear characteristics
- On-line monitoring of steel ball stamping by mechatronics cold heading equipment based on PVDF polymer sensing material
- Vibration signal acquisition and computer simulation detection of mechanical equipment failure
- Development of a CPU-GPU heterogeneous platform based on a nonlinear parallel algorithm
- A GA-BP neural network for nonlinear time-series forecasting and its application in cigarette sales forecast
- Analysis of radiation effects of semiconductor devices based on numerical simulation Fermi–Dirac
- Design of motion-assisted training control system based on nonlinear mechanics
- Nonlinear discrete system model of tobacco supply chain information
- Performance degradation detection method of aeroengine fuel metering device
- Research on contour feature extraction method of multiple sports images based on nonlinear mechanics
- Design and implementation of Internet-of-Things software monitoring and early warning system based on nonlinear technology
- Application of nonlinear adaptive technology in GPS positioning trajectory of ship navigation
- Real-time control of laboratory information system based on nonlinear programming
- Software engineering defect detection and classification system based on artificial intelligence
- Vibration signal collection and analysis of mechanical equipment failure based on computer simulation detection
- Fractal analysis of retinal vasculature in relation with retinal diseases – an machine learning approach
- Application of programmable logic control in the nonlinear machine automation control using numerical control technology
- Application of nonlinear recursion equation in network security risk detection
- Study on mechanical maintenance method of ballasted track of high-speed railway based on nonlinear discrete element theory
- Optimal control and nonlinear numerical simulation analysis of tunnel rock deformation parameters
- Nonlinear reliability of urban rail transit network connectivity based on computer aided design and topology
- Optimization of target acquisition and sorting for object-finding multi-manipulator based on open MV vision
- Nonlinear numerical simulation of dynamic response of pile site and pile foundation under earthquake
- Research on stability of hydraulic system based on nonlinear PID control
- Design and simulation of vehicle vibration test based on virtual reality technology
- Nonlinear parameter optimization method for high-resolution monitoring of marine environment
- Mobile app for COVID-19 patient education – Development process using the analysis, design, development, implementation, and evaluation models
- Internet of Things-based smart vehicles design of bio-inspired algorithms using artificial intelligence charging system
- Construction vibration risk assessment of engineering projects based on nonlinear feature algorithm
- Application of third-order nonlinear optical materials in complex crystalline chemical reactions of borates
- Evaluation of LoRa nodes for long-range communication
- Secret information security system in computer network based on Bayesian classification and nonlinear algorithm
- Experimental and simulation research on the difference in motion technology levels based on nonlinear characteristics
- Research on computer 3D image encryption processing based on the nonlinear algorithm
- Outage probability for a multiuser NOMA-based network using energy harvesting relays