Vibration signal collection and analysis of mechanical equipment failure based on computer simulation detection
-
Chiyue Qin
 ,
Rana Gill
,
Rana Gill

Abstract
This article addresses the challenge of large error rate and low accuracy of the vibration signal collection of mechanical equipment failure, and proposes a mechanical equipment failure vibration signal collection and analysis based on computer simulation detection. Then, it uses the Kalman filter algorithm for data filtering, according to the mathematical model established by the system, thus choosing a suitable noise covariance calculation method. In the integration process after filtering, using a piecewise integration method between acceleration peaks, the integration calculation is optimized to obtain the vibration displacement. The simulation results of this article show the vibration data collected by the main controller, after Kalman filtering and piecewise trapezoidal integration method optimization. The error of the proposed method is 0.5% when the frequency is 80 Hz, relative to the displacement measurement method of the three-axis acceleration sensor at 8.3%, and the error of data calculation results is greatly reduced. The greater the amplitude of vibration, the smaller the error. This method significantly improves the accuracy of vibration signal collection of mechanical equipment.
1 Introduction
In the field of fault diagnosis, equipment monitoring has always been a topic of much concern. Especially nowadays, informatization and intelligence have become the subject terms of monitoring technology. Due to the development requirements of the industry, the environment faced by machinery and equipment is more severe; naturally, the requirements for various performance indicators of mechanical equipment have also increased [1]. Especially in some key parts of mechanical equipment, its quality directly affects the operating efficiency of this equipment [2]. But because these key parts are in the early stage of failure, there are no particularly obvious features, and because technicians cannot carry out real-time tracking and maintenance, cause the failure of this part to intensify, eventually leading to the failure of parts and even the entire equipment, this makes the monitoring of machinery and equipment particularly important. At present, countries all over the world have begun scrambling for research on fault detection technology. During the research, it is necessary to select suitable research objects – it must also be aimed at the failure mechanism and operating environment – and to choose the right solution. Therefore, fault diagnosis of mechanical equipment has become one of the important projects in various countries [3,4].
In terms of troubleshooting issues, the failure mechanism must be analyzed first. The so-called failure mechanism is supported by a large number of theoretical foundations in advance. This article analyzes the data through continuous experiments in the later stage; finally, a characteristic signal that can reflect equipment failure information is obtained. When finding out the signal and equipment failure, the connection between them can become a set of theoretical systems that can describe the various situations of the equipment [5]. Generally speaking, when the equipment is running, there will be abnormalities, and these abnormalities can be reflected by some kind of signal, and these signals will also have some relationship with time; there will be many objective laws in this, such as secondary effects [6,7]. The so-called secondary effect is in the operation of equipment; there will be various physical phenomena and changes in physical quantities such as vibration, pressure, and temperature. Fault diagnosis technology uses an accurate and fast method to extract the secondary effects shown in the mechanical equipment, and according to the state characteristics, it reflects and accurately finds the cause of the equipment failure [8]. Figure 1 is a diagram of the vibration signal collection of mechanical equipment failures.
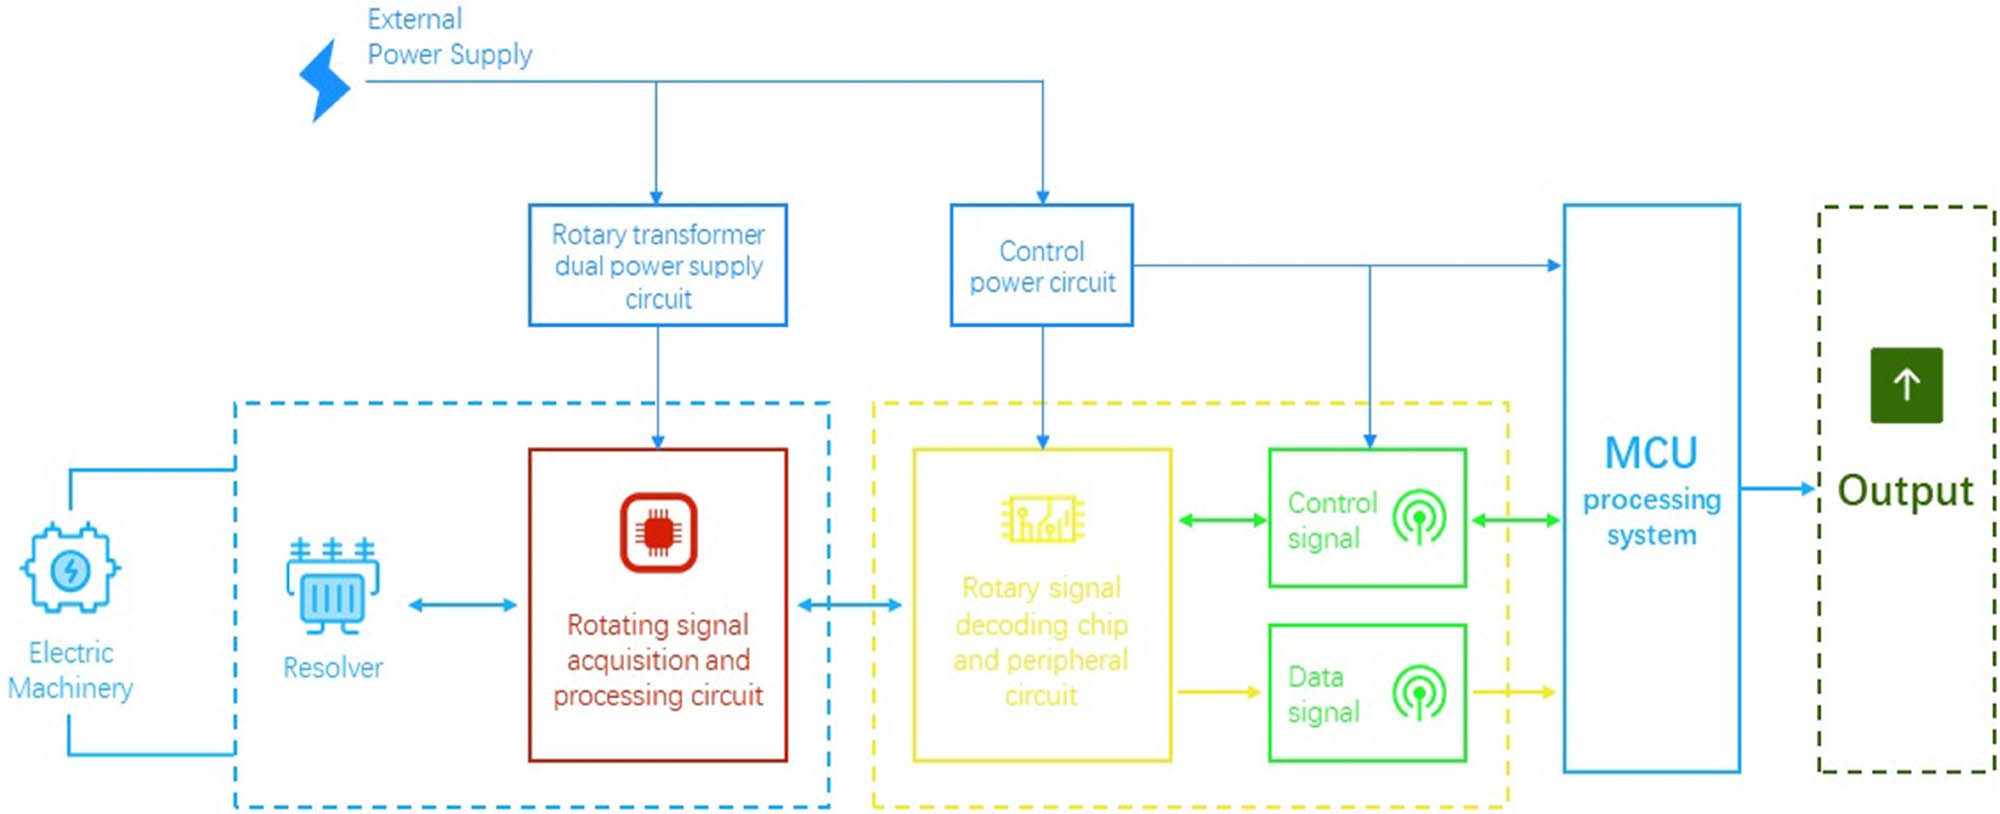
A kind of high-power mechanical equipment failure vibration signal collection.
The state-of-the-art approaches have several challenges of large error rate and low accuracy of the vibration signal collection of mechanical equipment failure [9,10]. This article proposes a mechanical equipment failure vibration signal collection and analysis based on computer simulation detection [11]. It uses the Kalman filter algorithm for data filtering, according to the mathematical model established by the system. Thus, it chooses a suitable noise covariance calculation method. The article optimizes the integration calculation to obtain the vibration displacement, in the integration process after filtering, using a piecewise integration method between acceleration peaks. It is observed from this article that the greater the amplitude of vibration, the smaller the error. This method significantly improves the accuracy of vibration signal collection of mechanical equipment.
The remaining of this article is organized as follows: Section 2 presents the survey of literature, Section 3 presents the methodology followed by results presented in Section 4. The conclusion is presented along with the future scope in Section 5.
2 Survey of literature
At present, many experts and scholars have applied mechanical equipment and conducted in-depth theoretical analyses, after they have gone through various experimental studies and analyses, for the typical failure mechanism of each part of the mechanical equipment, all have a new understanding. Lyu et al. focused on the anti-interference acquisition method of mechanical equipment vibration signals based on pattern matching. This method first obtains the cycle start and end points of the signal, and the fundamental frequency period of the vibration signal; on this basis, the anti-interference collection of vibration signals of mechanical equipment is completed [12]. Shifat and Hur proposed that equipment can be randomly monitored during the testing process and effectively improved the accuracy and efficiency of equipment fault diagnosis, thereby improving the safety of the normal and stable operation of the equipment, reducing the labor intensity of inspectors, and making management more scientific and humanized [13]. Bouhalais and Nouioua introduced a vibration signal acquisition and processing system with low power consumption and high reliability, using a built-in IC piezoelectric acceleration sensor, to realize the collection of equipment vibration signals. After the acquisition signal is processed, on the one hand, the data are transmitted to the PC through Zigbee wireless transmission; on the one hand, the liquid crystal display screen of the display terminal displays the vibration acceleration value of the current detection device [14]. Strombergsson et al. conducted effective inspections on the operating status of power equipment, then perform fault diagnosis of mechanical equipment, find, and solve the problem in the early stage of the failure [15]. Mousmoulis et al. proposed an anti-jamming acquisition method for mechanical equipment vibration signals based on fast independent component analysis. This method calculates the linear mixture of independent sources of each observed signal, separates independent source signals from the mixed signal, and completes anti-interference collection of vibration signals of mechanical equipment. The collection efficiency of this method is higher; however, there is a problem of large limitations in signal acquisition [16]. Xia et al. put forward an anti-disturbance collection method of mechanical equipment vibration signals based on improved particle swarms. This method gives the criterion of the independence of the signal and defines the fourth-order cumulant of the signal random variable; fusion in particle swarm theory takes kurtosis as the objective function, optimizing the collection of vibration signals of mechanical equipment [17]. Zheng et al. used the hard threshold method, soft threshold method, and semi-soft threshold method, to purify the noisy axis trajectory, and then proceed to fault detection [18]. Ning et al., through noise reduction processing, traditional wavelet and boosted wavelet soft and hard thresholds, can remove the noise of the signal to a certain extent, in order to better analyze and improve the performance and denoizing effect of wavelet, statistics of fault detection results in the same environment [19]. Copertaro et al. and others introduced the basic theory of lifting wavelet transform; on the basis of traditional wavelet soft and hard thresholds, a denoizing method of lifting wavelet is proposed, and through simulation, the denoizing performance of the two is compared [20]. Liu et al. used the original vibration signal collected by the detection instrument, often mixed with a lot of noise, in order to extract key fault information; the most important thing is to reduce the noise of the vibration signal [21].
Based on the literature review, the author according to the characteristics of the vibration signal of rotating machinery studies the principle of wavelet threshold denoizing, the lifting wavelet transform is applied to the purification and denoizing of the axis trajectory [22]. The survey of literature presents the decomposition of the existing wavelet filter into basic building blocks and completes the integer transformation of the wavelet step by step. Furthermore, the research extracts wavelet coefficients more efficiently, effectively separates signal and noise, and realizes precise reconstruction [23]. The results of the simulation and purification of the axis trajectory show that, compared with traditional wavelets, boosted wavelets are used in signal denoizing, achieving maximum suppression of noise and preservation of signal characteristics.
3 Research methods
3.1 Extraction of vibration characteristics of mechanical equipment failure
“Wavelet transform method, at the same time, the characteristics of the signal in the time domain and the frequency domain are considered, it can better characterize the local characteristics of the signal.” But the high-frequency decomposition is not fine enough, the wavelet packet decomposition method is to make up for this shortcoming, and it can realize the refined decomposition of the high-frequency part [24]. For this reason, this article adopts wavelet packet decomposition and support vector machine (SVM), in order to extract features of mechanical faults. The wavelet packet decomposition method is used to decompose the vibration signal by wavelet, take the obtained relative wavelet energy as the feature vector, and apply the SVM classifier for mechanical fault diagnosis. The specific process is shown in Figure 2.
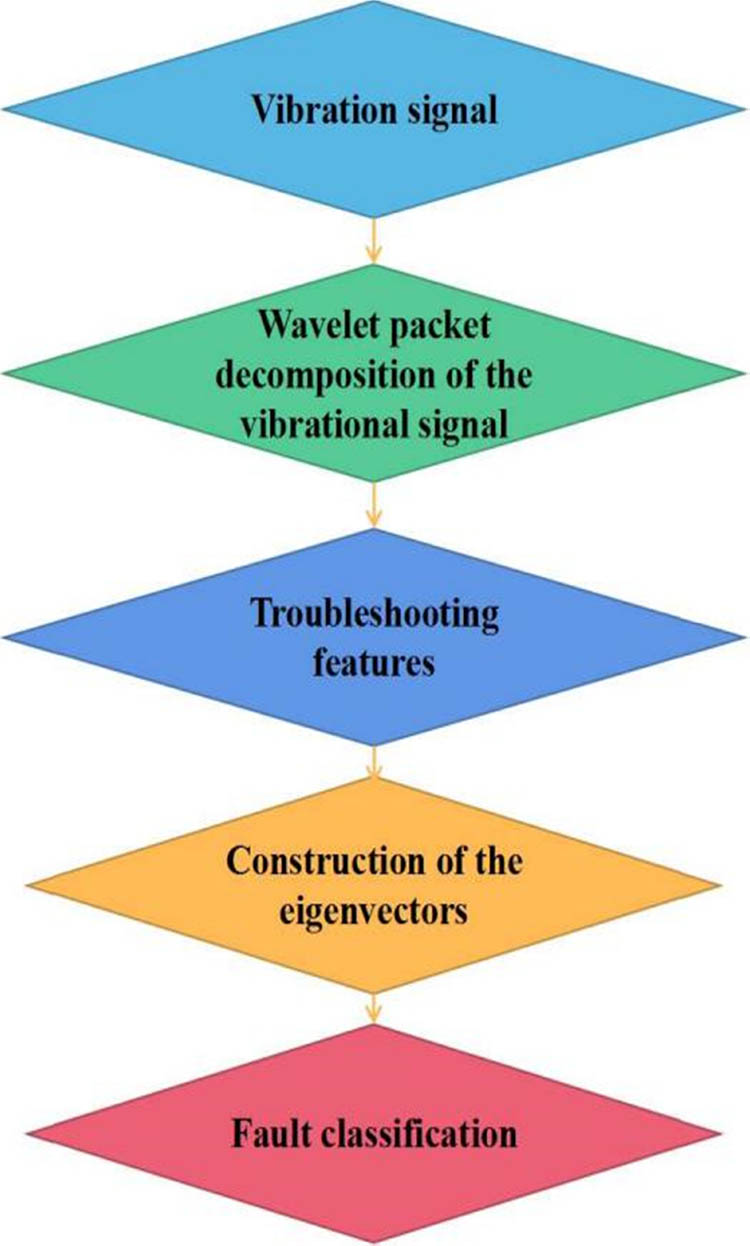
Mechanical equipment fault feature extraction process.
3.1.1 Fault feature extraction and feature vector construction
Applying the wavelet packet decomposition method, after discrete decomposition of the mechanical vibration signal x(t), the obtained decomposition frequency bands are independent of each other and have no redundancy; for this reason, there is energy conservation force as shown in formula (1):
Among, E
n
(·) is the signal energy, at j horizontal resolution, x
k,m
(i) represents the discrete signal of the signal
Among them, K is the number of decompositions, and m = 0, 1, 2, … 2 k − 1 represents the position number of the decomposed frequency band.
After normalization, the relative wavelet energy of the decomposed signal in the mth band can be expressed as shown in formula (3):
Combined with the law of conservation of energy, as shown in formula (4):
Changes in the operating state of machinery will affect the signals in each frequency band of the vibration signal, and the energy will change accordingly; this decomposes the ratio of frequency band signal energy to total energy to form the feature vector e and can better characterize equipment failure characteristics; its expression formula is shown in formula (5):
3.1.2 Fault diagnosis based on SVM
This article uses SVMs as a classifier for mechanical fault diagnosis, and the “one-to-one” SVM multi-class identification method is adopted. The SVM kernel function selects the radial basis kernel function, as shown in formula (6):
Among them, in the formula, x and y are the center of the kernel function, in order to control the width coefficient of the kernel function and the radial range of the function, aiming at the condition of inseparable linearity; the penalty factor C is introduced to control the misclassification, taking the relative wavelet energy of the vibration signal as the feature vector and using these feature vectors as the input of the SVM classifier. For model training, the support vector in the training sample of the known state is obtained and then the optimal classification hyperplane is determined, in order to achieve a higher recognition rate of all data sets, effectively judge the failure type and damage degree of mechanical equipment, and improve the identification efficiency and accuracy of mechanical equipment failure [25].
3.2 Vibration signal acquisition and positioning detection method
Data filtering processing of vibration displacement detection system: Kalman filtering treats the signal process as the output of a linear system under the action of white noise. While taking the minimum mean square error as the best estimation criterion, using a state space model of signal and noise, state equations are used to describe the relationship between input and output, and the optimal value from the estimated value and the observed value are obtained.
The algorithm mainly includes two calculation processes: Time update equation and state update equation, respectively, use the following formulas (7) and (8) to express:
In the formula, A represents the process matrix, and the process matrix at time k is A (k), C represents the measurement matrix, and the measurement matrix at time k is C (k). Q represents the variance of the process noise, and the variance of the process noise at time k is Q (k). R represents the measurement noise variance, and the measurement noise variance at time k is R (k). P represents the state estimation variance, and the state estimation variance at time k is P (k). The above Eq. (7) represents the predicted state quantity, and the Eq. (8) represents the predicted mean square error.
The acceleration values collected by the micro-electromechanical systems (MEMS) vibration sensor of the proposed method are three-dimensional data of X, Y, and Z axes. In the process of processing, each dimension of data is processed separately, and finally, the data are synthesized. So for data processing, in the above formula, it can be considered that both A and C are 1, and formulas (7) and (8) can be simplified to formulas (9) and (10):
The above data model of Kalman filtering is used mainly to determine the noise covariance Q of the predicted value and the value of the noise covariance R of the measured value. The original data collected by the proposed method are the voltage value. According to the MEMS acceleration sensor, the instruction manual can be directly converted into the corresponding acceleration value z(i). For the value of Q, the value method is used as shown in formula (11); that is, for every data collected, the absolute value of the difference with the previous data is added and then averaged, to get the average of the data difference. When Kalman filtering is performed on each data, the absolute value of the difference between the current data and the previous data, the square of the difference between and average, as the Q value at the moment, are evaluated as shown in formula (11):
In the formula, N represents the length of the collected data z. For the value of the noise covariance R of the measured value, in this system, according to specific data analysis, the value method is consistent with the value of noise covariance Q. The sampling rate is 1k, different amplitude data with frequencies of 80 and 40 Hz are filtered, and the curve comparison before and after filtering is shown in Figures 3 and 4.
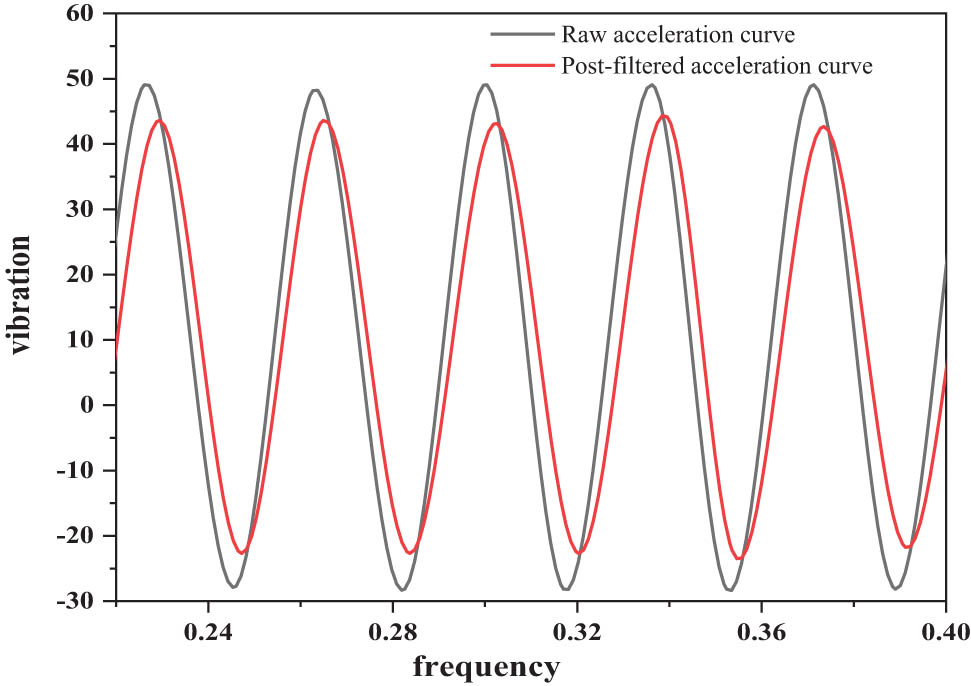
Curve comparison diagram of 80 Hz and 300 μm amplitude acquisition data filtering.
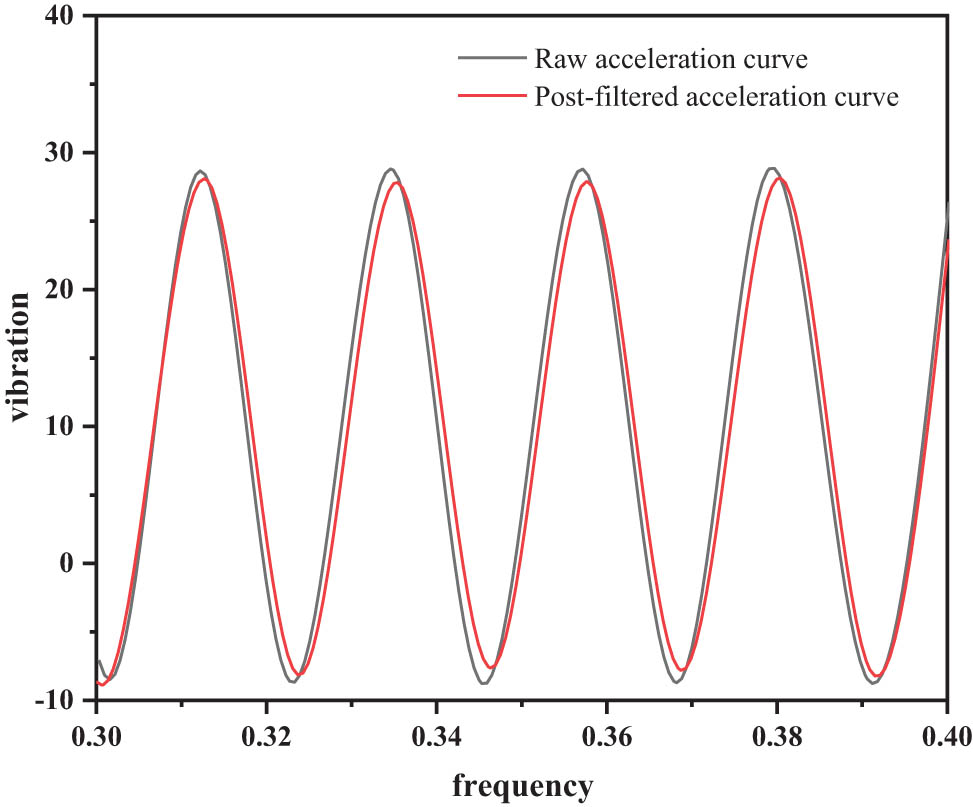
Comparison of curves of 40 Hz and 600 μm amplitude acquisition data filtering.
3.3 Integral optimization processing of vibration displacement
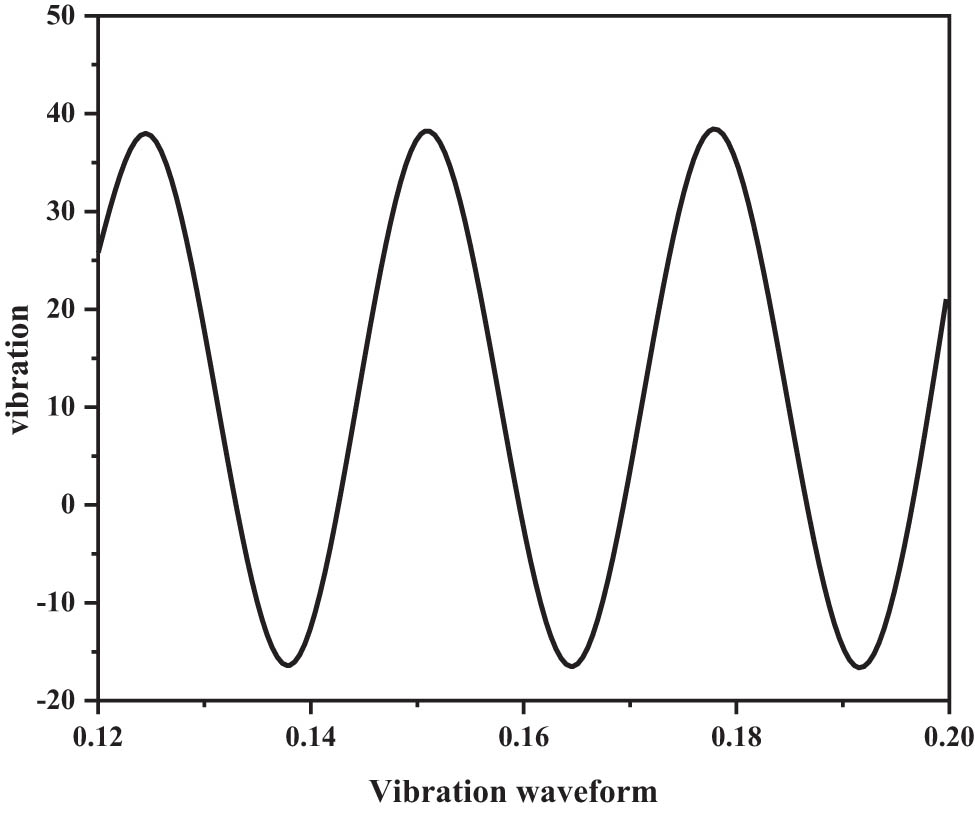
The acceleration data are integrated twice; the displacement of the vibration can be obtained. The proposed method is mainly to detect the vibration of fixed equipment, the curve trajectory drawn by the acceleration data collected by the system. Similar to the reciprocating motion of a sine wave, it can also be seen from the filtered curves in Figures 4 and 5 that the acceleration curve is integrated twice to obtain the vibration displacement [26,27]. The integral operation method mainly uses the trapezoidal method, the acquisition time t is equally divided, and the velocity v is obtained by one integration of acceleration a i , as expressed in formula (12):
Segmented integral diagram between acceleration peaks.
The above speed formula can be further simplified as shown in formula (13):
The speed obtained is integrated by integrating the above formula again, and the vibration displacement s is obtained, as expressed in formula (14):
The above trapezoidal integration method is used for the collected data, in the process of direct displacement calculation, due to the uncertainty of the initial phase, and the integration result is biased. The proposed method uses the piecewise trapezoidal integration method, since the vibration waveform of mechanical equipment is similar to a sine curve; the velocity at the maximum amplitude is 0. The acceleration is maximum or minimum, and the piecewise trapezoidal method is used to carry out the integration, each time only the integration is carried on to the half cycle of the vibration, as shown in Figure 5.
For the filtered acceleration curve shown in Figure 5, the second integral of the absolute value between the acceleration peaks is calculated in turn, such as the quadratic integral between point a and point b, between point b and point c, and so on. The segmented quadratic integral value between the acceleration peaks of all collected data is calculated, to obtain the vibration amplitude of each period in the equipment vibration process. In fact, due to various aspects of noise, there are differences between the results of the quadratic integration of each data segment calculated above, in order to minimize the resulting error as much as possible, finally taking the average of all the sub-integration results of the collected data, as the displacement value of the final vibration [28,29].
4 Results discussion
In order to verify the effectiveness of the proposed method, build a simulation platform for mechanical equipment vibration in a Python simulation environment, using the improved method and the displacement measurement method of the three-axis acceleration sensor, conduct experimental comparisons, and evaluate the accuracy of different methods for detecting the vibration state of mechanical equipment, a comparative experiment is required.
4.1 Signal filtering effects of different methods
Using the proposed method and the displacement measurement method of the three-axis acceleration sensor, respectively, an experiment is conducted, to compare the filtering effects of different methods on vibration data, for the same group of vibration data analysis; the comparison results are shown in Figures 6 and 7.
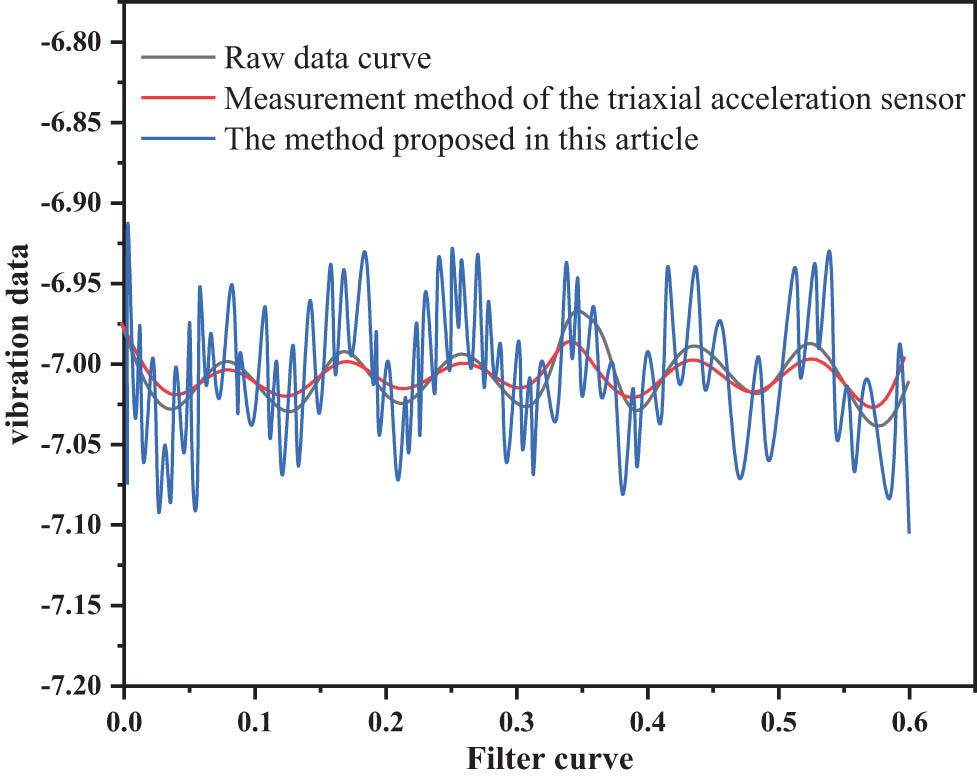
Comparison of 10 Hz and 100 μm data filtering curves.
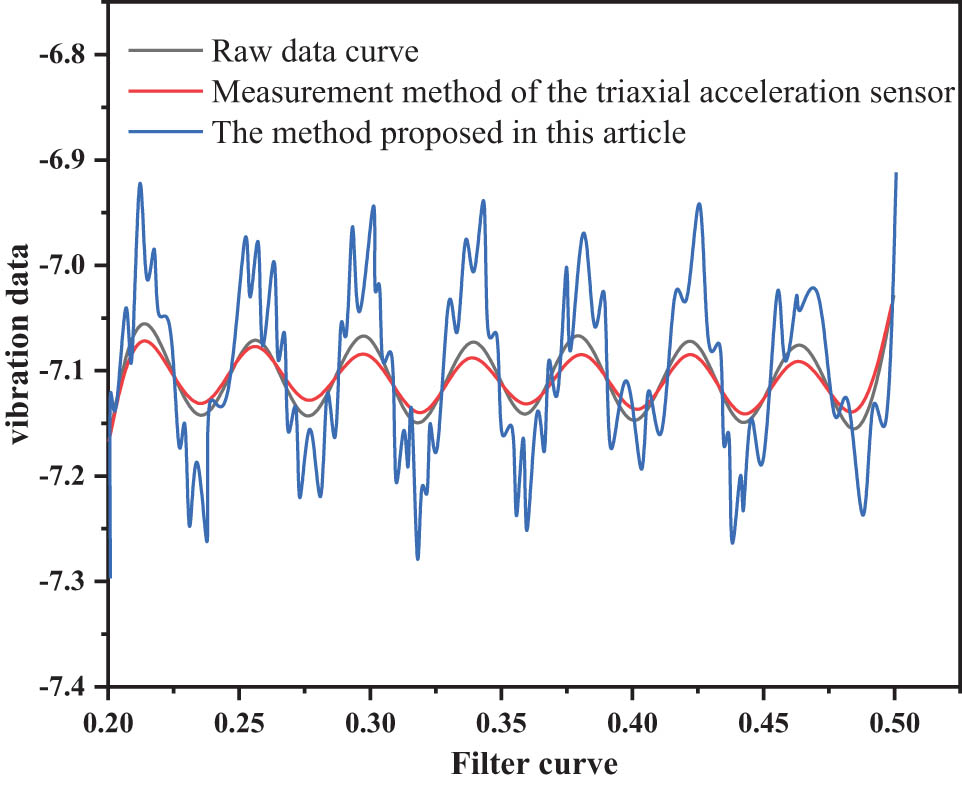
Comparison of 20 Hz and 200 μm data filtering curves.
The vibration signal processing results are compared at different vibration frequencies and different amplitudes, through the proposed method and the displacement measurement method of the three-axis acceleration sensor; comparison of curves after filtering, i.e., the filtering effect of the proposed method is obvious, can remove more noise signals [30].
4.2 Comparison of displacement error rates detected by different methods
The proposed method is used to filter the collected data, and combining with integral optimization calculation, finally, the displacement value of the vibration is obtained, the proposed method with the displacement measurement method of the three-axis acceleration sensor is compared, and the vibration displacement of the equipment is calculated. The final result error comparison is shown in Table 1.
Error analysis and comparison of the results calculated by the proposed method and the displacement measurement method of the three-axis acceleration sensor
| Frequency (Hz) | Amplitude (μm) | Data error of displacement measurement method of three-axis acceleration sensor (%) | Author’s method error after processing (%) |
|---|---|---|---|
| 80 | 400 | 7.3 | 0.5 |
| 80 | 300 | 11.7 | 3.1 |
| 80 | 200 | 11 | 4.0 |
| 80 | 100 | 13 | 2.3 |
| 80 | 100 | 16.4 | 0.6 |
| 40 | 100 | 7.4 | 1.7 |
| 40 | 200 | 7.4 | 1.7 |
The above simulation comparison shows that the vibration data are collected by the main controller, after Kalman filtering and piecewise trapezoidal integration method optimization. When the frequency is 80 Hz, the error of the proposed method is 0.5%, relative to the displacement measurement method of the three-axis acceleration sensor of 7.3%. The error of the data calculation result is greatly reduced, and the greater the amplitude of the vibration, the smaller the error. Simulation proof, the proposed method, has high detection accuracy, which greatly improves the diagnosis and analysis of vibration signals of mechanical equipment.
5 Conclusion
The advantages of the vibration signal are being online, real-time, non-damaging, convenient and accurate in diagnosis, etc. This article introduced it to the fault diagnosis of mechanical equipment, and modern signal processing methods such as improved empirical mode decomposition, wavelet packet transform, SVM, and vibration information sampling and location detection methods of mechanical equipment are given. This article compares the proposed methodology with other literature methods, and the proposed method can effectively remove the influence of noise. This article reduces the error in the integration process and significantly improves the accuracy of the vibration signal detection of mechanical equipment. Comprehensive and accurate extraction, analysis, and diagnosis of vibration signals in the operation of mechanical equipment improve the efficiency and reliability of fault diagnosis and provide a certain reference for related research. The future scope of this research lies in the further experimental investigation for effectively removing the influence of noise while obtaining the least loss and maximized performance accuracy.
-
Funding information: The authors state no funding involved.
-
Author contributions: All authors have accepted responsibility for the entire content of this manuscript and approved its submission.
-
Conflict of interest: The authors state no conflict of interest.
References
[1] Wang Y, Brownjohn J, Capilla J, Dai K, Lu W, Koo KY. Vibration investigation for telecom structures with smartphone camera: case studies. J Civ Struct Health Monit. 2021;11(3):757–66.10.1007/s13349-021-00478-9Suche in Google Scholar
[2] Hou B, Wang D, Yan T, Peng Z. A comparison of machine health indicators based on the impulsiveness of vibration signals. Acoust Aust. 2021;49(2):199–206.10.1007/s40857-021-00224-7Suche in Google Scholar
[3] Yang Z, Mei H, Sun X, Jia P. Compensation control of rotor mass eccentric vibration for bearingless induction motors. J Power Electron. 2021;21(5):792–803.10.1007/s43236-021-00220-0Suche in Google Scholar
[4] Ha H, Park J, Park KS. Advanced numerical analysis for vibration characteristics and ride comfort of ultra-high-speed maglev train. Microsyst Technol. 2020;26(1):183–93.10.1007/s00542-019-04540-xSuche in Google Scholar
[5] Copertaro E, Perotti F, Castellini P, Chiariotti P, Annoni M. Focusing tube operational vibration as a means for monitoring the abrasive waterjet cutting capability. J Manuf Process. 2020;59(1):1–10.10.1016/j.jmapro.2020.09.040Suche in Google Scholar
[6] Wang F, Li X, Zhang F, Liu X, Hu P, Beke-Somfai T, et al. Revealing interfacial lipid hydrolysis catalyzed by phospholipasea1 at molecular-level via sum frequency generation vibrational spectroscopy and fluorescence microscopy. Langmuir. 2019;35(39):12831–8.10.1021/acs.langmuir.9b02284Suche in Google Scholar PubMed
[7] Wang R, Li J, An S, Hao H, Liu W, Li L. Densely connected convolutional networks for vibration based structural damage identification. Eng Struct. 2021;245(2):112871.10.1016/j.engstruct.2021.112871Suche in Google Scholar
[8] Bai C, Guo J. Uncertainty-based vibration/gyro composite planetary terrain mapping. Sensors. 2019;19(12):2681.10.3390/s19122681Suche in Google Scholar PubMed PubMed Central
[9] Jia Z, Sharma A. Review on engine vibration fault analysis based on data mining. J Vibroengineering. 2021;23(6):1433–45.10.21595/jve.2021.21928Suche in Google Scholar
[10] Wu F, Zhu C, Xu J, Bhatt MW, Sharma A. Research on image text recognition based on canny edge detection algorithm and k-means algorithm. Int J Syst Assur Eng Manag. 2021;13:72–80.10.1007/s13198-021-01262-0Suche in Google Scholar
[11] Veselov G, Tselykh A, Sharma A. Introduction to the special issue: Futuristic trends and emergence of technology in biomedical, nonlinear dynamics and control engineering. J Vibroengineering. 2021;23(6):1315–7.10.21595/jve.2021.22226Suche in Google Scholar
[12] Lyu C, Gao J, Jie J. Microvibration measurement based on multichannel projector-camera system. J Lightwave Technol. 2019;37(11):2713–8.10.1109/JLT.2018.2878851Suche in Google Scholar
[13] Shifat TA, Hur JW. Ann assisted multi sensor information fusion for bldc motor fault diagnosis. IEEE Access. 2021;9(99):9429–41.10.1109/ACCESS.2021.3050243Suche in Google Scholar
[14] Bouhalais ML, Nouioua M. The analysis of tool vibration signals by spectral kurtosis and iceemdan modes energy for insert wear monitoring in turning operation. Int J Adv Manuf Technol. 2021;115(9):2989–3001.10.1007/s00170-021-07319-5Suche in Google Scholar
[15] Gómez MJ, Marklund P, Strombergsson D, Castejón C, García-Prada JC. Analysis of vibration signals of drivetrain failures in wind turbines for condition monitoring. Exp Tech. 2021;45(1):1–12.10.1007/s40799-020-00387-4Suche in Google Scholar
[16] Mousmoulis G, Yiakopoulos C, Aggidis G, Antoniadis I, Anagnostopoulos I. Application of spectral kurtosis on vibration signals for the detection of cavitation in centrifugal pumps. Appl Acoust. 2021;182(5):108289.10.1016/j.apacoust.2021.108289Suche in Google Scholar
[17] Xia Y, Pang J, Yang L, Zhao Q, Yang X. Study on vibration response and orbits of misaligned rigid rotors connected by hexangular flexible coupling. Appl Acoust. 2019;155(DEC):286–96.10.1016/j.apacoust.2019.05.022Suche in Google Scholar
[18] Zheng Y, Jia Y, Li H, Wu Z, Dong X. Enhanced piezo-electro-chemical coupling of batio 3/g-c 3 n 4 nanocomposite for vibration-catalysis. J Mater Sci. 2020;55(30):14787–97.10.1007/s10853-020-05001-xSuche in Google Scholar
[19] Ning D, Du H, Sun S, Zheng M, Li W, Zhang N, et al. An electromagnetic variable stiffness device for semiactive seat suspension vibration control. IEEE Trans Ind Electron. 2020;67(8):6773–84.10.1109/TIE.2019.2936994Suche in Google Scholar
[20] Copertaro E, Perotti F, Annoni M. Operational vibration of a waterjet focuser as means for monitoring its wear progression. Int J Adv Manuf Technol. 2021;116(5):1937–49.10.1007/s00170-021-07534-0Suche in Google Scholar
[21] Liu C, Liu C, Liu C, Huang X, Miao J, Xu W. Fire damage identification in rc beams based on support vector machines considering vibration test. KSCE J Civ Eng. 2019;23(10):4407–16.10.1007/s12205-019-2353-7Suche in Google Scholar
[22] Tiwari B, Gupta SH, Balyan V. Design and comparative analysis of compact flexible UWB antenna using different substrate materials for WBAN applications. Appl Phys A. 2020;126(11):1–11.10.1007/s00339-020-04011-5Suche in Google Scholar
[23] Balyan V, Daniels R. Resource allocation for NOMA based networks using relays: cell centre and cell edge users. Int J Smart Sens Intell Syst. 2020;13(1):1–18.10.21307/ijssis-2020-031Suche in Google Scholar
[24] Grzenda M, Bustillo A. Semi-supervised roughness prediction with partly unlabeled vibration data streams. J Intell Manuf. 2019;30(2):933–45.10.1007/s10845-018-1413-zSuche in Google Scholar
[25] Liao GP, Gao W, Yang GJ, Guo MF. Hydroelectric generating unit fault diagnosis using 1-d convolutional neural network and gated recurrent unit in small hydro. IEEE Sens J. 2019;19(20):9352–63.10.1109/JSEN.2019.2926095Suche in Google Scholar
[26] Redissi A, Miller S. Communication through acoustic vibration of pipe strings. J Acoust Soc Am. 2019;146(2):1416–26.10.1121/1.5124002Suche in Google Scholar PubMed
[27] Michalak A, Wodecki J, Wylomanska A, Zimroz R. Application of cointegration to vibration signal for local damage detection in gearboxes. Appl Acoust. 2019;144(JAN):4–10.10.1016/j.apacoust.2017.08.024Suche in Google Scholar
[28] Marscher WD, Onari MM. Video motion amplification vs. operating deflection shapes for machinery diagnosis. Int J Comadem. 2019;22(1):55–8.Suche in Google Scholar
[29] Zhao C, Huang Z, Guo D. Spiking neural network dynamic system modeling for computation of quantum annealing and its convergence analysis. Quant Inf Process. 2021;20(2):1–16.10.1007/s11128-021-03003-5Suche in Google Scholar
[30] Wei C, Luo J, Guo Z, Yin Z, Yuan J. Active vibration control of underactuated free-floating spacecraft via a performance enhanced way. Acta Astronaut. 2019;157(APR):477–88.10.1016/j.actaastro.2019.01.013Suche in Google Scholar
© 2022 Chiyue Qin et al., published by De Gruyter
This work is licensed under the Creative Commons Attribution 4.0 International License.
Artikel in diesem Heft
- Research Articles
- Fractal approach to the fluidity of a cement mortar
- Novel results on conformable Bessel functions
- The role of relaxation and retardation phenomenon of Oldroyd-B fluid flow through Stehfest’s and Tzou’s algorithms
- Damage identification of wind turbine blades based on dynamic characteristics
- Improving nonlinear behavior and tensile and compressive strengths of sustainable lightweight concrete using waste glass powder, nanosilica, and recycled polypropylene fiber
- Two-point nonlocal nonlinear fractional boundary value problem with Caputo derivative: Analysis and numerical solution
- Construction of optical solitons of Radhakrishnan–Kundu–Lakshmanan equation in birefringent fibers
- Dynamics and simulations of discretized Caputo-conformable fractional-order Lotka–Volterra models
- Research on facial expression recognition based on an improved fusion algorithm
- N-dimensional quintic B-spline functions for solving n-dimensional partial differential equations
- Solution of two-dimensional fractional diffusion equation by a novel hybrid D(TQ) method
- Investigation of three-dimensional hybrid nanofluid flow affected by nonuniform MHD over exponential stretching/shrinking plate
- Solution for a rotational pendulum system by the Rach–Adomian–Meyers decomposition method
- Study on the technical parameters model of the functional components of cone crushers
- Using Krasnoselskii's theorem to investigate the Cauchy and neutral fractional q-integro-differential equation via numerical technique
- Smear character recognition method of side-end power meter based on PCA image enhancement
- Significance of adding titanium dioxide nanoparticles to an existing distilled water conveying aluminum oxide and zinc oxide nanoparticles: Scrutinization of chemical reactive ternary-hybrid nanofluid due to bioconvection on a convectively heated surface
- An analytical approach for Shehu transform on fractional coupled 1D, 2D and 3D Burgers’ equations
- Exploration of the dynamics of hyperbolic tangent fluid through a tapered asymmetric porous channel
- Bond behavior of recycled coarse aggregate concrete with rebar after freeze–thaw cycles: Finite element nonlinear analysis
- Edge detection using nonlinear structure tensor
- Synchronizing a synchronverter to an unbalanced power grid using sequence component decomposition
- Distinguishability criteria of conformable hybrid linear systems
- A new computational investigation to the new exact solutions of (3 + 1)-dimensional WKdV equations via two novel procedures arising in shallow water magnetohydrodynamics
- A passive verses active exposure of mathematical smoking model: A role for optimal and dynamical control
- A new analytical method to simulate the mutual impact of space-time memory indices embedded in (1 + 2)-physical models
- Exploration of peristaltic pumping of Casson fluid flow through a porous peripheral layer in a channel
- Investigation of optimized ELM using Invasive Weed-optimization and Cuckoo-Search optimization
- Analytical analysis for non-homogeneous two-layer functionally graded material
- Investigation of critical load of structures using modified energy method in nonlinear-geometry solid mechanics problems
- Thermal and multi-boiling analysis of a rectangular porous fin: A spectral approach
- The path planning of collision avoidance for an unmanned ship navigating in waterways based on an artificial neural network
- Shear bond and compressive strength of clay stabilised with lime/cement jet grouting and deep mixing: A case of Norvik, Nynäshamn
- Communication
- Results for the heat transfer of a fin with exponential-law temperature-dependent thermal conductivity and power-law temperature-dependent heat transfer coefficients
- Special Issue: Recent trends and emergence of technology in nonlinear engineering and its applications - Part I
- Research on fault detection and identification methods of nonlinear dynamic process based on ICA
- Multi-objective optimization design of steel structure building energy consumption simulation based on genetic algorithm
- Study on modal parameter identification of engineering structures based on nonlinear characteristics
- On-line monitoring of steel ball stamping by mechatronics cold heading equipment based on PVDF polymer sensing material
- Vibration signal acquisition and computer simulation detection of mechanical equipment failure
- Development of a CPU-GPU heterogeneous platform based on a nonlinear parallel algorithm
- A GA-BP neural network for nonlinear time-series forecasting and its application in cigarette sales forecast
- Analysis of radiation effects of semiconductor devices based on numerical simulation Fermi–Dirac
- Design of motion-assisted training control system based on nonlinear mechanics
- Nonlinear discrete system model of tobacco supply chain information
- Performance degradation detection method of aeroengine fuel metering device
- Research on contour feature extraction method of multiple sports images based on nonlinear mechanics
- Design and implementation of Internet-of-Things software monitoring and early warning system based on nonlinear technology
- Application of nonlinear adaptive technology in GPS positioning trajectory of ship navigation
- Real-time control of laboratory information system based on nonlinear programming
- Software engineering defect detection and classification system based on artificial intelligence
- Vibration signal collection and analysis of mechanical equipment failure based on computer simulation detection
- Fractal analysis of retinal vasculature in relation with retinal diseases – an machine learning approach
- Application of programmable logic control in the nonlinear machine automation control using numerical control technology
- Application of nonlinear recursion equation in network security risk detection
- Study on mechanical maintenance method of ballasted track of high-speed railway based on nonlinear discrete element theory
- Optimal control and nonlinear numerical simulation analysis of tunnel rock deformation parameters
- Nonlinear reliability of urban rail transit network connectivity based on computer aided design and topology
- Optimization of target acquisition and sorting for object-finding multi-manipulator based on open MV vision
- Nonlinear numerical simulation of dynamic response of pile site and pile foundation under earthquake
- Research on stability of hydraulic system based on nonlinear PID control
- Design and simulation of vehicle vibration test based on virtual reality technology
- Nonlinear parameter optimization method for high-resolution monitoring of marine environment
- Mobile app for COVID-19 patient education – Development process using the analysis, design, development, implementation, and evaluation models
- Internet of Things-based smart vehicles design of bio-inspired algorithms using artificial intelligence charging system
- Construction vibration risk assessment of engineering projects based on nonlinear feature algorithm
- Application of third-order nonlinear optical materials in complex crystalline chemical reactions of borates
- Evaluation of LoRa nodes for long-range communication
- Secret information security system in computer network based on Bayesian classification and nonlinear algorithm
- Experimental and simulation research on the difference in motion technology levels based on nonlinear characteristics
- Research on computer 3D image encryption processing based on the nonlinear algorithm
- Outage probability for a multiuser NOMA-based network using energy harvesting relays