
A novel statistical modeling of air pollution and the COVID-19 pandemic mortality data by Poisson, geometric, and negative binomial regression models with fixed and random effects
-
Neslihan İyit

 and
Ferhat Sevim
and
Ferhat Sevim

Abstract
The coronavirus disease 2019 (COVID-19) pandemic was defined by the World Health Organization (WHO) as a global epidemic on March 11, 2020, as the infectious disease that threatens public health fatally. In this study, the main aim is to model the impact of various air pollution causes on mortality data due to the COVID-19 pandemic by Generalized Linear Mixed Model (GLMM) approach to make global statistical inferences about 174 WHO member countries as subjects in the six WHO regions. “Total number of deaths by these countries due to the COVID-19 pandemic” until July 27, 2022, is taken as the response variable. The explanatory variables are taken as the WHO regions, the number of deaths from air pollution causes per 100.000 population as “household air pollution from solid fuels,” “ambient particulate matter pollution,” and “ambient ozone pollution.” In this study, Poisson, geometric, and negative binomial (NB) regression models with “country” taken as fixed and random effects, as special cases of GLMM, are fitted to model the response variable in the aspect of the above-mentioned explanatory variables. In the Poisson, geometric, and NB regression models, Iteratively Reweighted Least Squares parameter estimation method with the Fisher-Scoring iterative algorithm under the log-link function as canonical link function is used. In the GLMM approach, Laplace approximation is also used in the prediction of random effects. In this study, six different Poisson, geometric, and NB regression models with fixed and random effects are established for 174 countries all over the world to make global statistical inferences for investigating the relationships between “total number of deaths” by these countries due to the COVID-19 pandemic and “air pollution causes.” As a result of this study, “NB mixed-effects regression model” as the most appropriate GLMM is used to make global statistical inferences about the impact of the various air pollution causes on the mortality data due to the COVID-19 pandemic.
1 Introduction
The coronavirus disease 2019 (COVID-19) pandemic caused by “Severe Acute Respiratory Syndrome Coronavirus 2 (SARS-CoV-2)” infection has led to severe acute respiratory diseases all over the world and has fatally affected the whole world since December 2019 [1,2,3,4,5,6,7,8]. Physical, biological, and especially chemical factors cause air pollution, harm the health of humans and other living things, and change the natural structure of the indoor and outdoor environment.
“Household air pollution (HAP) from solid fuels,” “ambient particulate matter pollution,” and “ambient ozone pollution” discussed in this study are the three leading air pollution causes. HAP is an important measure of indoor air pollution with respect to the smoke from traditional household solid fuel combustion during cooking and heating methods [9,10,11]. Particulate matter pollution in the environment, as the annual weighted average mass concentration of aerodynamic particles with a diameter of less than 2.5 µm in one m3 of air, is one of the most important criteria of the outdoor air population [12,13,14,15,16]. Ambient ozone pollution as another important measure of the outdoor air population is seen as the highest seasonal average of eight-hour daily maximum ozone concentrations [17,18,19]. It is known that air pollution causes especially chronic obstructive pulmonary and lung cancer. It is clearly known that the harmful effects of air pollution increase especially respiratory and cardiovascular diseases and also mortality rates in the world. In light of this information, in this study, the global effect of air pollution on the COVID-19 pandemic is examined by applying generalized linear model (GLM) and generalized linear mixed model (GLMM) approaches in terms of indoor and outdoor air pollution indicators.
Ibarra-Espinosa et al. [20] investigated associations between air pollution and daily COVID-19 cases and deaths in Sao Paulo, Brazil, by negative binomial (NB) and quasi-Poisson regression methods. They indicated that even small increases in air pollution cause significant increases in cases and deaths of COVID-19. Odhiambo et al. [21] estimated the relationships between the number of patients infected with COVID-19 in Kenya, the number of people in contact with these patients, and the number of daily air travels to Kenya by the compound Poisson regression model. Oztig and Askin [22] investigated the number of individuals infected with COVID-19 in 144 countries and the mobility of individuals within these countries using the NB regression approach. Similarly, Janković et al. [23] modeled the number of COVID-19 cases and mobility trends in European countries by the same approach. Fitriani and Jaya [24] demonstrated a positive relationship between the population density and the incidence of COVID-19 cases in East Java Province by geographically weighted NB regression model. Coker et al. [25] found a positive relationship between the number of deaths due to the COVID-19 pandemic and the fine particulate matter (PM2.5) in Northern Italy by the NB regression approach. Lee et al. [26] modeled the relationships between the total number of confirmed cases of the COVID-19 pandemic and also the mergers and acquisitions of 145 countries by quasi-Poisson and NB regression approaches. Wu et al. [27] reveal that the increase in the fine particulate matter positively affects the COVID-19 death rates in the United States by NB mixed-effects regression approach. Szyszkowicz [28], Chuang et al. [29], Sun et al. [30], Bülbül et al. [31], Cheng et al. [32], Stieb et al. [33], Chisini et al. [34], Das et al. [35], Karmakar et al. [36], Khalilpourazari et al. [37], Muhsen et al. [38], Tanis and Karakaya [39], Tirkolaee et al. [40], Faruk et al. [41], Gürbüz and Gökçe [42], Özköse and Yavuz [43], Seçilmiş et al. [44], Shamsi et al. [45], and Joshi et al. [46] used various regression models including NB regression, hurdle regression, Poisson regression, zero-inflated regression with fixed and random effects as special cases of GLM and GLMM approaches for modeling the COVID-19 pandemic data.
In light of the studies given in the literature, in this study, an advanced statistical modeling approach based on the GLM and GLMM approaches with Poisson, geometric, and NB distributions is proposed to investigate the relationships between the “mortality data due to the COVID-19 pandemic” and various “causes of air pollution” of 174 World Health Organization (WHO) member countries in the six WHO regions.
2 Materials
In this study, the “total number of deaths by 174 WHO member countries due to the COVID-19 pandemic” until July 27, 2022, is taken as the response variable. “WHO regions,” “the numbers of deaths from air pollution causes per 100.000 population” as “HAP from solid fuels,” “ambient particulate matter pollution,” and “ambient ozone pollution” are taken as the explanatory variables as given in Table 1.
All variables taken into the study to model the relationships between the COVID-19 pandemic and air pollution causes
| Variables | Description |
|---|---|
| Total deaths due to the COVID-19 pandemic | The total number of deaths in each country taken in the study due to the COVID-19 pandemic until July 27, 2022 [47] |
| Deaths from HAP from solid fuels | The number of due deaths from air pollution causes per 100.000 population as “HAP from solid fuels” belonging to 2019 [48] |
| Deaths from ambient particulate matter pollution | The number of due deaths from air pollution causes per 100.000 population as “Ambient particulate matter pollution” belonging to 2019 [48] |
| Deaths from ambient ozone pollution | The numbers of due deaths from air pollution causes per 100.000 population as “Ambient ozone pollution” belonging to 2019 [48] |
About 174 countries are taken in the study as subjects: 47 countries from the African Region (AFR), 21 countries from the Eastern Mediterranean Region (EMR), 49 countries from the European Region (EUR), 33 countries from the Americas Region (AMR), 9 countries from the South-East Asian Region (SEAR), and 15 countries from the Western Pacific Region (WPR) according to the WHO given in Table 2.
WHO regions and countries taken in the study according to the total number of deaths due to the COVID-19 pandemic in decreasing order [49]
| WHO regions | Countries |
|---|---|
| AFR | South Africa, Ethiopia, Algeria, Kenya, Zimbabwe, Namibia, Zambia, Uganda, Nigeria, Botswana, Malawi, Mozambique, Senegal, Cameroon, Angola, Rwanda, Ghana, Eswatini, Madagascar, Democratic Republic of Congo, Mauritius, Mauritania, Tanzania, Cote d'Ivoire, Mali, Lesotho, Guinea, Cape Verde, Burkina Faso, Congo, Gambia, Niger, Gabon, Liberia, Togo, Chad, Equatorial Guinea, Guinea-Bissau, Seychelles, Benin, Comoros, South Sudan, Sierra Leone, Central African Republic, Eritrea, Sao Tome and Principe, Burundi |
| EMR | Iran, Pakistan, Tunisia, Iraq, Egypt, Morocco, Jordan, Lebanon, Saudi Arabia, Afghanistan, Libya, Sudan, Oman, Syria, Kuwait, United Arab Emirates, Yemen, Bahrain, Somalia, Qatar, Djibouti |
| EUR | Russia, United Kingdom, Italy, France, Germany, Poland, Ukraine, Spain, Turkey, Romania, Hungary, Czechia, Bulgaria, Belgium, Greece, Portugal, Netherlands, Austria, Slovakia, Sweden, Kazakhstan, Georgia, Croatia, Serbia, Bosnia and Herzegovina, Switzerland, Moldova, Israel, Azerbaijan, North Macedonia, Lithuania, Armenia, Ireland, Belarus, Slovenia, Denmark, Latvia, Finland, Norway, Albania, Kyrgyzstan, Montenegro, Estonia, Uzbekistan, Luxembourg, Cyprus, Malta, Iceland, Tajikistan |
| AMR | United States, Brazil, Mexico, Peru, Colombia, Argentina, Chile, Canada, Ecuador, Bolivia, Paraguay, Guatemala, Honduras, Costa Rica, Cuba, Panama, Uruguay, Venezuela, Dominican Republic, El Salvador, Trinidad and Tobago, Jamaica, Suriname, Guyana, Haiti, Bahamas, Belize, Barbados, Saint Lucia, Nicaragua, Grenada, Antigua and Barbuda, Saint Vincent and the Grenadines |
| SEAR | India, Indonesia, Thailand, Bangladesh, Myanmar, Sri Lanka, Nepal, Maldives, Timor |
| WPR | Philippines, Vietnam, Malaysia, Japan, South Korea, Australia, China, Cambodia, Mongolia, Singapore, New Zealand, Fiji, Laos, Papua New Guinea, Brunei |
Descriptive statistics of the response variable as “total deaths due to the COVID-19 pandemic,” and explanatory variables as “deaths from different causes of air pollution” according to the 174 countries are given in Table 3. Countries having the highest total number of deaths due to the COVID-19 pandemic are the United States, Brazil, India, Russia, Mexico, Peru, United Kingdom, Italy, Indonesia, and France with 1.029.359, 677.804, 526.212, 374.523, 327.412, 214.120, 203.987, 171.439, 156.940, and 151.851 deaths until July 27, 2022, respectively.
Descriptive statistics of the variables taken in the study to model the impact of air pollution causes on the COVID-19 pandemic
| Variables | Min. | Median | Mean ± Sd. | Max. |
|---|---|---|---|---|
| Total deaths due to the COVID-19 pandemic | 38 | 4,792 | 36686.28 ± 111497.94 | 1,029,359 |
| Deaths related to the air pollution from household solid fuels | 0 | 9 | 47.22 ± 64.758 | 273 |
| Deaths related to the air pollution from ambient particulate matter | 3 | 36 | 44.89 ± 31.522 | 177 |
| Deaths related to the air pollution from ambient ozone | 0 | 2 | 2.26 ± 3.262 | 35 |
Descriptive statistics of the response variable as “total deaths due to the COVID-19 pandemic” according to the six WHO regions are given in Table 4. WHO regions with the highest number of total deaths due to the COVID-19 pandemic until July 27, 2022 are AMR, EUR, SEAR, EMR, WPR, and AFR with 2.788.838, 2.066.096, 792.100, 339.131, 224.251, and 172.997, respectively.
Descriptive statistics of the total deaths due to the COVID-19 pandemic according to the six WHO regions
| WHO Regions | Number of Countries | Min. | Median | Mean ± Sd. | Max. |
|---|---|---|---|---|---|
| AFR | 47 | 38 | 810 | 3680.79 ± 14765.171 | 101,955 |
| EMR | 21 | 189 | 6,431 | 16149.10 ± 30406.18 | 141,795 |
| EUR | 49 | 125 | 15,851 | 42165.22 ± 69735.78 | 374,523 |
| AMR | 33 | 115 | 7,403 | 84510.24 ± 215144.47 | 77,506 |
| SEAR | 9 | 133 | 19,434 | 88011.11 ± 171189.42 | 526,212 |
| WPR | 15 | 225 | 3,056 | 14950.07 ± 19491.88 | 60,694 |
Histogram of the “total deaths due to the COVID-19 pandemic” according to the 174 WHO member countries used in this study is given in Figure 1. As seen in Figure 1, 33 countries have less than 500 total deaths due to the COVID-19 pandemic; 13, 22, 20, 23, 41, 4, and 13 countries have “total deaths due to the COVID-19 pandemic” between 500 and 1,000; 1,000 and 2,500; 2,500 and 5,000; 5,000 and 10,000; 10,000 and 50000; 50,000 and 100,000; 100,000 and 250000, respectively. Five countries have greater than 250,000 total deaths due to the COVID-19 pandemic until July 27, 2022.

Histogram of the total deaths due to the COVID-19 pandemic according to the 174 WHO member countries taken in the study.
Histogram of the total deaths due to the COVID-19 pandemic for six WHO regions is given in Figure 2. Countries for six WHO regions with the highest number of total deaths due to the COVID-19 pandemic until July 27, 2022, are South Africa from AFR, the United States from AMR, Iran from EMR, Russia from EUR, India from SEAR, and the Philippines from WPR with 101.955, 1.029.359, 141.795, 374.523, 526.212, and 60.694, respectively. Countries for six WHO regions with the lowest number of total deaths due to the COVID-19 pandemic until July 27, 2022, are Burundi from AFR, Saint Vincent and the Grenadines from AMR, Djibouti from EMR, Tajikistan from EUR, Timor from SEAR, and Brunei from WPR with 38, 115, 189, 125, 133, and 225, respectively.

Histogram of the total deaths due to the COVID-19 pandemic according to the six WHO regions taken in the study.
Figures 1 and 2 illustrate that the structures of the response variable for both 174 countries all over the world and the six WHO regions are highly right-skewed distributed.
Histograms of the number of deaths from causes of air pollution per 100.000 population are given in Figure 3. The largest to the smallest numbers of deaths from causes of air pollution per 100.000 population are 8,217, 7,811, and 440 deaths from “household solid fuels,” “ambient particulate matter,” and “ambient ozone,” respectively.

Histograms of the number of deaths from causes of air pollution per 100.000 population.
As can be seen from Figure 3, the top 10 countries with the highest number of deaths related to air pollution from “household solid fuels” are Somalia from EMR, Central African Republic from AFR, Papua New Guinea from WPR, Niger from AFR, Guinea-Bissau from AFR, Chad from AFR, Burundi from AFR, Mozambique from AFR, Guinea from AFR, and Madagascar from AFR with 273, 252, 230, 200, 199, 196, 187, 186, 185, and 182 deaths, respectively.
The top 10 countries with the highest number of deaths related to air pollution from “ambient particulate matter” are Uzbekistan from EUR, Egypt from EMR, Qatar from EMR, Oman from EMR, Iraq from EMR, Tajikistan from EUR, Saudi Arabia from EMR, Azerbaijan from EUR, Mongolia from WPR, and Bahrain from EMR with 177, 158, 129, 128, 122, 116, 110, 109, 107, and 104 deaths, respectively.
Finally, the top 10 countries with the highest number of deaths related to air pollution from “ambient ozone” are Nepal from SEAR, India from SEAR, Pakistan from EMR, Bangladesh from SEAR, Central African Republic from AFR, Afghanistan from EMR, Bahrain from EMR, China from WPR, Kyrgyzstan from EUR, and Myanmar from SEAR with equally 35, 19, 14, 9, 7, 6, 6, 6, 6, and 6 deaths, respectively.
3 Methods
Traditionally used linear regression models are based on the assumption that the response variable is “normally” distributed. However, in a statistical study, the data of interest for the response variable may not always have a normal distribution. In this case, the GLM approach bringing the advantage that the response variable comes from various distributions due to the exponential family can be used to analyze data [50,51,52,53].
The GLM constitutes of “random component,” “systematic component,” and the “link function.” The random component part of the GLM can be given in the form of the exponential family as follows [50,54,55,56,57,58]:
where
The systematic component also called as “linear predictor” in the form of the linear function can be given as follows [51,54,58,59]:
The link function between the systematic component and the random component of the GLM can be given as follows [52,58,60,61]:
For an easier understanding of the GLM structure, these components of the GLM are presented visually [58]. Known functions as
Structures of the exponential family, canonical link functions, and the inverse link functions due to the Poisson, geometric, and NB distributions in the GLM approach
| Distribution |
|
|
|
|
|
|---|---|---|---|---|---|
| Poisson |
|
|
|
|
|
| Geometric |
|
|
|
|
|
| NB |
|
|
|
|
|
The GLM is built on the “fixed-effects” terms that have constant effects on the response variable across the subjects taken into the study. On the other hand, it may be necessary to include “random-effects” terms in the model that have varying effects on the response variable across the subjects. In this situation, GLMM is an extended version of the GLM to include “random-effects” terms as well as a linear function of the “fixed-effects” terms included in the model called as the “linear predictor” [55,64,65,66]. For an easier understanding of the GLMM structure, fixed-effects, random-effects, and also the linear predictor part consisting of these effects are presented visually in ref. [58].
The “link function” and the “inverse link function” of the GLMM consisting of the “fixed-effects” and the “random-effects” can be given as follows [55,58,64,67]:
In this study, the GLMM approach with Poisson, geometric, and NB distributions are used when the response variable consists of “count data” as non-negative integer values where the canonical link function is in the form of the “log-link function” given as follows [55,64,67]:
“Iteratively reweighted least squares (IRLS)” method with “Fisher-Scoring (FS) iterative algorithm” is used for the GLM approach with the Poisson, geometric, and NB distributions. “Maximum likelihood (ML)” method with “Laplace approximation” is also used for the GLMM approach with these distributions [51,55,64,67,68]. The performances of the Poisson, geometric, and NB regression models using the IRLS method with the FS iterative algorithm, and also Poisson, geometric, and NB mixed regression models using the ML method with the Laplace approximation under the log-link function are compared using “information criteria” (IC) as goodness-of-fit test statistics given in the studies by Iyit et al. [58,69,70,71,72,73].
4 Results and discussion
In this study, mortality data due to the COVID-19 pandemic are modeled in the aspect of various causes of air pollution by GLM and GLMM approaches with Poisson, geometric, and NB distributions under the log-link function to make statistical inferences about the 174 WHO member countries in the six WHO regions.
For this aim, the “total number of deaths by the 174 WHO member countries due to the COVID-19 pandemic” until July 27, 2022, is taken as the response variable. WHO regions, the numbers of deaths from causes of air pollution per 100.000 population as “household solid fuels,” “ambient particulate matter,” and “ambient ozone” are taken as the explanatory variables [43,44].
In this study, Poisson, geometric, and NB regression models with “country” taken as fixed and random effects, as special cases of GLM and GLMM, are fitted to model the response variable in the aspect of the above explanatory variables to make global statistical inferences for investigating the relationships between the total number of deaths by these countries due to the COVID-19 pandemic and the mentioned causes of air pollution.
In this study, “RStudio” program [74] is used for the statistical analysis and modeling of the data. In terms of visualization, the “ggplot” function from the “ggplot2” package is used for drawing all the graphs. The “glm” function from the “stats” package, and the “glmer” function from the “lme4” package are used in the parameter estimation of the GLM and GLMM models, respectively.
Poisson, geometric, and NB regression models in the GLM approach, and also Poisson, geometric, and NB mixed regression models in the GLMM approach under the log-link function are fitted to the 174 countries’ COVID-19 pandemic and causes of air pollution data given in Table 1.
First, the results of the Poisson regression model using the IRLS method with the FS iterative algorithm under the log-link function are given in Table 6.
The results of the Poisson regression model for the WHO regions and causes of air pollution under the log-link function
| Explanatory variables |
|
|
|
|
95% Confidence interval for
|
|
|---|---|---|---|---|---|---|
| Lower bound | Upper bound | |||||
| Intercept | 10.5194 | 0.00282 | <2 × 10‒16*** | 37026.231 | 36822.4634 | 37231.1262 |
| EMR | 0.3543 | 0.00328 | <2 × 10‒16*** | 1.4252 | 1.4161 | 1.4344 |
| EUR | 0.4066 | 0.00280 | <2 × 10‒16*** | 1.5017 | 1.4935 | 1.5100 |
| Region of the Americas (AMR) | 1.3569 | 0.00270 | <2 × 10‒16*** | 3.8843 | 3.8638 | 3.9049 |
| SEAR | 1.2801 | 0.00307 | <2 × 10‒16*** | 3.5968 | 3.5753 | 3.6185 |
| WPR | -0.2073 | 0.00340 | <2 × 10‒16*** | 1.2303 | 1.2222 | 1.2386 |
| AFR (Reference Category) | ||||||
| Deaths related to the air pollution from household solid fuels | 0.0245 | 0.00003 | <2 × 10‒16*** | 1.0249 | 1.0248 | 1.0249 |
| Deaths related to the air pollution from ambient particulate matter | 0.0150 | 0.00002 | <2 × 10‒16*** | 1.0151 | 1.0151 | 1.0152 |
| Deaths related to the air pollution from ambient ozone | 0.1438 | 0.00012 | <2 × 10‒16*** | 1.1547 | 1.1544 | 1.1549 |
By using the IRLS parameter estimates of the Poisson regression model due to the WHO regions and causes of air pollution given in Table 6, the expected value of the COVID-19 mortality is given as follows:
or
The results of the geometric regression model using the IRLS method with the FS iterative algorithm under the log-link function are given in Table 7.
The results of the geometric regression model for the WHO regions and causes of air pollution under the log-link function
| Explanatory variables |
|
|
|
|
95% Confidence interval for
|
|
|---|---|---|---|---|---|---|
| Lower bound | Upper bound | |||||
| Intercept | 10.2251 | 0.48934 | <2 × 10⁻¹⁶*** | 27587.8343 | 10572.7079 | 71986.16 |
| EMR | 1.2668 | 0.53007 | 0.01798* | 3.5495 | 1.2559 | 10.03179 |
| EUR | 0.9263 | 0.46846 | 0.04968* | 2.5250 | 1.0081 | 6.32453 |
| Region of the Americas (AMR) | 1.3313 | 0.48583 | 0.00681** | 3.7861 | 1.4610 | 9.811602 |
| SEAR | 1.8637 | 0.73336 | 0.01196* | 6.4477 | 1.5317 | 27.14267 |
| WPR | 0.8422 | 0.54412 | 0.12360 | 2.3214 | 0.7991 | 6.743879 |
| AFR (Reference Category) | ||||||
| Deaths related to the air pollution from household solid fuels | 0.0195 | 0.00288 | 2.28 × 10⁻¹⁰*** | 1.0197 | 1.0139 | 1.025464 |
| Deaths related to the air pollution from ambient particulate matter | 0.0211 | 0.00528 | 9.63 × 10⁻⁵*** | 1.0213 | 1.0108 | 1.031959 |
| Deaths related to the air pollution from ambient ozone | 0.1740 | 0.05114 | 0.00084*** | 1.1900 | 1.0765 | 1.31547 |
By using the IRLS parameter estimates of the geometric regression model due to the WHO regions and causes of air pollution given in Table 7, the expected value of the COVID-19 mortality is given as follows:
or
The results of the NB regression model using the IRLS method with the FS iterative algorithm under the log-link function are given in Table 8.
The results of the NB regression model for the WHO regions and causes of air pollution under the log-link function
| Explanatory variables |
|
|
|
|
95% Confidence interval for
|
|
|---|---|---|---|---|---|---|
| Lower bound | Upper bound | |||||
| Intercept | 10.2252 | 0.41401 | <2 × 10⁻¹⁶*** | 27590.6351 | 12255.9361 | 62112.1992 |
| EMR | 1.2670 | 0.41010 | 0.00200** | 3.5503 | 1.5892 | 7.9315 |
| EUR | 0.9263 | 0.35801 | 0.00968** | 2.5250 | 1.2518 | 5.0935 |
| Region of the Americas (AMR) | 1.3312 | 0.41033 | 0.00118** | 3.7857 | 1.6938 | 8.4612 |
| SEAR | 1.8638 | 0.60591 | 0.00210** | 6.4479 | 1.9663 | 21.1436 |
| WPR | 0.8422 | 0.41904 | 0.04444* | 2.3216 | 1.0211 | 5.2781 |
| AFR (Reference Category) | ||||||
| Deaths related to the air pollution from household solid fuels | 0.0195 | 0.00232 | <2 × 10⁻¹⁶*** | 1.0197 | 1.0151 | 1.0243 |
| Deaths related to the air pollution from ambient particulate matter | 0.0211 | 0.00477 | 9.68 × 10⁻⁶*** | 1.0213 | 1.0118 | 1.0309 |
| Deaths related to the air pollution from ambient ozone | 0.1740 | 0.05361 | 0.00117** | 1.1900 | 1.0713 | 1.3219 |
| Theta | 0.5193 | 0.0461 | — | 1.0197 | 1.0151 | 1.0243 |
By using the IRLS parameter estimates of the NB regression model due to the WHO regions and causes of air pollution given in Table 8, the expected value of the COVID-19 mortality is given as follows:
or
The results of the Poisson mixed regression model under the log-link function with “country” taken as the random effect using the ML with the Laplace approximation method are given in Table 9.
The results of the Poisson mixed regression model for the WHO regions and causes of air pollution under the log-link function
| Explanatory variables |
|
|
|
|
95% Confidence interval for
|
|
|---|---|---|---|---|---|---|
| Lower bound | Upper bound | |||||
| Intercept | 8.1613 | 0.49932 | <2 × 10⁻¹⁶*** | 3502.8974 | 1316.4210 | 9320.9473 |
| EMR | 1.5000 | 0.54082 | 0.00555** | 4.4816 | 1.5527 | 12.9357 |
| EUR | 1.5958 | 0.47801 | 0.00084*** | 4.9325 | 1.9328 | 12.5879 |
| Region of the Americas (AMR) | 1.1174 | 0.49575 | 0.02420*** | 3.0568 | 1.1569 | 8.0773 |
| SEAR | 1.4987 | 0.74641 | 0.04466* | 4.3003 | 0.9918 | 18.6448 |
| WPR | 1.0163 | 0.55517 | 0.06715 | 2.7631 | 0.9307 | 8.2027 |
| AFR (Reference Category) | ||||||
| Deaths related to the air pollution from household solid fuels | 0.0117 | 0.00294 | 6.76 × 10⁻⁵*** | 1.0118 | 1.0060 | 1.0176 |
| Deaths related to the air pollution from ambient particulate matter | 0.0123 | 0.00539 | 0.02213*** | 1.0124 | 1.0018 | 1.0232 |
| Deaths related to the air pollution from ambient ozone | 0.1411 | 0.05218 | 0.00685*** | 1.1515 | 1.0396 | 1.2755 |
By using the ML parameter estimates of the Poisson mixed regression model due to the WHO regions and causes of air pollution given in Table 9, the expected value of the COVID-19 mortality is given as follows:
or
The results of the geometric mixed regression model under the log-link function with “country” taken as the random effect using the ML with the Laplace approximation method are given in Table 10.
The results of the geometric mixed regression model for the WHO regions and causes of air pollution under the log-link function
| Explanatory variables |
|
|
|
|
95% Confidence interval for
|
|
|---|---|---|---|---|---|---|
| Lower bound | Upper bound | |||||
| Intercept | 8.6367 | 0.43030 | <2 × 10⁻¹⁶*** | 5634.4754 | 2424.2490 | 13095.7314 |
| EMR | 1.4856 | 0.46609 | 0.00144** | 4.4174 | 1.7718 | 11.0132 |
| EUR | 1.4989 | 0.41194 | 0.00027*** | 4.4769 | 1.9968 | 10.0374 |
| Region of the Americas (AMR) | 1.2692 | 0.42722 | 0.00297*** | 3.5581 | 1.5401 | 8.2201 |
| SEAR | 1.8713 | 0.64490 | 0.00371** | 6.4970 | 1.8355 | 22.9965 |
| WPR | 1.0122 | 0.47846 | 0.03438* | 2.7517 | 1.0773 | 7.0287 |
| AFR (Reference Category) | ||||||
| Deaths related to the air pollution from household solid fuels | 0.0135 | 0.00254 | 1 × 10⁻⁷*** | 1.0136 | 1.0086 | 1.0186 |
| Deaths related to the air pollution from ambient particulate matter | 0.0150 | 0.00464 | 0.00124** | 1.0151 | 1.0059 | 1.0244 |
| Deaths related to the air pollution from ambient ozone | 0.1558 | 0.04497 | 0.00053*** | 1.1685 | 1.0700 | 1.2762 |
By using the ML parameter estimates of the geometric mixed regression model due to the WHO regions and causes of air pollution given in Table 10, the expected value of COVID-19 mortality is given as follows:
or
The results of the NB mixed regression model under the log-link function with “country” taken as the random effect using the ML with the Laplace approximation method are given in Table 11.
The results of the NB mixed regression model for the WHO regions and causes of air pollution under the log-link function
| Explanatory variables |
|
|
|
|
95% Confidence interval for
|
|
|---|---|---|---|---|---|---|
| Lower bound | Upper bound | |||||
| Intercept | 8.9878 | 0.52340 | <2 × 10⁻¹⁶*** | 8005.1883 | 2869.7675 | 22330.3946 |
| EMR | 1.4785 | 0.51282 | 0.00394** | 4.3864 | 1.6054 | 11.9848 |
| EUR | 1.4853 | 0.46450 | 0.00139* | 4.4163 | 1.7769 | 10.9763 |
| Region of the Americas (AMR) | 1.2771 | 0.49630 | 0.01007* | 3.5863 | 1.3558 | 9.4865 |
| SEAR | 1.8683 | 0.74817 | 0.01252* | 6.4770 | 1.4946 | 28.0689 |
| WPR | 1.0825 | 0.52966 | 0.04097* | 2.7373 | 0.9693 | 7.7299 |
| AFR (Reference Category) | ||||||
| Deaths related to the air pollution from household solid fuels | 0.0137 | 0.00297 | 4.24 × 10⁻⁶*** | 1.0137 | 1.0079 | 1.0197 |
| Deaths related to the air pollution from ambient particulate matter | 0.0152 | 0.00542 | 0.00512** | 1.0153 | 1.0046 | 1.0261 |
| Deaths related to the air pollution from ambient ozone | 0.1570 | 0.06525 | 0.01608* | 1.1700 | 1.0296 | 1.3297 |
| Theta | 0.881 | 0.2561 | — | — | 0.3790 | 1.3830 |
By using the ML parameter estimates of the NB mixed regression model due to the WHO regions and causes of air pollution given in Table 11, the expected value of the COVID-19 mortality is given as follows:
or
As a main statistical result from this study, the performances of the Poisson, geometric, and NB regression models in the GLM approach, and also Poisson, geometric, and NB mixed regression models in the GLMM approach under the log-link function fitted to the 174 countries’ COVID-19 pandemic and causes of air pollution data are compared using the log-likelihood and IC values given in Table 12.
Goodness-of-fit test statistics for the GLM and GLMM approaches under the log-link function due to the COVID-19 pandemic and causes of air pollution data
| Goodness-of-fit test statistics | Poisson regression model | Geometric regression model | NB regression model | Poisson mixed regression model | Geometric mixed regression model | NB mixed regression model |
|---|---|---|---|---|---|---|
| Log-likelihood | −6,657,003 | −1850.006 | −1817.05 | −1810.277 | −1816.68 | −1807.756* |
| AIC | 13,314,024 | 3716.012 | 3652.1 | 3635.554 | 3651.36 | 3633.512* |
| AICC | 13314025.098 | 3716.885 | 3653.198 | 3636.427 | 3652.458 | 3634.610* |
| BIC | 13314026.165 | 3717.936 | 3654.265 | 3637.478 | 3653.525 | 3635.677* |
| CAIC | 13314035.165 | 3725.936 | 3663.265 | 3645.478 | 3662.525 | 3644.677* |
As can be seen from Table 12, the best fitted model is determined as the “NB mixed regression model” from the GLMM approach due to the COVID-19 pandemic and causes of air pollution data according to the maximum value of the log-likelihood, and also the smallest values of the AIC, AICC, BIC, and CAIC information criteria with ‒1807.756, 3633.512, 3634.610, 3635.677, and 3644.677, respectively.
Moreover, variance and standard deviation of the random effect due to the NB mixed regression model for the COVID-19 pandemic and causes of air pollution data are determined as the smallest as given in Table 13.
Variance and standard deviation of the random effect belonging to the GLMM approach for the COVID-19 pandemic and causes of air pollution data
| GLMMs | Variance | Standard deviation |
|---|---|---|
| Poisson mixed regression model | 3.08 | 1.755 |
| Geometric mixed regression model | 1.288 | 1.135 |
| NB mixed regression model | 1.278* | 1.131* |
*Indicates the minimum variance and standard deviation of the random effect belonging to the GLMMs.
The residual graphs for the NB mixed regression model as the best fitted model due to the COVID-19 pandemic and causes of air pollution data are given in Figure 4.
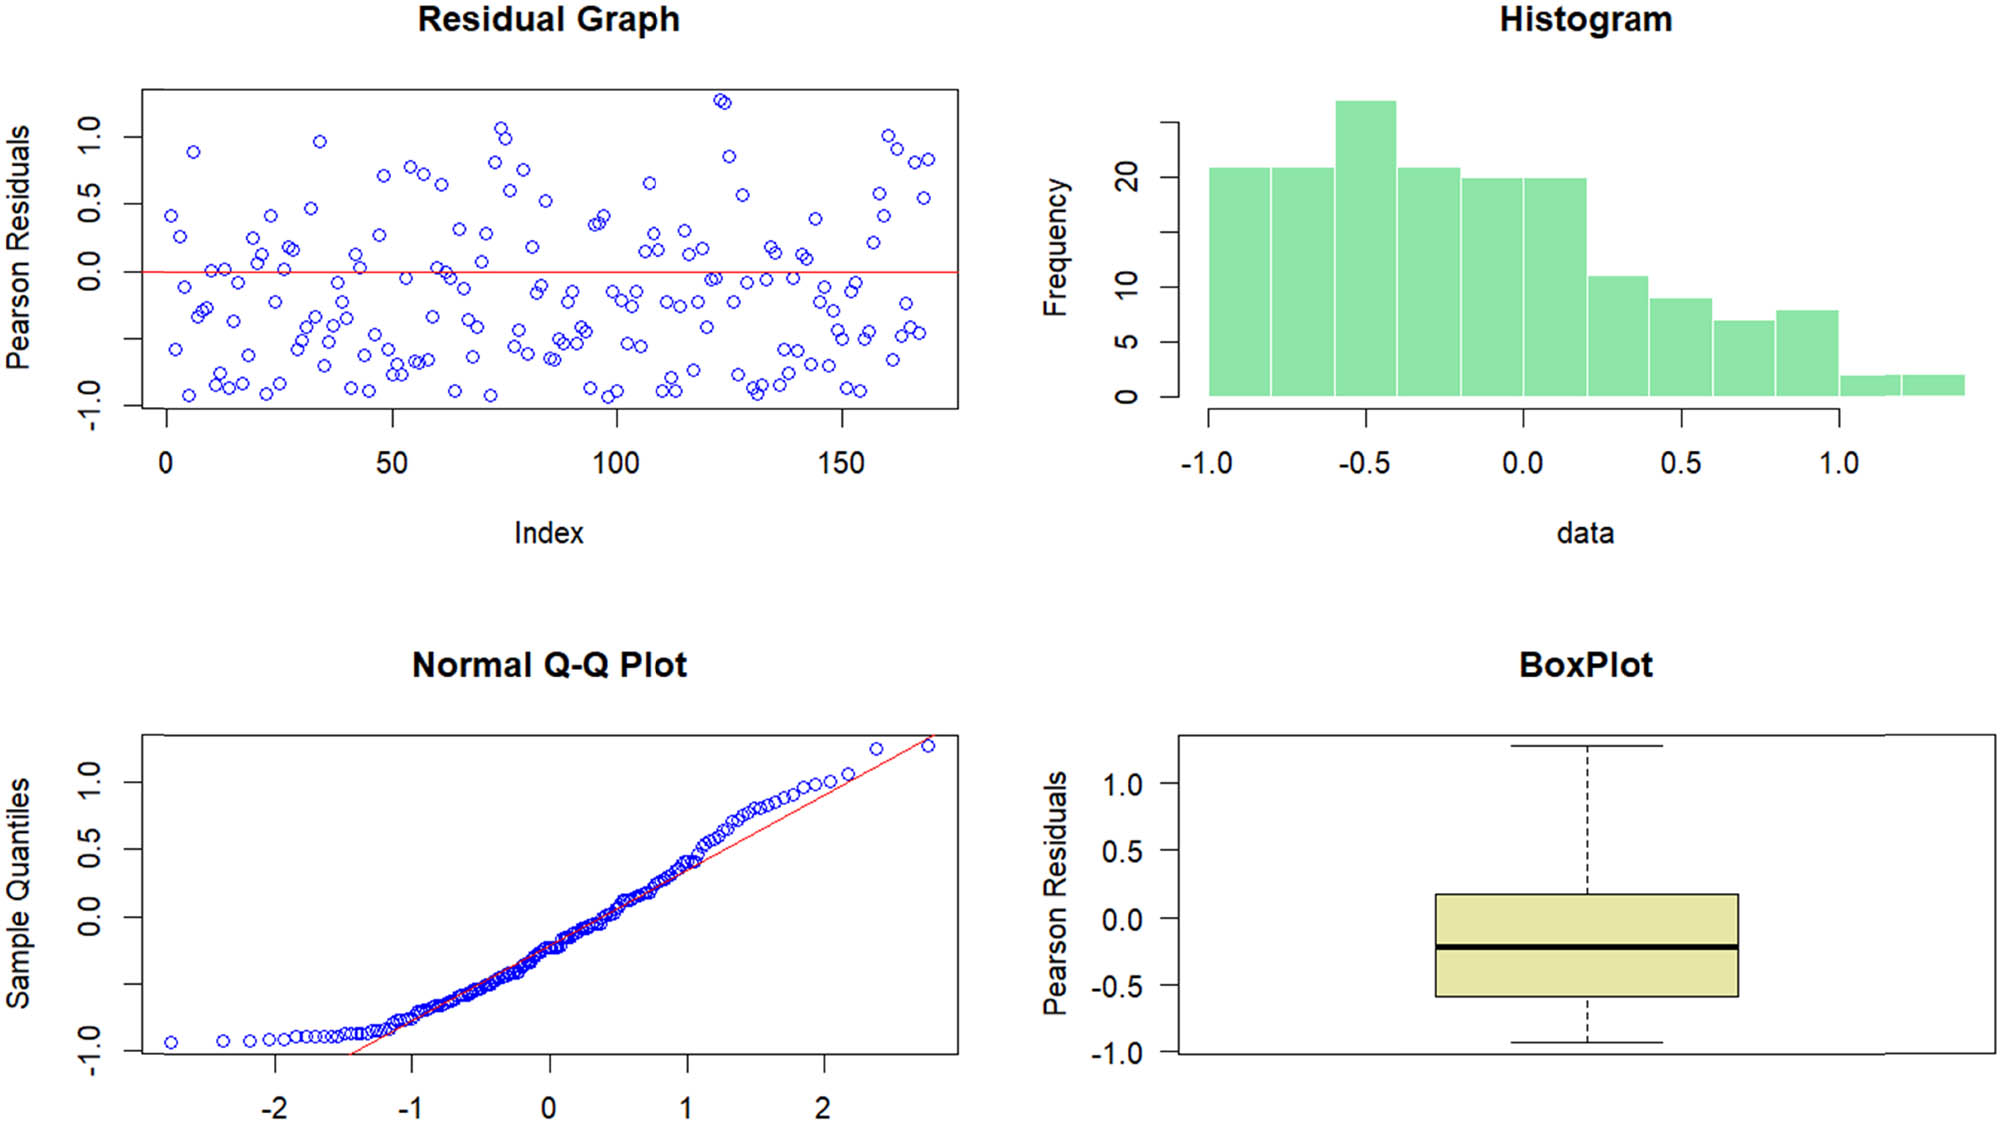
The residual graphs for the NB mixed regression model due to the COVID-19 pandemic and causes of air pollution data.
In Figure 4, the scatter graph of the Pearson residuals of the NB mixed regression model for the COVID-19 pandemic data of 174 countries illustrates that the Pearson residuals are randomly dispersed around zero and fall within the range (−1, 2). From the histogram of the Pearson residuals of the model, it can be seen that the Pearson residuals are homogeneously located in the range (−1, 0.1) and gradually decrease in the range (0.1, 2). From the Q–Q plot of the Pearson residuals of the model, it can be seen that the Pearson residuals are closer fitted to the q–q line in the red color. From the box-plot of the Pearson residuals of the model, the Pearson residuals are especially located in the range (−0.6, 0.1), and it can be easily seen that there is no outlier.
5 Conclusion
In this study, global “COVID-19 pandemic” data in terms of the “causes of air pollution” are modeled comparatively using six different models in the GLM and GLMM approaches taking “country” as the random effect. When the studies in the literature are investigated, it has been observed that there are very few studies examining the impact of the “causes of air pollution” on the “COVID-19 pandemic” as a whole as in this study. This study provides superiority to the other studies in the literature in the aspect of evaluating the effects of various causes of air pollution on the total deaths due to the COVID-19 pandemic by six powerful statistical modeling techniques in the GLM and GLMM approaches for the 174 countries taken from the six WHO regions. So in addition to the studies in the literature, these extensive features reveal the originality of this study.
In statistical terms, the performances of the Poisson, geometric, and NB regression models in the GLM approach, and also Poisson, geometric, and NB mixed regression models in the GLMM approach for the COVID-19 pandemic and causes of air pollution data have not been broadly compared as given in this study.
As a conclusion of this study, the following global statistical inferences are obtained by using the NB mixed regression model as a powerful statistical modeling method in the GLMM approach when “country” is taken as the random effect.
The main conclusions from this study, by using the NB mixed regression model under the “log-link” function given in equation (18) with “country” taken as the random effect and the ML with the Laplace approximation method, can be given as follows:
The total number of deaths by the 174 WHO member countries due to the COVID-19 pandemic increases
On the other hand, the total number of deaths of the 174 WHO member countries due to the COVID-19 pandemic according to the six WHO regions as EMR, EUR, Region of the Americas (AMR), SEAR, and WPR are expected to be
Based on this study, the future outlook for further investigation will be to explore the effects of panel data structures for different indicators of air pollution on worldwide pandemics and natural disasters as a highlighted topic on the world agenda.
Acknowledgments
Neslihan İyit is the main author of this study. This study is a part of Ferhat Sevim’s M.Sc. Thesis entitled “A Statistical Application of GLMMs on COVID-19 Data” supervised by Assoc.Prof.Dr. Neslihan Iyit submitted by Statistics Department, Graduate School of Natural Sciences, Selcuk University, Konya, Türkiye. The earlier version of this study is presented at the 9th International Conference on Computational and Experimental Science and Engineering (ICCESEN 2022) by the same authors. The authors are grateful to the editors and anonymous referees for their valuable comments and contributions to the improvement of this article.
-
Funding information: The authors state no funding involved.
-
Author contributions: All authors have read and approved the manuscript. N.I.; supervising, conceptualizing, writing, reviewing, and editing the original draft preparation, F.S.; literature review, data collection, statistical data analysis, and visualizing the original draft.
-
Conflict of interest: The authors state no conflict of interest.
-
Ethical approval: The conducted research is not related to either human or animal use.
-
Data availability statement: All the data used in this manuscript are available in Our World in Data Repository. [https://ourworldindata.org/coronavirus, https://ourworldindata.org/grapher/death-rates-from-air-pollution]
References
[1] Choudhry N, Zhao X, Xu D, Zanin M, Chen W, Yang Z, et al. Chinese therapeutic strategy for fighting COVID-19 and potential small-molecule inhibitors against severe acute respiratory syndrome Coronavirus 2 (SARS-CoV-2). J Med Chem. 2020;63(22):13205–27. 10.1021/acs.jmedchem.0c00626.Search in Google Scholar PubMed
[2] Plebani M, Padoan A, Fedeli U, Schievano E, Vecchiato E, Lippi G, et al. SARS-CoV-2 serosurvey in health care workers of the Veneto Region. Clin Chem Lab Med. 2020;58(12):2107–11. 10.1515/cclm-2020-1236.Search in Google Scholar PubMed
[3] Zhang Y, Wu G, Chen S, Ju X, Yimaer W, Zhang W, et al. A review on COVID-19 transmission, epidemiological features, prevention and vaccination. Med Rev. 2022;2(1):23–49. 10.1515/mr-2021-0023.Search in Google Scholar PubMed PubMed Central
[4] Laredo M, Curis E, Masson-Fron E, Voicu S, Mégarbane B. Does COVID-19 alter the oxyhemoglobin dissociation curve?–An observational cohort study using a mixed-effect modelling. Clin Chem Lab Med. 2021;59(11):e416–9. 10.1515/cclm-2021-0387.Search in Google Scholar PubMed
[5] Pal A, Ahirwar AK, Sakarde A, Asia P, Gopal N, Alam S, et al. COVID-19 and cardiovascular disease: A review of current knowledge. Horm Mol Biol Clin Investigation. 2021;42(1):99–104. 10.1515/hmbci-2020-0052.Search in Google Scholar PubMed
[6] Li B, Hu W, Bao C. COVID-19 cases with delayed absorption of lung lesion. Open Med. 2021;16(1):692–5. 10.1515/med-2021-0265.Search in Google Scholar PubMed PubMed Central
[7] Figueiro-Filho EA, Yudin M, Farine D. COVID-19 during pregnancy: An overview of maternal characteristics, clinical symptoms, maternal and neonatal outcomes of 10,996 cases described in 15 countries. J Perinat Med. 2020;48(9):900–11. 10.1515/jpm-2020-0364.Search in Google Scholar PubMed
[8] Yönet N, Gürbüz B, Gökçe A. An alternative numerical approach for an improved ecological model of interconnected lakes with a fixed pollutant. Comput Appl Math. 2023;42(1):56. 10.1007/s40314-023-02191-3.Search in Google Scholar
[9] Zhang Y, Zhao B, Jiang Y, Xing J, Sahu SK, Zheng H, et al. Non-negligible contributions to human health from increased household air pollution exposure during the COVID-19 lockdown in China. Environ Int. 2022;158:106918. 10.1016/j.envint.2021.Search in Google Scholar
[10] Rani R, Arokiasamy P, Sikarwar A. Household air pollution during COVID‐19 pandemic: A concern in India. J Public Aff. 2021;21(4):e2729. 10.1002/pa.2729.Search in Google Scholar PubMed PubMed Central
[11] Karan A, Ali K, Teelucksingh S, Sakhamuri S. The impact of air pollution on the incidence and mortality of COVID-19. Glob Health Res Policy. 2020;5:39. 10.1186/s41256-020-00167-y.Search in Google Scholar PubMed PubMed Central
[12] Hime NJ, Marks GB, Cowie CT. A comparison of the health effects of ambient particulate matter air pollution from five emission sources. Int J Environ Res Public Health. 2018;15(6):1206. 10.3390/ijerph15061206.Search in Google Scholar PubMed PubMed Central
[13] Bowe B, Xie Y, Gibson AK, Cai M, Van Donkelaar A, Martin RV, et al. Ambient fine particulate matter air pollution and the risk of hospitalization among COVID-19 positive individuals: Cohort study. Environ Int. 2021;154:106564. 10.1016/j.envint.2021.106564.Search in Google Scholar PubMed PubMed Central
[14] Hassan MA, Mehmood T, Lodhi E, Bilal M, Dar AA, Liu J. Lockdown amid COVID-19 ascendancy over ambient particulate atter Pollution Anomaly. Int J Environ Res Public Health. 2022;19(20):13540. 10.3390/ijerph192013540.Search in Google Scholar PubMed PubMed Central
[15] Kayalar Ö, Arı A, Babuccu G, Konyalılar N, Doğan Ö, Can F, et al. Existence of SARS-CoV-2 RNA on ambient particulate matter samples: A nationwide study in Turkey. Sci Total Environ. 2021;789:147976. 10.1016/j.scitotenv.2021.147976.Search in Google Scholar PubMed PubMed Central
[16] Yonar A, Yonar H. Modeling air pollution by integrating ANFIS and metaheuristic algorithms. Model Earth Syst Environ. 2023;9:1621–31. 10.1007/s40808-022-01573-6.Search in Google Scholar PubMed PubMed Central
[17] Saitanis CJ, Agathokleous E. Exogenous application of chemicals for protecting plants against ambient ozone pollution: What should come next? Curr Opin Environ Sci Health. 2021;19:100215. 10.1016/j.coesh.2020.10.003.Search in Google Scholar PubMed PubMed Central
[18] Pandey A, Brauer M, Cropper ML, Balakrishnan K, Mathur P, Dey S, et al. Health and economic impact of air pollution in the states of India: The Global Burden of Disease Study 2019. Lancet Planet Health. 2021;5(1):e25–38. 10.1016/S2542-5196(20)30298-9.Search in Google Scholar PubMed PubMed Central
[19] Ma Y, Shen J, Zhang Y, Wang H, Li H, Cheng Y, et al. Short-term effect of ambient ozone pollution on respiratory diseases in western China. Environ Geochem Health. 2022;44:4129–40. 10.1007/s10653-021-01174-9.Search in Google Scholar PubMed
[20] Ibarra-Espinosa S, Freitas ED, Ropkins K, Dominici F, Rehbein A. Negative-Binomial and quasi-poisson regressions between COVID-19, mobility and environment in São Paulo, Brazil. Environ Res. 2022;204:112369. 10.1016/j.envres.2021.112369.Search in Google Scholar PubMed PubMed Central
[21] Odhiambo JO, Ngare P, Weke P, Otieno RO. Modelling of COVID-19 transmission in Kenya using compound Poisson regression model. J Adv Math Comput Sci. 2020;35(2):101–11. 10.9734/JAMCS/2020/v35i230252.Search in Google Scholar
[22] Oztig LI, Askin OE. Human mobility and coronavirus disease 2019 (COVID-19): a negative binomial regression analysis. Public health. 2020;185:364–7. 10.1016/j.puhe.2020.07.002.Search in Google Scholar PubMed PubMed Central
[23] Janković R, Amelio A, Ćosović M. Analyzing the effects of мobility and season on COVID-19 cases using negative binomial regression: A European Case Study. 2021 20th International Symposium INFOTEH-JAHORINA (INFOTEH); 2021 Mar 17-19. East Sarajevo, Bosnia and Herzegovina, IEEE; 2021. p. 1–6. 10.1109/INFOTEH51037.2021.9400665.Search in Google Scholar
[24] Fitriani R, Jaya IGNM. Spatial modeling of confirmed COVID-19 pandemic in East Java province by geographically weighted negative binomial regression. Commun Math Biol Neurosci. 2020;58. 10.28919/cmbn/4874.Search in Google Scholar
[25] Coker ES, Cavalli L, Fabrizi E, Guastella G, Lippo E, Parisi ML, et al. The effects of air pollution on COVID-19 related mortality in northern Italy. Environ Resour Econ. 2020;76(4):611–34. 10.1007/s10640-020-00486-1.Search in Google Scholar PubMed PubMed Central
[26] Lee HS, Degtereva EA, Zobov AM. The impact of the COVID-19 pandemic on cross-border mergers and acquisitions’ determinants: New empirical evidence from quasi-poisson and negative binomial regression models. Economies. 2021;9(4):184. 10.3390/economies9040184.Search in Google Scholar
[27] Wu X, Nethery RC, Sabath MB, Braun D, Dominici F. Air pollution and COVID-19 mortality in the United States: Strengths and limitations of an ecological regression analysis. Sci Adv. 2020;6(45):eabd4049. 10.1126/sciadv.abd4049.Search in Google Scholar PubMed PubMed Central
[28] Szyszkowicz M. Use of generalized linear mixed models to examine the association between air pollution and health outcomes. Int J Occup Med Environ Health. 2006;19(4):224–7. 10.2478/v10001-006-0032-7.Search in Google Scholar PubMed
[29] Chuang YH, Mazumdar S, Park T, Tang G, Arena VC, Nicolich MJ. Generalized linear mixed models in time series studies of air pollution. Atmos Pollut Res. 2011;2(4):428–35. 10.5094/APR.2011.049.Search in Google Scholar
[30] Sun W, Palazoglu A, Singh A, Zhang H, Wang Q, Zhao Z, et al. Prediction of surface ozone episodes using clusters based generalized linear mixed effects models in Houston–Galveston–Brazoria area, Texas. Atmos Pollut Res. 2015;6(2):245–53. 10.5094/APR.2015.029.Search in Google Scholar
[31] Bülbül GB, Purutçuoğlu V, Purutçuoğlu E. Novel model selection criteria on sparse biological networks. Int J Environ Sci Technol. 2019;16(9):5359–64. 10.1007/s13762-019-02206-9.Search in Google Scholar
[32] Cheng KJG, Sun Y, Monnat SM. COVID‐19 death rates are higher in rural counties with larger shares of Blacks and Hispanics. J Rural Health. 2020;36(4):602–8. 10.1111/jrh.12511.Search in Google Scholar PubMed PubMed Central
[33] Stieb DM, Evans GJ, To TM, Brook JR, Burnett RT. An ecological analysis of long-term exposure to PM2.5 and incidence of COVID-19 in Canadian health regions. Environ Res. 2020;191:110052. 10.1016/j.envres.2020.110052.Search in Google Scholar PubMed PubMed Central
[34] Chisini LA, Costa FS, Demarco GT, Silveira ER, Demarco FF. COVID‐19 pandemic impact on paediatric dentistry treatments in the Brazilian Public Health System. Int J Paediatr Dent. 2021;31(1):31–4. 10.1111/ipd.12741.Search in Google Scholar PubMed PubMed Central
[35] Das A, Ghosh S, Das K, Basu T, Dutta I, Das M. Living environment matters: Unravelling the spatial clustering of COVID-19 hotspots in Kolkata megacity, India. Sustain Cities Soc. 2021;65:102577. 10.1016/j.scs.2020.102577.Search in Google Scholar PubMed PubMed Central
[36] Karmakar M, Lantz PM, Tipirneni R. Association of social and demographic factors with COVID-19 incidence and death rates in the US. JAMA Netw Open. 2021;4(1):e2036462. 10.1001/jamanetworkopen.2020.36462.Search in Google Scholar PubMed PubMed Central
[37] Khalilpourazari S, Doulabi HH, Çiftçioğlu AÖ, Weber GW. Gradient-based grey wolf optimizer with Gaussian walk: Application in modelling and prediction of the COVID-19 pandemic. Expert Syst Appl. 2021;177:114920. 10.1016/j.eswa.2021.114920.Search in Google Scholar PubMed PubMed Central
[38] Muhsen K, Na'aminh W, Lapidot Y, Goren S, Amir Y, Perlman S, et al. A nationwide analysis of population group differences in the COVID-19 epidemic in Israel, February 2020–February 2021. Lancet Reg Health-Europe. 2021;7:100130. 10.1016/j.lanepe.2021.100130.Search in Google Scholar PubMed PubMed Central
[39] Tanis C, Karakaya K. Investigating the impacts of air quality and weather indicators on the spread of SARS-COV-2 in Istanbul, Turkey. Therm Sci. 2021;25(4A):2755–65. 10.2298/TSCI201126071T.Search in Google Scholar
[40] Tirkolaee EB, Abbasian P, Weber GW. Sustainable fuzzy multi-trip location-routing problem for medical waste management during the COVID-19 outbreak. Sci Total Environ. 2021;756:143607. 10.1016/j.scitotenv.2020.143607.Search in Google Scholar PubMed PubMed Central
[41] Faruk MO, Rana MS, Jannat SN, Khanam Lisa F, Rahman MS. Impact of environmental factors on COVID-19 transmission: spatial variations in the world. Int J Environ Health Res. 2023;33(9):864–80. 10.1080/09603123.2022.2063264.Search in Google Scholar PubMed
[42] Gürbüz B, Gökçe A. An algorithm and stability approach for the acute inflammatory response dynamic model. In: Purutçuoğlu V, Weber GW, Farnoudkia H, editors. Operations research: New paradigms and emerging applications. Boca Raton: CRC Press; 2023. p. 192–217.10.1201/9781003324508-14Search in Google Scholar
[43] Özköse F, Yavuz M. Investigation of interactions between COVID-19 and diabetes with hereditary traits using real data: A case study in Turkey. Comput Biol Med. 2022;141:105044. 10.1016/j.compbiomed.2021.105044.Search in Google Scholar PubMed
[44] Seçilmiş D, Ağraz M, Purutçuoğlu V. Two new nonparametric models for biological networks. In: Hemachandran K, Tayal S, George PM, Singla P, Kose U, editors. Bayesian reasoning and gaussian processes for machine learning applications. Boca Raton: Chapman and Hall/CRC; 2022. p. 77–100.10.1201/9781003164265-7Search in Google Scholar
[45] Shamsi S, Zaman K, Usman B, Nassani AA, Haffar M, Abro MMQ. Do environmental pollutants carrier to COVID-19 pandemic? A cross-sectional analysis. Environ Sci Pollut Res. 2022;29:17530–43. 10.1007/s11356-021-17004-5.Search in Google Scholar PubMed PubMed Central
[46] Joshi H, Jha BK, Yavuz M. Modelling and analysis of fractional-order vaccination model for control of COVID-19 outbreak using real data. Math Biosci Eng. 2023;20(1):213–40. 10.3934/mbe.2023010.Search in Google Scholar PubMed
[47] Our World in Data. Coronavirus Pandemic (COVID-19). https://ourworldindata.org/coronavirus [Accessed 10 Sept 2022].Search in Google Scholar
[48] Our World in Data. Death rate from air pollution, World, 1990 to 2019. https://ourworldindata.org/grapher/death-rates-from-air-pollution [Accessed 10 Sept 2022].Search in Google Scholar
[49] Our World in Data. WHO regions. https://ourworldindata.org/grapher/who-regions [Accessed 10 Sept 2022].Search in Google Scholar
[50] Fox J. Applied regression analysis and generalized linear models. 3rd edn. USA: Sage Publications; 2015.Search in Google Scholar
[51] Agresti A. Foundations of linear and generalized linear models. 1st edn. New Jersey: John Wiley & Sons; 2015.Search in Google Scholar
[52] Myers RH, Montgomery DC, Vining GG, Robinson TJ. Generalized linear models: with applications in engineering and the sciences. 2nd edn. New Jersey: John Wiley & Sons; 2012.Search in Google Scholar
[53] İyit N, Yonar H, Genç A. Generalized linear models for European Union countries energy data. Acta Phys Pol A. 2016;130(1):397–400. 10.12693/APhysPolA.130.397.Search in Google Scholar
[54] Olsson U. Generalized linear models: An applied approach. 1st edn. Lund: Studentlitteratur; 2002.Search in Google Scholar
[55] Stroup WW. Generalized linear mixed models: Modern concepts, methods and applications. 1st edn. Florida: CRC Press; 2012.Search in Google Scholar
[56] Yonar H, İyit N. Modeling the causality relationships between Gdp/Gni and electricity consumption according to income levels of countries by generalized estimating equations. Selçuk Univ Soc Sci Inst J. 2018;39:191–200.Search in Google Scholar
[57] Yonar H, İyit N. Some generalized estimating equations models based on causality tests for investigation of the economic growth of the country groups. Found Comput Decis Sci. 2021;46(3):297–315. 10.2478/fcds-2021-0019.Search in Google Scholar
[58] İyit N, Sevim F, Kahraman ÜM. Investigating the impact of CO2 emissions on the COVID-19 pandemic by generalized linear mixed model approach with inverse Gaussian and gamma distributions. Open Chem. 2023;21(1):20220301. 10.1515/chem-2022-0301.Search in Google Scholar
[59] İyit N, Yonar H, Yonar A. An application of generalized linear model approach on econometric studies. In: İyit N, Doğan HH, Akgül H, editors. Research & reviews in science and mathematics-II. Ankara: Gece Publishing; 2021. p. 201–16.Search in Google Scholar
[60] McCullagh P, Nelder JA. Generalized linear models. 2nd edn. London: Chapman and Hall; 1989.10.1007/978-1-4899-3242-6Search in Google Scholar
[61] Iyit N, Al Mashhadani AA. An application of generalized linear model (GLM) to child mortality data in Iraq based on socio-economic indicators. In: Ugur A, Tozak K, Yatbaz A, editors. Turkish World Socio Economic Strategies. Beau Bassin: LAP Lambert Academic Publishing; 2017. p. 195–203.Search in Google Scholar
[62] Wood SN. Generalized additive models: an introduction with R. 1st edn. New York: Chapman ans Hall/CRC; 2006.Search in Google Scholar
[63] Öznur Ö, İyit N. Modelling the US diabetes mortality rates via generalized linear model with the Tweedie distribution. Int J Sci Res. 2018;7(2):1326–34.Search in Google Scholar
[64] Jiang J. Linear and generalized linear mixed models and their applications. 1st edn. New York: Springer; 2007.10.1007/978-1-0716-1282-8_1Search in Google Scholar
[65] McCulloch CE, Searle SR. Generalized, linear, and mixed models. 1st edn. New York: John Wiley & Sons; 2004.Search in Google Scholar
[66] Iyit N, Genc A. Constitution of random intercept and slope model (RISM) as a special case of linear mixed models (LMMs) for repeated measurements data. Appl Math Comput. 2011;218(3):827–31. 10.1016/j.amc.2011.03.061.Search in Google Scholar
[67] Faraway JJ. Extending the linear model with R: Generalized linear, mixed effects and nonparametric regression models. 2nd edn. New York: Chapman and Hall/CRC; 2016.10.1201/9781315382722Search in Google Scholar
[68] Tekin KU, Mestav B, İyit N. Robust logistic modelling for datasets with unusual points. J New Theory. 2021;36:49–63. 10.53570/jnt.971062.Search in Google Scholar
[69] İyit N. Modelling world energy security data from multinomial distribution by generalized linear model under different cumulative link functions. Open Chem. 2018;16(1):377–85. 10.1515/chem-2018-0053.Search in Google Scholar
[70] Akaike H. A new look at the statistical model identification. IEEE Trans Autom Control. 1974;19(6):716–23. 10.1109/TAC.1974.1100705.Search in Google Scholar
[71] Cavanaugh JE. Unifying the derivations for the Akaike and corrected Akaike information criteria. Stat Probab Lett. 1997;33(2):201–8. 10.1016/S0167-7152(96)00128-9.Search in Google Scholar
[72] Schwarz M. Estimating the dimensions of a model. Ann Stat. 1978;6(2):461–4.10.1214/aos/1176344136Search in Google Scholar
[73] Bozdogan H. Model selection and Akaike's Information Criterion (AIC): The general theory and its analytical extensions. Psychometrika. 1987;52:345–70. 10.1007/BF02294361.Search in Google Scholar
[74] R Core Team. R: A language and environment for statistical computing. R Foundation for Statistical Computing, Vienna, Austria, 2021. https://www.R-project.org/.Search in Google Scholar
© 2023 the author(s), published by De Gruyter
This work is licensed under the Creative Commons Attribution 4.0 International License.
Articles in the same Issue
- Characteristics, source, and health risk assessment of aerosol polyaromatic hydrocarbons in the rural and urban regions of western Saudi Arabia
- Regular Articles
- A network-based correlation research between element electronegativity and node importance
- Pomegranate attenuates kidney injury in cyclosporine-induced nephrotoxicity in rats by suppressing oxidative stress
- Ab initio study of fundamental properties of XInO3 (X = K, Rb, Cs) perovskites
- Responses of feldspathic sandstone and sand-reconstituted soil C and N to freeze–thaw cycles
- Robust fractional control based on high gain observers design (RNFC) for a Spirulina maxima culture interfaced with an advanced oxidation process
- Study on arsenic speciation and redistribution mechanism in Lonicera japonica plants via synchrotron techniques
- Optimization of machining Nilo 36 superalloy parameters in turning operation
- Vacuum impregnation pre-treatment: A novel method for incorporating mono- and divalent cations into potato strips to reduce the acrylamide formation in French fries
- Characterization of effective constituents in Acanthopanax senticosus fruit for blood deficiency syndrome based on the chinmedomics strategy
- Comparative analysis of the metabolites in Pinellia ternata from two producing regions using ultra-high-performance liquid chromatography–electrospray ionization–tandem mass spectrometry
- The assessment of environmental parameter along the desalination plants in the Kingdom of Saudi Arabia
- Effects of harpin and carbendazim on antioxidant accumulation in young jujube leaves
- The effects of in ovo injected with sodium borate on hatching performance and small intestine morphology in broiler chicks
- Optimization of cutting forces and surface roughness via ANOVA and grey relational analysis in machining of In718
- Essential oils of Origanum compactum Benth: Chemical characterization, in vitro, in silico, antioxidant, and antibacterial activities
- Translocation of tungsten(vi) oxide/gadolinium(iii) fluoride in tellurite glasses towards improvement of gamma-ray attenuation features in high-density glass shields
- Mechanical properties, elastic moduli, and gamma ray attenuation competencies of some TeO2–WO3–GdF3 glasses: Tailoring WO3–GdF3 substitution toward optimum behavioral state range
- Comparison between the CIDR or sponge with hormone injection to induce estrus synchronization for twining and sex preselection in Naimi sheep
- Exergetic performance analyses of three different cogeneration plants
- Psoralea corylifolia (babchi) seeds enhance proliferation of normal human cultured melanocytes: GC–MS profiling and biological investigation
- A novel electrochemical micro-titration method for quantitative evaluation of the DPPH free radical scavenging capacity of caffeic acid
- Comparative study between supported bimetallic catalysts for nitrate remediation in water
- Persicaline, an alkaloid from Salvadora persica, inhibits proliferation and induces apoptosis and cell-cycle arrest in MCF-7 cells
- Determination of nicotine content in locally produced smokeless tobacco (Shammah) samples from Jazan region of Saudi Arabia using a convenient HPLC-MS/MS method
- Changes in oxidative stress markers in pediatric burn injury over a 1-week period
- Integrated geophysical techniques applied for petroleum basins structural characterization in the central part of the Western Desert, Egypt
- The impact of chemical modifications on gamma-ray attenuation properties of some WO3-reinforced tellurite glasses
- Microwave and Cs+-assisted chemo selective reaction protocol for synthesizing 2-styryl quinoline biorelevant molecules
- Structural, physical, and radiation absorption properties of a significant nuclear power plant component: A comparison between REX-734 and 316L SS austenitic stainless steels
- Effect of Moringa oleifera on serum YKL-40 level: In vivo rat periodontitis model
- Investigating the impact of CO2 emissions on the COVID-19 pandemic by generalized linear mixed model approach with inverse Gaussian and gamma distributions
- Influence of WO3 content on gamma rays attenuation characteristics of phosphate glasses at low energy range
- Study on CO2 absorption performance of ternary DES formed based on DEA as promoting factor
- Performance analyses of detonation engine cogeneration cycles
- Sterols from Centaurea pumilio L. with cell proliferative activity: In vitro and in silico studies
- Untargeted metabolomics revealing changes in aroma substances in flue-cured tobacco
- Effect of pumpkin enriched with calcium lactate on iron status in an animal model of postmenopausal osteoporosis
- Energy consumption, mechanical and metallographic properties of cryogenically treated tool steels
- Optimization of ultra-high pressure-assisted extraction of total phenols from Eucommia ulmoides leaves by response surface methodology
- Harpin enhances antioxidant nutrient accumulation and decreases enzymatic browning in stored soybean sprouts
- Physicochemical and biological properties of carvacrol
- Radix puerariae in the treatment of diabetic nephropathy: A network pharmacology analysis and experimental validation
- Anti-Alzheimer, antioxidants, glucose-6-phosphate dehydrogenase effects of Taverniera glabra mediated ZnO and Fe2O3 nanoparticles in alloxan-induced diabetic rats
- Experimental study on photocatalytic CO2 reduction performance of ZnS/CdS-TiO2 nanotube array thin films
- Epoxy-reinforced heavy metal oxides for gamma ray shielding purposes
- Black mulberry (Morus nigra L.) fruits: As a medicinal plant rich in human health-promoting compounds
- Promising antioxidant and antimicrobial effects of essential oils extracted from fruits of Juniperus thurifera: In vitro and in silico investigations
- Chloramine-T-induced oxidation of Rizatriptan Benzoate: An integral chemical and spectroscopic study of products, mechanisms and kinetics
- Study on antioxidant and antimicrobial potential of chemically profiled essential oils extracted from Juniperus phoenicea (L.) by use of in vitro and in silico approaches
- Screening and characterization of fungal taxol-producing endophytic fungi for evaluation of antimicrobial and anticancer activities
- Mineral composition, principal polyphenolic components, and evaluation of the anti-inflammatory, analgesic, and antioxidant properties of Cytisus villosus Pourr leaf extracts
- In vitro antiproliferative efficacy of Annona muricata seed and fruit extracts on several cancer cell lines
- An experimental study for chemical characterization of artificial anterior cruciate ligament with coated chitosan as biomaterial
- Prevalence of residual risks of the transfusion-transmitted infections in Riyadh hospitals: A two-year retrospective study
- Computational and experimental investigation of antibacterial and antifungal properties of Nicotiana tabacum extracts
- Reinforcement of cementitious mortars with hemp fibers and shives
- X-ray shielding properties of bismuth-borate glass doped with rare earth ions
- Green supported silver nanoparticles over modified reduced graphene oxide: Investigation of its antioxidant and anti-ovarian cancer effects
- Orthogonal synthesis of a versatile building block for dual functionalization of targeting vectors
- Thymbra spicata leaf extract driven biogenic synthesis of Au/Fe3O4 nanocomposite and its bio-application in the treatment of different types of leukemia
- The role of Ag2O incorporation in nuclear radiation shielding behaviors of the Li2O–Pb3O4–SiO2 glass system: A multi-step characterization study
- A stimuli-responsive in situ spray hydrogel co-loaded with naringenin and gentamicin for chronic wounds
- Assessment of the impact of γ-irradiation on the piperine content and microbial quality of black pepper
- Antioxidant, sensory, and functional properties of low-alcoholic IPA beer with Pinus sylvestris L. shoots addition fermented using unconventional yeast
- Screening and optimization of extracellular pectinase produced by Bacillus thuringiensis SH7
- Determination of polyphenols in Chinese jujube using ultra-performance liquid chromatography–mass spectrometry
- Synergistic effects of harpin and NaCl in determining soybean sprout quality under non-sterile conditions
- Field evaluation of different eco-friendly alternative control methods against Panonychus citri [Acari: Tetranychidae] spider mite and its predators in citrus orchards
- Exploring the antimicrobial potential of biologically synthesized zero valent iron nanoparticles
- NaCl regulates goldfish growth and survival at three food supply levels under hypoxia
- An exploration of the physical, optical, mechanical, and radiation shielding properties of PbO–MgO–ZnO–B2O3 glasses
- A novel statistical modeling of air pollution and the COVID-19 pandemic mortality data by Poisson, geometric, and negative binomial regression models with fixed and random effects
- Treatment activity of the injectable hydrogels loaded with dexamethasone In(iii) complex on glioma by inhibiting the VEGF signaling pathway
- An alternative approach for the excess lifetime cancer risk and prediction of radiological parameters
- Panax ginseng leaf aqueous extract mediated green synthesis of AgNPs under ultrasound condition and investigation of its anti-lung adenocarcinoma effects
- Study of hydrolysis and production of instant ginger (Zingiber officinale) tea
- Novel green synthesis of zinc oxide nanoparticles using Salvia rosmarinus extract for treatment of human lung cancer
- Evaluation of second trimester plasma lipoxin A4, VEGFR-1, IL-6, and TNF-α levels in pregnant women with gestational diabetes mellitus
- Antidiabetic, antioxidant and cytotoxicity activities of ortho- and para-substituted Schiff bases derived from metformin hydrochloride: Validation by molecular docking and in silico ADME studies
- Antioxidant, antidiabetic, antiglaucoma, and anticholinergic effects of Tayfi grape (Vitis vinifera): A phytochemical screening by LC-MS/MS analysis
- Identification of genetic polymorphisms in the stearoyl CoA desaturase gene and its association with milk quality traits in Najdi sheep
- Cold-acclimation effect on cadmium absorption and biosynthesis of polyphenolics, and free proline and photosynthetic pigments in Spirogyra aequinoctialis
- Analysis of secondary metabolites in Xinjiang Morus nigra leaves using different extraction methods with UPLC-Q/TOF-MS/MS technology
- Nanoarchitectonics and performance evaluation of a Fe3O4-stabilized Pickering emulsion-type differential pressure plugging agent
- Investigating pyrolysis characteristics of Shengdong coal through Py-GC/MS
- Extraction, phytochemical characterization, and antifungal activity of Salvia rosmarinus extract
- Introducing a novel and natural antibiotic for the treatment of oral pathogens: Abelmoschus esculentus green-formulated silver nanoparticles
- Optimization of gallic acid-enriched ultrasonic-assisted extraction from mango peels
- Effect of gamma rays irradiation in the structure, optical, and electrical properties of samarium doped bismuth titanate ceramics
- Combinatory in silico investigation for potential inhibitors from Curcuma sahuynhensis Škorničk. & N.S. Lý volatile phytoconstituents against influenza A hemagglutinin, SARS-CoV-2 main protease, and Omicron-variant spike protein
- Physical, mechanical, and gamma ray shielding properties of the Bi2O3–BaO–B2O3–ZnO–As2O3–MgO–Na2O glass system
- Twofold interpenetrated 3D Cd(ii) complex: Crystal structure and luminescent property
- Study on the microstructure and soil quality variation of composite soil with soft rock and sand
- Ancient spring waters still emerging and accessible in the Roman Forum area: Chemical–physical and microbiological characterization
- Extraction and characterization of type I collagen from scales of Mexican Biajaiba fish
- Finding small molecular compounds to decrease trimethylamine oxide levels in atherosclerosis by virtual screening
- Prefatory in silico studies and in vitro insecticidal effect of Nigella sativa (L.) essential oil and its active compound (carvacrol) against the Callosobruchus maculatus adults (Fab), a major pest of chickpea
- Polymerized methyl imidazole silver bromide (CH3C6H5AgBr)6: Synthesis, crystal structures, and catalytic activity
- Using calcined waste fish bones as a green solid catalyst for biodiesel production from date seed oil
- Influence of the addition of WO3 on TeO2–Na2O glass systems in view of the feature of mechanical, optical, and photon attenuation
- Naringin ameliorates 5-fluorouracil elicited neurotoxicity by curtailing oxidative stress and iNOS/NF-ĸB/caspase-3 pathway
- GC-MS profile of extracts of an endophytic fungus Alternaria and evaluation of its anticancer and antibacterial potentialities
- Green synthesis, chemical characterization, and antioxidant and anti-colorectal cancer effects of vanadium nanoparticles
- Determination of caffeine content in coffee drinks prepared in some coffee shops in the local market in Jeddah City, Saudi Arabia
- A new 3D supramolecular Cu(ii) framework: Crystal structure and photocatalytic characteristics
- Bordeaux mixture accelerates ripening, delays senescence, and promotes metabolite accumulation in jujube fruit
- Important application value of injectable hydrogels loaded with omeprazole Schiff base complex in the treatment of pancreatitis
- Color tunable benzothiadiazole-based small molecules for lightening applications
- Investigation of structural, dielectric, impedance, and mechanical properties of hydroxyapatite-modified barium titanate composites for biomedical applications
- Metal gel particles loaded with epidermal cell growth factor promote skin wound repair mechanism by regulating miRNA
- In vitro exploration of Hypsizygus ulmarius (Bull.) mushroom fruiting bodies: Potential antidiabetic and anti-inflammatory agent
- Alteration in the molecular structure of the adenine base exposed to gamma irradiation: An ESR study
- Comprehensive study of optical, thermal, and gamma-ray shielding properties of Bi2O3–ZnO–PbO–B2O3 glasses
- Lewis acids as co-catalysts in Pd-based catalyzed systems of the octene-1 hydroethoxycarbonylation reaction
- Synthesis, Hirshfeld surface analysis, thermal, and selective α-glucosidase inhibitory studies of Schiff base transition metal complexes
- Protective properties of AgNPs green-synthesized by Abelmoschus esculentus on retinal damage on the virtue of its anti-inflammatory and antioxidant effects in diabetic rat
- Effects of green decorated AgNPs on lignin-modified magnetic nanoparticles mediated by Cydonia on cecal ligation and puncture-induced sepsis
- Treatment of gastric cancer by green mediated silver nanoparticles using Pistacia atlantica bark aqueous extract
- Preparation of newly developed porcelain ceramics containing WO3 nanoparticles for radiation shielding applications
- Utilization of computational methods for the identification of new natural inhibitors of human neutrophil elastase in inflammation therapy
- Some anticancer agents as effective glutathione S-transferase (GST) inhibitors
- Clay-based bricks’ rich illite mineral for gamma-ray shielding applications: An experimental evaluation of the effect of pressure rates on gamma-ray attenuation parameters
- Stability kinetics of orevactaene pigments produced by Epicoccum nigrum in solid-state fermentation
- Treatment of denture stomatitis using iron nanoparticles green-synthesized by Silybum marianum extract
- Characterization and antioxidant potential of white mustard (Brassica hirta) leaf extract and stabilization of sunflower oil
- Characteristics of Langmuir monomolecular monolayers formed by the novel oil blends
- Strategies for optimizing the single GdSrFeO4 phase synthesis
- Oleic acid and linoleic acid nanosomes boost immunity and provoke cell death via the upregulation of beta-defensin-4 at genetic and epigenetic levels
- Unraveling the therapeutic potential of Bombax ceiba roots: A comprehensive study of chemical composition, heavy metal content, antibacterial activity, and in silico analysis
- Green synthesis of AgNPs using plant extract and investigation of its anti-human colorectal cancer application
- The adsorption of naproxen on adsorbents obtained from pepper stalk extract by green synthesis
- Treatment of gastric cancer by silver nanoparticles encapsulated by chitosan polymers mediated by Pistacia atlantica extract under ultrasound condition
- In vitro protective and anti-inflammatory effects of Capparis spinosa and its flavonoids profile
- Wear and corrosion behavior of TiC and WC coatings deposited on high-speed steels by electro-spark deposition
- Therapeutic effects of green-formulated gold nanoparticles by Origanum majorana on spinal cord injury in rats
- Melanin antibacterial activity of two new strains, SN1 and SN2, of Exophiala phaeomuriformis against five human pathogens
- Evaluation of the analgesic and anesthetic properties of silver nanoparticles supported over biodegradable acacia gum-modified magnetic nanoparticles
- Review Articles
- Role and mechanism of fruit waste polyphenols in diabetes management
- A comprehensive review of non-alkaloidal metabolites from the subfamily Amaryllidoideae (Amaryllidaceae)
- Discovery of the chemical constituents, structural characteristics, and pharmacological functions of Chinese caterpillar fungus
- Eco-friendly green approach of nickel oxide nanoparticles for biomedical applications
- Advances in the pharmaceutical research of curcumin for oral administration
- Rapid Communication
- Determination of the contents of bioactive compounds in St. John’s wort (Hypericum perforatum): Comparison of commercial and wild samples
- Retraction
- Retraction of “Two mixed-ligand coordination polymers based on 2,5-thiophenedicarboxylic acid and flexible N-donor ligands: The protective effect on periodontitis via reducing the release of IL-1β and TNF-α”
- Topical Issue on Phytochemicals, biological and toxicological analysis of aromatic medicinal plants
- Anti-plasmodial potential of selected medicinal plants and a compound Atropine isolated from Eucalyptus obliqua
- Anthocyanin extract from black rice attenuates chronic inflammation in DSS-induced colitis mouse model by modulating the gut microbiota
- Evaluation of antibiofilm and cytotoxicity effect of Rumex vesicarius methanol extract
- Chemical compositions of Litsea umbellata and inhibition activities
- Green synthesis, characterization of silver nanoparticles using Rhynchosia capitata leaf extract and their biological activities
- GC-MS analysis and antibacterial activities of some plants belonging to the genus Euphorbia on selected bacterial isolates
- The abrogative effect of propolis on acrylamide-induced toxicity in male albino rats: Histological study
- A phytoconstituent 6-aminoflavone ameliorates lipopolysaccharide-induced oxidative stress mediated synapse and memory dysfunction via p-Akt/NF-kB pathway in albino mice
- Anti-diabetic potentials of Sorbaria tomentosa Lindl. Rehder: Phytochemistry (GC-MS analysis), α-amylase, α-glucosidase inhibitory, in vivo hypoglycemic, and biochemical analysis
- Assessment of cytotoxic and apoptotic activities of the Cassia angustifolia aqueous extract against SW480 colon cancer
- Biochemical analysis, antioxidant, and antibacterial efficacy of the bee propolis extract (Hymenoptera: Apis mellifera) against Staphylococcus aureus-induced infection in BALB/c mice: In vitro and in vivo study
- Assessment of essential elements and heavy metals in Saudi Arabian rice samples underwent various processing methods
- Two new compounds from leaves of Capparis dongvanensis (Sy, B. H. Quang & D. V. Hai) and inhibition activities
- Hydroxyquinoline sulfanilamide ameliorates STZ-induced hyperglycemia-mediated amyleoid beta burden and memory impairment in adult mice
- An automated reading of semi-quantitative hemagglutination results in microplates: Micro-assay for plant lectins
- Inductively coupled plasma mass spectrometry assessment of essential and toxic trace elements in traditional spices consumed by the population of the Middle Eastern region in their recipes
- Phytochemical analysis and anticancer activity of the Pithecellobium dulce seed extract in colorectal cancer cells
- Impact of climatic disturbances on the chemical compositions and metabolites of Salvia officinalis
- Physicochemical characterization, antioxidant and antifungal activities of essential oils of Urginea maritima and Allium sativum
- Phytochemical analysis and antifungal efficiency of Origanum majorana extracts against some phytopathogenic fungi causing tomato damping-off diseases
- Special Issue on 4th IC3PE
- Graphene quantum dots: A comprehensive overview
- Studies on the intercalation of calcium–aluminium layered double hydroxide-MCPA and its controlled release mechanism as a potential green herbicide
- Synergetic effect of adsorption and photocatalysis by zinc ferrite-anchored graphitic carbon nitride nanosheet for the removal of ciprofloxacin under visible light irradiation
- Exploring anticancer activity of the Indonesian guava leaf (Psidium guajava L.) fraction on various human cancer cell lines in an in vitro cell-based approach
- The comparison of gold extraction methods from the rock using thiourea and thiosulfate
- Special Issue on Marine environmental sciences and significance of the multidisciplinary approaches
- Sorption of alkylphenols and estrogens on microplastics in marine conditions
- Cytotoxic ketosteroids from the Red Sea soft coral Dendronephthya sp.
- Antibacterial and biofilm prevention metabolites from Acanthophora spicifera
- Characteristics, source, and health risk assessment of aerosol polyaromatic hydrocarbons in the rural and urban regions of western Saudi Arabia
- Special Issue on Advanced Nanomaterials for Energy, Environmental and Biological Applications - Part II
- Green synthesis, characterization, and evaluation of antibacterial activities of cobalt nanoparticles produced by marine fungal species Periconia prolifica
- Combustion-mediated sol–gel preparation of cobalt-doped ZnO nanohybrids for the degradation of acid red and antibacterial performance
- Perinatal supplementation with selenium nanoparticles modified with ascorbic acid improves hepatotoxicity in rat gestational diabetes
- Evaluation and chemical characterization of bioactive secondary metabolites from endophytic fungi associated with the ethnomedicinal plant Bergenia ciliata
- Enhancing photovoltaic efficiency with SQI-Br and SQI-I sensitizers: A comparative analysis
- Nanostructured p-PbS/p-CuO sulfide/oxide bilayer heterojunction as a promising photoelectrode for hydrogen gas generation