Specific, highly sensitive and simple spectrofluorimetric method for quantification of daclatasvir in HCV human plasma patients and in tablets dosage form
-
Ramadan Ali
 and
Mohamed M Elsutohy
and
Mohamed M Elsutohy

Abstract
A simple, selective and highly sensitive spectrofluorimetric method for the quantitative detection of an antiviral drug, daclatasvir (DCV) has been developed and analytically validated in its pure form, in its commercially available pharmaceutical preparations, and in hepatitis-C (HCV) patient’s plasma. The method was based on recording the native fluorescence of DCV that exhibit an emission wavelength maximum at 380 nm upon excitation at 320 nm. Many factors affecting the fluorescence intensity and the method sensitivity including pH, type of surfactant and solvent have been studied and optimized. In addition, a stability-indicating study was performed in accordance with the guidelines of the International Conference on Harmonization (ICH), to detect the drug in the presence of its degradation products which validates the method for application in quality control laboratories. In addition, extraction of DCV from the plasma proteins was performed using a simple technique that was based on using methanol and borate buffer (pH 9) that gave a recovery of ~95%. The results showed that DCV could be detected using this method in the pure form (with a linear range of 2-1000 ng/mL), commercially available tablets and in plasma samples (with a linear range of 5-1000 ng/mL), without any interferences. Furthermore, the method was also analytically and clinically validated according to the Food and Drug Administration (FDA) guidelines, with limit of detection (LOD) of 0.3 and 0.5 ng/mL for DCV in the pure form and plasma samples, respectively.
Graphical Abstract
1 Introduction
Hepatitis-C virus (HCV) is a global health problem responsible for chronic infections for approximately 170 million people leading to 700 000 deaths [1]. According to the World Health Organization (WHO), the highest rate of HCV infection in the world has been recorded in Egypt where approximately 15% of its population have been diagnosed with HCV [2]; 150 000 Egyptians are carrying the latent virus and almost 40 000 people die every year [3,4]. The treatment of HCV is based on the application of direct-acting antivirus agents (DAAs) in conjunction with other medicines such as ribavirin that can achieve a highly successful recovery rate of more than 95% [5, 6, 7]. Daclatasvir (DCV, Figure 1) is a DAA that was listed in the WHO Essential Medicines for the treatment of HCV and introduced into the global market in 2015 [8].
Structure formula of DCV.
Many methods have been reported for the detection of DCV, in tablets or biological fluids, including UPLC/MS/MS [9, 10, 11], LC/MS/MS [12, 13], HPLC [14, 15, 16], and electrochemical method[17]. However, the application of such methods for the analysis of DCV in low socioeconomic countries, where HCV is an epidemic, is limited due to the high cost of operations and the rare availability of equipment. Further, most of these methods require well-trained staff, extensive extraction protocols and are time-consuming. Alternatively, spectrofluorimetry offers a simple, sensitive, and selective technique for the quantification of drugs in their pure state, dosage forms or in biological fluids, without the need for an extensive extraction process. This study describes a validated spectrofluorimetric method for the quantitative detection of DCV in its pure form, and which is commercially
available in tablet form and in human plasma samples that were collected from HCV patients treated with DCV. This method was almost a thousand times more sensitive than the previously reported HPLC methods [14, 15, 16] and with a comparable sensitivity to the reported LC/MS/MS methods [12, 13]. The study was analytically validated according to the FDA guidelines and was extended to investigate the stability/degradation process of DCV under various stress conditions. This validated the described protocol for the analysis of DCV in the presence of its degradation products and in the quality control laboratories.
2 Experimental
2.1 Apparatus and measurement conditions
Fluorescence measurements were recorded, using 1 cm-quartz cells, on a fluorescence spectrometer FS-2 (Scinco, Korea) with grating excitation and emission monochromators, slit width was adjusted at 10. The excitation and emission wavelength were set at 320 nm and 380 nm respectively. Jenwey PH meter model 350, a centrifuge (Bremsen ECCO, Germany), at the speed of 10000 rpm, and a Shimadzu UV-1601 PC UV-visible spectrophotometer (Tokyo, Japan) with 1 cm quartz cell were used. CAMAG UV-lamp, dual wavelength (254/366), 2×8W (Muttenz Switzerland) was used to initiate the photo-degradation process.
2.2 Material and reagents
Throughout this research, all chemicals were of analytical grade and double distilled water was used. Daclatasvir dihydrochloride (DCV), a pure standard, with a purity of ~99.99% as measured using a reported method14, was purchased from Bristol-Myers Squibb, USA and was used as received. Sofosbuvir (SFB) was purchased from Virdev Intermediates Pvt Ltd., India while ribavirin (RBV) was obtained from Modern Times Helpline Pharma; New Delhi; India. Methanol; ethanol, isopropanol, acetonitrile, tween 80, PEG 6000, sodium lauryl sulfate, polyoxyethylene 50 stearate, carboxymethyl cellulose, hydrogen peroxide (30%), sodium hydroxide and hydrochloric acid (33%) were purchased from El Nasr Chemical Company, Cairo, Egypt. Acetate buffer solutions (0.2 M), in the range of pH 3.6 to 5.6, and borate buffer (0.2 M) in the range of pH 6.5 to 9.5, were prepared. All tablets that contained the dosage of 60 mg of DCV (Daklinza® from Bristol-Myers Squibb company, Daclavirocyrl® manufactured by Mercyrl Pharmaceutical Industries, Dakasvir® produced by Pharma-5 and Daclanork® by Mash Premiere Company) were purchased from the Egyptian local market.
2.3 Preparation of standard and working solutions for pure drug and plasma analysis
For pure drug solution: a stock standard solution of 1 mg/mL was prepared in methanol. Further dilutions were made using methanol to prepare the working standard solution (10 μg/mL) and concentrations in the range of 2-80 ng/mL.
For plasma: 10 mg of DCV were weighed, transferred into a 10 mL-volumetric flask, dissolved in methanol and completed to 10 mL with the same solvent (solution S). From this solution, 32.0 μL was transferred into a 10 mL-volumetric flask and then completed to 10 mL with methanol to produce a solution with a concentration of 1 μg/mL (Calib. G). Different volumes from the Calib. G solution were further diluted to 4 mL with methanol to obtain the working standard concentrated solutions suitable for the analysis (Table 1). The QC stock solution was prepared as described for the calibration stock solution by i weighing 10 mg separately.
Procedure for preparation of plasma working standard solutions.
| Calib. name | Volume (μL) taken from Calib. G | Amount of methanol added (μL)* | Resulted concentration(ng/mL) |
|---|---|---|---|
| Calib. A | 20 | 3980 | 5 |
| Calib. B | 60 | 3940 | 15 |
| Calib. C | 180 | 3820 | 45 |
| Calib. D | 480 | 3520 | 120 |
| Calib. E | 1300 | 2700 | 325 |
| Calib. F | 2700 | 1300 | 675 |
*The solution required is 4000 μL
2.4 Procedure for calibration curve construction
For pure drug solution: Aliquots of 1 mL of the working solution were transferred into a series of 10 mL volumetric
flasks, wrapped with aluminum foil. The volumes were made up with methanol to prepare solutions with concentrations of 2-1000 ng/mL (2, 5, 50, 100, 200, 400, 500, 600, 700, and 1000 ng/mL). The relative fluorescence intensity was recorded against the corresponding concentration to construct the calibration curve.
For plasma: A 200 μL of human plasma was transferred into a series of test tubes, wrapped with aluminum foil, spiked with 25 μL of the working DCV solutions that were used to construct the calibration solutions (Calib A, B, C, D, E, F, and G), to prepare samples with concentrations of 5, 15, 45, 120, 325, 675, and 1000 ng/mL, respectively.
For protein precipitation: 200 μL borate buffer (pH 9) was added into the plasma samples followed by addition of 2 mL of methanol for each solution; the content of each test tube was mixed by vortex for 5 min and centrifuged at 10 000 rpm for 10 min. The clear supernatant was carefully transferred into a quartz cell and measured directly by the fluorimeter. The relationship between the relative fluorescence intensity was established versus the corresponding drug concentration and the regression equation was also calculated. A blank experiment was carried out on drug-free plasma samples treated similarly without the addition of DCV. The samples were prepared as described for calibration samples with concentrations of 6, 400, and 800 ng/mL and 15, 400, and 800 ng/mL for pure and plasma samples respectively.
2.5 Procedure for tablets
An accurately weighed quantity equivalent to 10 mg of DCV of ten grounded tablets was transferred into a 100 mL volumetric flask, dissolved in 50 ml of methanol and sonicated for 30 min. The flask content was completed to the level with the same solvent to obtain a concentration of 10 μg/mL. Then the procedure was processed as described under the calibration curve construction. The nominal content of tablets was calculated using the calibration graph or the corresponding regression equation.
2.6 Clinical study
After approval by the Ethics Committee of the Faculty of Medicine, Al-Azhr University, Assuit, Egypt, all plasma samples were collected from the outpatient at the Division of Internal Medicine with written informed consent obtained from all patients.
2.7 Plasma sample preparation
Appropriate preventive measures were taken during the process of collection, processing and the storage of the plasma samples as DCV is light-sensitive. Samples were handled under yellow light and not UV or sunlight, and then stored in the dark. Additionally, all glassware and equipment were wrapped with aluminum foil. All analysis steps were conducted under light-protected conditions. Stock and standard solutions were stored in brown glass vials at -5°C. Plasma samples were taken from eight hepatitis C patients during their treatment with SFB and DCV regimen. Four plasma samples (subject 1-4) were collected after 2h of oral administration while the rest samples (subject 5-8) were taken 10h post oral dose. Following this, 5.0 ml of human blood samples were collected into K2-EDTA tube after 2h and 10h following the last oral administration. The tubes content was centrifuged at 10 000 rpm for 10 min followed by transferring 200 μL of plasma into centrifuge tubes, wrapped with aluminum, and then 200 μL of borate buffer (pH 9) were added for each tube. For protein precipitation 2 mL of methanol was added, the solution was mixed by vortex for 5 min and centrifuged at 10 000 rpm for 10 min. The clear supernatant was carefully transferred into a quartz cell, and the relative fluorescence intensity was measured. The procedure was repeated three times on three different days to obtain the intraday and inter-day assay.
2.8 Procedure for stress degradation studies
2.8.1 Acidic, alkaline and oxidative degradation studies
An aliquot of DCV equivalent to 400 ng/mL was transferred into a series of test tubes, to which 5 mL of 1M HCl, 1M NaOH or 10% H2O2 were added. The content of each tube was boiled at 100 °C for different time intervals of 10, 20, 30, 40, 50, and 60 minutes and then cooled and neutralized to pH 7. The solutions were then transferred into 25-mL volumetric flasks and completed to the water level. 1.5 mL of each solution was transferred into a 10-mL volumetric flask and the volume was completed to the appropriate level with methanol to end up with a final concentration of 60 ng/mL. The general procedure that was described under the “construction of calibration curve” was followed.
2.8.2 photolytic degradation study
An aliquot of DCV equivalent to 600 ng/mL was transferred into a 10-mL volumetric flask, sealed well and completed with methanol (final concentration 60 ng/mL) up to 10 mL. The flask was exposed to the UV-light at a wavelength of 254 nm for 24 h using an UV-lamp followed by measuring the fluorescence intensity.
2.8.3 Stability in direct sunlight
Human plasma samples were infused with the drug (200 ng/mL) and exposed to direct daylight. In parallel, methanolic solutions of drug (60 ng/mL) were exposed to direct daylight at room temperature using glass containers which were directly positioned close to the laboratory window for 0, 1, 2, 4, 6, 8, 10, and 12 hours. All samples were processed according to the described extraction and fluorimetric method.
3 Results and discussion
A DCV solution in methanol exhibits an intense native fluorescence maximum at ~380 nm (Figure 2). However, quantitative determination of DCV in biological fluids and pharmaceutical preparation based on using its native fluorescence signals has not been reported yet. This encouraged us to develop a simple analytical method for the quantitative detection of DCV using its native fluorescence signal, permitting its application in many laboratories, especially in low-income countries where sophisticated alternatives such as LC/MS/MS are not available.
Excitation and emission spectra of RBV (A, A*), SFB (B, B*), and DCV (C, C*) in spiked human plasma.
DCV is combined with other drugs including SFB and RBV; therefore, any method developed for the assay must be able to determine DCV in the presence of such co-administrated drugs. Further, factors that may influence fluorescence measurements such as pH, surfactant, diluting solvent must be optimized to maximize the signal recorded. Therefore, we started this study by studying and optimizing the effect of such factors on the native fluorescence signal of DCV.
3.1 Effect of pH
The effect of pH on the fluorescence intensity of DCV was studied using 2.0 mL of acetate buffer (pH from 3.5±0.1 to 5.5±0.1); borate buffer (pH from 6.5±0.1 to 9.5±0.1), acidic (0.1M HCl) or basic conditions (0.1M NaOH). The results showed that the fluorescence intensity of DCV was not significantly increased upon pH variations (Figure 3). As a result, buffer solutions, acids and bases were excluded during the analysis of DCV.
Effect of different pH on the RFI of DCV (60 ng/mL).
3.2 Effect of surfactant
It has been reported that surfactants could improve the fluorescence intensity of many molecules via micelle formation. Therefore, the interplay between different surfactants and the fluorescence signal of DCV was investigated using 1 mL of aqueous solution of each surfactant (tween 80, PEG 6000, sodium lauryl sulfate, polyoxyethylene 50 stearate, and carboxymethylcellulose).
The results showed that polyoxyethylene 50 stearate and carboxymethylcellulose did not influence the fluorescence intensity while other surfactants such as PEG 60000, sodium lauryl sulfate or tween 80 slightly reduced the recorded fluorescence (Figure 4). As a result, no surfactant was used throughout this work.
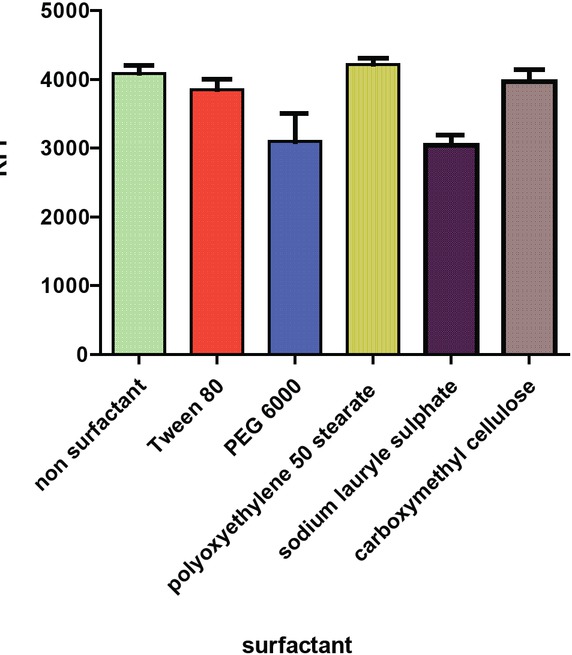
Effect of various surfactant on fluorescence intensity of DCV (60 ng/mL).
3.3 Effect of diluting solvent
Different diluting solvents including methanol, ethanol, isopropanol, acetonitrile or water were attempted to study their effects on the fluorescence intensity of DCV. As in Figure 5, the results showed that the highest fluorescence signal of DCV was obtained when methanol was used for dilution. Therefore, methanol was used as the optimal diluting solvent for further work.
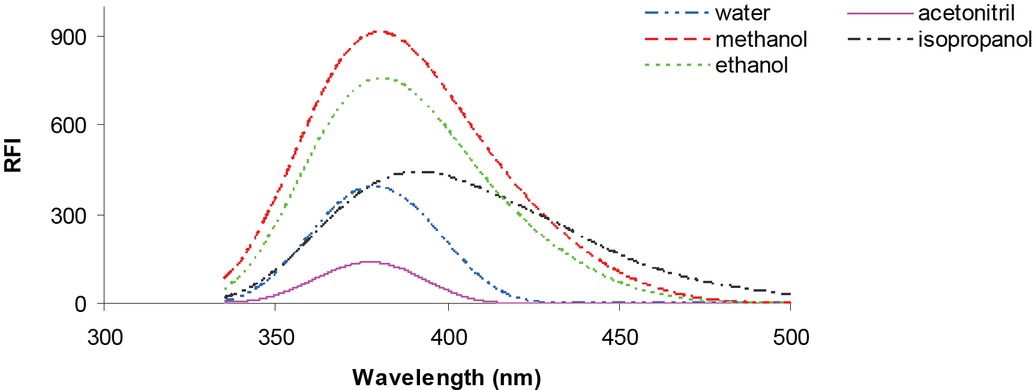
Effect of diluting solvent on the fluorescence intensity of DCV.
3.4 Recovery study
An optimal extraction protocol should be identified before the proposed method to detect DCV in pharmaceutical preparations and plasma samples can be applied; it has been reported that more than 99% of DCV were attached to the plasma proteins which indicates that the extraction
of DCV from the protein prior to analysis is required [20]. Accordingly, a protein precipitation technique was utilized to extract the drug from the attached proteins using a precipitating solvent. In this work, three precipitating solvents namely methanol, acetonitrile, and isopropanol were tested; results showed that methanol and borate buffer (pH 9), in the ratio of 2:1, gave the highest percentage of drug recovery at ~95% (Figure 6). This high extraction recovery using methanol and borate buffer (pH 9), indicates the efficiency of methanol to precipitate the plasma protein and to extract the free drug into the organic layer [21]. The mean recoveries of DCV from plasma were calculated at three concentration levels; low, middle and high, using six replicates for each concentration. The obtained recoveries ranged from 90±0.4 to 105±1.6% which could validate our method for the quantification of DCV in biological fluids, such as plasma (Table 3) (Figure 6).
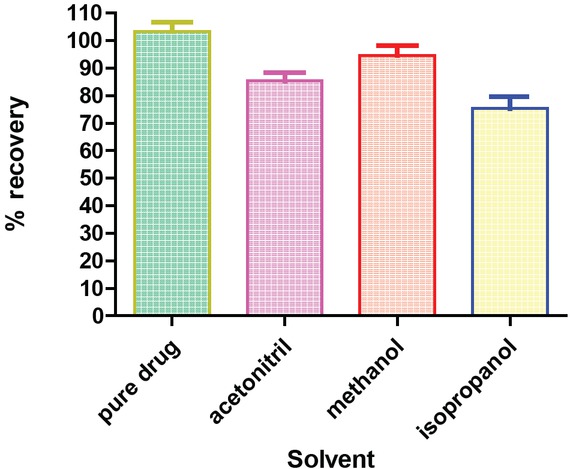
Percentage recovery for different solvents used for extracting DCV from plasma
Analytical performance data for the spectrofluorimetric quantification of DCV in pure form and spiked plasma.
| Parameter | Pure form | Plasma |
|---|---|---|
| Wavelength (λex/ λem.) nm | 320/380 | 320/380 |
| Linearity and range (ng/mL) | 2-1000 | 5-1000 |
| Lower limit of detection LLOD (ng/mL) | 0.300 | 0.501 |
| Lower limit of quantification LLOQ (ng/mL) | 1.21 | 2.66 |
| Intercept (a) | 112.33 +0.87 | 145.5 3 +1.32 |
| Slope (b) | 30.33 + 0.031 | 21.55 +0.6 7 |
| r | 0.9996 | 0.9998 |
| r2 | 0.9993 | 0.9997 |
| %RSD | 1.02 | 1.87 |
| % Error | 0.87 | 1.34 |
Validation results for DCV in pure form and plasma matrix with the extraction recovery percentage.
| Pure samples | Plasma | |||||
|---|---|---|---|---|---|---|
| QC A | QC B | QC C | QC A | QC B | QC C | |
| Concentrationa | 10 | 400 | 800 | 15 | 400 | 800 |
| Within-batch | ||||||
| 1 Mean [ng/mL] | 9.86 | 390.20 | 800.01 | 14.17 | 394.17 | 827.83 |
| Accuracy [%] | 98.58 | 98.00 | 100.01 | 94.51 | 98.10 | 103.76 |
| Precision [%CV] | 7.23 | 2.46 | 2.42 | 7.88 | 7.64 | 11.12 |
| 2 Mean [ng/mL] | 9.60 | 400.05 | 799.81 | 14.64 | 390.83 | 798.83 |
| Accuracy [%] | 95.98 | 100.13 | 99.72 | 97.61 | 97.52 | 99.75 |
| Precision [%CV] | 7.18 | 3.87 | 2.72 | 7.44 | 5.57 | 6.40 |
| 3 Mean [ng/mL] | 9.59 | 390.70 | 790.70 | 15.20 | 404.50 | 822.00 |
| Accuracy [%] | 95.93 | 99.19 | 99.56 | 101.03 | 101.25 | 102.70 |
| Precision [%CV] | 8.34 | 5.81 | 4.43 | 5.80 | 11.28 | 6.41 |
| Batch-to-batch | ||||||
| Mean [ng/mL] | 9.68 | 393.64 | 796.84 | 14.66 | 395.83 | 816.22 |
| Accuracy [%] | 95.93 | 99.19 | 99.56 | 97.71 | 98.92 | 102.06 |
| Precision [%CV] | 7.58 | 4.07 | 3.19 | 7.04 | 8.16 | 7.97 |
| % Recovery ±SD | 99.3±1.3 | 105±1.6 | 90±0.4 | |||
a Nominal analyte concentrations [ng/mL]
3.5 Validation of the proposed method
The method was validated in accordance with the FDA recommendations in the terms of linearity, range, LOD, LOQ, accuracy, precision, and specificity according to FDA [19].
3.5.1 Linearity and range
The linear range of the proposed method to detect DCV was assessed by analyzing sets of DCV (n=10 or 7 for calibration curve) in its pure form and in plasma samples. The relationship between the concentration and fluorescence intensity was established. The results showed that a linear relationship could be observed over the range of 2-1000 ng/mL and 5-1000 ng/mL for pure drug solution and in plasma samples, respectively. Statistical analysis of the data including intercept (a), slope (b), percentage of relative standard deviation (%RSD), and percentage of standard error (% Err) are listed in Table 2.
3.5.2 Limit of detection and limit of quantification
The author’s method was used to calculate the limit of detection (LOD) and the limit of quantification (LOQ) for the detection of DCV in its pure form and plasma. This was performed by calculating the lowest and highest concentrations that could be detected using the proposed method. The results revealed that the LOD values were 0.3 and 0.5 ng/mL for pure and plasma samples, respectively while LOQ was either 1.21 or 2.66 ng/mL for pure or plasma, respectively (Table 2).
Where: Sa is the standard deviation of intercept of calibration graph; b is slope of the calibration graph.
3.5.3 Accuracy and precision
The proposed method was analytically validated according to the recommendations published by the Food and Drug Administration (FDA) [19]. Accuracy was calculated as the ratio between the mean of recovery for different drug concentrations and the nominal value. Precision was defined as the standard deviation (SD) of the mean of at least three readings, expressed in percent. These values were calculated within each batch and for different batches. For this purpose, batches (n=3) containing DCV within eight calibration points and 18 QC samples at three different concentrations (QC A, B, and C) were analyzed. From these values the accuracy and the precision of the method were calculated and expressed as mean values ± SD. Overall the precision measured as coefficient of variance (CV) and was ranged from 4.4-8.3% for pure form and 7.2-8.4% for plasma while accuracy value ranged from 95.9 to 99.5% for pure form of DCV and 97.7-102.1% for plasma samples (Table3).
3.5.4 Selectivity and specificity
The selectivity of the proposed method was assessed to determine DCV in the presence of the two co-administered drugs, SFB and RBV. The results showed that the fluorescence signal of DCV was detected without any interference from the added two drugs that did not exhibit any fluorescence signal at the specified excitation and emission wavelengths of DCV (Figure 2). Therefore, we could consider our method as selective to determine DCV in the presence of the co-administered drugs (SFB and RBV).
3.6 Application in pharmaceutical preparation
The application of the proposed method for analysis of DCV in pharmaceutical formulations were performed. The results gave a considerable recovery percentage ranging from 97.4±1.7 to 102.3±0.6% (Table 4). These results were comparable with a previously reported method [14]. Student’s t-test and F-test were calculated to compare our method with the previously reported methods for the detection of DCV. The values of these tests revealed that there were no significant differences between the reported method and the proposed method at a 95% confidence level.
Results of the degradation study of DCV under different stress conditions.
| Parameter | Sunlight | 1M HCl | 1M NaOH | 10% HO22 | |
|---|---|---|---|---|---|
| pure | plasma | ||||
| t1/2 (min)a | 2.73 | 6.42 | 56.75 | 52.47 | 33.53 |
| r2 | 0.85 | 0.99 | 0.95 | 0.91 | 0.94 |
a t1/2 for sunlight is calculated as hours
3.7 Application to HCV plasma patients
DCV was well-absorbed by the intestines after oral administration, with median peak concentrations observed within 1 to 2 hour’s post-dose. The reported C max of DCV following multiple oral administrations of 60 mg, once daily, was approximately 973 ng/mL [18]. This concentration lies within the linear range of our method which indicates the suitability of the proposed method to determine DCV in human plasma of hepatitis-C patients, treated with such a drug. This experiment was performed against blank plasma samples, free of DCV, to ensure that there was no interference from the plasma content. The results showed that the recovery percentage of DCV in the patient’s plasma ranged from 92.3 to 112.2%, 2 hours post oral dose (subject 1-4) followed by a sharp decline to 45.1 - 69.2% (Figure 7, Table 6), 10 hours after oral administration of DCV.
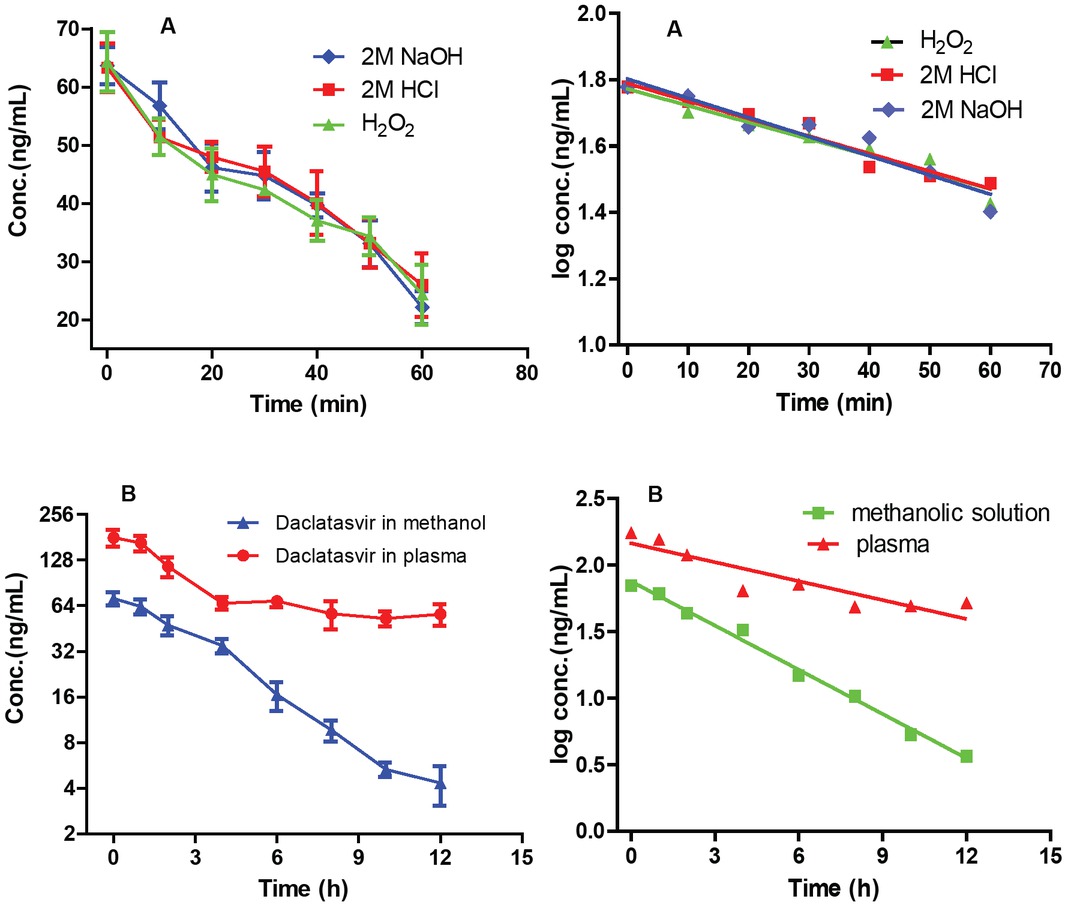
Effect of 1M HCl, 1M NaOH, 10% H2O2 (A), and direct sunlight (B) on DCV stability
Results of quantification of DCV in tablets dosage form.
| Tablet dosage form 60 mg/tablet | Proposed method a (Recovery %±SD) | Reported method a (Recovery %±SD) | t testb | F test b |
|---|---|---|---|---|
| Daclanork | 98.7±1.2 | 99.6±0.7 | 0.89 | 2.9 |
| Daklinza | 102.3±0.6 | 100.7±1.5 | 0.43 | 6.8 |
| Daclavirocyrl | 100.1±0.8 | 99.8±1.1 | 0.65 | 5.9 |
| Dakasvir | 97.4±1.7 | 100.4±0.4 | 0.97 | 8.6 |
Percentage recovery of DCV in real human plasma samples.
| Subject nummbera | Found meanb ±SD) | (Recovery %) |
|---|---|---|
| 1 | 892.24 ±0.7 | 92.4 |
| 2 | 1091.35 ±1.2 | 112.4 |
| 3 | 931.85 ±1.1 | 99.5 |
| 4 | 1016.47 ±1.9 | 105.7 |
| 5 | 577.42 ±1.1 | 59.3 |
| 6 | 600.24 ±1.8 | 61.13 |
| 7 | 673.66 ±0.6 | 69.23 |
| 8 | 438.33±1.4 | 45.05 |
a (subjects 1-4)samples collected 2hrs post oral administration while (subjects 5-8) were collected 10hrs post-dose
b Mean of five determinations
3.8 Stability indicating study
A stability-indicating study was conducted to quantitatively determine DCV in the presence of its degradation products [22]. This study was performed to validate our method application in the quality control laboratories.
3.8.1 Effect of direct daylight on DCV stability in human plasma and methanol matrix
As DCV is light-sensitive, direct exposure of DCV to the daylight could influence the practical handling. To study the effect of direct daylight on DCV stability, human plasma samples were spiked with DCV; drug solutions in methanol were separately prepared as well and exposed to direct daylight for different time intervals. The results showed that approximately 73% of DCV in plasma and 93% of DCV solutions in methanol were degraded after exposure to direct daylight after 12 h. Further, the half-life value of DCV in pure solution or plasma was calculated using the equation of t½=ln2/k≈0.693/k [24]. The half-life of DCV in human plasma (6.78 h) was longer than that obtained from the pure solution in methanol (2.6 h), which could be postulated to the slightly yellow color of human plasma and its consistency, which could offer
some sort of protection in prolonging the half-life (Figure 8 and Table 4). Additionally, the effect of UV light on the stability of DCV was studied by continuous exposure of DCV to the UV lamp at 254 nm for 24h which resulted in the degradation of ~ 15% of DCV, in methanol, after the first 24 hours of UV exposure.
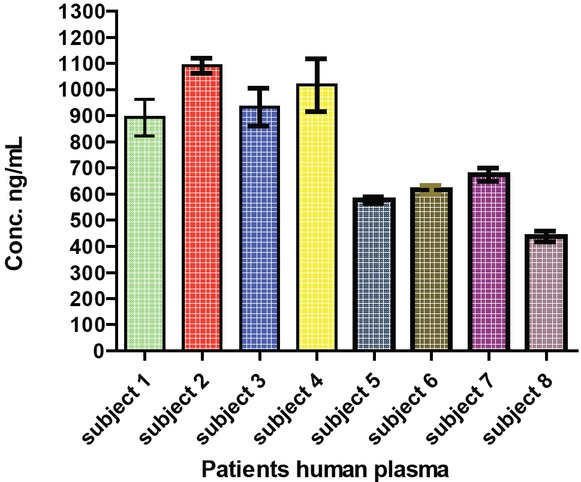
Results of quantification of DCV in HCV treating patients.
3.8.2 Effect of Acid, Alkaline, oxidation, and UV degradation
Stress conditions that could accelerate the degradation of DCV such as extreme acid, alkaline or oxidative conditions were investigated using 1M HCl, 1M NaOH or 10% H2O2 in combination with heating for a different time interval. The results showed that the fluorescence intensity gradually decreased upon increasing the degradation time Figure 8, Table 6). Both acid and alkaline conditions showed the same degradation impact on DCV as ~66% of the original drug was degraded after boiling for 1 hour in either 1 M HCl or 1 M NaOH. In contrast, DCV underwent faster degradation under the specified oxidation conditions (10% H2O) with a shorter half-life on DCV compared to the acid or alkaline degradation.
4 Conclusion
The present work describes a simple and efficient spectrofluorometric method for the detection of an antiviral drug, daclatasvir (DCV), which is commonly used for the treatment of hepatitis C (HCV). The method was successfully applied to determine this drug in its in pure form, in plasma samples collected from hepatitis-C patients who were treated with DCV and in pharmaceutical preparations. In addition, a direct, rapid and cost-effective protein precipitation extraction method was employed
to extract DCV from the patient plasma using methanol: borate buffer (pH 9), in the ratio of 2:1. The method was validated according to FDA recommendations which revealed that the potential method was sensitive enough to detect DCV in pharmaceutical formulations and in human plasma even in the presence of the co-administer drugs (sofosbuvir and ribavirin), which are usually combined with DCV for the treatment of HCV. The simplicity of the proposed method together with the high sensitivity and considerable selectivity facilitate the application of such a method in low socioeconomic countries where HCV is an epidemic and other (sophisticated extraction techniques or chromatographic methods) methods may not be available. In addition, a stability-indicating study validated this method for application in the quality control laboratories.
Conflict of interest: Authors declare no conflict of interest.
References
[1] Perz J.F., Armstrong G.L., Farrington L.A., Hutin Y.J.F., Bell B.P., The contributions of hepatitis B virus and hepatitis C virus infections to cirrhosis and primary liver cancer worldwide. J Hepatol, 2006, 45 529‐38.10.1016/j.jhep.2006.05.013Search in Google Scholar PubMed
[2] El-Zanaty F., Way A., Egypt Demographic and Health Survey 2008. Egyptian: Ministry of Health.Cairo: El-Zanaty and Associates, and Macro International; (2009). https://dhsprogram.com/pubs/pdf/fr220/fr220.pdf (accessed 1 August, 2017)Search in Google Scholar
[3] Mostafa A. Taylor S.M., el-Daly M., el-Hoseiny M., Bakr I., Arafa N., Is the hepatitis C virus epidemic over in Egypt? Incidence and risk factors of new hepatitis C virus infections. Liver Int. 2010,30, 560–56610.1111/j.1478-3231.2009.02204.xSearch in Google Scholar PubMed
[4] world health organization: Egypt steps up efforts against hepatitis C, http://www.who.int/features/2014/egypt-campaign-hepatitisc/en/ (accessed 1 August 2017)Search in Google Scholar
[5] Guidelines for the screening, care and treatment of persons with chronic hepatitis C infection.( Updated version, April 2016. Geneva: World Health Organization; 2016 http://apps.who.int/iris/bitstream/10665/205035/1/9789241549615_eng.pdf?ua=1 (accessed 1March 2017).Search in Google Scholar
[6] Pelosi L.A., Voss S., Liu M., Gao J.A .,. Effect on hepatitis C virus replication of combinations of direct-acting antivirals, including NS5A inhibitor daclatasvir. Lemm. Antimicrob. Agents Chemother., 2012,56, 5230–5239.10.1128/AAC.01209-12Search in Google Scholar PubMed PubMed Central
[7] Hathorn E., Elsharkawy A.M, Management of hepatitis C genotype 4 in the directly acting antivirals era. BMJ Open Gastro 2016, 3(1) e000112.10.1136/bmjgast-2016-000112Search in Google Scholar PubMed PubMed Central
[8] The Selection and Use of Essential Medicines http://apps.who.int/iris/bitstream/10665/189763/1/9789241209946_eng.pdf(accessed 1 July 2017).Search in Google Scholar
[9] Jiang H., Kandoussi H., Zeng J., Wang J., Demers R., Eley T., He B., Burrell R., Easter J., Kadiyala P., Pursley J., Cojocaru L., Baker C., Ryan J., Aubry A.F., Arnold M.E., Multiplexed LC-MS/MS method for the simultaneous quantitation of three novel hepatitis C antivirals, daclatasvir, asunaprevir, and beclabuvir in human plasma. J Pharm Biomed Anal., 2015,107, 409-418.10.1016/j.jpba.2015.01.027Search in Google Scholar PubMed
[10] Ariaudo A., Favata F., De-Nicolò A., Simiele M., Paglietti L., Boglione L., Cardellino C.S., Carcieri C., Di-Perri G., D-Avolio A., A UHPLC-MS/MS method for the quantification of direct antiviral agents simeprevir, daclatasvir, ledipasvir, sofosbuvir/GS-331007, dasabuvir, ombitasvir and paritaprevir, together with ritonavir, in human plasma. J Pharm Biomed Anal., 2016,125, 369-375.10.1016/j.jpba.2016.04.031Search in Google Scholar PubMed
[11] Rezk R. M., Bendas E. R., Basalious E. B., Karim I. A., Development and validation of sensitive and rapid UPLC-MS/MS method for quantitative determination of daclatasvir in human plasma: Application to a bioequivalence study. J Pharma. Biomed. Anal., 2016,128, 61-6610.1016/j.jpba.2016.05.016Search in Google Scholar PubMed
[12] Jiang H., Zeng J., Kandoussi H., Liu Y., Wang X., Bifano M., Cojocaru L., Ryan J., Arnold M. E., A sensitive and accurate liquid chromatography-tandem mass spectrometry method for quantitative determination of the novel hepatitis C NS5A inhibitor BMS-790052 (daclastasvir) in human plasma and urine. J Chromatogr A. 2012,1245 ,117-2110.1016/j.chroma.2012.05.028Search in Google Scholar PubMed
[13] Yuan L., Jiang H., Zheng N., Xia Y.Q., Ouyang Z., Zeng J., Akinsanya B., Valentine J.L., Moehlenkamp J.D., Deng Y., Aubry A.F., Arnold M.E., A validated LC-MS/MS method for the simultaneous determination of BMS-791325, a hepatitis C virus NS5B RNA polymerase inhibitor, and its metabolite in plasma. J. Chromatogr. B., 2014, 973 1-810.1016/j.jchromb.2014.10.005Search in Google Scholar PubMed
[14] Nannetti G., Messa L., Celegato M., Pagni S., Basso M., Parisi S.G., Palù G., Loregian A.. Development and validation of a simple and robust HPLC method with UV detection for quantification of the hepatitis C virus inhibitor daclatasvir in human plasma. J Pharm Biomed Anal., 2017,134 275-281.10.1016/j.jpba.2016.11.032Search in Google Scholar PubMed
[15] Chakravarthy V. A..and Sailaja B.B.V., Method development and validation of assay and dissolution methods for the estimation of daclatasvir in tablet dosage forms by reverse phase HPLC HPLC. ejpmr, 2016, 7, 356-364.Search in Google Scholar
[16] Srinivasu G. · Kumar K. N.· Thirupathi Ch.· Lakshmi Narayana Ch., Parameswara Murthy Ch., Development and Validation of the Chiral HPLC Method for Daclatasvir in Gradient Elution Mode on Amylose-Based Immobilized Chiral Stationary Phase. Chromatographia, 2016,79, 1457–146710.1007/s10337-016-3157-2Search in Google Scholar
[17] Azab S.M. and Fekry A.M.. Electrochemical design of a new nanosensor based on cobalt nanoparticles, chitosan and MWCNT for the determination of daclatasvir: a hepatitis C antiviral drug RSC Adv., 2017, 7, 1118-1126.10.1039/C6RA25826CSearch in Google Scholar
[18] Bifano M., Hwang C., Oosterhuis B., Hartstra J., Grasela D., Tiessen R., Velinova-Donga M., Kandoussi H., Sevinsky H., Bertz R.. Assessment of pharmacokinetic interactions of the HCV NS5A replication complex inhibitor daclatasvir with antiretroviral agents: ritonavir-boosted atazanavir, efavirenz and tenofovir. Antivir Ther. 2013, 18 931-940.10.3851/IMP2674Search in Google Scholar
[19] Guidance for Industry, Bioanalytical Method Validation, U.S. Department of Health and Human Services, Food and Drug Administration, May 2001, available from: URL: http://www.fda.gov/downloads/Drugs/GuidanceComplianceRegulatoryInformation/Guidances/ucm070107.pdf (accessed March 05, 2017).Search in Google Scholar
[20] Selected Properties of Daclatasvir, http://www.hcvdruginfo.ca/downloads/HCV_daclatasvir.pdf (accessed August 05, 2017).Search in Google Scholar
[21] Polson C., Sarkar Incledon B., Raguvaran V., Grant R.. Optimization of protein precipitation P.based upon effectiveness of protein removal and ionization effect in liquid chromatography-tandem mass spectrometry. J Chromatogr B Analyt Technol Biomed Life Sci. 2003, 785,263-275.10.1016/S1570-0232(02)00914-5Search in Google Scholar
[22] ICH Harmonized Tripartite Guideline, Validation of Analytical Procedures: Text and Methodology, Q2(R1),Current Step 4 Version, Parent Guidelines on Methodology Dated November 6 1996, Incorporated in November 2005, http://www.ich.org/LOB/media/MEDIA417.pdf (accessed March 05, 2017).Search in Google Scholar
[23] Miller J. and Miller J., Statistics and chemometrics for analytical chemistry, Pearson Education, Harlow, UK, 5thedn, 2005.Search in Google Scholar
[24] Half-lives - Chemistry LibreTexts https://chem.libretexts.org/Core/Physical_and_Theoretical_Chemistry/Kinetics/Reaction_Rates/Half-lives_and_Pharmacokinetics (accessed August 05, 2017).Search in Google Scholar
© 2019 Ramadan Ali, Mohamed M Elsutohy, published by De Gruyter
This work is licensed under the Creative Commons Attribution 4.0 Public License.
Articles in the same Issue
- Regular Articles
- Research on correlation of compositions with oestrogenic activity of Cistanche based on LC/Q-TOF-MS/MS technology
- Efficacy of Pyrus elaeagnifolia subsp. elaeagnifolia in acetic acid–induced colitis model
- Anti-inflammatory and antinociceptive features of Bryonia alba L.: As a possible alternative in treating rheumatism
- High efficiency liposome fusion induced by reducing undesired membrane peptides interaction
- Prediction of the Blood-Brain Barrier Permeability Using RP-18 Thin Layer Chromatography
- Phytic Acid Extracted from Rice Bran as a Growth Promoter for Euglena gracilis
- Development of a validated spectrofluorimetric method for assay of sotalol hydrochloride in tablets and human plasma: application for stability-indicating studies
- Topological Indices of Hyaluronic Acid-Paclitaxel Conjugates’ Molecular Structure in Cancer Treatment
- Thermodynamic properties of the bubble growth process in a pool boiling of water-ethanol mixture two-component system
- Critical Roles of the PI3K-Akt-mTOR Signaling Pathway in Apoptosis and Autophagy of Astrocytes Induced by Methamphetamine
- Characteristics of Stable Hydrogen and Oxygen Isotopes of Soil Moisture under Different Land Use in Dry Hot Valley of Yuanmou
- Specific, highly sensitive and simple spectrofluorimetric method for quantification of daclatasvir in HCV human plasma patients and in tablets dosage form
- Chromium-modified cobalt molybdenum nitrides as catalysts for ammonia synthesis
- Langerhans cell-like dendritic cells treated with ginsenoside Rh2 regulate the differentiation of Th1 and Th2 cells in vivo
- Identification of Powdery Mildew Blumeria graminis f. sp. tritici Resistance Genes in Selected Wheat Varieties and Development of Multiplex PCR
- Computational Analysis of new Degree-based descriptors of oxide networks
- The Use Of Chemical Composition And Additives To Classify Petrol And Diesel Using Gas Chromatography–Mass Spectrometry And Chemometric Analysis: A Uk Study
- Minimal Energy Tree with 4 Branched Vertices
- Jatropha seed oil derived poly(esteramide-urethane)/ fumed silica nanocomposite coatings for corrosion protection
- Calculating topological indices of certain OTIS interconnection networks
- Energy storage analysis of R125 in UIO-66 and MOF-5 nanoparticles: A molecular simulation study
- Velvet Antler compounds targeting major cell signaling pathways in osteosarcoma - a new insight into mediating the process of invasion and metastasis in OS
- Effects of Azadirachta Indica Leaf Extract, Capping Agents, on the Synthesis of Pure And Cu Doped ZnO-Nanoparticles: A Green Approach and Microbial Activity
- Aqueous Micro-hydration of Na+(H2O)n=1-7 Clusters: DFT Study
- A proposed image-based detection of methamidophos pesticide using peroxyoxalate chemiluminescence system
- Phytochemical screening and estrogenic activity of total glycosides of Cistanche deserticola
- Biological evaluation of a series of benzothiazole derivatives as mosquitocidal agents
- Chemical pretreatments of Trapa bispinosa's peel (TBP) biosorbent to enhance adsorption capacity for Pb(ll)
- Dynamic Changes in MMP1 and TIMP1 in the Antifibrotic Process of Dahuang Zhechong Pill in Rats with Liver Fibrosis
- The Optimization and Production of Ginkgolide B Lipid Microemulsion
- Photodynamic Therapy Enhanced the Antitumor Effects of Berberine on HeLa Cells
- Chiral and Achiral Enantiomeric Separation of (±)-Alprenolol
- Correlation of Water Fluoride with Body Fluids, Dental Fluorosis and FT4, FT3 –TSH Disruption among Children in an Endemic Fluorosis area in Pakistan
- A one-step incubation ELISA kit for rapid determination of dibutyl phthalate in water, beverage and liquor
- Free Radical Scavenging Activity of Essential Oil of Eugenia caryophylata from Amboina Island and Derivatives of Eugenol
- Effects of Blue and Red Light On Growth And Nitrate Metabolism In Pakchoi
- miRNA-199a-5p functions as a tumor suppressor in prolactinomas
- Solar photodegradation of carbamazepine from aqueous solutions using a compound parabolic concentrator equipped with a sun tracking system
- Influence of sub-inhibitory concentration of selected plant essential oils on the physical and biochemical properties of Pseudomonas orientalis
- Preparation and spectroscopic studies of Fe(II), Ru(II), Pd(II) and Zn(II) complexes of Schiff base containing terephthalaldehyde and their transfer hydrogenation and Suzuki-Miyaura coupling reaction
- Complex formation in a liquid-liquid extraction-chromogenic system for vanadium(IV)
- Synthesis, characterization (IR, 1H, 13C & 31P NMR), fungicidal, herbicidal and molecular docking evaluation of steroid phosphorus compounds
- Analysis and Biological Evaluation of Arisaema Amuremse Maxim Essential Oil
- A preliminary assessment of potential ecological risk and soil contamination by heavy metals around a cement factory, western Saudi Arabia
- Anti- inflammatory effect of Prunus tomentosa Thunb total flavones in LPS-induced RAW264.7 cells
- Collaborative Influence of Elevated CO2 Concentration and High Temperature on Potato Biomass Accumulation and Characteristics
- Methods of extraction, physicochemical properties of alginates and their applications in biomedical field – a review
- Characteristics of liposomes derived from egg yolk
- Preparation of ternary ZnO/Ag/cellulose and its enhanced photocatalytic degradation property on phenol and benzene in VOCs
- Influence of Human Serum Albumin Glycation on the Binding Affinities for Natural Flavonoids
- Synthesis and antioxidant activity of 2-methylthio-pyrido[3,2-e][1,2,4] triazolo[1,5-a]pyrimidines
- Comparative study on the antioxidant activities of ten common flower teas from China
- Molecular Properties of Symmetrical Networks Using Topological Polynomials
- Synthesis of Co3O4 Nano Aggregates by Co-precipitation Method and its Catalytic and Fuel Additive Applications
- Phytochemical analysis, Antioxidant and Antiprotoscolices potential of ethanol extracts of selected plants species against Echinococcus granulosus: In-vitro study
- Silver nanoparticles enhanced fluorescence for sensitive determination of fluoroquinolones in water solutions
- Simultaneous Quantification of the New Psychoactive Substances 3-FMC, 3-FPM, 4-CEC, and 4-BMC in Human Blood using GC-MS
- Biodiesel Production by Lipids From Indonesian strain of Microalgae Chlorella vulgaris
- Miscibility studies of polystyrene/polyvinyl chloride blend in presence of organoclay
- Antibacterial Activities of Transition Metal complexes of Mesocyclic Amidine 1,4-diazacycloheptane (DACH)
- Novel 1,8-Naphthyridine Derivatives: Design, Synthesis and in vitro screening of their cytotoxic activity against MCF7 cell line
- Investigation of Stress Corrosion Cracking Behaviour of Mg-Al-Zn Alloys in Different pH Environments by SSRT Method
- Various Combinations of Flame Retardants for Poly (vinyl chloride)
- Phenolic compounds and biological activities of rye (Secale cereale L.) grains
- Oxidative degradation of gentamicin present in water by an electro-Fenton process and biodegradability improvement
- Optimizing Suitable Conditions for the Removal of Ammonium Nitrogen by a Microbe Isolated from Chicken Manure
- Anti-inflammatory, antipyretic, analgesic, and antioxidant activities of Haloxylon salicornicum aqueous fraction
- The anti-corrosion behaviour of Satureja montana L. extract on iron in NaCl solution
- Interleukin-4, hemopexin, and lipoprotein-associated phospholipase A2 are significantly increased in patients with unstable carotid plaque
- A comparative study of the crystal structures of 2-(4-(2-(4-(3-chlorophenyl)pipera -zinyl)ethyl) benzyl)isoindoline-1,3-dione by synchrotron radiation X-ray powder diffraction and single-crystal X-ray diffraction
- Conceptual DFT as a Novel Chemoinformatics Tool for Studying the Chemical Reactivity Properties of the Amatoxin Family of Fungal Peptides
- Occurrence of Aflatoxin M1 in Milk-based Mithae samples from Pakistan
- Kinetics of Iron Removal From Ti-Extraction Blast Furnace Slag by Chlorination Calcination
- Increasing the activity of DNAzyme based on the telomeric sequence: 2’-OMe-RNA and LNA modifications
- Exploring the optoelectronic properties of a chromene-appended pyrimidone derivative for photovoltaic applications
- Effect of He Qi San on DNA Methylation in Type 2 Diabetes Mellitus Patients with Phlegm-blood Stasis Syndrome
- Cyclodextrin potentiometric sensors based on selective recognition sites for procainamide: Comparative and theoretical study
- Greener synthesis of dimethyl carbonate from carbon dioxide and methanol using a tunable ionic liquid catalyst
- Nonisothermal Cold Crystallization Kinetics of Poly(lactic acid)/Bacterial Poly(hydroxyoctanoate) (PHO)/Talc
- Enhanced adsorption of sulfonamide antibiotics in water by modified biochar derived from bagasse
- Study on the Mechanism of Shugan Xiaozhi Fang on Cells with Non-alcoholic Fatty Liver Disease
- Comparative Effects of Salt and Alkali Stress on Antioxidant System in Cotton (Gossypium Hirsutum L.) Leaves
- Optimization of chromatographic systems for analysis of selected psychotropic drugs and their metabolites in serum and saliva by HPLC in order to monitor therapeutic drugs
- Electrocatalytic Properties of Ni-Doped BaFe12O19 for Oxygen Evolution in Alkaline Solution
- Study on the removal of high contents of ammonium from piggery wastewater by clinoptilolite and the corresponding mechanisms
- Phytochemistry and toxicological assessment of Bryonia dioica roots used in north-African alternative medicine
- The essential oil composition of selected Hemerocallis cultivars and their biological activity
- Mechanical Properties of Carbon Fiber Reinforced Nanocrystalline Nickel Composite Electroforming Deposit
- Anti-c-myc efficacy block EGFL7 induced prolactinoma tumorigenesis
- Topical Issue on Applications of Mathematics in Chemistry
- Zagreb Connection Number Index of Nanotubes and Regular Hexagonal Lattice
- The Sanskruti index of trees and unicyclic graphs
-
Valency-based molecular descriptors of Bakelite network
- Computing Topological Indices for Para-Line Graphs of Anthracene
- Zagreb Polynomials and redefined Zagreb indices of Dendrimers and Polyomino Chains
- Topological Descriptor of 2-Dimensional Silicon Carbons and Their Applications
- Topological invariants for the line graphs of some classes of graphs
- Words for maximal Subgroups of Fi24‘
- Generators of Maximal Subgroups of Harada-Norton and some Linear Groups
- Special Issue on POKOCHA 2018
- Influence of Production Parameters on the Content of Polyphenolic Compounds in Extruded Porridge Enriched with Chokeberry Fruit (Aronia melanocarpa (Michx.) Elliott)
- Effects of Supercritical Carbon Dioxide Extraction (SC-CO2) on the content of tiliroside in the extracts from Tilia L. flowers
- Impact of xanthan gum addition on phenolic acids composition and selected properties of new gluten-free maize-field bean pasta
- Impact of storage temperature and time on Moldavian dragonhead oil – spectroscopic and chemometric analysis
- The effect of selected substances on the stability of standard solutions in voltammetric analysis of ascorbic acid in fruit juices
- Determination of the content of Pb, Cd, Cu, Zn in dairy products from various regions of Poland
- Special Issue on IC3PE 2018 Conference
- The Photocatalytic Activity of Zns-TiO2 on a Carbon Fiber Prepared by Chemical Bath Deposition
- N-octyl chitosan derivatives as amphiphilic carrier agents for herbicide formulations
- Kinetics and Mechanistic Study of Hydrolysis of Adenosine Monophosphate Disodium Salt (AMPNa2) in Acidic and Alkaline Media
- Antimalarial Activity of Andrographis Paniculata Ness‘s N-hexane Extract and Its Major Compounds
- Special Issue on ABB2018 Conference
- Special Issue on ICCESEN 2017
- Theoretical Diagnostics of Second and Third-order Hyperpolarizabilities of Several Acid Derivatives
- Determination of Gamma Rays Efficiency Against Rhizoctonia solani in Potatoes
- Studies On Compatibilization Of Recycled Polyethylene/Thermoplastic Starch Blends By Using Different Compatibilizer
- Liquid−Liquid Extraction of Linalool from Methyl Eugenol with 1-Ethyl-3-methylimidazolium Hydrogen Sulfate [EMIM][HSO4] Ionic Liquid
- Synthesis of Graphene Oxide Through Ultrasonic Assisted Electrochemical Exfoliation
- Special Issue on ISCMP 2018
- Synthesis and antiproliferative evaluation of some 1,4-naphthoquinone derivatives against human cervical cancer cells
- The influence of the grafted aryl groups on the solvation properties of the graphyne and graphdiyne - a MD study
- Electrochemical modification of platinum and glassy carbon surfaces with pyridine layers and their use as complexing agents for copper (II) ions
- Effect of Electrospinning Process on Total Antioxidant Activity of Electrospun Nanofibers Containing Grape Seed Extract
- Effect Of Thermal Treatment Of Trepel At Temperature Range 800-1200˚C
- Topical Issue on Agriculture
- The effect of Cladophora glomerata exudates on the amino acid composition of Cladophora fracta and Rhizoclonium sp.
- Influence of the Static Magnetic Field and Algal Extract on the Germination of Soybean Seeds
- The use of UV-induced fluorescence for the assessment of homogeneity of granular mixtures
- The use of microorganisms as bio-fertilizers in the cultivation of white lupine
- Lyophilized apples on flax oil and ethyl esters of flax oil - stability and antioxidant evaluation
- Production of phosphorus biofertilizer based on the renewable materials in large laboratory scale
- Human health risk assessment of potential toxic elements in paddy soil and rice (Oryza sativa) from Ugbawka fields, Enugu, Nigeria
- Recovery of phosphates(V) from wastewaters of different chemical composition
- Special Issue on the 4th Green Chemistry 2018
- Dead zone for hydrogenation of propylene reaction carried out on commercial catalyst pellets
- Improved thermally stable oligoetherols from 6-aminouracil, ethylene carbonate and boric acid
- The role of a chemical loop in removal of hazardous contaminants from coke oven wastewater during its treatment
- Combating paraben pollution in surface waters with a variety of photocatalyzed systems: Looking for the most efficient technology
- Special Issue on Chemistry Today for Tomorrow 2019
- Applying Discriminant and Cluster Analyses to Separate Allergenic from Non-allergenic Proteins
- Chemometric Expertise Of Clinical Monitoring Data Of Prolactinoma Patients
- Chemomertic Risk Assessment of Soil Pollution
- New composite sorbent for speciation analysis of soluble chromium in textiles
- Photocatalytic activity of NiFe2O4 and Zn0.5Ni0.5Fe2O4 modified by Eu(III) and Tb(III) for decomposition of Malachite Green
- Photophysical and antibacterial activity of light-activated quaternary eosin Y
- Spectral properties and biological activity of La(III) and Nd(III) Monensinates
- Special Issue on Monitoring, Risk Assessment and Sustainable Management for the Exposure to Environmental Toxins
- Soil organic carbon mineralization in relation to microbial dynamics in subtropical red soils dominated by differently sized aggregates
- A potential reusable fluorescent aptasensor based on magnetic nanoparticles for ochratoxin A analysis
- Special Issue on 13th JCC 2018
- Fluorescence study of 5-nitroisatin Schiff base immobilized on SBA-15 for sensing Fe3+
- Thermal and Morphology Properties of Cellulose Nanofiber from TEMPO-oxidized Lower part of Empty Fruit Bunches (LEFB)
- Encapsulation of Vitamin C in Sesame Liposomes: Computational and Experimental Studies
- A comparative study of the utilization of synthetic foaming agent and aluminum powder as pore-forming agents in lightweight geopolymer synthesis
- Synthesis of high surface area mesoporous silica SBA-15 by adjusting hydrothermal treatment time and the amount of polyvinyl alcohol
- Review of large-pore mesostructured cellular foam (MCF) silica and its applications
- Ion Exchange of Benzoate in Ni-Al-Benzoate Layered Double Hydroxide by Amoxicillin
- Synthesis And Characterization Of CoMo/Mordenite Catalyst For Hydrotreatment Of Lignin Compound Models
- Production of Biodiesel from Nyamplung (Calophyllum inophyllum L.) using Microwave with CaO Catalyst from Eggshell Waste: Optimization of Transesterification Process Parameters
- The Study of the Optical Properties of C60 Fullerene in Different Organic Solvents
- Composite Material Consisting of HKUST-1 and Indonesian Activated Natural Zeolite and its Application in CO2 Capture
- Topical Issue on Environmental Chemistry
- Ionic liquids modified cobalt/ZSM-5 as a highly efficient catalyst for enhancing the selectivity towards KA oil in the aerobic oxidation of cyclohexane
- Application of Thermal Resistant Gemini Surfactants in Highly Thixotropic Water-in-oil Drilling Fluid System
- Screening Study on Rheological Behavior and Phase Transition Point of Polymer-containing Fluids produced under the Oil Freezing Point Temperature
- The Chemical Softening Effect and Mechanism of Low Rank Coal Soaked in Alkaline Solution
- The Influence Of NO/O2 On The NOx Storage Properties Over A Pt-Ba-Ce/γ-Al2O3 Catalyst
- Special Issue on the International conference CosCI 2018
- Design of SiO2/TiO2 that Synergistically Increases The Hydrophobicity of Methyltrimethoxysilane Coated Glass
- Antidiabetes and Antioxidant agents from Clausena excavata root as medicinal plant of Myanmar
- Development of a Gold Immunochromatographic Assay Method Using Candida Biofilm Antigen as a Bioreceptor for Candidiasis in Rats
- Special Issue on Applied Biochemistry and Biotechnology 2019
- Adsorption of copper ions on Magnolia officinalis residues after solid-phase fermentation with Phanerochaete chrysosporium
- Erratum
- Erratum to: Sand Dune Characterization For Preparing Metallurgical Grade Silicon