Microwave drying of nickel-containing residue: dielectric properties, kinetics, and energy aspects
-
Zhanyong Guo
 ,
Fachuang Li
,
Fachuang Li

Abstract
Nickel-containing residue (NCR) is a hazardous solid waste from battery production lines. Recently, the interest in recovering valuable metals from NCR has increased because sustainable utilization of resources is more and more valued. Drying is a key part of the recovery process. In this study, we measured the dielectric properties of the NCR for different moisture contents and temperatures using the cavity perturbation method at 2.45 GHz. The microwave absorption characteristics of NCR had a positive correlation with the moisture content, while it was less efficient in the 20-180°C temperature range. Then found that the microwave drying data at different microwave powers (400-700 W) and for different sample weights (60-120 g) have a better fit with the Midilli-Kucuk model. The activation energy (Ea) was received as 9.76 W/g using an exponential expression based on the Arrhenius equation. Finally, the energy consumption reduce 110 W·h/kg than that of drying with a single microwave power by optimizing the microwave drying process.
1 Introduction
In the battery production process, some components like the battery case and chip must be nickel plated [1,2]. Therefore, a large number of electroplating wastewater is produced and is usually treated by chemical precipitation to meet the discharge standards [3,4]. This then creates nickel-containing residue, a cheap secondary resource [5,6].
If not handled properly, secondary pollution will occur and have a negative impact on the environment and on human health. Currently, common treatment methods include separation and recovery of the heavy metals [7,8], solidification treatment [9,10], and high-temperature incineration [11]. However, because of the high water content and the stickiness, it becomes crucial to efficiently yet economically dry the NCR before recycling, solidification, or incineration.
Compared to the conventional low-efficiency, time-consuming, and energy-consuming drying technologies [12], such as fluidized bed drying [13], rotary kiln drying [14] as well as other conventional drying methods [15,16], the efficiency of microwave drying is more than twice that of conventional drying methods [17,18]. The water molecules in the material make most of the sample have an excellent absorbency for the electromagnetic wave. During microwave heating, heat and water vapor travel in the same direction which causes a high drying efficiency [19, 20, 21, 22].
As a sticky material the NCR tends to absorb and retain a large amount of water, which makes a great obstacle for the press filtration process, and there is still a high moisture content in the material after dehydration. Furthermore, in the conventional drying process, the viscosity of the material maintains a high internal cohesion, thus delaying the evaporation of water molecules. From our earlier results drying a CuCl residue, need more than 90 min to reduce the moisture content of the residue from 36% to about 4% [23]. By contrast, under a microwave power of 550 W, the same effect can be achieved in just about 10 min [24].
In this study, the dielectric properties is measured by cavity perturbation method, microwave drying kinetics is collected using eight thin layer drying models, and energy consumption during microwave drying process is optimized using response surface methodology (RSM).
2 Materials and methods
2.1 Raw materials
The nickel-containing residue (NCR) was supplied by a battery manufacturer in Henan Province, China. The received samples contained 45.8% water and were very sticky.
After drying, the sample was analyzed chemically and by X-ray powder diffraction (XRD). The results of the chemical composition and the XRD pattern are shown in Table 1 and Figure 1.
Chemical composition of the NCR residue.
| Composition | O | Ca | Mg | C | Ni | Fe | Si | Cd |
|---|---|---|---|---|---|---|---|---|
| Content (%) | 53.42 | 14.09 | 8.67 | 8.30 | 8.02 | 4.64 | 1.57 | 0.71 |
As shown in Table 1, there is a variety of metallic elements in the NCR and nickel content is found to be above 8%. It is practically important to effectively separate the impurities and recovery of nickel.
From Figure 1, the material composition is relatively complex, with a main phase of CaCO3. Mg mainly exists in the MgSiO3 form while Ni mainly exists in the NiO form. Low amounts of NiCO3 and Ni(OH)2·2(H2O) are also present whereas Fe mainly exists in the FeSiO3 form.
2.2 Experimental devices
2.2.1 Permittivity measurement system
A permittivity measurement system based on microwave cavity perturbation method was used to measure the dielectric parameters of the NCR. The testing equipment has been widely used for the measurement of dielectric properties of materials [25, 26, 27]. A schematic of the system is shown in Figure 2.
The device consists of a vector network analyser, a waveguide–coax transition, a directional coupler, an electromagnetic induction heater, a water re-circulator, a gas lift, and a cavity resonator. The test control unit is connected to a computer via a USB data cable and software calculates the dielectric parameters. The system accuracy has been demonstrated in our preliminary work which was estimated to be 3% in the dielectric constant and 10% in the loss factor during the tests [27].
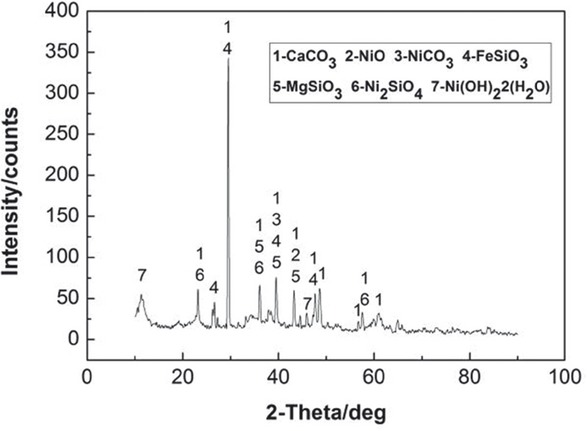
XRD pattern of the raw material.
During the experiments, the test sample was placed into the heater of the permittivity measurement system with a small quartz tube. When the NCR was heated to a pre-set temperature and subsequently lifted into the cavity resonator via the gas lift, the computer rapidly calculated the dielectric parameters using the test-cavity perturbation theory. After the test, the quartz tube was lowered into the heater and heated to a higher pre-set temperature to measure the permittivity at different temperatures.
2.2.2 Microwave oven for the drying experiments
A microwave reactor with a power of 3 kW and a frequency of 2.450 GHz was used for the drying experiments. Its schematic is presented in Figure 3. The microwave drying system consists of a weightlessness measurement system, a temperature control unit with a thermo-element, two magnetrons, a multimode cavity, a quartz glass container, and a date acquisition computer. A thermocouple pyrometer was inserted into the centre of the sample to measure the heating temperature.
During the microwave drying experiments, a certain amount (120 g, 100 g, 80 g, or 60 g) of sample with a moisture content of 45.8% (d.b.) and shaped into a 10 mm thin layer was loaded into a quartz glass container, placed inside the microwave oven, and heated at a given microwave power (700 W, 600 W, 500 W, or 400 W).
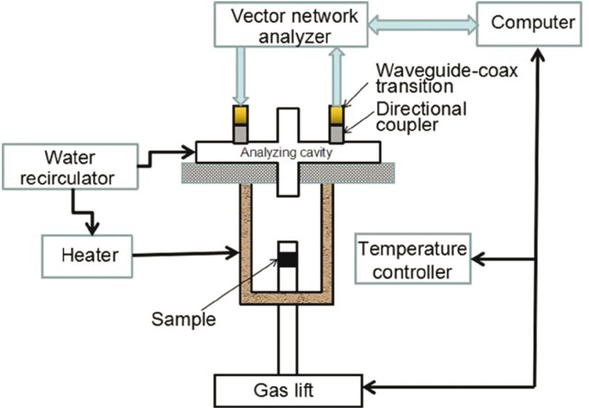
Schematics of the permittivity measurement system.
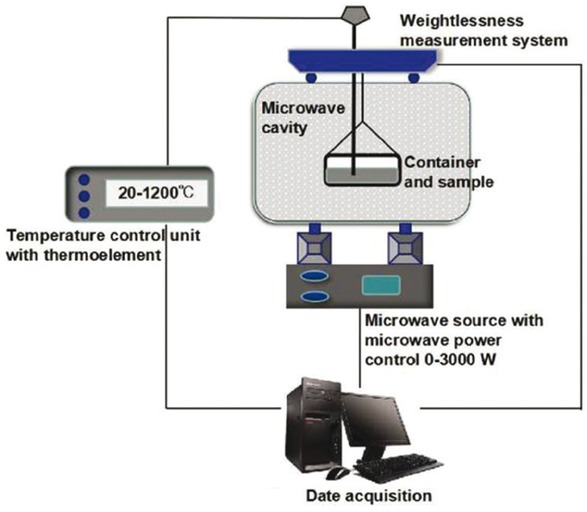
Schematics of microwave drying system.
2.3 Data analysis and mathematical modeling
The microwave drying date was calculated using the following equations:
where Mt is the moisture content at a specific time t, kg/kg (d.b.), mt is the mass at a specific time t and mg is the mass after completely drying.
where MR is the moisture ratio, M0 is the initial moisture content, kg/kg (d.b.) and Me is the equilibrium moisture content, kg/kg (d.b.). The equilibrium moisture content for this material is assumed to be zero and:
where vd is the drying rate, Mt and Mt+dt are the moisture contents at t and t+dt time, respectively, kg/kg d.b.
The loss tangent (tanδ) describes how well the material dissipates stored energy into heat at a given frequency and temperature. The loss tangent (tanδ) can be expressed as:
where ε′ is the dielectric constant, which reflects the ability of the material to store electromagnetic energy within its structure, ε″ is the dielectric loss factor that characterizes the ability of the material to convert the stored electromagnetic energy into thermal energy.
The penetration depth (Dp) is defined as the depth at which the power of an applied microwave field is reduced to 1/e of its surface value and is expressed with the following equation:
where λ0 is the wavelength (λ0 = 12.24 cm at 2.45 GHz) and π is a constant.
The material drying is a complex heat and mass transfer process. The choice of drying model is an important part of the research work to predict the process parameters. The basic equations commonly used to describe a thin layer drying process are shown in Table 2 [28, 29, 30].
Mathematical thin-layer drying models used for the approximation.
| Models | Equations |
|---|---|
| Newton | MR = exp(-kt) |
| Henderson and Pabis | MR = aexp(-kt) |
| Page | MR = exp(-ktn ) |
| Modified Page | MR = exp(-ktn) |
| Midilli-Kucuk | MR = aexp(-ktn)+bt |
| Logarithmic | MR = aexp(-kt) +c |
| Diffusion approach | MR = aexp(-kt) +(1-a) exp(-kbt) |
| Wang and Singh | MR = 1+at+bt2 |
3 Results and discussion
3.1 Dielectric properties of the NCR
The dielectric constant (ε’) and loss factor (ε’’) of NCR were measured at various of temperature (20-180°C) for different of moisture contents and the results are shown in Figure 4a The dielectric loss angle tangent (tan δ) was calculated according to: tan δ = ε’’/ε’ and is shown in Figure 4b From Figures 4a and 4b both ε’ and ε’’ increased remarkably from 2.7541 to 14.5374 and 0.0374 to 2.991, respectively, when the moisture content increased to 14%. In the meantime, tan δ gradually increased from 0.0141 to 0.2057. The increase of ε’ and ε’’ with the moisture content also occurs in certain waste residues. For example, the moisture content of CuCl residue is 10-15% and its dielectric constant at room temperature is higher than 14 [24]. In general, with the increase of moisture content the absorbency of materials has been significantly improved, which means that the microwave drying efficiency will be higher.
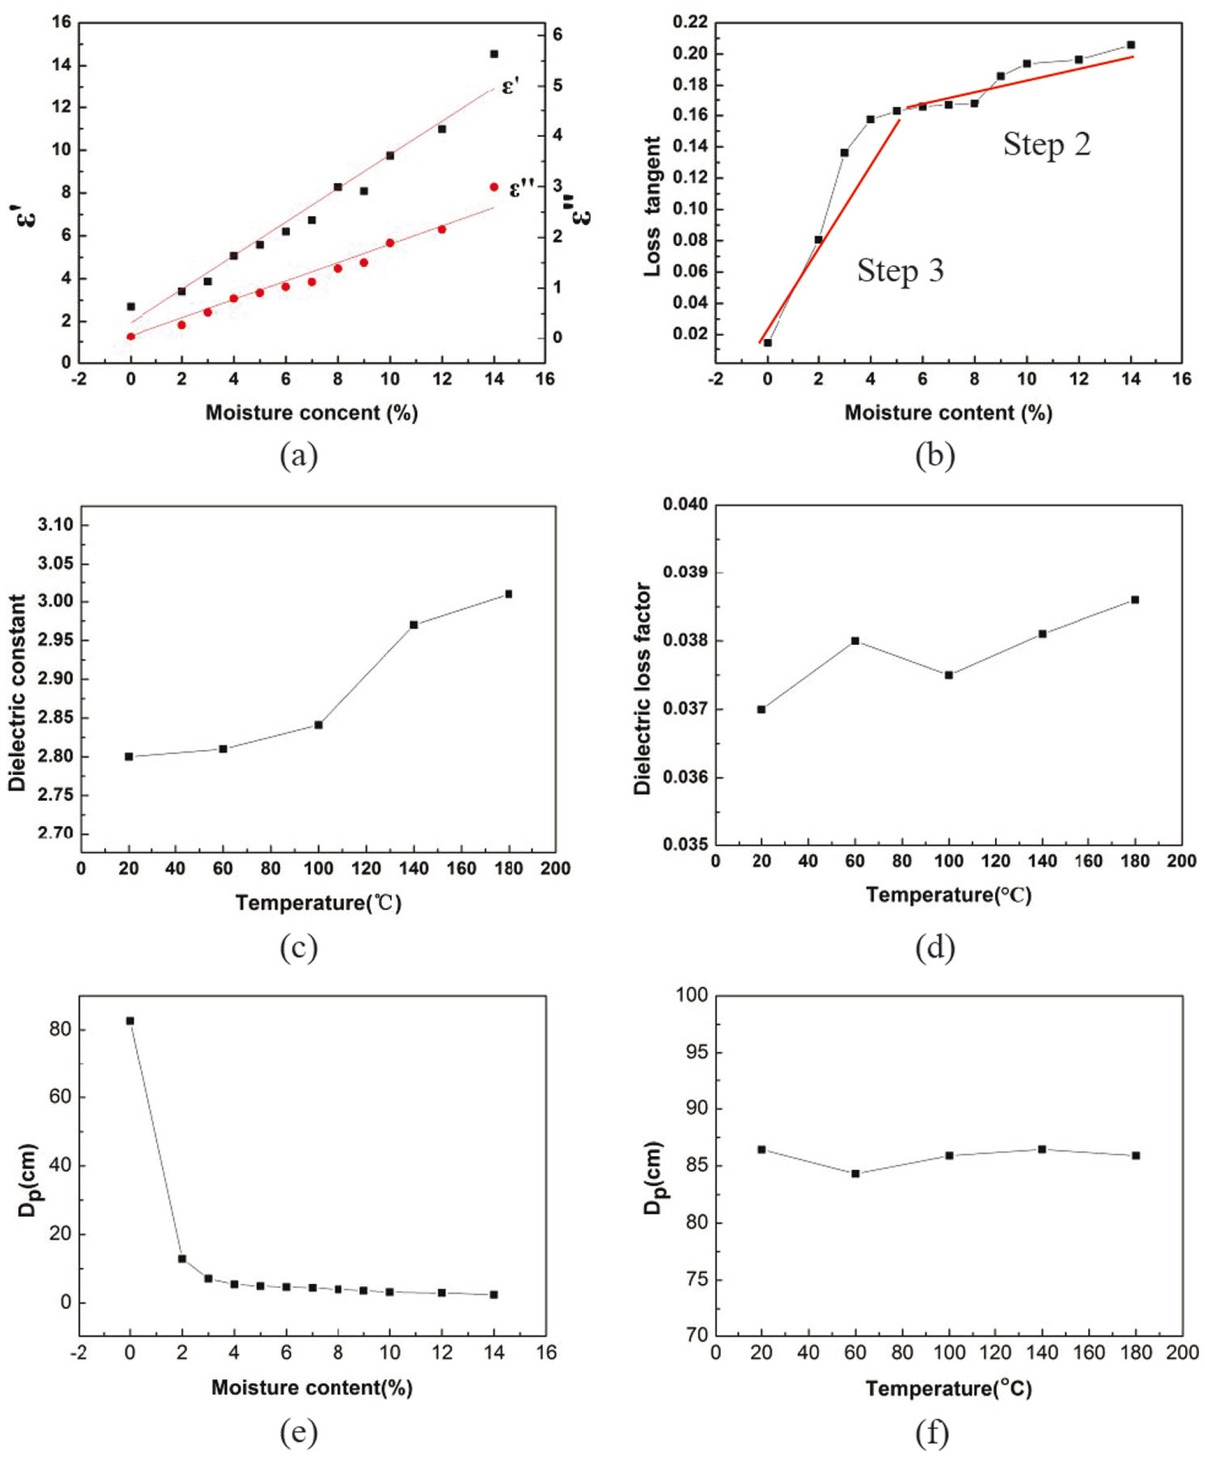
Dielectric properties of the NCR for different moisture content and temperature. (a) Dielectric constant (ε’) and loss factor (ε’’) for different moisture content. (b) Dielectric loss angle tangent (tanδ) for different moisture content. (c,d) Dielectric constant (ε’) and loss factor (ε’’) for the dried sample at different temperature. (e,f) Penetration depth (Dp) for different moisture content and temperature.
As shown in Figures 4c and 4d the ε’ and ε’’ of the dried sample do not change much with the increasing temperature in the 20-180°C range. This phenomenon also occurs in certain metallurgical residues, such as spent adsorbent with zinc sulfate [25] and molybdenite concentrate [26]. By comparison with the dielectric constant of water at room temperature of 78 and a loss factor of 16.2, Figures 4a, 4c and 4d show that the dielectric properties of the material is strongly associated with the moisture content. Therefore, the microwave energy is mainly absorbed by the water molecules that evaporate during the drying process and the material consumes less energy. Therefore, the efficiency of the microwave heating for water evaporation is higher.
The values of penetration depth (Dp) for different moisture content and temperature were calculated using Eq. 5 and shown in Figures 4e and 4f The moisture content has obvious effect on the Dp, within the measurement range, the Dp decreases rapidly from 82.6 cm to 2.4 cm with the increase of moisture content, while temperature has little effect on the Dp, and the values are above 84 cm. In this drying experiment the sample was shaped into a 10 mm thin layer, the penetration depth of microwave has little influence on the drying process, but in the follow-up industrialization experiment must pay attention to the sample thickness.
3.2 Energy balance analysis in a micro-section of the NCR
The heat balance of the drying process mainly considers energy introduction and dissipation. The thermal and mass equilibrium between the water, the gas, and the matrix were proposed by Suwannapum [31] and Prat [32]. In consideration of their study, we performed an energy balance analysis on the microsection of porous NCR, as shown in Figure 5. The thermal equilibrium analysis was performed with the thin-layer micro-section of ∂x∂z.
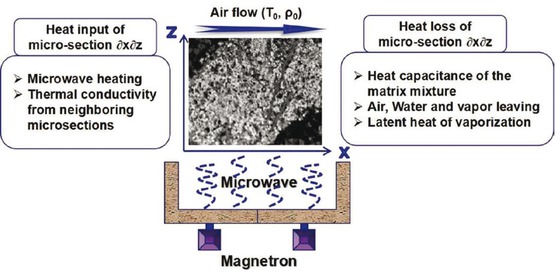
Energy balance analysis in a micro-section of NCR.
The heat input of the system consists of two parts. The first one is the heat transfer in other micro-sections of the system. The second one is the conversion of the microwave energy into internal energy during the heating process. They can be expressed by the following formula:
where Q is the heat generated by the absorption of the microwaves, f is the frequency of the microwave (Hz), Ey is the electric field intensity in the y direction (V/m), ε0 is permittivity of free space: 8.854 (pF/m), q is the heat transfer in the other micro-sections, λeff is the effective thermal conductivity (W/m·K), and T is the temperature (K).
The heat loss includes the following three parts:
Heating of the material mixture
where (ρCp)T is the effective heat capacitance of the water-gas matrix mixture:
where t is the time (s), ρ is density and Cp is specific heat capacity. ρl, ρa, ρp are the density of liquid water, air and residue particle, respectively (kg/m3). Cpl, Cpa, Cpp are the specific heat capacity of liquid water, air and residue particle, respectively (J/kg·K). φ is the porosity and s is the water saturation.
2. Heat loss caused by air, water, and vapor escape
where ρv is the density of water vapor (kg/m3), Cpv is the specific heat capacity of water vapor (J/kg·K). ul and ug are the velocity of liquid water and the gas phase in the x direction (m/s), respectively. wl and wg are the velocity of liquid water and the gas phase in the z direction (m/s), respectively.
3. Latent heat of vaporization
where Hv is the latent heat of evaporation (J/kg) and ṁ is the phase change term (kg/m3·s) expressed as [24]:
where, Dm is the effective molecular mass diffusion (m2/s), K is the permeability (m2), Krg is the relative gas permeability (m2), μg is the gas dynamic viscosity (Pa·s), and gz is the gas of direction z.
Therefore, the total heat balance of the micro-section can be described as:
3.3 Microwave drying kinetics of the NCR
Figures 6a and 6c show that the moisture content of NCR significantly decreases with the decrease of sample mass and the increase of microwave power. A similar rule was mentioned by several researchers for different materials dried using microwave energy [33,34]. According to various microwave power and material mass, it will take 14 to 28 min to remove the water of the NCR from 45.8% to 0.3% kg/kg (d.b.). Figures 6b and 6d illustrate the significant impact of the microwave power and material mass on the drying rate. At a power of 400 W and 500 W or a mass of 100 g and 120 g, the drying rate is close unlike at other conditions. After a short period of heating, the values of drying rate of the process changed from rapid increase to a constant. The constant rate stage occurred form nearly 3.8% to about 4.3% kg/kg (d.b.) per min and was followed by a stage of decreasing drying rate period where the internal diffusion of water molecules becomes the limiting link in drying [35].
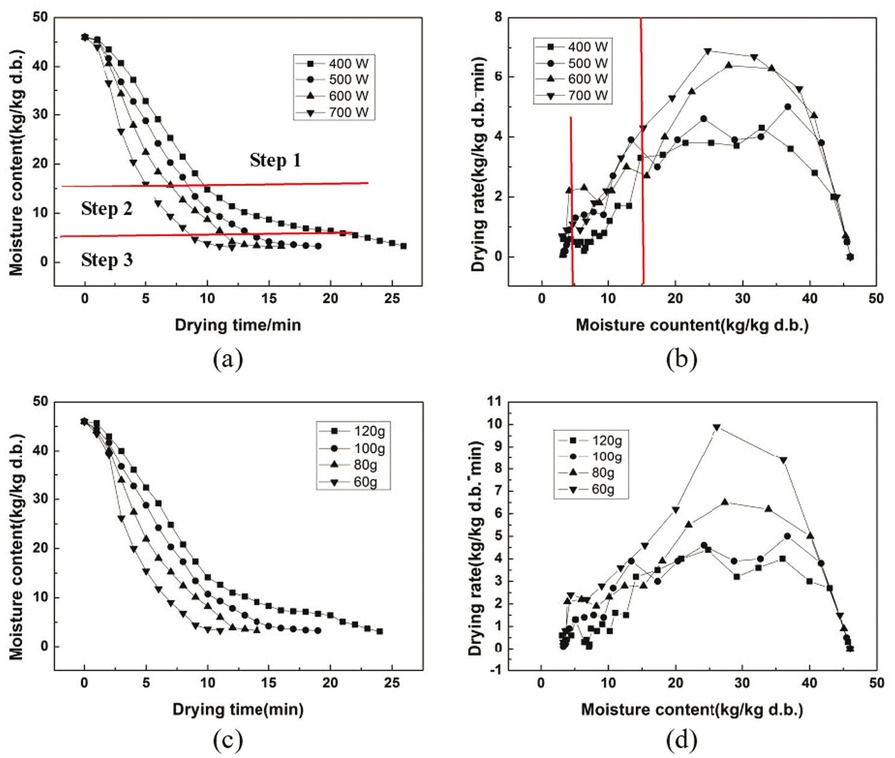
Microwave drying curves of NCR. (a) Drying curves of 100 g sample at different microwave powers, (b) drying rate curves of 100 g sample at different microwave powers, (c) drying curves with a different sample mass at 500 W and (d) drying rate curves with a different sample mass at 500 W.
The moisture content of NCR reduced from 15% to 0.3% kg/kg (d.b.) at power of 600 W and 700 W or mass of 60 g and 80 g in the decreasing stage. The reason is that a higher temperature of the NCR will be received at higher power densities, leading to quick drying. These results were in agreement with the study on parsley leaf drying by Soysal et al. [36].
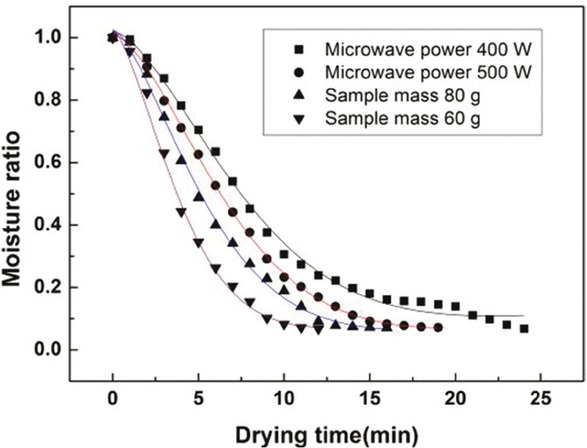
As shown in Table 3 and Figure 7, eight thin-layer drying models as mentioned above were used to analyze the drying kinetics. After date fitting, it is found that Midilli-Kucuk model is the most suitable for experimental data with a determination coefficient (R2) of over 0.9958 and a sum of squared residuals (SSR) lower than 0.0095. The value of the drying constant k increases with the increase of power density (microwave power/material mass). This implies that the drying curve becomes steeper with increasing microwave power. The a, n, and b parameters of the Midilli-Kucuk model were almost the same for all drying conditions. This means that the parameters a, n and b can be assumed constant and equal to 1.0188, 1.5363, and 0.0038, respectively.
Comparison of the experimental date with the predicted Midilli-Kucuk equation.
Statistical analysis of each model at various microwave powers.
| Model | Power (W) | R2 | SSR | Mass (g) | R2 | SSR |
|---|---|---|---|---|---|---|
| Newton | 400 | 0.9618 | 0.0918 | 120 | 0.9622 | 0.0972 |
| 500 | 0.9573 | 0.0891 | 100 | 0.9573 | 0.0891 | |
| 600 | 0.9609 | 0.0697 | 80 | 0.9583 | 0.0647 | |
| 700 | 0.9683 | 0.0480 | 60 | 0.9600 | 0.0517 | |
| Henderson and Pabis | 400 | 0.9786 | 0.0493 | 120 | 0.9785 | 0.0533 |
| 500 | 0.9756 | 0.0481 | 100 | 0.9756 | 0.0481 | |
| 600 | 0.9773 | 0.0379 | 80 | 0.9750 | 0.0360 | |
| 700 | 0.9801 | 0.0279 | 60 | 0.9726 | 0.0322 | |
| Page | 400 | 0.9851 | 0.0338 | 120 | 0.9825 | 0.0433 |
| 500 | 0.9964 | 0.0071 | 100 | 0.9964 | 0.0071 | |
| 600 | 0.9941 | 0.0098 | 80 | 0.9954 | 0.0068 | |
| 700 | 0.9926 | 0.0093 | 60 | 0.9916 | 0.0099 | |
| Modified Page | 400 | 0.9601 | 0.0918 | 120 | 0.9607 | 0.0972 |
| 500 | 0.9549 | 0.0891 | 100 | 0.9549 | 0.0891 | |
| 600 | 0.9584 | 0.0697 | 80 | 0.9551 | 0.0647 | |
| 700 | 0.9658 | 0.0480 | 60 | 0.9560 | 0.0517 | |
| Logarithmic | 400 | 0.9788 | 0.0468 | 120 | 0.9778 | 0.0528 |
| 500 | 0.9838 | 0.0303 | 100 | 0.9838 | 0.0303 | |
| 600 | 0.9835 | 0.0257 | 80 | 0.9857 | 0.0190 | |
| 700 | 0.9828 | 0.0223 | 60 | 0.9786 | 0.0226 | |
| Diffusion approach | 400 | 0.9671 | 0.0725 | 120 | 0.9649 | 0.0834 |
| 500 | 0.9747 | 0.0471 | 100 | 0.9747 | 0.0471 | |
| 600 | 0.9747 | 0.0396 | 80 | 0.9778 | 0.0296 | |
| 700 | 0.9756 | 0.0317 | 60 | 0.9706 | 0.0310 | |
| Wang and Singh | 400 | 0.9768 | 0.0535 | 120 | 0.9762 | 0.0589 |
| 500 | 0.9836 | 0.0323 | 100 | 0.9836 | 0.0323 | |
| 600 | 0.9834 | 0.0278 | 80 | 0.9833 | 0.0241 | |
| 700 | 0.9845 | 0.0218 | 60 | 0.9795 | 0.0241 | |
| Midilli-Kucuk | 400 W | a=1.0213;k=0.0318;n=1.5706;b=0.0042 | 0.9958 | 0.0095 | ||
| 500 W | a=1.0097;k=0.0411;n=1.5915;b=0.0029 | 0.9993 | 0.0011 | |||
| 600 W | a=1.0252;k=0.0660;n=1.4864;b=0.0031 | 0.9968 | 0.0046 | |||
| 700 W | a=1.0162;k=0.0803;n=1.5057;b=0.0053 | 0.9959 | 0.0023 | |||
| 120 g | a=1.0185;k=0.0332;n=1.5679;b=0.0043 | 0.9953 | 0.0098 | |||
| 100 g | a=1.0097;k=0.0411;n=1.5915;b=0.0029 | 0.9993 | 0.0011 | |||
| 80 g | a=1.0241;k=0.0693;n=1.4706;b=0.0027 | 0.9967 | 0.0040 | |||
| 60 g | a=1.0261;k=0.1067;n=1.5070;b=0.0054 | 0.9961 | 0.0051 | |||
3.4 Estimation of the activation energy
An exponential expression based on the Arrhenius equation was used to calculate the activation energy for the drying process
where k and k0 is corresponding to the drying rate constant and pre-exponential factor (min-1). Ea is the activation energy (W·g-1). m and P are corresponding to microwave power (W) and sample mass (g), respectively. The linear fitting according to Eq. 12 between ln(k) and m/P is shown in Figure 8 with SSR and R2 values of 0.0239 and 0.9794, respectively. Afterwards, k0 and Ea were determined at 0.3321 min-1 and 9.7604 W·g-1, respectively. k can be calculated using these estimated values for the desired power and mass. By this, the moisture ratio of NCR can be estimated at any given time during microwave drying or vice and versa using the values of k calculated with the Midilli-Kucuk model and the constant values of the a, n, and b discussed earlier.
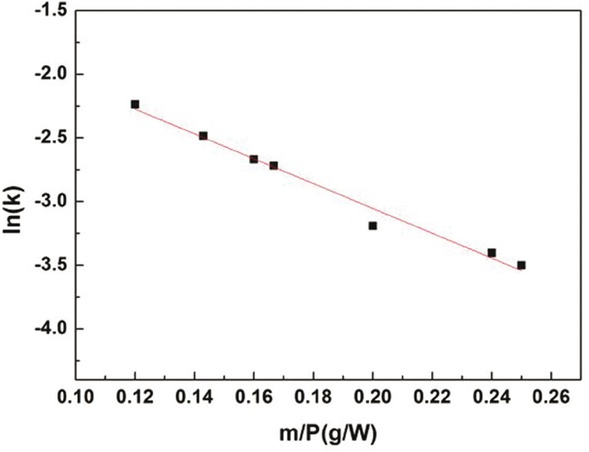
Evolution of the ln(k) with the mass/power ratio (m/P).
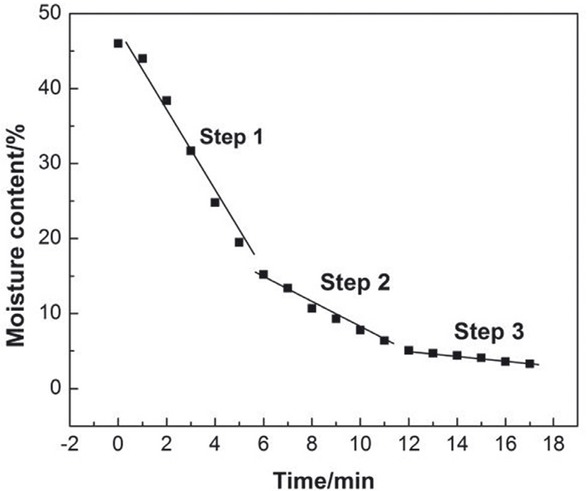
Microwave drying stage division.
| Step (moisture content) | Dielectric properties as Figure 4 | Drying stage as Figure 6 |
|---|---|---|
| 1. Above 15% | Strongly associated with the moisture content | Accelerating drying stage + Constant drying stage |
| 2. 6-15% | Strongly associated with the moisture content | Decelerating drying stage |
| 3. Below 6% | Relatively weak absorption capacity | Difficult drying stage |
3.5 Energy consumption statistics and optimization
According to the dielectric properties of NCR and dynamic simulation, the microwave drying processes of NCR can be divided into three stages, which is shown in Table 4.
Experimental design matrix and result.
| Run | Step1 (W) | Step1 (W) | Step1 (W) | Step1 (W·h) |
|---|---|---|---|---|
| 1 | 400 | 700 | 550 | 181.6 |
| 2 | 700 | 400 | 550 | 193.3 |
| 3 | 550 | 550 | 550 | 176.3 |
| 4 | 550 | 700 | 400 | 172.2 |
| 5 | 550 | 400 | 400 | 187.5 |
| 6 | 400 | 550 | 400 | 151.6 |
| 7 | 400 | 550 | 700 | 153.3 |
| 8 | 700 | 550 | 700 | 150.2 |
| 9 | 400 | 400 | 550 | 196.6 |
| 10 | 550 | 550 | 550 | 176.7 |
| 11 | 550 | 550 | 550 | 177.1 |
| 12 | 550 | 550 | 550 | 175.8 |
| 13 | 550 | 400 | 700 | 189.6 |
| 14 | 550 | 550 | 550 | 174.1 |
| 15 | 700 | 550 | 400 | 157.9 |
| 16 | 700 | 700 | 550 | 178.6 |
| 17 | 550 | 700 | 700 | 175.6 |
During the optimization experiment, 100 g material is dried in 10 mm thin layer, and finally dried to 3.3%. The response surface methodology (RSM) is used to optimize the microwave power input in three stages for the drying processing of NCR with low energy consumption. The energy consumption (γ) is chosen as the dependent variable, while microwave input power at each stage (χ1, χ2, χ3) is chosen as three independent variables and the exact experimental conditions are shown in Table 5.
Variance (ANOVA) analysis for quadratic model.
| Source | Coefficient | Standard error | Sum of squares | df | Mean square | F-value | p-value Prob > F |
|---|---|---|---|---|---|---|---|
| Model | 176.00 | 0.98 | 3135.77 | 9 | 348.42 | 73.30 | < 0.0001 |
| χ1 | -0.39 | 0.77 | 1.20 | 1 | 1.20 | 0.25 | 0.6306 |
| χ2 | -7.38 | 0.77 | 435.13 | 1 | 435.13 | 91.54 | < 0.0001 |
| χ3 | -0.063 | 0.77 | 0.031 | 1 | 0.031 | 0.00657 | 0.9376 |
| χ1χ2 | 0.075 | 1.09 | 0.023 | 1 | 0.023 | 0.00473 | 0.9471 |
| χ1χ3 | -2.35 | 1.09 | 22.09 | 1 | 22.09 | 4.65 | 0.0680 |
| χ2χ3 | 0.33 | 1.09 | 0.42 | 1 | 0.42 | 0.089 | 0.7743 |
| χ12 | -8.22 | 1.06 | 284.84 | 1 | 284.84 | 59.93 | 0.0001 |
| χ22 | 19.75 | 1.06 | 1642.37 | 1 | 1642.37 | 345.53 | < 0.0001 |
| χ32 | -14.53 | 1.06 | 888.32 | 1 | 888.32 | 186.89 | < 0.0001 |
R2 = 0.9895; adj.R2 = 0.9760; CV = 1.25%.
Table 6 shows the analysis of statistical data of the significant quadratic predictive model. The R2 is 0.9895, indicating that only 2.05% of the variations is outside the model. And a high value of adjusted determination coefficient (adjusted R2 = 0.9760) also indicating the model is significant. In addition, the model F-value of 73.3 and P-value less than 0.0001 show that model is significant. The coefficient of variation is low (CV = 1.25%), indicating that the experimental value has a high accuracy.
As Table 7 and Figure 9 show, the optimum microwave power in each stage is identified to be 700 W, 550 W and 400 W. We repeated the experiment at the optimized conditions obtained an average energy consumption of 158.3 W·h and found that the deviations between the experimental value and the predicted value is small.
Optimized microwave drying process.
Energy consumption statistics under the optimized conditions.
| Step 1 (W) | Step 2 (W) | Step 3 (W) | Energy consumption (W·h) | |
|---|---|---|---|---|
| Predicted | Experimental | |||
| 700.000 | 550.000 | 400.000 | 155.2 | 158.3 |
Stage 1, preheating and steaming stage: Large amounts of water in the sample need more microwave energy to evaporate.
Stage 2, decelerating drying stage: Water content decreased, but the diffusion process is smooth. In this stage, only the latent heat of vaporization which is supplied by microwave power is needed.
Stage 3, internal diffusion stage: With the decrease of free water, only capillary water is left in the material and a dense crust will form on the surface of the material in the last stage stage. While the water content of the NCR is not sufficient to absorb the microwave energy, therefore a burning period is possible to appear with the microwave distribution inside the material becomes more and more uneven. So a lower microwave power and longer drying time is needed.
Changing the microwave power in the drying process can effectively reduce energy consumption. According to the optimized process, the energy consumption above of 110 W·h/kg can be reduced than that of drying with a single microwave power. It can provide effective basic data for industrialization experiment.
4 Conclusion
The dielectric properties of a NCR with various moisture contents were measured at low temperatures. And found that the dielectric properties of the material are strongly related to the moisture content. During the drying process, the microwave energy is mainly absorbed by the water molecules.
The drying characteristics of the NCR were studied at different microwave powers and various sample masses. The variations in moisture content, drying rate, and moisture ratio were significantly affected by the power density.
The Midilli-Kucuk model was used to describe the drying characteristics of the NCR with a high value of R2 and low value of SSR. The values of k0 and Ea were received as 0.3321 min-1 and 9.7604 W·g-1 using the Arrhenius equation. They correctly described the dependence of the drying rate constant on the powers/ mas ration P/m. In actual production, it can be used to predict and control the drying rate and moisture content at any time for a given power and sample mass.
By adjusting the microwave power in the drying process, the energy consumption above of 110 W·h/kg can be reduced.
Acknowledgments
This work was funded by Foundation of Henan Educational Committee (Grant No. 18A530002) and Key Scientific and Technological Project of Henan Province (Grant No. 182102310896).
References
[1] Shinyama K., Magari Y., Tanaka T., Nakamura H., Nohma T., Yonezu I., Influence of electroless nickel plating of hydrogen-absorbing alloys on cycle characteristics of nickel-metal hydride batteries. Res. Chem. Intermediat., 2006, 32, 419-429.10.1163/156856706777973718Search in Google Scholar
[2] Basch A., Albering J.H., Preparation and characterization of core-shell battery materials for Li-ion batteries manufactured by substrate induced coagulation. J. Power Sources, 2011, 196, 3290-3295.10.1016/j.jpowsour.2010.11.043Search in Google Scholar PubMed PubMed Central
[3] Adhoum N., Monser L., Bellakhal N., Belgaied J., Treatment of electroplating wastewater containing Cu2+ Zn2+ and Cr(VI) by electrocoagulation. J. Hazard. Mater., 2004, 112, 207-213.10.1016/j.jhazmat.2004.04.018Search in Google Scholar PubMed
[4] Yan X., Li Q., Chai L., Wang Q., Formation of abiological granular sludge – a facile and bioinspired proposal for improving sludge settling performance during heavy metal wastewater treatment. Chemosphere, 2014, 113, 36-41.10.1016/j.chemosphere.2014.04.038Search in Google Scholar PubMed
[5] Akbal F., Camcl S., Copper, chromium and nickel removal from metal plating wastewater by electrocoagulation. Desalination, 2011, 269, 214-222.10.1016/j.desal.2010.11.001Search in Google Scholar
[6] Hsieh C.H., Shih K., Hu C.Y., Lo S.L., Li N.H., Cheng Y.T., The effects of salinity and temperature on phase transformation of copper-laden sludge. J. Hazard. Mater., 2013, 244-245, 501-506.10.1016/j.jhazmat.2012.10.066Search in Google Scholar PubMed
[7] Zhang P., Ma Y., Xie F., Impacts of ultrasound on selective leaching recovery of heavy metals from metal-containing waste sludge. J. Mater. Cycles Waste, 2013, 15, 530-538.10.1007/s10163-013-0131-zSearch in Google Scholar
[8] Silva J.E., Paiva A.P., Soares D., Labrincha A., Castro F., Solvent extraction applied to the recovery of heavy metals from galvanic sludge. J. Hazard. Mater., 2005, 120, 113-118.10.1016/j.jhazmat.2004.12.008Search in Google Scholar PubMed
[9] Liang Y.J., Chai L.Y., Min X.B., Tang C.J., Zhang H.J., Ke Y., et al., Hydrothermal sulfidation and floatation treatment of heavy-metal-containing sludge for recovery and stabilization. J. Hazard. Mater., 2012, 217-218, 307-314.10.1016/j.jhazmat.2012.03.025Search in Google Scholar PubMed
[10] Shih K., White T., Leckie J.O., Nickel stabilization efficiency of aluminate and ferrite spinels and their leaching behavior. Environ. Sci. Technol., 2006, 40, 5520-5526.10.1021/es0601033Search in Google Scholar PubMed
[11] Luan J., Li R., Zhang Z., Li Y., Zhao L., Speciation evolutions of target metals (Cd, Pb) influenced by chlorine and sulfur during sewage sludge incineration. Front. Env. Sc. Eng., 2014, 8, 871-876.10.1007/s11783-013-0621-1Search in Google Scholar
[12] Mortier S.T.F.C., De Beer T., Gernaey K.V., Remon P.J., Vervaet C., Nopens I., Mechanistic modelling of fluidized bed drying processes of wet porous granules: a review. Eur. J. Pharm. Biopharm., 2011, 79, 205-225.10.1016/j.ejpb.2011.05.013Search in Google Scholar
[13] Hossain M.A., Gottschalk K., Amer B.M.A., Mathematical modelling for drying of tomato in hybrid dryer. Arab. J. Sci. Eng., 2010, 35, 239.Search in Google Scholar
[14] Zotarelli M.F., Laurindo J.B., A convective multi-flash drying process for producing dehydrated crispy fruits. J. Food Eng., 2012, 108, 523-531.10.1016/j.jfoodeng.2011.09.014Search in Google Scholar
[15] Chun Y.N., Kim S.C., Yoshikawa K., Pyrolysis gasification of dried sewage sludge in a combined screw and rotary kiln gasifier. Appl. Energ., 2011, 88, 1105-1112.10.1016/j.apenergy.2010.10.038Search in Google Scholar
[16] Li Y., Lei Y., Zhang L.B., Peng J.H., Li C.L., Microwave drying characteristics and kinetics of ilmenite. T. Nonferr. Metal. Soc., 2011, 21, 202-207.10.1016/S1003-6326(11)60700-0Search in Google Scholar
[17] Rattanadecho P., Makul N., Microwave-assisted drying: a review of the state-of-the-art. Dry. Technol., 2016, 34, 1-38.10.1080/07373937.2014.957764Search in Google Scholar
[18] Jiang J., Dang L., Yuensin C., Tan H., Pan B., Wei H., Simulation of microwave thin layer drying process by a new theoretical model. Chem. Eng. Sci., 2017, 162, 69-76.10.1016/j.ces.2016.12.040Search in Google Scholar
[19] Huang K.M., Cao X.J., Liu C., Liu C.J., Xu X.B., Measurement/ computation of effective permittivity of dilute solution in saponification reaction. IEEE T. Microw. Theory., 2003, 51, 2106-2111.10.1109/TMTT.2003.817454Search in Google Scholar
[20] Li Z.Y., Wang R.F., Kudra T., Uniformity Issue in Microwave Drying. Dry. Technol., 2011, 29, 652-660.10.1080/07373937.2010.521963Search in Google Scholar
[21] Wang J., Hong T., Xie T., Yang F., Hu Y., Zhu H., Impact of filled materials on the heating uniformity and safety of microwave heating solid stack materials. Processes, 2018, 6, 220-233.10.3390/pr6110220Search in Google Scholar
[22] Tran T., Nguyen H., Nguyen D., Nguyen T., Optimization of microwave-assisted extraction of essential oil from vietnamese basil Ocimum basilicum L.) using response surface methodology. Processes, 2018, 6, 206-219.10.3390/pr6110206Search in Google Scholar
[23] Guo Z.Y., Ju S.H., Lei T., Peng J.H., Zhang L.B., Jiang F., Optimization on drying of CuCl residue by hot-air using response surface methodology. In: Battle T.P. (Ed.), The Minerals, Metals & Materials Society (15-19 March 2015, Orlando, USA). Walt Disney World, Orlando, 2015, 73-80.Search in Google Scholar
[24] Le T., Ju S., Lu L., Koppala S., Peng J., Microwave drying of CuCl residue from hydrometallurgical zinc recovery process. Dry. Technol., 2018, 37, 47-58.10.1080/07373937.2018.1436558Search in Google Scholar
[25] Lin G., Liu C., Zhang L., Hu T., Peng J., Li J., et al., High temperature dielectric properties of spent adsorbent with zinc sulfate by cavity perturbation technique. J. Hazard. Mater., 2017, 330, 36-45.10.1016/j.jhazmat.2017.02.010Search in Google Scholar
[26] Jiang Y., Liu B., Liu P., Peng J., Zhang L., Dielectric properties and oxidation roasting of molybdenite concentrate by using microwave energy at 2.45 GHz frequency. Metall. Mater. Trans. B, 2017, 48, 3047-3057.10.1007/s11663-017-1083-9Search in Google Scholar
[27] Guo Z., Guo P., Su G., Zhai D., Cheng F., Li F., High-Temperature Permittivity and Microwave Pretreatment Characteristics of Nickel-Containing Sludge from Battery Production. Processes, 2019, 7, 257.10.3390/pr7050257Search in Google Scholar
[28] Erbay Z., Ici̇er F., A review of thin layer drying of foods: theory, modeling, and experimental results. Criti. Rev. Food Sci., 2010, 50, 441-464.10.1080/10408390802437063Search in Google Scholar
[29] Jayas D., Cenkowski S., Pabis S., Muir W., Review of thin-layer drying and wetting equations. Dry. Technol., 1991, 9, 551-588.10.1080/07373939108916697Search in Google Scholar
[30] Hii C.L., Law C.L., Cloke M., Modeling using a new thin layer drying model and product quality of cocoa. J. Food Eng., 2009, 90, 191-198.10.1016/j.jfoodeng.2008.06.022Search in Google Scholar
[31] Suwannapum N., Rattanadecho P., Analysis of heat-mass transport and pressure buildup induced inside unsaturated porous media subjected to microwave energy using a single (te\r, 10\r,) mode cavity. Dry. Technol., 2011, 29, 1010-1024.10.1080/07373937.2010.548110Search in Google Scholar
[32] Prat M., Recent advances in pore-scale models for drying of porous media. Chem. Eng. J., 2002, 86, 153-164.10.1016/S1385-8947(01)00283-2Search in Google Scholar
[33] Pickles C.A., Microwave drying of nickeliferous limonitic laterite ores. Can. Metall. Quart., 2013, 44, 397-408.10.1179/cmq.2005.44.3.397Search in Google Scholar
[34] Song Z., Jing C., Yao L., Zhao X., Wang W., Mao Y., et al., Microwave drying performance of single-particle coal slime and energy consumption analyses. Fuel Process. Technol., 2016, 143, 69-78.10.1016/j.fuproc.2015.11.012Search in Google Scholar
[35] Zhu J.F., Liu J.Z., Wu J.H., Cheng J., Zhou J.H., Cen K.F., Thin-layer drying characteristics and modeling of Ximeng lignite under microwave irradiation. Fuel Process. Technol., 2015, 130, 62-70.10.1016/j.fuproc.2014.09.033Search in Google Scholar
[36] Soysal Y., Microwave drying characteristics of parsley. Biosyst. Eng., 2004, 89, 167-173.10.1016/j.biosystemseng.2004.07.008Search in Google Scholar
© 2019 Guo et al., published by De Gruyter
This work is licensed under the Creative Commons Attribution 4.0 Public License.
Articles in the same Issue
- Regular Articles
- Studies on the preparation and properties of biodegradable polyester from soybean oil
- Flow-mode biodiesel production from palm oil using a pressurized microwave reactor
- Reduction of free fatty acids in waste oil for biodiesel production by glycerolysis: investigation and optimization of process parameters
- Saccharin: a cheap and mild acidic agent for the synthesis of azo dyes via telescoped dediazotization
- Optimization of lipase-catalyzed synthesis of polyethylene glycol stearate in a solvent-free system
- Green synthesis of iron oxide nanoparticles using Platanus orientalis leaf extract for antifungal activity
- Ultrasound assisted chemical activation of peanut husk for copper removal
- Room temperature silanization of Fe3O4 for the preparation of phenyl functionalized magnetic adsorbent for dispersive solid phase extraction for the extraction of phthalates in water
- Evaluation of the saponin green extraction from Ziziphus spina-christi leaves using hydrothermal, microwave and Bain-Marie water bath heating methods
- Oxidation of dibenzothiophene using the heterogeneous catalyst of tungsten-based carbon nanotubes
- Calcined sodium silicate as an efficient and benign heterogeneous catalyst for the transesterification of natural lecithin to L-α-glycerophosphocholine
- Synergistic effect between CO2 and H2O2 on ethylbenzene oxidation catalyzed by carbon supported heteropolyanion catalysts
- Hydrocyanation of 2-arylmethyleneindan-1,3-diones using potassium hexacyanoferrate(II) as a nontoxic cyanating agent
- Green synthesis of hydratropic aldehyde from α-methylstyrene catalyzed by Al2O3-supported metal phthalocyanines
- Environmentally benign chemical recycling of polycarbonate wastes: comparison of micro- and nano-TiO2 solid support efficiencies
- Medicago polymorpha-mediated antibacterial silver nanoparticles in the reduction of methyl orange
- Production of value-added chemicals from esterification of waste glycerol over MCM-41 supported catalysts
- Green synthesis of zerovalent copper nanoparticles for efficient reduction of toxic azo dyes congo red and methyl orange
- Optimization of the biological synthesis of silver nanoparticles using Penicillium oxalicum GRS-1 and their antimicrobial effects against common food-borne pathogens
- Optimization of submerged fermentation conditions to overproduce bioethanol using two industrial and traditional Saccharomyces cerevisiae strains
- Extraction of In3+ and Fe3+ from sulfate solutions by using a 3D-printed “Y”-shaped microreactor
- Foliar-mediated Ag:ZnO nanophotocatalysts: green synthesis, characterization, pollutants degradation, and in vitro biocidal activity
- Green cyclic acetals production by glycerol etherification reaction with benzaldehyde using cationic acidic resin
- Biosynthesis, characterization and antimicrobial activities assessment of fabricated selenium nanoparticles using Pelargonium zonale leaf extract
- Synthesis of high surface area magnesia by using walnut shell as a template
- Controllable biosynthesis of silver nanoparticles using actinobacterial strains
- Green vegetation: a promising source of color dyes
- Mechano-chemical synthesis of ammonia and acetic acid from inorganic materials in water
- Green synthesis and structural characterization of novel N1-substituted 3,4-dihydropyrimidin-2(1H)-ones
- Biodiesel production from cotton oil using heterogeneous CaO catalysts from eggshells prepared at different calcination temperatures
- Regeneration of spent mercury catalyst for the treatment of dye wastewater by the microwave and ultrasonic spray-assisted method
- Green synthesis of the innovative super paramagnetic nanoparticles from the leaves extract of Fraxinus chinensis Roxb and their application for the decolourisation of toxic dyes
- Biogenic ZnO nanoparticles: a study of blueshift of optical band gap and photocatalytic degradation of reactive yellow 186 dye under direct sunlight
- Leached compounds from the extracts of pomegranate peel, green coconut shell, and karuvelam wood for the removal of hexavalent chromium
- Enhancement of molecular weight reduction of natural rubber in triphasic CO2/toluene/H2O systems with hydrogen peroxide for preparation of biobased polyurethanes
- An efficient green synthesis of novel 1H-imidazo[1,2-a]imidazole-3-amine and imidazo[2,1-c][1,2,4]triazole-5-amine derivatives via Strecker reaction under controlled microwave heating
- Evaluation of three different green fabrication methods for the synthesis of crystalline ZnO nanoparticles using Pelargonium zonale leaf extract
- A highly efficient and multifunctional biomass supporting Ag, Ni, and Cu nanoparticles through wetness impregnation for environmental remediation
- Simple one-pot green method for large-scale production of mesalamine, an anti-inflammatory agent
- Relationships between step and cumulative PMI and E-factors: implications on estimating material efficiency with respect to charting synthesis optimization strategies
- A comparative sorption study of Cr3+ and Cr6+ using mango peels: kinetic, equilibrium and thermodynamic
- Effects of acid hydrolysis waste liquid recycle on preparation of microcrystalline cellulose
- Use of deep eutectic solvents as catalyst: A mini-review
- Microwave-assisted synthesis of pyrrolidinone derivatives using 1,1’-butylenebis(3-sulfo-3H-imidazol-1-ium) chloride in ethylene glycol
- Green and eco-friendly synthesis of Co3O4 and Ag-Co3O4: Characterization and photo-catalytic activity
- Adsorption optimized of the coal-based material and application for cyanide wastewater treatment
- Aloe vera leaf extract mediated green synthesis of selenium nanoparticles and assessment of their In vitro antimicrobial activity against spoilage fungi and pathogenic bacteria strains
- Waste phenolic resin derived activated carbon by microwave-assisted KOH activation and application to dye wastewater treatment
- Direct ethanol production from cellulose by consortium of Trichoderma reesei and Candida molischiana
- Agricultural waste biomass-assisted nanostructures: Synthesis and application
- Biodiesel production from rubber seed oil using calcium oxide derived from eggshell as catalyst – optimization and modeling studies
- Study of fabrication of fully aqueous solution processed SnS quantum dot-sensitized solar cell
- Assessment of aqueous extract of Gypsophila aretioides for inhibitory effects on calcium carbonate formation
- An environmentally friendly acylation reaction of 2-methylnaphthalene in solvent-free condition in a micro-channel reactor
- Aegle marmelos phytochemical stabilized synthesis and characterization of ZnO nanoparticles and their role against agriculture and food pathogen
- A reactive coupling process for co-production of solketal and biodiesel
- Optimization of the asymmetric synthesis of (S)-1-phenylethanol using Ispir bean as whole-cell biocatalyst
- Synthesis of pyrazolopyridine and pyrazoloquinoline derivatives by one-pot, three-component reactions of arylglyoxals, 3-methyl-1-aryl-1H-pyrazol-5-amines and cyclic 1,3-dicarbonyl compounds in the presence of tetrapropylammonium bromide
- Preconcentration of morphine in urine sample using a green and solvent-free microextraction method
- Extraction of glycyrrhizic acid by aqueous two-phase system formed by PEG and two environmentally friendly organic acid salts - sodium citrate and sodium tartrate
- Green synthesis of copper oxide nanoparticles using Juglans regia leaf extract and assessment of their physico-chemical and biological properties
- Deep eutectic solvents (DESs) as powerful and recyclable catalysts and solvents for the synthesis of 3,4-dihydropyrimidin-2(1H)-ones/thiones
- Biosynthesis, characterization and anti-microbial activity of silver nanoparticle based gel hand wash
- Efficient and selective microwave-assisted O-methylation of phenolic compounds using tetramethylammonium hydroxide (TMAH)
- Anticoagulant, thrombolytic and antibacterial activities of Euphorbia acruensis latex-mediated bioengineered silver nanoparticles
- Volcanic ash as reusable catalyst in the green synthesis of 3H-1,5-benzodiazepines
- Green synthesis, anionic polymerization of 1,4-bis(methacryloyl)piperazine using Algerian clay as catalyst
- Selenium supplementation during fermentation with sugar beet molasses and Saccharomyces cerevisiae to increase bioethanol production
- Biosynthetic potential assessment of four food pathogenic bacteria in hydrothermally silver nanoparticles fabrication
- Investigating the effectiveness of classical and eco-friendly approaches for synthesis of dialdehydes from organic dihalides
- Pyrolysis of palm oil using zeolite catalyst and characterization of the boil-oil
- Azadirachta indica leaves extract assisted green synthesis of Ag-TiO2 for degradation of Methylene blue and Rhodamine B dyes in aqueous medium
- Synthesis of vitamin E succinate catalyzed by nano-SiO2 immobilized DMAP derivative in mixed solvent system
- Extraction of phytosterols from melon (Cucumis melo) seeds by supercritical CO2 as a clean technology
- Production of uronic acids by hydrothermolysis of pectin as a model substance for plant biomass waste
- Biofabrication of highly pure copper oxide nanoparticles using wheat seed extract and their catalytic activity: A mechanistic approach
- Intelligent modeling and optimization of emulsion aggregation method for producing green printing ink
- Improved removal of methylene blue on modified hierarchical zeolite Y: Achieved by a “destructive-constructive” method
- Two different facile and efficient approaches for the synthesis of various N-arylacetamides via N-acetylation of arylamines and straightforward one-pot reductive acetylation of nitroarenes promoted by recyclable CuFe2O4 nanoparticles in water
- Optimization of acid catalyzed esterification and mixed metal oxide catalyzed transesterification for biodiesel production from Moringa oleifera oil
- Kinetics and the fluidity of the stearic acid esters with different carbon backbones
- Aiming for a standardized protocol for preparing a process green synthesis report and for ranking multiple synthesis plans to a common target product
- Microstructure and luminescence of VO2 (B) nanoparticle synthesis by hydrothermal method
- Optimization of uranium removal from uranium plant wastewater by response surface methodology (RSM)
- Microwave drying of nickel-containing residue: dielectric properties, kinetics, and energy aspects
- Simple and convenient two step synthesis of 5-bromo-2,3-dimethoxy-6-methyl-1,4-benzoquinone
- Biodiesel production from waste cooking oil
- The effect of activation temperature on structure and properties of blue coke-based activated carbon by CO2 activation
- Optimization of reaction parameters for the green synthesis of zero valent iron nanoparticles using pine tree needles
- Microwave-assisted protocol for squalene isolation and conversion from oil-deodoriser distillates
- Denitrification performance of rare earth tailings-based catalysts
- Facile synthesis of silver nanoparticles using Averrhoa bilimbi L and Plum extracts and investigation on the synergistic bioactivity using in vitro models
- Green production of AgNPs and their phytostimulatory impact
- Photocatalytic activity of Ag/Ni bi-metallic nanoparticles on textile dye removal
- Topical Issue: Green Process Engineering / Guest Editors: Martine Poux, Patrick Cognet
- Modelling and optimisation of oxidative desulphurisation of tyre-derived oil via central composite design approach
- CO2 sequestration by carbonation of olivine: a new process for optimal separation of the solids produced
- Organic carbonates synthesis improved by pervaporation for CO2 utilisation
- Production of starch nanoparticles through solvent-antisolvent precipitation in a spinning disc reactor
- A kinetic study of Zn halide/TBAB-catalysed fixation of CO2 with styrene oxide in propylene carbonate
- Topical on Green Process Engineering