
Leached compounds from the extracts of pomegranate peel, green coconut shell, and karuvelam wood for the removal of hexavalent chromium
-
Femina Abdul Salam


Abstract
During biosorption, the biosorbent releases many organic compounds to the medium. In the present study, extracts of pomegranate peel (PP), green coconut shell (GCS), and karuvelam wood (KW) were prepared at three different conditions, namely 12 h, 3 h, and 3 h at pH 2, for the removal of hexavalent chromium [Cr(VI)]. The amount of organic compounds, mainly the leached organic compounds in the extract before and after treatment with Cr(VI) solution, was determined by chemical oxygen demand analysis. The total phenolic content, antioxidant activity, and total flavonoid content were used to estimate the chromium reduction potential of the extracts. The PP extract is the richest in all the three factors, followed by GCS and KW. The disappearance rate of Cr(VI) in the presence of PP extract reached 99.63% for the 50 mg/l concentration within 3 min, while it was 12% and 10% for GCS and KW, respectively, for the same concentration and time. Reaction mechanisms were formulated with the help of Fourier transform infrared spectroscopy to confirm the role of leached compounds from natural materials for the removal of heavy metal.
- Abbreviations
- COD
chemical oxygen demand
- Cr(III)
trivalent chromium
- Cr(VI)
hexavalent chromium
- DDW
double-distilled water
- DPPH
2,2-diphenyl-1-picrylhydrazyl
- GAE
gallic acid equivalent
- GCS
green coconut shell
- KW
karuvelam wood
- PP
pomegranate peel
- TPC
total phenolic content
- TFC
total flavonoid content
1 Introduction
The emission of toxic heavy metals to the biosphere increases due to rapid industrialization and urbanization, producing adverse effects on the ecosystem [1]. Pollution caused by heavy metals like chromium, arsenic, lead, etc., is one of the most significant issues faced by environmentalists [2]. Chromium is a widely used heavy metal in tanneries, electrochemical industries, and other chemical industries. In nature, chromium mainly exists in two oxidation states: hexavalent chromium [Cr(VI)] and trivalent chromium [Cr(III)] [3]. Cr(VI) causes many health issues, such as breathing problems, allergy, cancer, etc. [3], [4]. As per the guidelines of the World Health Organization and the Central Pollution Control Board of India, the total chromium content of drinking water is restricted to 0.05 mg/l [5], [6], [7], [8]. Thus, the removal of Cr(VI) is highly essential to overcome the toxic effects.
With respect to the variations in pH of the medium, the ionic forms of chromium also differ. Cr(III) on hydrolysis results in compounds like neutral species Cr(OH)30, mononuclear species Cr(OH)2+, CrOH2+, Cr(OH)4−, polynuclear species Cr3(OH)45+, and Cr2(OH)2. Hydrolysis of Cr(VI) at low pH and higher concentration produces Cr2O72− and CrO42− at pH >6.5 [3]. The redox potential-pH and speciation diagrams show that Cr(VI) exists primarily as a salt of chromic acid (H2CrO4) at pH <1, hydrogen chromate ion (HCrO4−) at pH between 1 and 6, and chromate ion (CrO42−) at pH >6 [4].
In recent times, the research community is searching for cheap and eco-friendly technology for heavy metal removal, and it has been found that biosorption is a better option. Biosorption is a sorption process where naturally occurring living and non-living things act as a biosorbent. During biosorption, many colored organic compounds are released into the medium. The literature reports that these released compounds have significant roles in the removal of heavy metals. The amount of released pigments during biosorption can be quantified in terms of chemical oxygen demand (COD) representing the Cr(VI) reduction potential [9], [10]. Various plant parts are natural materials releasing compounds such as flavonoids, polyphenols, terpenoids, aldehydes, ketones, carboxylic acids, ether groups, and tannins, which have the ability to chelate metal catalysts [11], [12], [13].
Aquatic weeds [10], palm flower [9], rice husk [14], lemon shell [15], mangosteen peel [16], and many other biomaterials have been experimented on for the removal of chromium. In the present study, the Cr(VI) removal efficiency of the released compounds from pomegranate peel (PP), green coconut shell (GCS), and karuvelam wood (KW) were estimated based on COD, total phenolic content (TPC), antioxidant activity, and total flavonoid content (TFC). A review of the literature indicates that chromium removal based on the aforementioned properties has not yet been reported previously.
2 Materials and methods
2.1 Plant materials
The three biomaterials chosen for the preparation of extracts were peel of Punica granatum L. (pomegranate), shell of Cocos nucifera (coconut), and wood of Prosopis juliflora (karuvelam), which are all cheaply and abundantly available in the southern part of India. The main selection criterion for their choice was effective waste utilization. Raw materials for extract preparation were collected from the National Institute of Technology, Tiruchirappalli Campus. The biomaterials were initially washed with tap water to remove dust and dirt, and then washed three times with double-distilled water (DDW). Subsequently, they were dried under the sun for 3 days and in an oven for 24 h at 318 K. All the dried materials were powdered and sieved, and a particle size of 125 μm was chosen.
2.2 Chemicals
Potassium dichromate, sodium nitrite, sodium nitrate, sodium hydroxide, aluminum chloride, ferric chloride, 1,5-diphenylcarbazide, hydrochloric acid, sulfuric acid, a sodium carbonate and COD solution A and B of Spectroquant were purchased from Merck (Mumbai, Maharashtra, India). 2,2-Diphenyl-1-picrylhydrazyl (DPPH) (Sigma Aldrich CHEMIE, GmbH, Steinheim, Germany), gallic acid, and Folin-Ciocalteu reagent were procured from Nice Chemicals, Pvt. Ltd. (Cochin, Kerala, India). All the chemicals used were of analytical grade.
2.3 Extract preparation
Extracts were prepared for each material (PP, GCS, and KW) at three different conditions: (i) 12 h soaking – soaking of material for 12 h in DDW for maximum extraction of water-soluble compounds from the biosorbent for maximum Cr(VI) removal, (ii) 3 h soaking – soaking of material in DDW for 3 h, and (iii) 3 h soaking of material in DDW at a pH of 2 (adjusted using HCl). The conditions were selected based on preliminary studies, as pH 2 displayed better reduction of chromium for a given specified time than other pH values. For all the three extraction conditions and biomaterials, 1 g of sample was soaked in Erlenmeyer flasks containing 100 ml DDW and placed in an orbital shaker at 150 rpm at 303 K. After soaking, the extract was vacuum filtered and stored at 4°C.
2.4 Characterization of extracts
2.4.1 COD analysis
The amount of water-soluble compounds released during biosorption and the compounds that remained in solution after interaction with Cr(VI) solution were measured by COD analysis using a closed reflux method as per American Public Health Association [17].
For COD analysis, 2.2 ml of COD solution A and 1.8 ml of COD solution B were added to 1 ml distilled water in sample bottles and digested at 150°C for 120 min. Samples were cooled to room temperature and analyzed in Spectroquant colorimeter. The same procedure was repeated with extracts instead of distilled water. All the experiments were done in triplicate.
2.4.2 TPC
In the test to ascertain the presence of TPC as per Madaan et al. [18], 1 ml FeCl3 was added to 1 ml extract. A dark blue color developed with the PP extract and a lighter blue color in the GCS and KW extracts, which indicated the presence of phenolic content. Quantitative determination of TPC before and after biosorption of Cr(VI) was determined and expressed as gallic acid equivalents (mg/g) [18]. Gallic acid stock solution was prepared by dissolving 5 mg gallic acid in 10 ml ethanol, and then made to 100 ml with DDW. For preparing a calibration curve, solutions of various concentrations of gallic acid were prepared from the stock solution. Aliquots (1 ml) of each dilution were then added with 10 ml DDW and 1.5 ml Folin-Ciocalteu reagent. The solution was mixed well and incubated for 5 min at room temperature. A 4 ml volume of 20% Na2CO3 (w/w) was added to each test tube, and it was made to 25 ml with DDW. This mixture was agitated and left aside for 30 min. The absorbance was determined at a wavelength of 765 nm. The calibration curve was plotted using absorbance against gallic acid concentration. Gallic acid was replaced with the sample extract for finding the TPC present in the extract. TPC was then calculated from Eq. (1), as given in the literature [19]. All experiments were done in triplicate.
where GAE is the gallic acid equivalent (mg/l), V is the volume of extract (l), D is dilution factor, and m is the weight (g) of the plant extract.
2.4.3 Antioxidant activity
Colorimetry using DPPH was followed for the determination of antioxidant activity or percentage inhibition, as it is reported as a fast, easy, and reliable method [20]. DPPH is a stable synthetic radical that can easily accept H+ ions from the phenolic compounds present in the extract by the following reaction:
For this, 0.02 g DPPH was dissolved in 50 ml ethanol to produce a solution of a concentration of 0.4 mg/ml. A volume of 5 ml of each extract (1 mg/ml) was added to 1 ml DPPH and made to 10 ml with ethanol. Absorbance was measured at 517 nm. Antioxidant activity was calculated using Eq. (3), as given by Kalita et al. [21] and Sahu and Saxena [22]. All the experiments were done in triplicate.
2.4.4 TFC
The presence of TFC in the extract was identified as described by the American Public Health Association [17] and Madaan et al. [18]. A few drops of dilute NaOH (0.1 m) was added to 1 ml extract, which was initially yellow in color and then the color disappeared upon adding dilute HCl (0.1 m). This confirmed the presence of flavonoids. The TFC was estimated using the aluminum chloride method, and the results were expressed as quercetin equivalents [22], [23]. For plotting the calibration curve, various concentrations of standard quercetin solutions were prepared from the stock solution of 100 mg/l by serial dilution. A 1 ml volume of the standard solution was taken in a test tube containing 4 ml DDW, and to this 0.3 ml of 5% NaNO2 was added. After 5 min, 0.3 ml of 10% Al2Cl3 was added to the mixture. After 6 min, 2 ml of 1 m NaOH was added and it was made up to 10 ml with DDW. The procedure was repeated with the extracts instead of standard quercetin for estimating the TFC in the extract. Absorbance was measured at 475 nm. All the experiments were done in triplicate.
2.4.5 Quantification of Cr(VI)
The 1,5-diphenyl carbazide method was used for evaluating Cr(VI). Absorbance was measured at 540 nm using a Shimadzu ultraviolet-visible spectrophotometer. For this analysis, a stock solution of concentration 1000 mg/l was prepared by dissolving the required quantity of potassium dichromate in DDW. Cr(VI) solution (50 mg/l) was prepared by serial dilution of the stock solution. A 100 ml volume of each of these solutions was taken in three separate 250 ml Erlenmeyer flasks. The pH of the solution was adjusted to 2. A 10 ml volume of each extract prepared at three different conditions (12 h, 3 h, and 3 h at pH 2) was added. It was kept in the incubator shaker for 3 h for attaining equilibrium at 303 K. For the kinetic study of Cr(VI) removal, samples were drawn at different time intervals. All experiments were done in triplicate.
The Cr(VI) quantification was also confirmed with the total chromium results in atomic absorption spectroscopy (AAS) to account for any Cr(III) present.
2.4.6 Fourier transform infrared spectroscopy (FTIR) analysis of extracts
The FTIR spectra of the extracts prepared at different conditions were taken. Differences in peak intensity and disappearance of various peaks were observed with extracts before and after treatment with Cr(VI) solution.
3 Results and discussion
Performance evaluation of the extracts prepared from PP, GCS, and KW for the removal of Cr(VI) is presented on the basis of COD, TPC, TFC, and antioxidant activity. Initial investigations showed the effect of pH in the process along with time influencing the potential of the three extracts in the study. The extraction conditions were 12 h, 3 h, and 3 h at pH 2 for performance assessment of all the three extracts. The contents of the natural materials (PP, GCS, and KW) were found to be responsible for the efficient removal of the metal. The main functional groups were from polyphenolic compounds, flavonoids, carboxylic acids, and other contents, which could account for the possible reaction mechanisms with Cr(VI), with FTIR analysis supporting the findings.
3.1 COD analysis
COD analysis was performed to quantify the organic compounds released into the medium. The presence of various types of leached compounds have been reported earlier, as polyphenols, condensed tannins, hydrolyzable tannins, and gallotannins in PP extract [13], [[23], [24]; phenolic compounds in GCS 25]; and alkaloids, flavonoids, and tannins in KW [26].
The organic compounds extracted from PP, GCS, and KW were calculated in terms of COD. The higher amount of initial COD value is an indication of the amount of reducing compounds present in the extract. The COD values estimated before and after treatment of extract with 50 mg/l Cr(VI) solution are listed in Table 1. The difference in COD values show the amount of reduction or amount of proton (H+) transferred during biosorption. In the reduction process, the PP extract had the higher initial COD values of 4580, 4620, and 5830 for the extracts obtained after 12 h, 3 h, and 3 h at pH 2, respectively, due to higher organic contents. About 90±2% COD reduction was achieved in all the three conditions by the PP extract, exhibiting the highest reduction compared with the other two extracts. The initial COD value of the GCS extract was higher than that of the KW extract; however, the reduction observed was much less in GCS than in KW. In KW, about 84–86% of COD reduction was obtained for the initial COD values of 2220 and 1850 for the extracts obtained after 12 and 3 h of extraction time, respectively, demonstrating lesser chromium reduction owing to a reduced amount of organics released from it. This indicates that the compounds leached from GCS were more stable as the leachate contains phenolic compounds with fewer multiple hydroxyl groups. Mathew et al. had inferred the higher reduction potential of phenolic compounds with multiple hydroxyl groups [27]. It was noticed that 3 h at pH 2 is the most favorable condition for the extraction of organic compounds from raw materials. Hence, the pH of the solution plays a more important role than contact time for leaching organic compounds from all extracts.
Change in COD before and after adsorption of Cr(VI) from 50 mg/l solution.
| Condition for extraction | PP | GCS | KW | ||||||
|---|---|---|---|---|---|---|---|---|---|
| Initial COD (mg/l) | Final COD (mg/l) | % Reduction of COD | Initial COD (mg/l) | Final COD (mg/l) | % Reduction of COD | Initial COD (mg/l) | Final COD (mg/l) | % Reduction of COD | |
| 12 h | 4580 | 390 | 91.5 | 2670 | 1770 | 33.7 | 2220 | 320 | 85.6 |
| 3 h | 4620 | 520 | 88.7 | 2680 | 1290 | 51.9 | 1850 | 300 | 83.78 |
| 3 h at pH 2 | 5830 | 630 | 89.2 | 2810 | 2380 | 15.3 | 3620 | 310 | 91.4 |
3.2 TPC
The color intensity during the initial experiments depicted the presence of large amounts of TPC in PP extract compared to the other two extracts. After mixing with Cr(VI) solution, the intensity of color was reduced for PP and no color change was observed in the case of GCS and KW extracts due to the complete utilization of phenolic compounds from GCS and KW. The calibration curve for gallic acid given in Figure 1 was used for calculating TPC. Table 2 gives the amount of TPC present in the extracts before and after the removal of Cr(VI) from a 50 mg/l solution. Although the initial TPC of PP extract is higher, a significant drop in TPC was seen. However, with GCS and KW, the initial TPC was less, and after the removal of chromium, no TPC was observed in them for all the conditions.
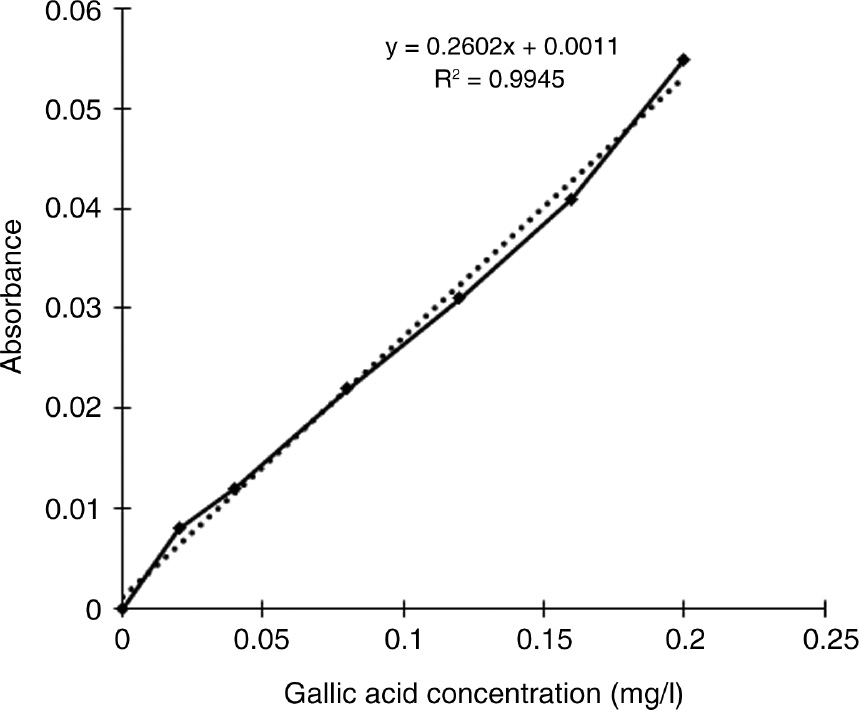
Calibration curve for gallic acid.
Change in TPC before and after adsorption of Cr(VI) from 50 mg/l solution.
| Condition for extraction | PP | GCS | KW | ||||||
|---|---|---|---|---|---|---|---|---|---|
| Initial TPC | Final TPC | % Change in TPC | Initial TPC | Final TPC | % Change in TPC | Initial TPC | Final TPC | % Change in TPC | |
| 12 h | 134.42 | 17.20 | 87.21 | 15.28 | 0.00 | 100.00 | 7.59 | 0.00 | 100.00 |
| 3 h | 150.75 | 12.39 | 91.78 | 11.43 | 0.00 | 100.00 | 4.71 | 0.00 | 100.00 |
| 3 h and pH 2 | 140.18 | 10.47 | 92.53 | 12.39 | 0.00 | 100.00 | 3.75 | 0.00 | 100.00 |
3.3 Antioxidant activity
The antioxidant activity of plant extracts is mainly due to the presence of phenolic and polyphenolic compounds in them. This is an indirect measurement of their free radical scavenging activity, which depends on the ability of the compounds to lose hydrogen [20]. It also helps in understanding the main structure, the structure of the side chains, and the substitutions on aromatic rings [28]. The radical scavenging potential is determined by the number and position of the hydroxyl group and the methoxy group in the phenolic ring [27]. The majority of naturally occurring antioxidants are in the form of phenolic and flavonoid structures, which mostly account for properties like dismutation of radicals and chelate formation [13].
The PP extract showed the highest antioxidant activity, 68.5% more than GCS and 74.57% more than KW. The antioxidant activity of the PP extract, presented in Figure 2, is almost equal in all the three extraction conditions. The intense color change from deep purple to yellow observed while adding DPPH to the PP extract means that its proton-releasing ability is very high for free radicals [29]. One of the reasons for the highest antioxidant activity of PP extract was the presence of polyphenols with highly reactive multiple hydroxyl groups [25], [29]. As far as the extracts of GCS and KW are concerned, the antioxidant activity is nearly the same, as the amount of organic compounds released was very low and have been consumed completely.
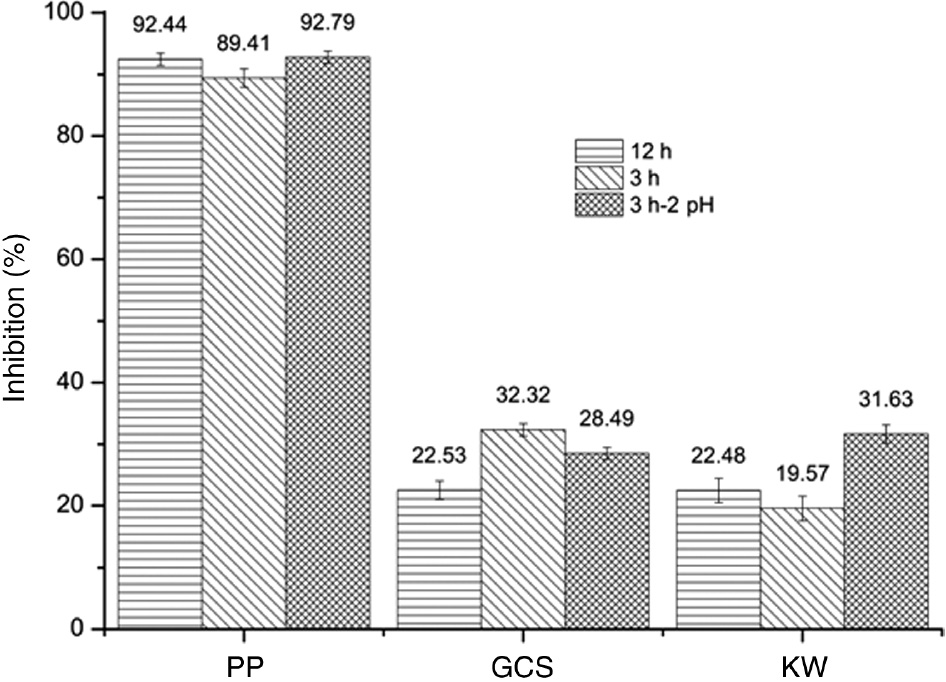
Percentage inhibition or antioxidant activity of extracts at different extraction conditions.
3.4 TFC
Quercetin, a higher electron donor among the investigated flavonoids, was used in the quantification of TFC in the extracts. Moreover, the presence of quercetin has been already reported in the contents of PP extract [13].
Figure 3 shows the quercetin calibration curve for the TFC, and the variation in the level of flavonoids is shown in Figure 4. Figure 4 indicates that the TFC is higher in PP compared to the other two extracts. It is evident that the TFC of the extracts are lesser than the TPC but still present a higher level in PP compared to GCS and KW.
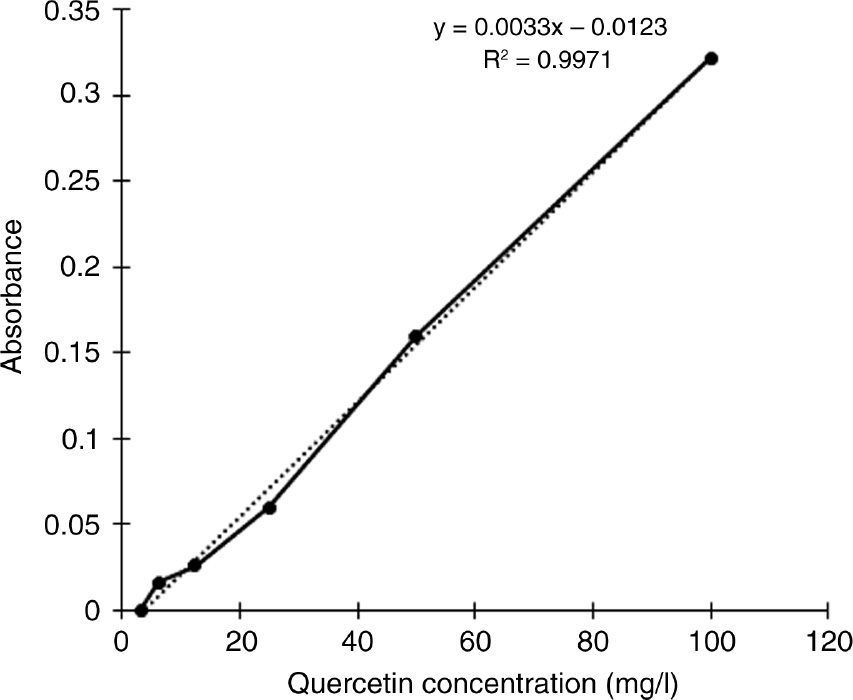
Quercetin calibration curve for flavonoid quantification.

TFC in PP, GCS, and KW extracts for 12 h, 3 h, and 3 h at pH 2 extraction.
3.5 Cr(VI) removal
For all extracts, the maximum removal of Cr(VI) with 50 mg/l occurred for the 12 h extract compared to the removal with the 3 h and 3 h at pH 2 extracts. The Cr(VI) disappearance reached 100% within 6 min for the PP extract; however, in the case of the other two, the maximum removal was <25% after 3 h. In the case of the GCS extract after 120 min, the removal became almost saturated to about 20% for the 12 h extract and to about 10% for the 3 h and 3 h at pH 2 extracts. The removal efficiency with the KW extract started decreasing after 120 min for the 12 h condition and after 60 min for the other two conditions. PP maintained its efficiency at >90% from the third minute onwards for all the three extracts. GCS acquired equilibrium but KW did not stabilize even after 3 h due to redox reactions. Figure 5A–C confirm the percentage removal of Cr(VI) using the PP, GCS, and KW extracts at 303 K and pH 2 for 50 mg/l chromium solution.
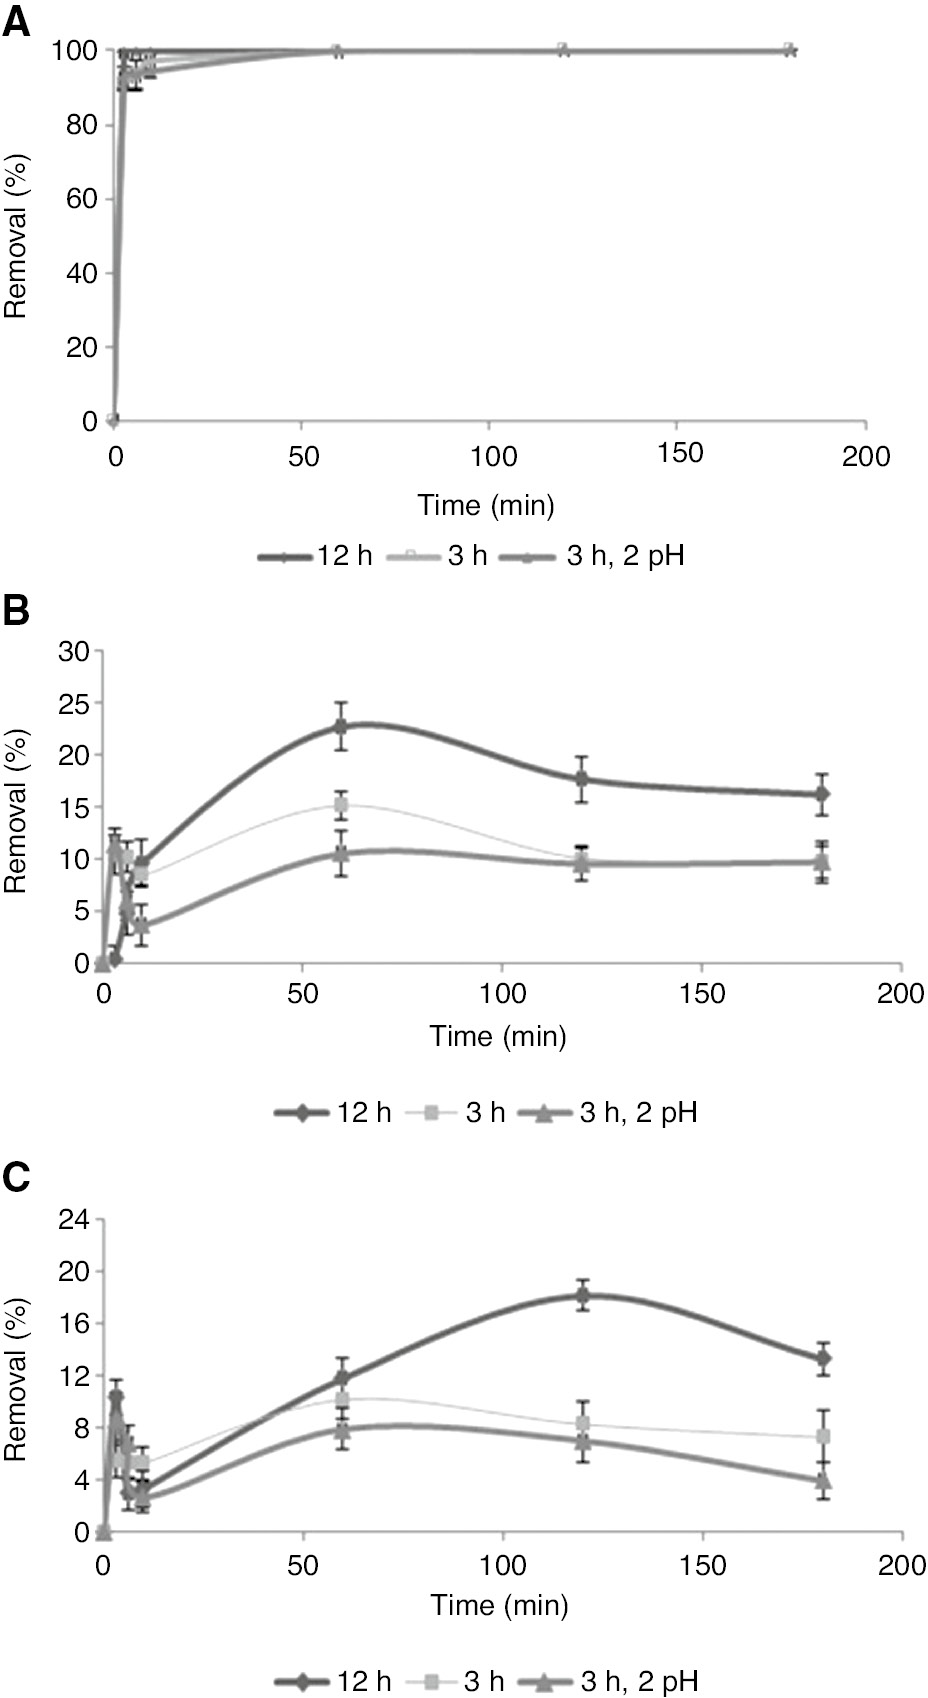
Percentage removal of Cr(VI) using (A) PP, (B) GCS, and (C) KW extracts at 303 K and pH 2.
Cr(VI) removal studies at 20 and 100 mg/l concentrations were also performed for the PP extract, which show its high removal efficiency. It was observed that for 20 mg/l Cr(VI) solution, 100% removal was attained at the third minute for all three conditions (12 h, 3 h, and 3 h at pH 2). For 100 mg/l, at equilibrium, the removal rate was 99.80%, 98.78%, and 96.33% for 12 h, 3 h, and 3 h at pH 2, respectively. The difference between total chromium (from AAS) and Cr(VI) reflected the negligible presence of Cr(III) due to shift reactions in all three extracts.
In Figure 6, showing the FTIR spectra of all extracts, peaks were observed in the area of wavenumber ranging between 1500 and 400 cm−1, representing the presence of carboxylic acids, aromatics, alkyl halides, and amides. The disappearance of all these groups and the increase in the intensity of peaks at wavenumbers 1629 and 3306 cm−1 showed the major role of these compounds in the removal of Cr(VI). Also, these results with the three extracts, in general, gave a clear depiction of the role of functional groups deriving the possible reaction mechanisms.
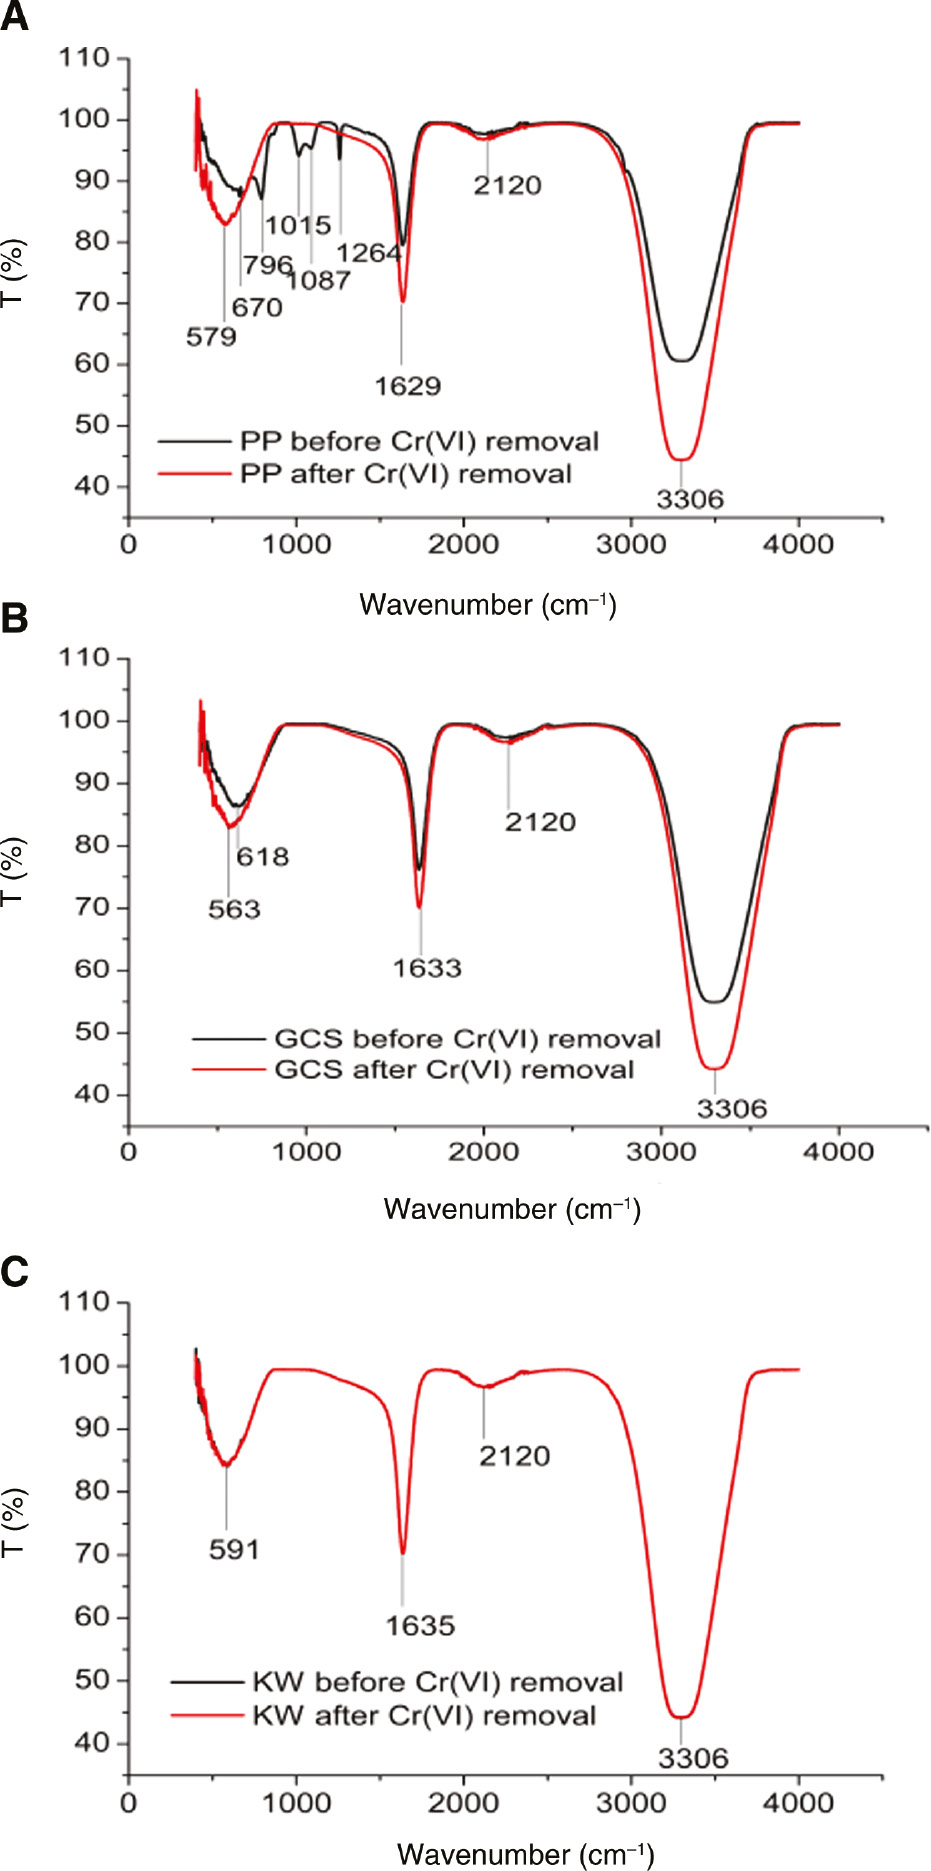
FTIR spectrum of (A) PP, (B) GCS, and (C) KW before and after treatment with Cr(VI) at 303 K and pH 2.
Cr(VI) on hydrolysis gives CrO42−, HCrO4−, and Cr2O72− [3], [10]. The chromate anions react with the organic matter present in the peel extracts to produce Cr(III) as per the following reduction mechanism:
Moreover, on further oxidation,
The expected mechanisms due to the presence of phenolic and carboxylic groups are as follows:
where M is the metal ion.
From the experimentation, it was confirmed that the higher the antioxidant activity, phenolic content, and flavonoid content, the better is the removal of Cr(VI). Metal chelation reaction occurred due to the presence of a high amount of polyphenolic compounds. Phenolic compounds with three hydroxyl radicals release protons easily to form metal chelates. This chelation should have been the reason for not showing the peak at 540 nm in the ultraviolet spectrophotometer. The experimental results also complemented the reaction mechanism that the pigments released during biosorption have a major role in the removal of Cr(VI).
4 Conclusion
Organic compounds released during the biosorption of Cr(VI) using PP, GCS, and KW extracts were quantified using COD analysis. After treatment with 50 mg/l Cr(VI) solution, these extracts showed a heavy reduction of COD in PP compared to KW and GCS. TPC, antioxidant activity, and TFC were observed to be in the order of PP>GCS>KW, crediting the PP extract for better removal of the metal ion. A 100% removal of Cr(VI) solution with 20 and 50 mg/l and a >96% removal with 100 mg/l were attained with the PP extract. Metal chelation reaction occurred during the interaction between extract and chromium solution, which might be the reason for the non-detection of metal ion present in the medium. The higher efficiency of the PP extract establishes that it is a good, sustainable, eco-friendly solution for the removal of Cr(VI) from aqueous medium compared to GCS and KW.
Acknowledgments
The authors thank the director of NIT, Tiruchirappalli; Dr. S. Velmathi, Department of Chemistry, NIT, Tiruchirappalli; and head of Chemical Engineering Department and research scholars of the Chemical Engineering Department, NIT, Tiruchirappalli, especially Navamani Kartic D, Tamilmani J, Indulekha John, Bhuvaneswari G, and Selvakumar P for extending all facilities and support in completing this work.
References
[1] Khitous M, Salem Z, Halliche D. Chinese J. Chem. Eng. 2016, 24, 433–445.10.1016/j.cjche.2015.11.018Search in Google Scholar
[2] Kumar S, Meikap BC. Desalin Water Treat. 2013, 52, 3122–3132.10.1080/19443994.2013.801796Search in Google Scholar
[3] Mohan D, Singh KP, Singh VK. Ind. Eng. Chem. Res. 2005, 44, 1027–1042.10.1021/ie0400898Search in Google Scholar
[4] Mohan D, Pittman CU. J. Hazard Materm. 2006, 137, 762–811.10.1016/j.jhazmat.2006.06.060Search in Google Scholar PubMed
[5] Indian Standards Institute. IS 10500 2013, 10.Search in Google Scholar
[6] Kowalski KP. Chemistry of Advanced Environmental Purification Processes of Water. Elsevier: Denmark, 2014.Search in Google Scholar
[7] Indian Standards IS 10500 2012, Drinking water. p 1–3.Search in Google Scholar
[8] Gordon B, Callan P, Vickers C. WHO guidelines for drinking-water quality, WHO Chron. 2008, 38, 564.Search in Google Scholar
[9] Elangovan R, Philip L, Chandraraj K. Chem. Eng. J. 2008, 141, 99–111.10.1016/j.cej.2007.10.026Search in Google Scholar
[10] Elangovan R, Philip L, Chandraraj K. J. Hazard Mater. 2008, 152, 100–112.10.1016/j.jhazmat.2007.06.067Search in Google Scholar PubMed
[11] Shyamala Gowri S, Pavitha S, Vasantha K. Int. J. Pharm. Pharm. Sci. 2011, 3, 160–164.Search in Google Scholar
[12] Abdel-Ghani N, El-Chaghaby G. MNK J. Com. 2014, 3, 24–42.Search in Google Scholar
[13] Viuda-Martos M, Fernandez-Lopez J, Perez-Alvarez JA. Compr. Rev. Food Sci. Food Saf. 2010, 9, 635–654.10.1111/j.1541-4337.2010.00131.xSearch in Google Scholar PubMed
[14] Bansal M, Garg U, Singh D, Garg VK. J. Hazard Mater. 2009, 162, 312–320.10.1016/j.jhazmat.2008.05.037Search in Google Scholar PubMed
[15] Vargas-Morales JM, Bautista-Mata D, Cárdenas-González JF, Martínez-Juárez VM, Acosta-Rodríguez I. Online 2012, 2012, 19–24.10.4236/ojinm.2012.23003Search in Google Scholar
[16] Huang K, Xiu Y, Zhu H. Int. J. Environ. Sci. Technol. 2015, 12, 2485–2492.10.1007/s13762-014-0650-8Search in Google Scholar
[17] American Public Health Association. Standard Methods for the Examination of Water and Wastewater, 18th ed., American Public Health Association: Washington DC, 1992.Search in Google Scholar
[18] Madaan R, Kumar S, Bansal G, Sharma A. Indian J. Pharm. Sci. 2011, 73, 666.10.4103/0250-474X.100242Search in Google Scholar PubMed PubMed Central
[19] Shah RK, Yadav RNS. Global J. Bio-Sci. Biotechnol. 2015, 4, 81–84.Search in Google Scholar
[20] Aksoy L, Kolay E, Aĝilönü Y, Aslan Z, Kargioĝlu M. Saudi J. Biol. Sci. 2013, 20, 235–239.10.1016/j.sjbs.2013.02.003Search in Google Scholar PubMed PubMed Central
[21] Kalita P, Barman TK, Pal TK, Kalita R. J. Drug Deliv. Ther. 2013, 3, 33–37.Search in Google Scholar
[22] Sahu R, Saxena J. Int. J. Pharm. Sci. Rev. Res. 2013, 21, 24–26.Search in Google Scholar
[23] Al-rawahi AS, Edwards G, Al-sibani M, Al-thani G, Al-harrasi AS, Rahman MS. Eur. J. Med. Plants 2014, 4, 315–33.10.9734/EJMP/2014/6417Search in Google Scholar
[24] Balasundram N, Sundram K, Samman S. Food Chem. 2006, 99, 191–203.10.1016/j.foodchem.2005.07.042Search in Google Scholar
[25] Rodrigues S, Pinto GAS. J. Food Eng. 2007, 80, 869–872.10.1016/j.jfoodeng.2006.08.009Search in Google Scholar
[26] Dave PN, Bhandari J. Int. J. Chem. Stud. 2013, 1, 181–196.Search in Google Scholar
[27] Mathew S, Abraham TE, Zakaria ZA. J. Food Sci. Technol. 2015, 52, 5790–5798.10.1007/s13197-014-1704-0Search in Google Scholar PubMed PubMed Central
[28] Shahidi F, Janitha PK, Wanasundara PD. Crit. Rev. Food Sci. Nutr. 1992, 32, 67–103.10.1080/10408399209527581Search in Google Scholar PubMed
[29] Aloqbi A, Omar U, Yousr M, Grace M, Lila A. Nat. Sci. 2016, 8, 235–246.Search in Google Scholar
©2019 Walter de Gruyter GmbH, Berlin/Boston
This work is licensed under the Creative Commons Attribution 4.0 Public License.
Articles in the same Issue
- Regular Articles
- Studies on the preparation and properties of biodegradable polyester from soybean oil
- Flow-mode biodiesel production from palm oil using a pressurized microwave reactor
- Reduction of free fatty acids in waste oil for biodiesel production by glycerolysis: investigation and optimization of process parameters
- Saccharin: a cheap and mild acidic agent for the synthesis of azo dyes via telescoped dediazotization
- Optimization of lipase-catalyzed synthesis of polyethylene glycol stearate in a solvent-free system
- Green synthesis of iron oxide nanoparticles using Platanus orientalis leaf extract for antifungal activity
- Ultrasound assisted chemical activation of peanut husk for copper removal
- Room temperature silanization of Fe3O4 for the preparation of phenyl functionalized magnetic adsorbent for dispersive solid phase extraction for the extraction of phthalates in water
- Evaluation of the saponin green extraction from Ziziphus spina-christi leaves using hydrothermal, microwave and Bain-Marie water bath heating methods
- Oxidation of dibenzothiophene using the heterogeneous catalyst of tungsten-based carbon nanotubes
- Calcined sodium silicate as an efficient and benign heterogeneous catalyst for the transesterification of natural lecithin to L-α-glycerophosphocholine
- Synergistic effect between CO2 and H2O2 on ethylbenzene oxidation catalyzed by carbon supported heteropolyanion catalysts
- Hydrocyanation of 2-arylmethyleneindan-1,3-diones using potassium hexacyanoferrate(II) as a nontoxic cyanating agent
- Green synthesis of hydratropic aldehyde from α-methylstyrene catalyzed by Al2O3-supported metal phthalocyanines
- Environmentally benign chemical recycling of polycarbonate wastes: comparison of micro- and nano-TiO2 solid support efficiencies
- Medicago polymorpha-mediated antibacterial silver nanoparticles in the reduction of methyl orange
- Production of value-added chemicals from esterification of waste glycerol over MCM-41 supported catalysts
- Green synthesis of zerovalent copper nanoparticles for efficient reduction of toxic azo dyes congo red and methyl orange
- Optimization of the biological synthesis of silver nanoparticles using Penicillium oxalicum GRS-1 and their antimicrobial effects against common food-borne pathogens
- Optimization of submerged fermentation conditions to overproduce bioethanol using two industrial and traditional Saccharomyces cerevisiae strains
- Extraction of In3+ and Fe3+ from sulfate solutions by using a 3D-printed “Y”-shaped microreactor
- Foliar-mediated Ag:ZnO nanophotocatalysts: green synthesis, characterization, pollutants degradation, and in vitro biocidal activity
- Green cyclic acetals production by glycerol etherification reaction with benzaldehyde using cationic acidic resin
- Biosynthesis, characterization and antimicrobial activities assessment of fabricated selenium nanoparticles using Pelargonium zonale leaf extract
- Synthesis of high surface area magnesia by using walnut shell as a template
- Controllable biosynthesis of silver nanoparticles using actinobacterial strains
- Green vegetation: a promising source of color dyes
- Mechano-chemical synthesis of ammonia and acetic acid from inorganic materials in water
- Green synthesis and structural characterization of novel N1-substituted 3,4-dihydropyrimidin-2(1H)-ones
- Biodiesel production from cotton oil using heterogeneous CaO catalysts from eggshells prepared at different calcination temperatures
- Regeneration of spent mercury catalyst for the treatment of dye wastewater by the microwave and ultrasonic spray-assisted method
- Green synthesis of the innovative super paramagnetic nanoparticles from the leaves extract of Fraxinus chinensis Roxb and their application for the decolourisation of toxic dyes
- Biogenic ZnO nanoparticles: a study of blueshift of optical band gap and photocatalytic degradation of reactive yellow 186 dye under direct sunlight
- Leached compounds from the extracts of pomegranate peel, green coconut shell, and karuvelam wood for the removal of hexavalent chromium
- Enhancement of molecular weight reduction of natural rubber in triphasic CO2/toluene/H2O systems with hydrogen peroxide for preparation of biobased polyurethanes
- An efficient green synthesis of novel 1H-imidazo[1,2-a]imidazole-3-amine and imidazo[2,1-c][1,2,4]triazole-5-amine derivatives via Strecker reaction under controlled microwave heating
- Evaluation of three different green fabrication methods for the synthesis of crystalline ZnO nanoparticles using Pelargonium zonale leaf extract
- A highly efficient and multifunctional biomass supporting Ag, Ni, and Cu nanoparticles through wetness impregnation for environmental remediation
- Simple one-pot green method for large-scale production of mesalamine, an anti-inflammatory agent
- Relationships between step and cumulative PMI and E-factors: implications on estimating material efficiency with respect to charting synthesis optimization strategies
- A comparative sorption study of Cr3+ and Cr6+ using mango peels: kinetic, equilibrium and thermodynamic
- Effects of acid hydrolysis waste liquid recycle on preparation of microcrystalline cellulose
- Use of deep eutectic solvents as catalyst: A mini-review
- Microwave-assisted synthesis of pyrrolidinone derivatives using 1,1’-butylenebis(3-sulfo-3H-imidazol-1-ium) chloride in ethylene glycol
- Green and eco-friendly synthesis of Co3O4 and Ag-Co3O4: Characterization and photo-catalytic activity
- Adsorption optimized of the coal-based material and application for cyanide wastewater treatment
- Aloe vera leaf extract mediated green synthesis of selenium nanoparticles and assessment of their In vitro antimicrobial activity against spoilage fungi and pathogenic bacteria strains
- Waste phenolic resin derived activated carbon by microwave-assisted KOH activation and application to dye wastewater treatment
- Direct ethanol production from cellulose by consortium of Trichoderma reesei and Candida molischiana
- Agricultural waste biomass-assisted nanostructures: Synthesis and application
- Biodiesel production from rubber seed oil using calcium oxide derived from eggshell as catalyst – optimization and modeling studies
- Study of fabrication of fully aqueous solution processed SnS quantum dot-sensitized solar cell
- Assessment of aqueous extract of Gypsophila aretioides for inhibitory effects on calcium carbonate formation
- An environmentally friendly acylation reaction of 2-methylnaphthalene in solvent-free condition in a micro-channel reactor
- Aegle marmelos phytochemical stabilized synthesis and characterization of ZnO nanoparticles and their role against agriculture and food pathogen
- A reactive coupling process for co-production of solketal and biodiesel
- Optimization of the asymmetric synthesis of (S)-1-phenylethanol using Ispir bean as whole-cell biocatalyst
- Synthesis of pyrazolopyridine and pyrazoloquinoline derivatives by one-pot, three-component reactions of arylglyoxals, 3-methyl-1-aryl-1H-pyrazol-5-amines and cyclic 1,3-dicarbonyl compounds in the presence of tetrapropylammonium bromide
- Preconcentration of morphine in urine sample using a green and solvent-free microextraction method
- Extraction of glycyrrhizic acid by aqueous two-phase system formed by PEG and two environmentally friendly organic acid salts - sodium citrate and sodium tartrate
- Green synthesis of copper oxide nanoparticles using Juglans regia leaf extract and assessment of their physico-chemical and biological properties
- Deep eutectic solvents (DESs) as powerful and recyclable catalysts and solvents for the synthesis of 3,4-dihydropyrimidin-2(1H)-ones/thiones
- Biosynthesis, characterization and anti-microbial activity of silver nanoparticle based gel hand wash
- Efficient and selective microwave-assisted O-methylation of phenolic compounds using tetramethylammonium hydroxide (TMAH)
- Anticoagulant, thrombolytic and antibacterial activities of Euphorbia acruensis latex-mediated bioengineered silver nanoparticles
- Volcanic ash as reusable catalyst in the green synthesis of 3H-1,5-benzodiazepines
- Green synthesis, anionic polymerization of 1,4-bis(methacryloyl)piperazine using Algerian clay as catalyst
- Selenium supplementation during fermentation with sugar beet molasses and Saccharomyces cerevisiae to increase bioethanol production
- Biosynthetic potential assessment of four food pathogenic bacteria in hydrothermally silver nanoparticles fabrication
- Investigating the effectiveness of classical and eco-friendly approaches for synthesis of dialdehydes from organic dihalides
- Pyrolysis of palm oil using zeolite catalyst and characterization of the boil-oil
- Azadirachta indica leaves extract assisted green synthesis of Ag-TiO2 for degradation of Methylene blue and Rhodamine B dyes in aqueous medium
- Synthesis of vitamin E succinate catalyzed by nano-SiO2 immobilized DMAP derivative in mixed solvent system
- Extraction of phytosterols from melon (Cucumis melo) seeds by supercritical CO2 as a clean technology
- Production of uronic acids by hydrothermolysis of pectin as a model substance for plant biomass waste
- Biofabrication of highly pure copper oxide nanoparticles using wheat seed extract and their catalytic activity: A mechanistic approach
- Intelligent modeling and optimization of emulsion aggregation method for producing green printing ink
- Improved removal of methylene blue on modified hierarchical zeolite Y: Achieved by a “destructive-constructive” method
- Two different facile and efficient approaches for the synthesis of various N-arylacetamides via N-acetylation of arylamines and straightforward one-pot reductive acetylation of nitroarenes promoted by recyclable CuFe2O4 nanoparticles in water
- Optimization of acid catalyzed esterification and mixed metal oxide catalyzed transesterification for biodiesel production from Moringa oleifera oil
- Kinetics and the fluidity of the stearic acid esters with different carbon backbones
- Aiming for a standardized protocol for preparing a process green synthesis report and for ranking multiple synthesis plans to a common target product
- Microstructure and luminescence of VO2 (B) nanoparticle synthesis by hydrothermal method
- Optimization of uranium removal from uranium plant wastewater by response surface methodology (RSM)
- Microwave drying of nickel-containing residue: dielectric properties, kinetics, and energy aspects
- Simple and convenient two step synthesis of 5-bromo-2,3-dimethoxy-6-methyl-1,4-benzoquinone
- Biodiesel production from waste cooking oil
- The effect of activation temperature on structure and properties of blue coke-based activated carbon by CO2 activation
- Optimization of reaction parameters for the green synthesis of zero valent iron nanoparticles using pine tree needles
- Microwave-assisted protocol for squalene isolation and conversion from oil-deodoriser distillates
- Denitrification performance of rare earth tailings-based catalysts
- Facile synthesis of silver nanoparticles using Averrhoa bilimbi L and Plum extracts and investigation on the synergistic bioactivity using in vitro models
- Green production of AgNPs and their phytostimulatory impact
- Photocatalytic activity of Ag/Ni bi-metallic nanoparticles on textile dye removal
- Topical Issue: Green Process Engineering / Guest Editors: Martine Poux, Patrick Cognet
- Modelling and optimisation of oxidative desulphurisation of tyre-derived oil via central composite design approach
- CO2 sequestration by carbonation of olivine: a new process for optimal separation of the solids produced
- Organic carbonates synthesis improved by pervaporation for CO2 utilisation
- Production of starch nanoparticles through solvent-antisolvent precipitation in a spinning disc reactor
- A kinetic study of Zn halide/TBAB-catalysed fixation of CO2 with styrene oxide in propylene carbonate
- Topical on Green Process Engineering