Chemomertic Risk Assessment of Soil Pollution
-
Miroslava Nedyalkova
 and
Vasil Simeonov
and
Vasil Simeonov

Abstract
In this study, an interpretation and modeling of the soil quality by monitoring data using an intelligent data analysis is presented. On an annual average, values of 12 soil surface chemical parameters as input variables were determined at 35 sampling sites as objects of the study in the region of Burgas, Bulgaria are used as input data set. Cluster analysis (hierarchical and non hierarchical methods abbreviated as HCA and K-means, respectively) and the principal components analysis (PCA) are used as chemometric tools for data interpretation, classification and modeling. Additionally, principal components regression analysis (APCS approach) is introduced to determine the contribution of each identified by PCA latent factor to the total concentration of the chemical parameters. The formation of different patterns of similarity between the variables or the objects of the study by cluster analysis is interpreted with respect to the risk of pollution or spatial conditions. The input data set structure is analyzed by PCA in order to determine the most significant factors responsible for the data structure. Four major patterns of similarity between the chemical parameters measured are found to define soil quality in the region related to industrial and agricultural activity in the region since the objects are separated into two patterns corresponding to each geographical location of the sampling sites. Analogous results were obtained by the use of PCA where the level of explanation of the data set structure is quantitatively assessed by the total explained variance of the system. The apportionment model indicated that the contribution of latent factors (sources of pollution) to the total chemical concentration of the species tested – pH, soil nutrition components, total and organic carbon content and toxic metals.
1 Introduction
The risk assessment and management of soil contamination is usually performed by regular monitoring of different soil parameters at specific sampling sites by forming a sampling net for a certain region of interest. The results obtained by chemical analysis are then compared with the threshold values introduced as allowable levels by national or international directives. Thus, the problem solving and decision making in soil contamination issues is often based on comparison to single set of results solving a particular problem concerning the soil contamination or respective decision making, which is based solely on single set of results instead on classification and modeling of the monitoring output for the region of interest.
The application of multivariate statistical approaches to the soil quality problems makes it possible to reveal hidden relationships within the monitoring data sets both between the sampling locations or between the features characterizing the sites of sampling. This new type of information gets possible as the chemometric (multivariate statistical) approach treats the problem as a system depending simultaneously on many parameters. It becomes possible to find and interpret seasonal, spatial and pollutant factors leading to formation of patterns of similarity in the monitoring the data matrix. In this way, the identification of pollution sources and natural impacts characteristic for the region of study becomes easy and reliable. The modeling of the environmental effect of different factors is achieved and it improves decision making and problem solving. This approach helps in many environmental studies using intelligent data analysis [1, 2, 3, 4, 5, 6, 7, 8, 9, 10] just to mention few out of a large selection.
The major goal of the present study is to assess the soil quality of a region in south-eastern Bulgaria by the application multivariate statistics (cluster analysis, principal components analysis, principal components regression) in order to find pollution and natural impacts on the soil environment in a region located near to the Bulgarian Black Sea costal line characterized by intensive industrial activity and agriculture.
2 Materials and Methods
2.1 Sampling and chemical analysis
The sampling was performed at monthly intervals in 2017. A Total number of 35 locations of the National soil sampling net from the region of Burgas, Bulgaria were chosen. These locations as their names and abbreviations used in the data analysis are given below:
(Jasna Poljana (JP), Drachevo (Dra), Svoboda (Svo), Sarnevo (Sar), Sozopol (Soz), Rudina (Rud), Rechnica (Rec), Biala (Bja), Marinka (Mar), Maglen (Mag), Karageorgievo (Kar), Zvezdets (Zve), Vizitsa (Viz), Kosti (Kos), Malko Tarnovo (MT), Vratitsa (Vra), Krushevets (Kru), Medovo (Med), Kozichino (Koz), Polski Izvor (Piz), Smolnik (Smo), Karnobat (Krb), Podvis (Pod), Terziisko (Ter), Luliakovo (Lul), Topuzevo (Top), Sedlarevo (Sed), Kotel (Kot), Sadovo (Sad), Slivovo (Sli), Zornitsa (Zor), Prohod (Pro), Raklitsa (Rak), Kipilovo (Kip), Samotinovo (Sam)).
The sampling locations are presented in detail on a map (Figure 1).
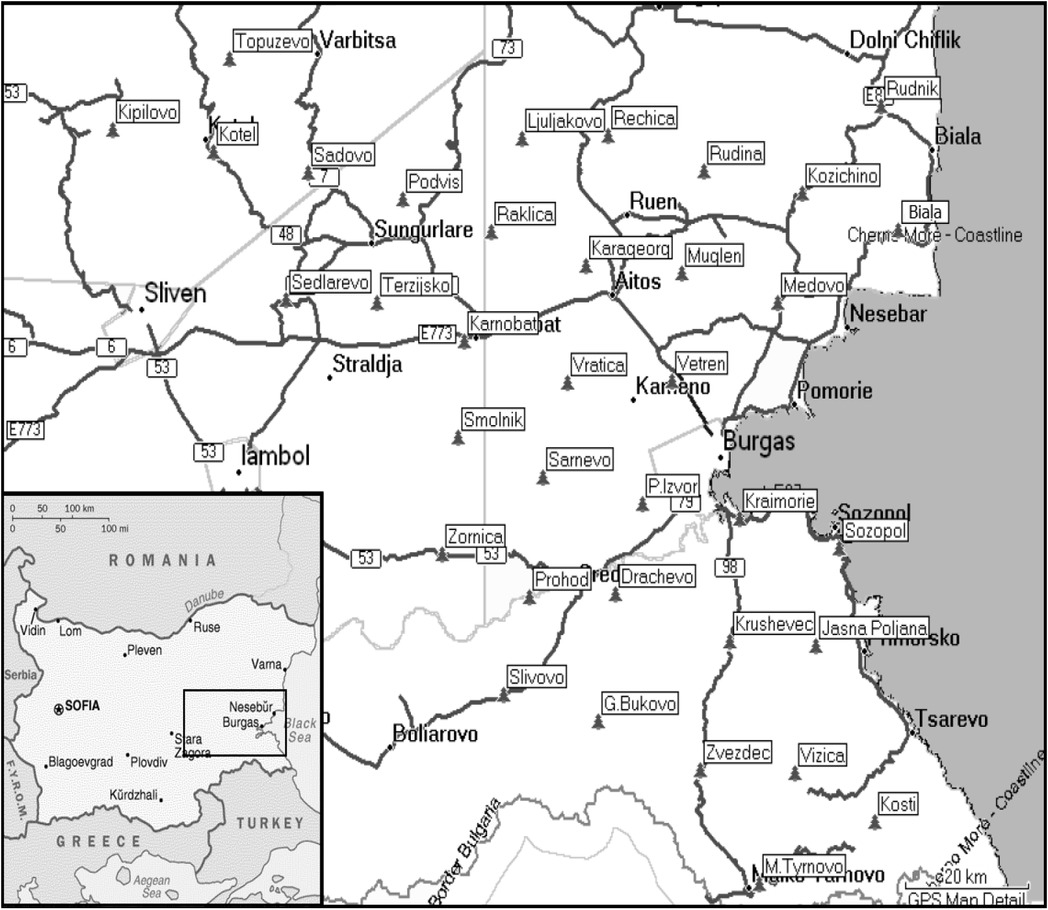
Sampling site locations.
The procedures for soil sampling, sample preparation and chemical analysis are carried out according to ISO directives by an accredited laboratory from the regional environmental protection agency [11, 12, 13, 14, 15, 16]. The sampling was performed only for the surface soil layer (0 – 20 cm). The total number of samples collected for analysis was 70.
To determine the total content of the metals of interest (As, Cd, Pb, Ni, Cr, Cu, Zn) and phosphorus content, a fraction of a grain size less than 65 mm was used, for pH, total nitrogen (Ntot), and total organic carbon (TOC), a coarse fraction of less than 2 mm was used .
Validated methods created at the Regional analytical laboratory of the Ministry of the Environment and Waters in City of Burgas were applied for the determination of mass contents of As, Cd, Pb, Ni, Cr, Cu, Zn and P. The methods are verified through participation in interlaboratory comparative laboratory tests.
The soil samples were mineralized with aqua regia in a microwave oven at 180oC for 15 min. Metаls were determined after appropriate dilution by ICP MS „Agilent 7500“ in the standard mode of measurement. Total phosphorus content was determined by spectrometric vanadate-molibdate reagent using „Agilent“ UV-VIS Spectroscopy system diode array.
Quality of results was controlled by analysis of Certified Reference Materials NIST 2709, BCR 142, having a similar matrix as the studied soils. The recovery of following elements was obtained: As (101-110%), Cd (97-100%), Pb (90-101%), Ni (93-98%), Cr (78%), Cu (94-99%), Zn (95-101%) and Р (90-110%).
The analytical determination of the other parameters needed for the study (pH, total N and TOC) followed the standardized methods. pH was determined in aqueous suspension (1:2.5) with a microprocessor pH meter „pH 3000“ WTW. TC and the TOC were measured by an instrumental method with total carbon/total nitrogen analyzer „Shimadzu“. The content of total nitrogen was determined by modified Kjeldahl method in accordance with ISO. Quality control of results is performed by CRM NCS DC 85104 and the recovery obtained was between 105-108% for Ntot and 90-98% for TOC, recalculated as an organic substance.
2.2 Intelligent data analysis methods
Following chemometric methods were used in the present study: cluster analysis (hierarchical cluster analysis and nonhierarchical cluster analysis by K-means), principal components analysis and principal components regression. Correlation analysis was also applied in the starting stage of the chemometric study. These methods are well known and documented to need an extended description [17,18]. Just some basic principles of the methods used are given below.
The major aim of the hierarchical agglomerative cluster analysis is to spontaneously separate the data from the input data sets into patterns of similarity (clusters) for the objects of the study (sampling locations in our case) in the n-dimensional space of the variables (chemical concentrations of the soil quality parameters. The same spontaneous clustering could be applied to the variables which could form clusters in the space of objects. In general, the hierarchical clustering includes normalization of the raw input data to dimensionless units in order to avoid the impact of the different parameter range; calculation of the similarity between the objects by application of some distance parameter, e.g. Euclidean distance or correlation coefficient; finding a linkage between the objects using different linkage options; plotting the results such as a tree-like structure called dendrogram; formation of the clusters; testing the statistical significance of the patterns formed; interpretation of the clusters either for objects or variables.
The nonhierarchical clustering approach is typically supervised pattern recognition technique. It allows the checking of a priori hypothesis in about a certain number of clusters both for objects and variables. It is also a classified approach serving as an option to separate the data sets into preliminary given number of patterns. The specific part of the analysis is to establish a reasonable number of a priori sought clusters and to interpret their meaning, respectively. K-means algorithm is well developed nonhierarchical clustering procedure.
Principal components analysis is a typical display method which makes it possible to reduce the dimensionality of the space of the variables in the direction of the highest variance of the system. It introduces new variables being linear combinations of the input old variables. The new variables are called latent factors or principal components. The interpretation of the latent factors leads to gaining useful information about specific relationships within the data set. The results of the analysis are usually presented as two outputs - factor scores giving the new coordinates of the factor space with the location of the objects and factor loadings informing on the relationship between the variables. Only statistically significant loadings (> 0.70) are important for the modeling and interpretation procedure.
Each new principal component (latent factor) explains a certain part of the total variance of the system. Usually, the first principal component (PC1) explains the maximal part of the system variation and each additional PC has a lesser contribution to the variance explanation.
A reliable model requires normally such a number of PCs, so that over 75% of the total variation to be explained. In case of presented modeling the Varimax rotated PCA solution was used, that allows a better explanation of the system in consideration. It strengthens the role of the latent factors with higher impact on the variation explanation and diminishes the role of PCs with lower impact.
The principal components regression is a modeling approach which allows it to carry out regression with respect to the impact of several independent variables (principal components in this case) on a dependent variable (e.g. total concentration of any of the chemical parameters used). Since the PCA identifies possible sources of pollution in the shape of latent factors, then the effect of each one of them on the total concentration of the species included in the study is possible. This is a model of source apportionment. In our study we use the absolute principal components score (APCS) methods described by Thurston and Spengler [19]. It is documented that other apportionment approaches are known (Target Transformation Factor Analysis, Positive Matrix Factorization, Unmix, Chemical Mass Balance etc, but they are developed mainly for air pollution modeling). The Thurston – Spengler apportionment proved its importance for source apportionment in water and soil studies.
All calculations were performed by the use of the software package STATISTICA 7.0.
Ethical approval: The conducted research is not related to either human or animal use.
3 Results and Discussion
The input data set consists of 35 objects (sampling locations) described by 12 variables (annual averages of the chemical soil parameters) or [35x12].
In Table 1 the basic statistics of the input data is presented.
Basic statistics of the input data (except for pH (log units), TC and TOC given as %, all other variables are in mg/kg).
| Variable | Mean | Median | Minimum | Maximum | Range | Variance | Std.Dev. |
|---|---|---|---|---|---|---|---|
| pH | 6.91 | 6.90 | 5.45 | 8.25 | 2.79 | 0.56 | 0.75 |
| N total | 1564.65 | 1569.33 | 794.66 | 2856.00 | 2061.33 | 268553 | 518.22 |
| P total | 744.87 | 728.58 | 268.16 | 1920.83 | 1652.67 | 110238 | 332.02 |
| TC, % | 2.28 | 2.26 | 0.88 | 4.42 | 3.53 | 1 | 0.74 |
| TOC, % | 1.98 | 1.96 | 0.93 | 3.73 | 2.80 | 0.1 | 0.58 |
| As | 7.55 | 7.03 | 3.59 | 16.63 | 13.04 | 8 | 2.91 |
| Cu | 44.86 | 41.25 | 11.76 | 97.42 | 85.65 | 467 | 21.62 |
| Cr | 71.87 | 43.84 | 18.10 | 230.42 | 212.32 | 3193 | 56.50 |
| Ni | 37.63 | 34.93 | 9.44 | 85.19 | 75.75 | 389 | 19.73 |
| Cd | 0.40 | 0.41 | 0.22 | 0.63 | 0.40 | 0.1 | 0.10 |
| Zn | 64.03 | 62.87 | 30.58 | 115.03 | 84.45 | 319 | 17.87 |
| Pb | 20.78 | 20.18 | 11.41 | 37.42 | 26.01 | 34 | 5.82 |
The descriptive statistics table indicates the significant differences in the variable dimensions and lack of normal distribution.
In the first step of the intelligent data analysis correlation analysis was performed in order to get an idea about the possible stochastic relationships between the variables. In Table 2 the correlation matrix for the data set is given.
Correlation matrix [12x12] (statistically significant correlations are marked).
| pH | N tot | P tot | TC, % | TOC, % | As | Cu | Cr | Ni | Cd | Zn | Pb | |
|---|---|---|---|---|---|---|---|---|---|---|---|---|
| pH | 1.00 | |||||||||||
| N total | 0.44 | 1.00 | ||||||||||
| P total | 0.52 | 0.42 | 1.00 | |||||||||
| TC, % | 0.52 | 0.72 | 0.45 | 1.00 | ||||||||
| TOC, % | 0.37 | 0.73 | 0.40 | 0.89 | 1.00 | |||||||
| As | 0.01 | 0.13 | -0.21 | 0.04 | -0.14 | 1.00 | ||||||
| Cu | 0.26 | 0.29 | 0.29 | 0.18 | 0.29 | -0.02 | 1.00 | |||||
| Cr | 0.15 | 0.41 | 0.35 | 0.33 | 0.57 | -0.10 | 0.41 | 1.00 | ||||
| Ni | 0.28 | 0.46 | 0.38 | 0.33 | 0.50 | 0.08 | 0.55 | 0.75 | 1.00 | |||
| Cd | 0.40 | 0.44 | 0.25 | 0.36 | 0.43 | 0.38 | 0.37 | 0.70 | 0.69 | 1.00 | ||
| Zn | 0.34 | 0.49 | 0.17 | 0.34 | 0.30 | 0.13 | 0.59 | 0.05 | 0.48 | 0.24 | 1.00 | |
| Pb | 0.16 | 0.43 | 0.13 | 0.35 | 0.36 | 0.30 | 0.50 | 0.19 | 0.50 | 0.27 | 0.58 | 1.00 |
Table 2 reveals the good correlation between different variables (pH with N-tot, P-tot, carbon species, Cd, Zn; N-tot with most of the metals and carbon species; Cu with most metals).
The presence of correlation could be indication for the common origin of the correlated species, respectively, for formation of common sources of pollution or of natural origin.
3.1 Cluster analysis
The exploratory data analysis starts with hierarchical cluster analysis. The spontaneous grouping into patterns of similarity (both for sampling locations and chemical variables) gives important clues for the spatial similarity between sampling locations and about the possible common origin of the chemical species.
In Figures 2 and 3 the hierarchical dendrograms (tree diagrams for z-transformed input data, squared Euclidean distances as similarity measure, Ward’s method of linkage and Sneath’s criterion for cluster significance) for
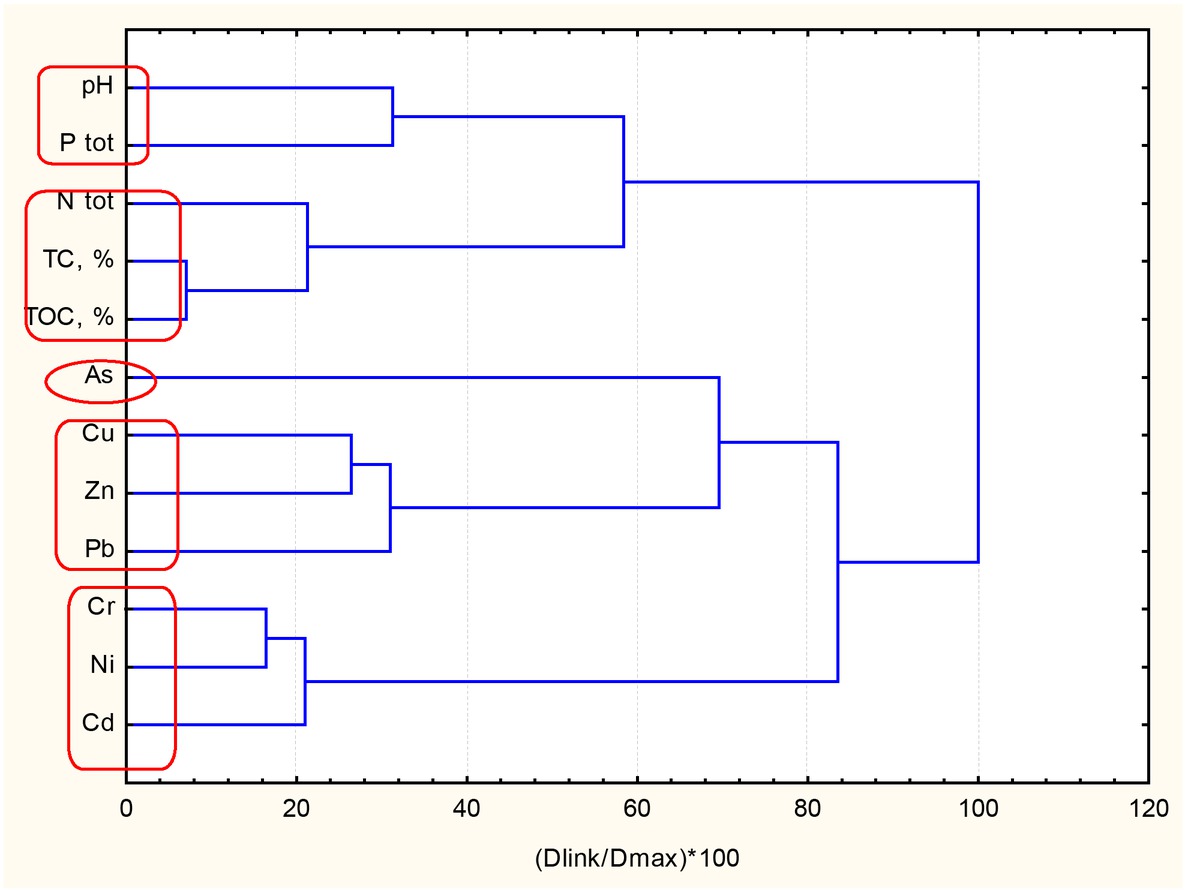
Tree diagram for 12 variables.
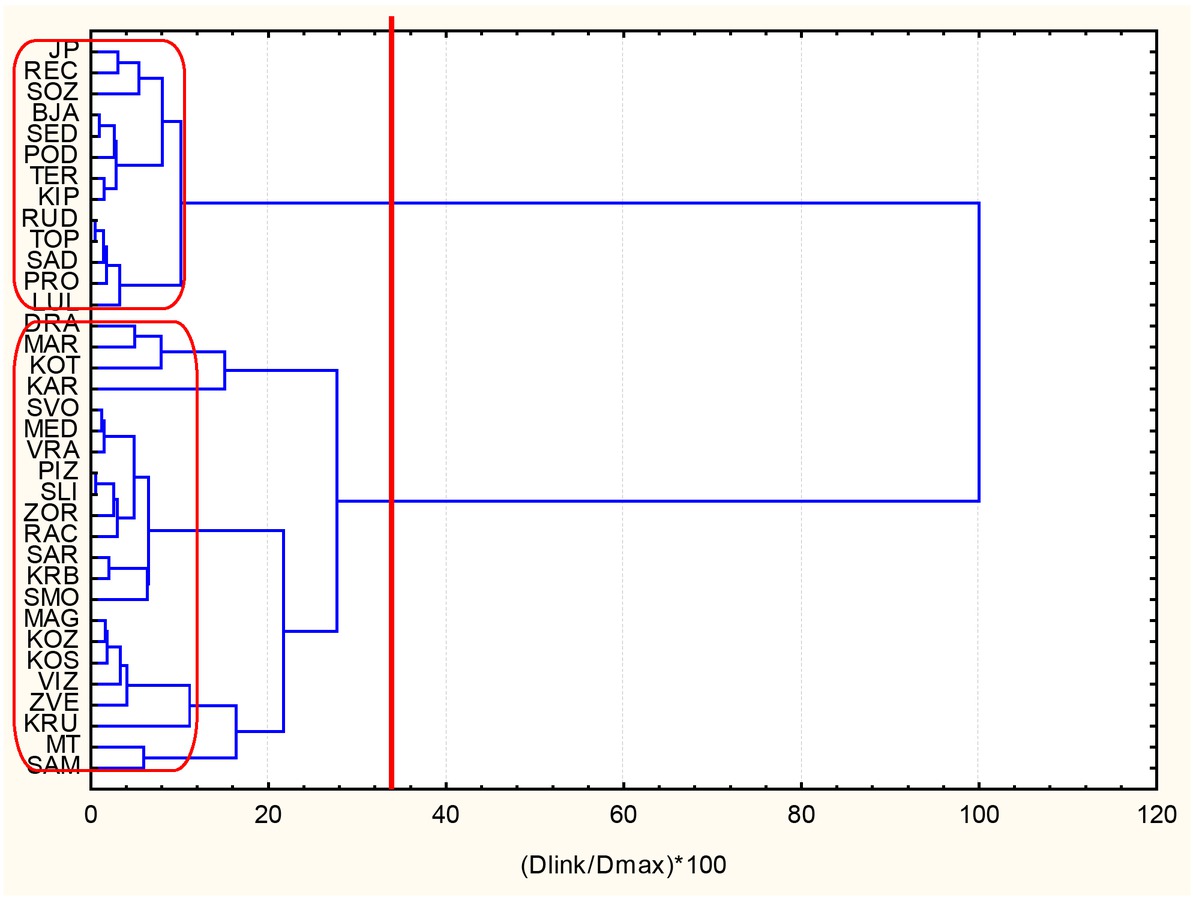
Tree diagram for 35 sampling locations.
clustering of variables (Figure 2) and objects (Figure 3) are presented.
Four significant clusters are seen in Figure 2:
K1: Cd, Ni, Cr
K2: Zn, Cu, Pb
K3 : TC, TOC, N-tot
K4: pH, P-tot
It could be concluded that As is an outlier since it does not link closely to any of the other metals.
This variable linkage indicates that in the region of interest are existing probably several source affecting the soil quality: industrial anthropogenic sources (typical emitters for Cd, Ni, Cr related also with oil burning and refinery activities); aerosol sedimentation sources (pollution by Zn, Cu, Pb – constituents of traffic emissions, rock erosion material, natural soil content); organic material sources (correlation between organic species and total nitrogen) ensuring the soil fertility and soil acidity sources as a results of fertilization activities.
Arsenic has different sources as soil component – both natural (enhanced As content in the regional soils) and anthropogenic (component of herbicides).
Only two patterns of similarity are formed by the hierarchical clustering of the sampling location sites:
K1: DRA, MAR, KOT, KAR, SVO, MED, VRA, PIZ, SLI, ZOR, RAC, SAR, KRB, SMO, MAG, KOZ, KOS, VIZ, ZVE, KRU, MT, SAM
K2: JP, REC, SOZ, BJA, SED, POD, TER, KIP. RUD, TOP, SAD, PRO, LUL
The cluster K1 forms the pattern of sites with rural character and sites which are impacted by anthropogenic industrial sources (near to City of Burgas with oil refinery and heavy industry and traffic). The other pattern of similarity K2 includes sites which are either close to the southern coastal line of the region or the mountainous part. They represent locations with higher level of soil quality since they are tourist resorts or sites with low industrial impact,
These initial results from the hierarchical clustering have lead to two expert hypotheses:
The linkage of the soil quality chemical descriptors for the region of interest leads to definition of four patterns of variables similarly related to the sources of industrial pollution; airborne particle sedimentation; organic impact: soil acidity. It would be interesting to clarify the specific behavior of arsenic as soil quality descriptor as pointed out by hierarchical cluster analysis
Separation of the sampling locations into two classes of similarity related to the geographical position of the sites and the vicinity of additional factors such as industrial and agricultural activity in any of the specific spatial positions – close to the sea side, mountainous or rural region.
The application of non hierarchical clustering (K-means mode) as supervised pattern recognition method makes it possible to verify the expert hypotheses and the results from the spontaneous hierarchical clustering.
K-means clustering of the chemical variables was performed for 5 a priori selected clusters:
Members of cluster 1: Cr, Ni, Cd
Members of cluster 2: N-tot, TC, TOC
Members of cluster 3: pH, P-tot
Members of cluster 4: Cu, Zn, Pb
In cluster 5 only As is found as an object very different from the clusters 1 – 4.
Thus, the results confirm completely the results shown in Figure 2 with four major clusters and one outlier.
The second a priory hypothesis is related to the patterns formed between the sampling sites.
It is expected that the class separation will be in the soil quality for locations impacted by anthropogenic influence and atmospheric depositions and locations with less level of overall pollution from anthropogenic sources (spatially separated from the industrially affected sites). The class separation will be with respect to the differences in the soil quality for locations impacted by anthropogenic influence and atmospheric depositions.
K-means clustering of sampling sites with a priori requirement for formation of two clusters gave the following results:
Members of cluster 1(13 sites): JP, RUD, SOZ, REC, BJA, POD, LUL, TOP, SED, TER, SAD, PRO, KIP
Members of cluster 2 (22 sites): DRA, SVO, SAR, MAR, MAG, KAR, ZVE, VIZ, KOS, MT, VRA, KRU, MED, KOZ, PIZ, SMO, KRB, KOT, SLI, ZOR, RAC, SAM
Again, the same distribution as in hierarchical clustering is confirmed. The conditional classification of the sampling locations into classes “industrial rural” (K2) and “mountainous coastal” (K1) is proven.
In Figure 4 the average values (z-standardized input data) that those for K2 of each chemical variable for each one of the identified patterns of similarity are shown.
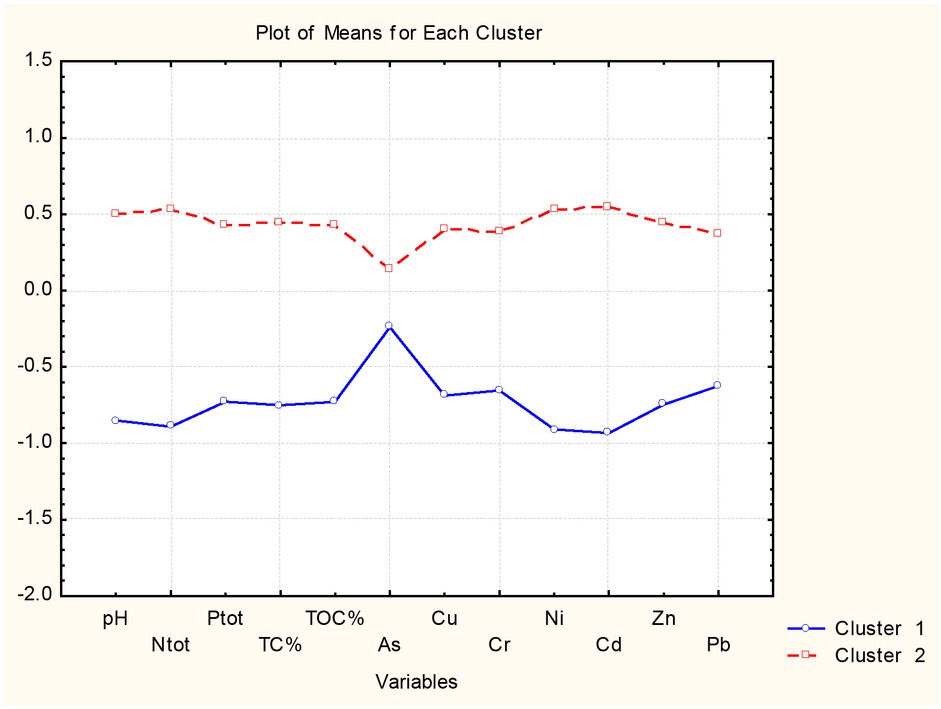
Plot of mean values for each chemical parameter for each of the clusters found.
It is readily seen that the two patterns of locations are clearly separated by the levels of the chemical variables. All average values for K2 are significantly higher than those of K1. This is convenient proof for the higher industrial pollution of the soil in the linked in K2 sampling sites. The levels for all tested chemical components for K1 are lower (as mean values). The mountainous coastal locations (tourist and recreation activities and low scale industries) are free of pollution as compared to the industrially affected locations.
As expected, only arsenic reveals a more special behavior. The industrially impacted areas have an average minimum level as compared to the relatively constant averages for the rest of chemical descriptors (K 2). On contrary, the arsenic levels for the locations in K1 indicate a local average maximum. Still the absolute average value of the industrially polluted pattern of sites are higher that of the non polluted pattern of sites. It might indicate that specific soil properties contribute to the formation of the total arsenic concentration for both patterns and not only anthropogenically influenced sources are responsible for the total As concentration. Some previous studies on the arsenic distribution in Bulgarian soils confirm that at many locations enhanced natural concentration of As is observed [20,21].
It is important to note that the difference between the average values for both clusters is statistically significant.
3.2 Principal components analysis
The input data set was also subject to principal components analysis (Varimax rotation mode of standardized values).
In Table 3 factor loadings for four identified latent factor which explain over 75% of the total variance of the system are presented.
Factor loadings (statically significant loadings are marked by bold).
| Variable | PC- 1 | PC- 2 | PC- 3 | PC- 4 |
|---|---|---|---|---|
| pH | 0.666 | 0.063 | 0.185 | -0.061 |
| N total | 0.785 | 0.226 | 0.274 | 0.142 |
| P total | 0.562 | 0.240 | 0.117 | -0.428 |
| TC | 0.925 | 0.123 | 0.095 | 0.063 |
| TOC | 0.803 | 0.365 | 0.113 | -0.091 |
| As | -0.022 | 0.067 | 0.117 | 0.930 |
| Cu | 0.047 | 0.386 | 0.775 | -0.210 |
| Cr | 0.221 | 0.927 | 0.024 | -0.153 |
| Ni | 0.220 | 0.770 | 0.466 | -0.013 |
| Cd | 0.286 | 0.801 | 0.120 | 0.347 |
| Zn | 0.285 | -0.024 | 0.864 | 0.071 |
| Pb | 0.227 | 0.128 | 0.749 | 0.283 |
| Expl. Var % | 26.60 | 21.10 | 19.20 | 11.30 |
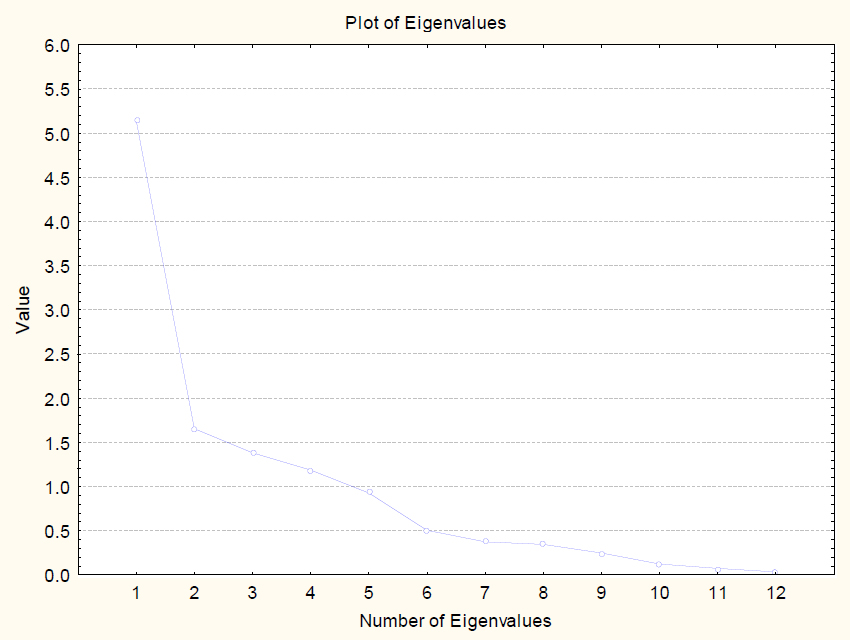
In Figure 5 the scree plot of the eigenvalues is presented. It is readily seen that four latent factors have eigenvalues higher than 1 and it explains the choice of 4 latent factors for data mining.
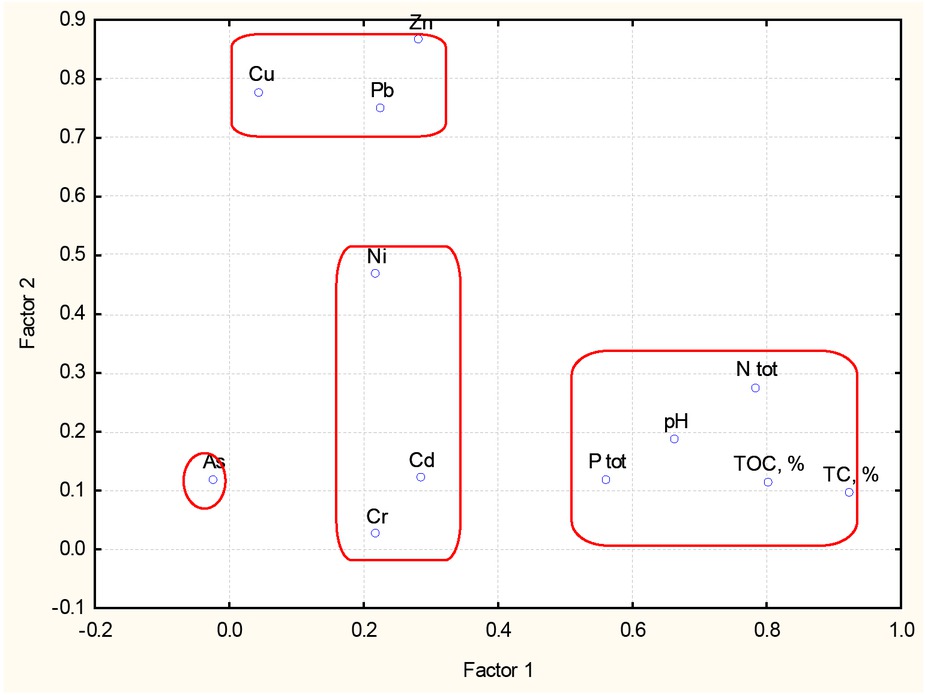
Figure 6 shows clearly the grouping of the chemical variables in the space of the first two principal components. From Table 3 and Figure 6 is readily seen that each one of the identified latent factors has its own physical meaning and the grouping confirms the results from cluster analysis.
PC1 (principal component 1) explains over 26% of the total variance and registers the good correlation between pH, P-tot, N-tot, TC and TOC. PC1 could be conditional named “nutrients and acidic” factor revealing the close linkage between soil nutrients, organic matter and pH of the soil. In fact, the same interpretation could be achieved by hierarchical cluster analysis (Figure 2) where the same chemical parameters could be considered as belonging to one and the same cluster if a cluster significance is chosen (2/3 Dmax instead of 1/3Dmax).
The second latent factor PC 2 explains over 21% of the total variance and indicates for the impact of a conditional “industrial” factor due to the high factor loadings of three chemical components – Cr, Ni, Cd [10, 20, 23, 26]. In the references cited the metal soil pollution sources are assumed to be of industrial origin – metal smelters, ore production, combustion processes. As already discussed, their close relationship is a sign for their common anthropogenic origin (source).
Next principal component PC 3 counts for explanation of more than 19% of the total variance of the system and represents the influence of aerosol sedimentation effects by strong correlation between Cu, Zn and Pb. The conditional name “aerosol sedimentation” factor corresponds to the role of this specific source on the soil quality.
Plot of eigenvalues.
Biplot for factor loadings (PC 1 vs PC 2).
The last latent factor PC 4 (over 11% explanation of the total variance) underlines the specific role of arsenic in assessment of the soil quality of the region. The only significant factor loading in PC 4 is that for As.
It is of substantial interest to determine the contribution of each identified latent factor to the formation of the total concentration of each of the chemical variables. This could be achieved by the apportioning procedure known as principal components regression (APCS approach of Thurston and Spengler). The results of the regression analysis are summarized in Table 4.
Source apportionment for the soil quality parameters in region of Burgas, Bulgaria (in %).
| Variable | Intercept | Nutrition-acidic source | Industrial source | Aerosol sedimentation source | As source | R2 |
|---|---|---|---|---|---|---|
| pH | 11.5 | 72.3 | - | 16.2 | - | 0.91 |
| N total | 4.0 | 81.1 | 5.2 | 6.4 | 3.3 | 0.83 |
| P total | 18.0 | 64.7 | 9.1 | 13.6 | 4.6 | 0.81 |
| TC | 6.3 | 81.2 | 12.4 | - | - | 0.88 |
| TOC | 5.4 | 84.3 | 10.3 | - | - | 0.86 |
| As | 12.8 | - | - | - | 87.2 | 0.84 |
| Cu | 10.5 | - | 10.6 | 79.9 | - | 0.86 |
| Cr | 8.2 | 10.4 | 81.4 | - | - | 0.81 |
| Ni | 6.5 | 3.8 | 76.8 | 12.9 | - | 0.89 |
| Cd | 2.6 | 8.6 | 75.5 | 9.1 | 4.2 | 0.90 |
| Zn | 12.8 | 5.8 | - | 81.4 | - | 0.82 |
| Pb | 8.8 | 9.1 | 7.3 | 69.2 | 5.6 | 0.79 |
The regression intercept indicated the unexplained contribution by the identified sources. The multiple correlation coefficient is a measure for the model validity (comparison of calculated by the model total concentrations and the experimentally found ones). The difference 1 – R2 is showing (in %) the value of the model prediction error. The error of prediction is between 9 and 21%.
The results of the intelligent data analysis carried out are in good agreement with the major conclusions of a series of similar studies dedicated to soil pollution and risk management in different countries [22, 23, 24, 25, 26, 27] performed recently.
4 Conclusion
The multivariate statistical data treatment made it possible to assess in a reliable way the risk of soil pollution in the region studied and to contribute for proper risk management and decision-making concerning soil quality.
The chemometric expertise revealed and quantitatively assessed four major possible sources of pollution in the region of Burgas, Bulgaria. These sources are related to the impact of industrial activity, soil specific properties and aerosol sedimentation processes. The respective apportionment regression models are suggested for quantitative description of the contribution of each identified source to the formation of the total chemical parameter concentrations used for monitoring of the soil quality.
Additionally, a spatial analysis of the sampling locations was performed showing the separation of the region sampling net into two patterns of similarity: industrially impacted area with higher level of pollution and relatively less polluted area of recreation locations close to the coastal line and locations from mountainous areas.
Acknowledgements
The authors would like to express their sincere gratitude to the Project Bulgarian Science Fund, DCOST 01/6 – 2017 for the financial support.
This work was supported by the project „Information and Communication Technologies for a Single Digital Market in Science, Education and Security“ of the Scientific Research Center, NIS-3317.
Conflict of interest
Authors declare no conflict of interest.
References
[1] Andrade J., Kubista M., Carlosena A., Prada D., 3-Way characterization of soils by procrustes rotation, matrix augmented principal components analysis and parallel factor analysis, Anal. Chim. Acta, 2007, 603, 20–29.10.1016/j.aca.2007.09.043Search in Google Scholar
[2] Angelov G.B., Heavy metal pollution in the Boatin Reserve (Bulgaria), Turk. J. Bot., 2008, 32, 155–160.Search in Google Scholar
[3] Buszewski B., Kowalkowski T., A new model of heavy metal transport in the soil using nonlinear artificial neural networks, Environ. Eng. Sci,, 2006, 23, 589–595.10.1089/ees.2006.23.589Search in Google Scholar
[4] Cattell R.B., The scientific use of factor analysis in behavioral and life sciences. New York, Plenum Press, 1978.10.1007/978-1-4684-2262-7Search in Google Scholar
[5] Cattle J. A., McBratney A.B., Minasny B., Kriging method evaluation for assessing the spatial distribution of urban soil lead contamination, J. Environ.Qual., 2002, 31, 1576–1588.10.2134/jeq2002.1576Search in Google Scholar
[6] Chang T. K., Simulated annealing and kriging method for identifying the spatial patterns and variability of soil heavy metals. J.Environ. Sci.Heatlh, Part A, 2000, 35, 1089–1115.10.1080/10934520009377022Search in Google Scholar
[7] Chepanova L., Madgarova I., Aneva Z., Validation of a specrophotometric method for determination of total phosphorus in soils and sediments using a microwave-assisted digestion, Ann. Rep. A. Zlatarov Univ.Burgas, Bulgaria, 2007, 7, 36-43 (in Bulgarian).Search in Google Scholar
[8] Chepanova L., Aneva Z., Simeonov V., Evaluation of aqua regia microwave-assisted digestion procedures for metal elements determination in environmental samples by FAAS and ICP-MS, Ecol. Chem.Eng., 2008, 15, 505–5119.Search in Google Scholar
[9] Davies B. E., Heavy metal contaminated soils in an old industrial area of Wales, Great Britain: source identification through statistical data interpretation, Wat. Air Soil Pollut,1997, 94, 85–98.10.1007/BF02407095Search in Google Scholar
[10] Dinev N., Banov M., Nikova I., Monitoring and risk assessment of contaminated soils, Gen. Appl. Plant Physiol., 2008, 34, 389–396.Search in Google Scholar
[11] ISO 10381-6, Soil quality-sampling-part 6: Guidance on the collection, handling and storage of soil under aerobic conditions for the assessment of microbiological processes, biomass and diversity in the laboratory, 2009.Search in Google Scholar
[12] ISO 10390, Soil quality—determination of pH, 2005.Search in Google Scholar
[13] ISO 11261, Soil quality—determination of total nitrogen-modified Kjeldahl method, 2008.Search in Google Scholar
[14] ISO 11464, Soil quality—pretreatment of samples for physicochemical analyses, 1994.Search in Google Scholar
[15] ISO 17025, General requirements for the competence of calibration and testing laboratories, 2005.Search in Google Scholar
[16] EVS-EN 13137, Characterization of waste determination of total organic carbon (TOC) in waste, sludges and sediments. 2001.Search in Google Scholar
[17] Massart D. L., Kaufman L., The interpretation of analytical chemical data by the use of cluster analysis, New York, Wiley Interscience, 1983.Search in Google Scholar
[18] Vandeginste B.G.M., Massart D.L., Buydens L.M.C., DeJong S., Lewi P.J., Smeyers Verbeke J., (1997). Handbook of chemometrics and qualimetrics; data handling in science and technology, parts A and B. Amsterdam, Elsevier, 1997.Search in Google Scholar
[19] Thurston G.D., Spengler J.D., A quantitative assessment of source contributions to inhalable particulate matter pollution in metropolitan Boston, Atmos. Environ., 1985, 19, 9-25.10.1016/0004-6981(85)90132-5Search in Google Scholar
[20] Malinova L., Contents of total and mobile forms of heavy metals in soil from stationary sample plots at Yundola, Vitinia and Staro Oriahovo. J. Environ. Protec. Ecol., 2002, 3, 834–841.Search in Google Scholar
[21] Stefanov K., Seizova K., Yanishlieva N., Marinova E., Popov S., Accumulation of lead, zinc and cadmium in plant seeds growing in metalliferous habitats in Bulgaria. Food Chem., 1995, 54, 311–313.10.1016/0308-8146(95)00052-KSearch in Google Scholar
[22] Xiaoping L., Chunchang H., Environment impact of heavy metals on urban soil in the vicinity of industrial area of Baoji city, P.R. China, Environ. Geol., 2007, 52, 1631–1637.10.1007/s00254-006-0608-3Search in Google Scholar
[23] Terzano R., Spagnuolo M., Vekemans B., De Nolf W., Janssens K., Falkenberg G., Assessing the origin and fate of Cr, Ni, Cu, Zn, Pb, and V in industrial polluted soil by combined microspectroscopic techniques and bulk extraction methods, Environ. Sci. Technol., 2007, 41, 6762–6769.10.1021/es070260hSearch in Google Scholar PubMed
[24] Schleyer C., Lux A., Mehring M., Gorg C., Ecosystem services as a boundary concept: arguments from social ecology, Sustainability, 9, 2017, 1107–1120.10.3390/su9071107Search in Google Scholar
[25] Pulido Moncada P., Gabriels D., Cornelis W., Data driven analysis of soil quality indicators using limited data, Geoderma, 2014, 235-236, 271-278.10.1016/j.geoderma.2014.07.014Search in Google Scholar
[26] Jastrzebska M., Saeid A., Kostrzewska M., Basladynska S., P– biofertilizers from waste and Cd and Pb in soil and plant, Open Chem., 2018, 16, 35-49.10.1515/chem-2018-0004Search in Google Scholar
[27] Fallatah M., Kavil Y., Ibrahim A., Orif M., Shaban Y., Farawati R., Hydrographic parameters and distribution of dissolved Cu, Ni, Zn and nutrients near Jeddah desqalination plant, Open Chem., 2018, 16, 246-257.10.1515/chem-2018-0029Search in Google Scholar
© 2019 Miroslava Nedyalkova, Vasil Simeonov, published by De Gruyter
This work is licensed under the Creative Commons Attribution 4.0 Public License.
Articles in the same Issue
- Regular Articles
- Research on correlation of compositions with oestrogenic activity of Cistanche based on LC/Q-TOF-MS/MS technology
- Efficacy of Pyrus elaeagnifolia subsp. elaeagnifolia in acetic acid–induced colitis model
- Anti-inflammatory and antinociceptive features of Bryonia alba L.: As a possible alternative in treating rheumatism
- High efficiency liposome fusion induced by reducing undesired membrane peptides interaction
- Prediction of the Blood-Brain Barrier Permeability Using RP-18 Thin Layer Chromatography
- Phytic Acid Extracted from Rice Bran as a Growth Promoter for Euglena gracilis
- Development of a validated spectrofluorimetric method for assay of sotalol hydrochloride in tablets and human plasma: application for stability-indicating studies
- Topological Indices of Hyaluronic Acid-Paclitaxel Conjugates’ Molecular Structure in Cancer Treatment
- Thermodynamic properties of the bubble growth process in a pool boiling of water-ethanol mixture two-component system
- Critical Roles of the PI3K-Akt-mTOR Signaling Pathway in Apoptosis and Autophagy of Astrocytes Induced by Methamphetamine
- Characteristics of Stable Hydrogen and Oxygen Isotopes of Soil Moisture under Different Land Use in Dry Hot Valley of Yuanmou
- Specific, highly sensitive and simple spectrofluorimetric method for quantification of daclatasvir in HCV human plasma patients and in tablets dosage form
- Chromium-modified cobalt molybdenum nitrides as catalysts for ammonia synthesis
- Langerhans cell-like dendritic cells treated with ginsenoside Rh2 regulate the differentiation of Th1 and Th2 cells in vivo
- Identification of Powdery Mildew Blumeria graminis f. sp. tritici Resistance Genes in Selected Wheat Varieties and Development of Multiplex PCR
- Computational Analysis of new Degree-based descriptors of oxide networks
- The Use Of Chemical Composition And Additives To Classify Petrol And Diesel Using Gas Chromatography–Mass Spectrometry And Chemometric Analysis: A Uk Study
- Minimal Energy Tree with 4 Branched Vertices
- Jatropha seed oil derived poly(esteramide-urethane)/ fumed silica nanocomposite coatings for corrosion protection
- Calculating topological indices of certain OTIS interconnection networks
- Energy storage analysis of R125 in UIO-66 and MOF-5 nanoparticles: A molecular simulation study
- Velvet Antler compounds targeting major cell signaling pathways in osteosarcoma - a new insight into mediating the process of invasion and metastasis in OS
- Effects of Azadirachta Indica Leaf Extract, Capping Agents, on the Synthesis of Pure And Cu Doped ZnO-Nanoparticles: A Green Approach and Microbial Activity
- Aqueous Micro-hydration of Na+(H2O)n=1-7 Clusters: DFT Study
- A proposed image-based detection of methamidophos pesticide using peroxyoxalate chemiluminescence system
- Phytochemical screening and estrogenic activity of total glycosides of Cistanche deserticola
- Biological evaluation of a series of benzothiazole derivatives as mosquitocidal agents
- Chemical pretreatments of Trapa bispinosa's peel (TBP) biosorbent to enhance adsorption capacity for Pb(ll)
- Dynamic Changes in MMP1 and TIMP1 in the Antifibrotic Process of Dahuang Zhechong Pill in Rats with Liver Fibrosis
- The Optimization and Production of Ginkgolide B Lipid Microemulsion
- Photodynamic Therapy Enhanced the Antitumor Effects of Berberine on HeLa Cells
- Chiral and Achiral Enantiomeric Separation of (±)-Alprenolol
- Correlation of Water Fluoride with Body Fluids, Dental Fluorosis and FT4, FT3 –TSH Disruption among Children in an Endemic Fluorosis area in Pakistan
- A one-step incubation ELISA kit for rapid determination of dibutyl phthalate in water, beverage and liquor
- Free Radical Scavenging Activity of Essential Oil of Eugenia caryophylata from Amboina Island and Derivatives of Eugenol
- Effects of Blue and Red Light On Growth And Nitrate Metabolism In Pakchoi
- miRNA-199a-5p functions as a tumor suppressor in prolactinomas
- Solar photodegradation of carbamazepine from aqueous solutions using a compound parabolic concentrator equipped with a sun tracking system
- Influence of sub-inhibitory concentration of selected plant essential oils on the physical and biochemical properties of Pseudomonas orientalis
- Preparation and spectroscopic studies of Fe(II), Ru(II), Pd(II) and Zn(II) complexes of Schiff base containing terephthalaldehyde and their transfer hydrogenation and Suzuki-Miyaura coupling reaction
- Complex formation in a liquid-liquid extraction-chromogenic system for vanadium(IV)
- Synthesis, characterization (IR, 1H, 13C & 31P NMR), fungicidal, herbicidal and molecular docking evaluation of steroid phosphorus compounds
- Analysis and Biological Evaluation of Arisaema Amuremse Maxim Essential Oil
- A preliminary assessment of potential ecological risk and soil contamination by heavy metals around a cement factory, western Saudi Arabia
- Anti- inflammatory effect of Prunus tomentosa Thunb total flavones in LPS-induced RAW264.7 cells
- Collaborative Influence of Elevated CO2 Concentration and High Temperature on Potato Biomass Accumulation and Characteristics
- Methods of extraction, physicochemical properties of alginates and their applications in biomedical field – a review
- Characteristics of liposomes derived from egg yolk
- Preparation of ternary ZnO/Ag/cellulose and its enhanced photocatalytic degradation property on phenol and benzene in VOCs
- Influence of Human Serum Albumin Glycation on the Binding Affinities for Natural Flavonoids
- Synthesis and antioxidant activity of 2-methylthio-pyrido[3,2-e][1,2,4] triazolo[1,5-a]pyrimidines
- Comparative study on the antioxidant activities of ten common flower teas from China
- Molecular Properties of Symmetrical Networks Using Topological Polynomials
- Synthesis of Co3O4 Nano Aggregates by Co-precipitation Method and its Catalytic and Fuel Additive Applications
- Phytochemical analysis, Antioxidant and Antiprotoscolices potential of ethanol extracts of selected plants species against Echinococcus granulosus: In-vitro study
- Silver nanoparticles enhanced fluorescence for sensitive determination of fluoroquinolones in water solutions
- Simultaneous Quantification of the New Psychoactive Substances 3-FMC, 3-FPM, 4-CEC, and 4-BMC in Human Blood using GC-MS
- Biodiesel Production by Lipids From Indonesian strain of Microalgae Chlorella vulgaris
- Miscibility studies of polystyrene/polyvinyl chloride blend in presence of organoclay
- Antibacterial Activities of Transition Metal complexes of Mesocyclic Amidine 1,4-diazacycloheptane (DACH)
- Novel 1,8-Naphthyridine Derivatives: Design, Synthesis and in vitro screening of their cytotoxic activity against MCF7 cell line
- Investigation of Stress Corrosion Cracking Behaviour of Mg-Al-Zn Alloys in Different pH Environments by SSRT Method
- Various Combinations of Flame Retardants for Poly (vinyl chloride)
- Phenolic compounds and biological activities of rye (Secale cereale L.) grains
- Oxidative degradation of gentamicin present in water by an electro-Fenton process and biodegradability improvement
- Optimizing Suitable Conditions for the Removal of Ammonium Nitrogen by a Microbe Isolated from Chicken Manure
- Anti-inflammatory, antipyretic, analgesic, and antioxidant activities of Haloxylon salicornicum aqueous fraction
- The anti-corrosion behaviour of Satureja montana L. extract on iron in NaCl solution
- Interleukin-4, hemopexin, and lipoprotein-associated phospholipase A2 are significantly increased in patients with unstable carotid plaque
- A comparative study of the crystal structures of 2-(4-(2-(4-(3-chlorophenyl)pipera -zinyl)ethyl) benzyl)isoindoline-1,3-dione by synchrotron radiation X-ray powder diffraction and single-crystal X-ray diffraction
- Conceptual DFT as a Novel Chemoinformatics Tool for Studying the Chemical Reactivity Properties of the Amatoxin Family of Fungal Peptides
- Occurrence of Aflatoxin M1 in Milk-based Mithae samples from Pakistan
- Kinetics of Iron Removal From Ti-Extraction Blast Furnace Slag by Chlorination Calcination
- Increasing the activity of DNAzyme based on the telomeric sequence: 2’-OMe-RNA and LNA modifications
- Exploring the optoelectronic properties of a chromene-appended pyrimidone derivative for photovoltaic applications
- Effect of He Qi San on DNA Methylation in Type 2 Diabetes Mellitus Patients with Phlegm-blood Stasis Syndrome
- Cyclodextrin potentiometric sensors based on selective recognition sites for procainamide: Comparative and theoretical study
- Greener synthesis of dimethyl carbonate from carbon dioxide and methanol using a tunable ionic liquid catalyst
- Nonisothermal Cold Crystallization Kinetics of Poly(lactic acid)/Bacterial Poly(hydroxyoctanoate) (PHO)/Talc
- Enhanced adsorption of sulfonamide antibiotics in water by modified biochar derived from bagasse
- Study on the Mechanism of Shugan Xiaozhi Fang on Cells with Non-alcoholic Fatty Liver Disease
- Comparative Effects of Salt and Alkali Stress on Antioxidant System in Cotton (Gossypium Hirsutum L.) Leaves
- Optimization of chromatographic systems for analysis of selected psychotropic drugs and their metabolites in serum and saliva by HPLC in order to monitor therapeutic drugs
- Electrocatalytic Properties of Ni-Doped BaFe12O19 for Oxygen Evolution in Alkaline Solution
- Study on the removal of high contents of ammonium from piggery wastewater by clinoptilolite and the corresponding mechanisms
- Phytochemistry and toxicological assessment of Bryonia dioica roots used in north-African alternative medicine
- The essential oil composition of selected Hemerocallis cultivars and their biological activity
- Mechanical Properties of Carbon Fiber Reinforced Nanocrystalline Nickel Composite Electroforming Deposit
- Anti-c-myc efficacy block EGFL7 induced prolactinoma tumorigenesis
- Topical Issue on Applications of Mathematics in Chemistry
- Zagreb Connection Number Index of Nanotubes and Regular Hexagonal Lattice
- The Sanskruti index of trees and unicyclic graphs
-
Valency-based molecular descriptors of Bakelite network
- Computing Topological Indices for Para-Line Graphs of Anthracene
- Zagreb Polynomials and redefined Zagreb indices of Dendrimers and Polyomino Chains
- Topological Descriptor of 2-Dimensional Silicon Carbons and Their Applications
- Topological invariants for the line graphs of some classes of graphs
- Words for maximal Subgroups of Fi24‘
- Generators of Maximal Subgroups of Harada-Norton and some Linear Groups
- Special Issue on POKOCHA 2018
- Influence of Production Parameters on the Content of Polyphenolic Compounds in Extruded Porridge Enriched with Chokeberry Fruit (Aronia melanocarpa (Michx.) Elliott)
- Effects of Supercritical Carbon Dioxide Extraction (SC-CO2) on the content of tiliroside in the extracts from Tilia L. flowers
- Impact of xanthan gum addition on phenolic acids composition and selected properties of new gluten-free maize-field bean pasta
- Impact of storage temperature and time on Moldavian dragonhead oil – spectroscopic and chemometric analysis
- The effect of selected substances on the stability of standard solutions in voltammetric analysis of ascorbic acid in fruit juices
- Determination of the content of Pb, Cd, Cu, Zn in dairy products from various regions of Poland
- Special Issue on IC3PE 2018 Conference
- The Photocatalytic Activity of Zns-TiO2 on a Carbon Fiber Prepared by Chemical Bath Deposition
- N-octyl chitosan derivatives as amphiphilic carrier agents for herbicide formulations
- Kinetics and Mechanistic Study of Hydrolysis of Adenosine Monophosphate Disodium Salt (AMPNa2) in Acidic and Alkaline Media
- Antimalarial Activity of Andrographis Paniculata Ness‘s N-hexane Extract and Its Major Compounds
- Special Issue on ABB2018 Conference
- Special Issue on ICCESEN 2017
- Theoretical Diagnostics of Second and Third-order Hyperpolarizabilities of Several Acid Derivatives
- Determination of Gamma Rays Efficiency Against Rhizoctonia solani in Potatoes
- Studies On Compatibilization Of Recycled Polyethylene/Thermoplastic Starch Blends By Using Different Compatibilizer
- Liquid−Liquid Extraction of Linalool from Methyl Eugenol with 1-Ethyl-3-methylimidazolium Hydrogen Sulfate [EMIM][HSO4] Ionic Liquid
- Synthesis of Graphene Oxide Through Ultrasonic Assisted Electrochemical Exfoliation
- Special Issue on ISCMP 2018
- Synthesis and antiproliferative evaluation of some 1,4-naphthoquinone derivatives against human cervical cancer cells
- The influence of the grafted aryl groups on the solvation properties of the graphyne and graphdiyne - a MD study
- Electrochemical modification of platinum and glassy carbon surfaces with pyridine layers and their use as complexing agents for copper (II) ions
- Effect of Electrospinning Process on Total Antioxidant Activity of Electrospun Nanofibers Containing Grape Seed Extract
- Effect Of Thermal Treatment Of Trepel At Temperature Range 800-1200˚C
- Topical Issue on Agriculture
- The effect of Cladophora glomerata exudates on the amino acid composition of Cladophora fracta and Rhizoclonium sp.
- Influence of the Static Magnetic Field and Algal Extract on the Germination of Soybean Seeds
- The use of UV-induced fluorescence for the assessment of homogeneity of granular mixtures
- The use of microorganisms as bio-fertilizers in the cultivation of white lupine
- Lyophilized apples on flax oil and ethyl esters of flax oil - stability and antioxidant evaluation
- Production of phosphorus biofertilizer based on the renewable materials in large laboratory scale
- Human health risk assessment of potential toxic elements in paddy soil and rice (Oryza sativa) from Ugbawka fields, Enugu, Nigeria
- Recovery of phosphates(V) from wastewaters of different chemical composition
- Special Issue on the 4th Green Chemistry 2018
- Dead zone for hydrogenation of propylene reaction carried out on commercial catalyst pellets
- Improved thermally stable oligoetherols from 6-aminouracil, ethylene carbonate and boric acid
- The role of a chemical loop in removal of hazardous contaminants from coke oven wastewater during its treatment
- Combating paraben pollution in surface waters with a variety of photocatalyzed systems: Looking for the most efficient technology
- Special Issue on Chemistry Today for Tomorrow 2019
- Applying Discriminant and Cluster Analyses to Separate Allergenic from Non-allergenic Proteins
- Chemometric Expertise Of Clinical Monitoring Data Of Prolactinoma Patients
- Chemomertic Risk Assessment of Soil Pollution
- New composite sorbent for speciation analysis of soluble chromium in textiles
- Photocatalytic activity of NiFe2O4 and Zn0.5Ni0.5Fe2O4 modified by Eu(III) and Tb(III) for decomposition of Malachite Green
- Photophysical and antibacterial activity of light-activated quaternary eosin Y
- Spectral properties and biological activity of La(III) and Nd(III) Monensinates
- Special Issue on Monitoring, Risk Assessment and Sustainable Management for the Exposure to Environmental Toxins
- Soil organic carbon mineralization in relation to microbial dynamics in subtropical red soils dominated by differently sized aggregates
- A potential reusable fluorescent aptasensor based on magnetic nanoparticles for ochratoxin A analysis
- Special Issue on 13th JCC 2018
- Fluorescence study of 5-nitroisatin Schiff base immobilized on SBA-15 for sensing Fe3+
- Thermal and Morphology Properties of Cellulose Nanofiber from TEMPO-oxidized Lower part of Empty Fruit Bunches (LEFB)
- Encapsulation of Vitamin C in Sesame Liposomes: Computational and Experimental Studies
- A comparative study of the utilization of synthetic foaming agent and aluminum powder as pore-forming agents in lightweight geopolymer synthesis
- Synthesis of high surface area mesoporous silica SBA-15 by adjusting hydrothermal treatment time and the amount of polyvinyl alcohol
- Review of large-pore mesostructured cellular foam (MCF) silica and its applications
- Ion Exchange of Benzoate in Ni-Al-Benzoate Layered Double Hydroxide by Amoxicillin
- Synthesis And Characterization Of CoMo/Mordenite Catalyst For Hydrotreatment Of Lignin Compound Models
- Production of Biodiesel from Nyamplung (Calophyllum inophyllum L.) using Microwave with CaO Catalyst from Eggshell Waste: Optimization of Transesterification Process Parameters
- The Study of the Optical Properties of C60 Fullerene in Different Organic Solvents
- Composite Material Consisting of HKUST-1 and Indonesian Activated Natural Zeolite and its Application in CO2 Capture
- Topical Issue on Environmental Chemistry
- Ionic liquids modified cobalt/ZSM-5 as a highly efficient catalyst for enhancing the selectivity towards KA oil in the aerobic oxidation of cyclohexane
- Application of Thermal Resistant Gemini Surfactants in Highly Thixotropic Water-in-oil Drilling Fluid System
- Screening Study on Rheological Behavior and Phase Transition Point of Polymer-containing Fluids produced under the Oil Freezing Point Temperature
- The Chemical Softening Effect and Mechanism of Low Rank Coal Soaked in Alkaline Solution
- The Influence Of NO/O2 On The NOx Storage Properties Over A Pt-Ba-Ce/γ-Al2O3 Catalyst
- Special Issue on the International conference CosCI 2018
- Design of SiO2/TiO2 that Synergistically Increases The Hydrophobicity of Methyltrimethoxysilane Coated Glass
- Antidiabetes and Antioxidant agents from Clausena excavata root as medicinal plant of Myanmar
- Development of a Gold Immunochromatographic Assay Method Using Candida Biofilm Antigen as a Bioreceptor for Candidiasis in Rats
- Special Issue on Applied Biochemistry and Biotechnology 2019
- Adsorption of copper ions on Magnolia officinalis residues after solid-phase fermentation with Phanerochaete chrysosporium
- Erratum
- Erratum to: Sand Dune Characterization For Preparing Metallurgical Grade Silicon