Effect of rare earth Nd on the microstructural transformation and mechanical properties of 7xxx series aluminum alloys
-
Jianpeng Hao
 und
Yuxin Dai
und
Yuxin Dai

Abstract
Al–Zn–Mg–Cu–Zr aluminum alloys have shown promise as materials for drill pipes; however, their application temperature is limited to below 120°C. This study investigates the influence of incorporating the rare earth element Nd on the microstructure and mechanical properties of Al–Zn–Mg–Cu–Zr alloys. The microstructural evolution during casting, homogenization, hot deformation, and heat treatment processes is characterized using optical microscopy and scanning electron microscopy. The composition of the rare earth phase is determined through transmission electron microscopy (TEM). Furthermore, first-principles calculations are employed to determine the formation enthalpy, cohesive energy, shear modulus, bulk modulus, Young’s modulus, and Poisson’s ratio of bulk Al8Cu4Nd. The effect of Nd addition on the mechanical properties of the alloy is investigated through hardness and tensile testing. The results indicate that the addition of Nd significantly refines the grain and dendrite sizes of the alloy and effectively suppresses recrystallization behavior during hot extrusion and solution treatment. TEM observations reveal the presence of micrometer-sized blocky Al8Cu4Nd phases and nanometer-sized Al3Nd phases. The Al3Nd phases are located near dislocations, hindering dislocation movement and thus enhancing the alloy’s mechanical properties. First-principles calculations demonstrate that the bulk Al8Cu4Nd phase exhibits superior structural stability, deformation resistance, and brittle characteristics, which negatively impact the ductility of the alloy. The alloy with Nd addition can maintain a high hardness value for an extended period at high temperature, and the tensile strength of the alloy with 0.26 wt% Nd addition reaches 396.2 MPa at 120°C. These results indicate that the rare earth element Nd can improve the high-temperature mechanical properties of the alloy.
1 Introduction
The 7000 series aluminum alloy has gained attention in oil drilling due to its high strength, low bending stress, and resistance to acidic gas corrosion, such as H2S and CO2 [1]. The 1953T1 alloy and AA7075 alloy in the 7000 series exhibit a room temperature yield strength as high as 500 MPa, good corrosion resistance, and significantly higher high-temperature impact toughness compared to Al–Cu–Mg D16T [2]. As a result, it has become the most promising aluminum alloy drill pipe material. However, as the temperature increases, the precipitation and dissolution of the main strengthening phase η (MgZn2) in the alloy accelerate, resulting in a significant decrease in thermal stability. According to regulations, the maximum service temperature for 7000 series aluminum alloy drill pipes should not exceed 120°C [3]. Consequently, 7000 series aluminum alloys can only be used for drilling oil wells with a depth of less than 4,000 m, which greatly limits their application. Therefore, enhancing the high-temperature performance of aluminum alloy drill pipes is a critical concern at present [4].
Compared to the rare earth elements Er and Sc commonly used in oil drill pipes in recent years, Nd exhibits a relatively low diffusion coefficient at high temperatures and a comparatively low lattice mismatch rate. Furthermore, the maximum solubility of Nd in the α-Al matrix is not significantly different from that of Sc. Specifically, the lattice mismatch rate between α-Al and L12–Al3Er is 4.1% [5], whereas that between α-Al and L12–Al3Sc is 1.32% [5] and that between the rare earth phase formed by Nd and α-Al is 6.13% [6]. The low lattice mismatch rate effectively stabilizes the substructure and inhibits recrystallization, thereby improving the comprehensive properties of the alloy [5,7]. At 400°C, the diffusion rate of Er in α-Al is 1 × 10⁻¹⁸ m2·s−1, the diffusion rate of Sc is 1.98 × 10⁻¹⁷ m2·s−1 [5], and the diffusion rate of Nd is 3.93 × 10⁻¹⁹ m2·s−1 [7]. The slower diffusion rate of Nd compared to Er and Sc inhibits volume diffusion and effectively impedes dislocation movement at high temperatures. In terms of solubility in Al, the maximum solubility of Sc in Al is 0.23 at.% [7,8], Er in Al is 0.17 at.% [9,10], and Nd in Al is 0.28 at.% [9]. The limited solubility enhances the driving force and volume fraction of precipitates. In summary, Nd can be introduced as a new microalloying element.
The primary production processes for aluminum drill pipes include casting, homogenization, heat deformation, solution treatment, and aging. Characterizing the microstructural evolution during each production process is crucial for understanding and controlling the final performance of these products [5]. This paper compares the addition of 0.26 wt% Nd to explore the changes in microstructure and properties after casting, homogenization, heat deformation, and heat treatment. Additionally, first-principles simulations are conducted to examine various parameters of the bulk Al8Cu4Nd phase and compare it with the second phase in the alloy. These simulations aim to illustrate the influence of the presence of the Al8Cu4Nd phase on the mechanical properties of the alloy.
2 Materials and methods
In this study, the alloy was prepared using 99.99% high-purity aluminum, Al–30%Zn, Al–20%Mg, Al–30%Cu, Al–10%Zr, and Mg–30%Nd intermediate alloys as raw materials. The raw materials were polished with a file to remove surface oxidation. The burn-off rates in actual applications were determined by ICP analysis, with Zn exhibiting a burn-off rate of 2%, Cu at 5%, Zr at 30%, and Nd at 1%. The alloy preparation was carried out based on these burn-off rates, and the alloy was melted using a GF1150ND resistance induction furnace. First, the crucible was preheated to 400°C. Pure aluminum was then added to it, and the crucible’s temperature was gradually raised to 740°C. Once the pure aluminum was completely melted, Al–30%Zn, Al–30%Cu, Al–10%Zr, and Al–20%Mg intermediate alloys were sequentially added. After complete melting and slag removal, the alloy’s temperature was reduced to 730°C. The alloy underwent degassing and refinement by immersing a graphite cover containing C2Cl6 (0.4% of the total weight, approximately 2 g) into the alloy liquid and purging with argon for 20 min. Stirring and slag removal treatments were conducted. The temperature was then lowered to 710°C, and Mg–30%Nd wrapped in aluminum foil was added. After 2 min of stirring, the alloy was poured into a graphite mold preheated to 200°C to cast a cylindrical ingot with dimensions of Φ 60 mm × 60 mm. Metallographic samples were taken from the longitudinal 2/3 to 1/2 of the ingot. The actual composition of the prepared alloy, as shown in Table 1 (ICP test results), consists of alloys denoted as A and B with Nd contents of 0 wt% and 0.26 wt%, respectively.
Chemical compositions of the Al–Zn–Mg–Cu–Zr alloys with different Nd content (wt%)
| Alloys | Zn | Mg | Cu | Zr | Nd | Al |
|---|---|---|---|---|---|---|
| A | 6.08 | 2.32 | 1.70 | 0.16 | 0 | Bal. |
| B | 6.11 | 2.28 | 1.72 | 0.15 | 0.26 | Bal. |
The heat treatment system used in this experiment is shown in Figure 1. The homogenization was designed as a two-stage process (300°C·6 h−1 + 472°C·24 h−1, with a heating rate of 50°C·h−1 and followed by air cooling). The first-stage temperature of 300°C was selected based on thermodynamic simulations of the Al–6.1Zn–2.3Mg–1.7Cu–0.15Zr alloy carried out using the JMat Pro software. The Al3M-D023 phase precipitation was relatively stable and reached a maximum of 0.18% at a temperature of 300°C, as shown in Figure 2. In order to obtain a more dispersed Al3Zr phase, the first-stage homogenization was set at 300°C·6 h−1 (near the dissolution temperature of the η-phase). The second-stage temperature and time were established using DSC and homogenization kinetic equations, as shown in Figures 3 and 4. The alloys were then extruded at 400°C with an extrusion speed of 1 mm·s−1 and an extrusion ratio of 25:1. Samples were cut from the center of the extruded alloys. The extruded samples underwent a two-stage solution treatment (455°C·1.5 h−1 + 474°C·0.5 h−1) with a heating rate of 60°C·h−1, followed by water quenching. This was followed by a four-stage aging treatment (105°C·24 h−1 + 170°C·85 min−1 + water quenching + natural aging for 24 h + 80°C·34 h−1) with air cooling. To simulate the working conditions of oil drill pipes, the samples were finally subjected to thermal exposure tests at 120°C for 100 h.
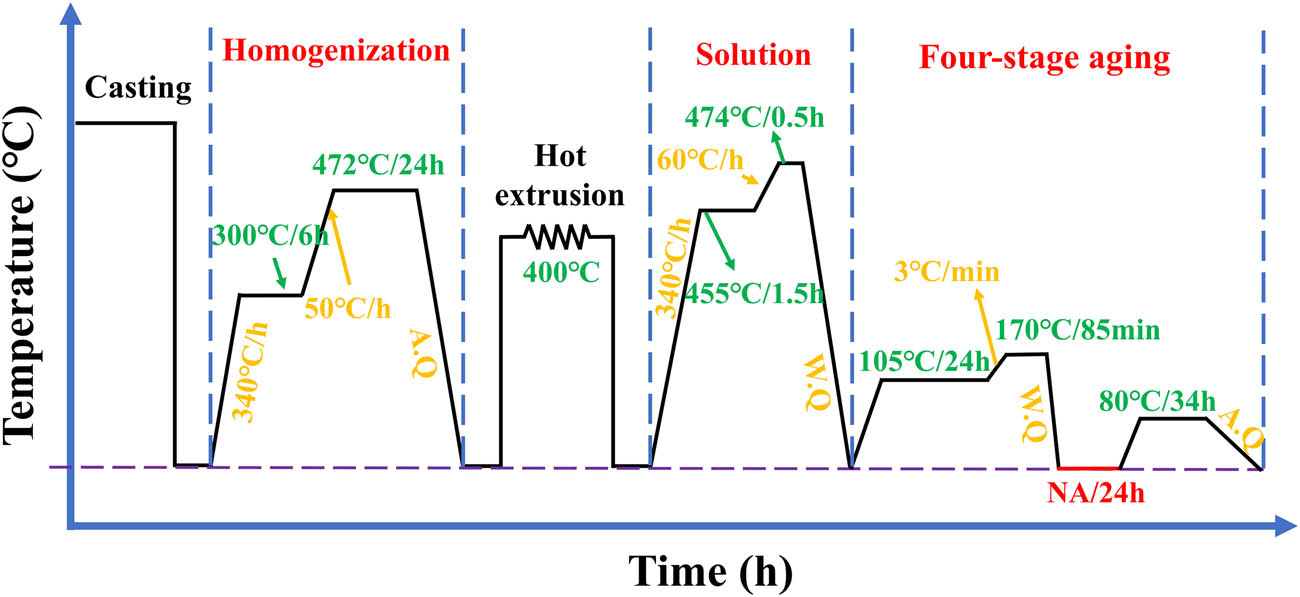
Deformation and heat treatment process roadmap.

(a) Relationship between equilibrium transformation and temperature for Al–6.1Zn–2.3Mg–1.7Cu–0.15Zr alloy: (b) S-Al2CuMg; (c) T-AlZnMgCu; (d) η-MgZn2; (e) D023-Al3M.
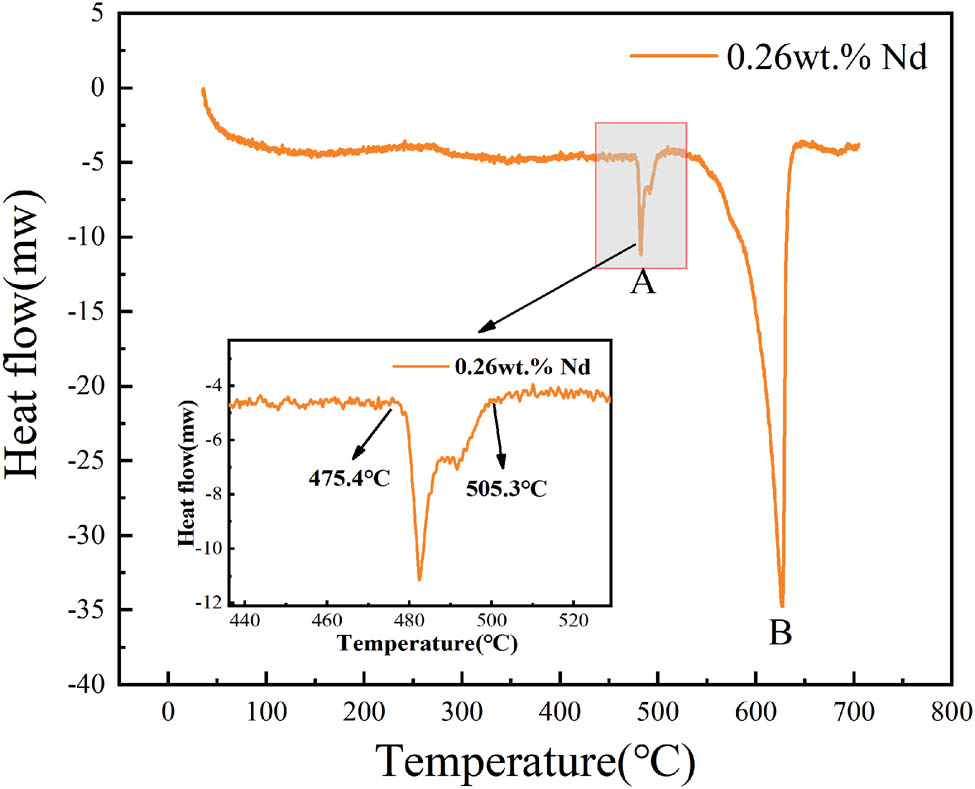
DSC curve of as-cast Al–Zn–Mg–Cu–Zr–0.26Nd alloy.
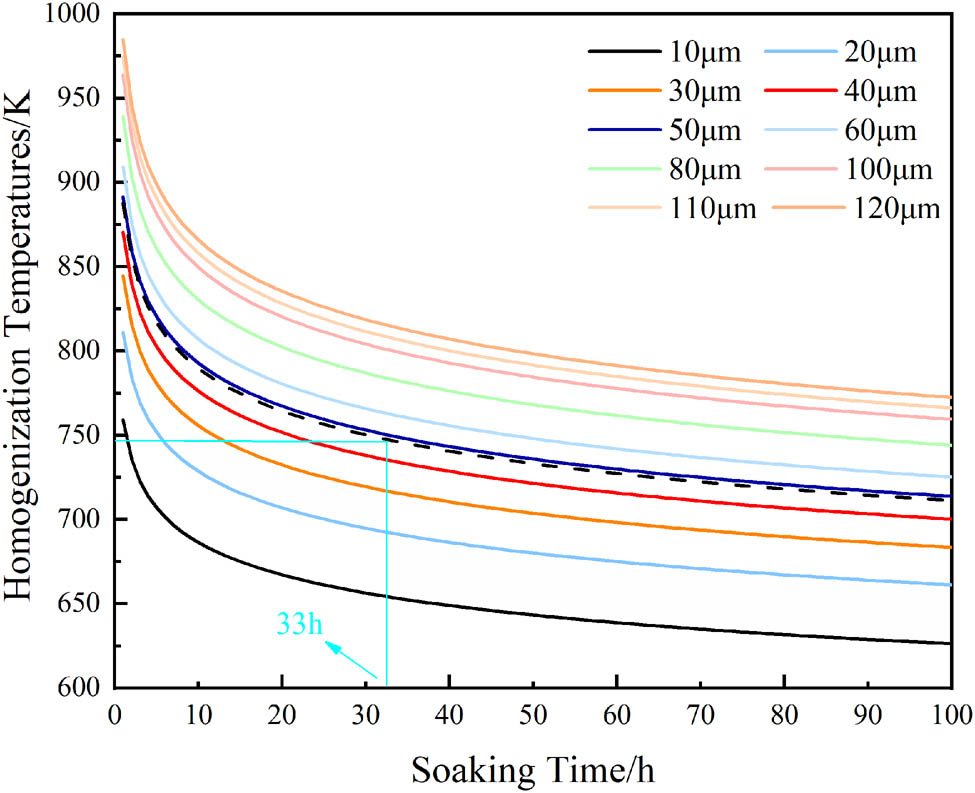
Homogenization kinetic curves of Cu element at different dendrite arm spacings.
The samples were polished using sandpaper and a metallographic sample polishing machine, and then corroded with Keller’s reagent (HF (1 mL) + HCl (1.5 mL) + HNO3 (2.5 mL) + H2O (95 mL)) and Graff’s reagent (CrO3 (3 g) + HF (1 mL) + HNO3 (16 mL) + H2O (83 mL)). The microstructure of the as-cast and homogenized alloy was observed using an optical microscopy (Axio Imager Alm, OM), and the recrystallization after extrusion and solution treatment was observed. The as-cast samples were electrolytically polished (Barker’s reagent) and then anodically coated at a voltage of 20 V for 1–2 min. Polarized light observations were conducted using an Olympus inverted metallographic microscope, and the average grain size and secondary dendrite arm spacing (SDAS) of the alloys were measured using the line intercept measurement method [11]. The microstructure and distribution of non-equilibrium eutectic phases in the as-cast, homogenized, and solid solution alloys were observed using scanning electron microscopy (QuantaFEG650, SEM), and the type and element distribution of the second phase in the alloy were analyzed using energy-dispersive spectroscopy (EDS). An X-ray diffractometer (D/MAX-2500/PC, XRD) with a Cu Kα radiation source was used for phase analysis. The test voltage was 40 kV, the scanning speed was 3°·min−1, and the scanning angle ranged from 10° to 90°. The experimental data were processed using Jade 6.0 professional software and compared with the PDF standard comparison card for phase analysis. Bright-field imaging using a field-emission transmission electron microscope (FEI Talos 200X) and high-resolution transmission electron microscopy (HRTEM) images, along with selected area electron diffraction (SAED) patterns, were employed to determine the composition of rare earth phases in the alloy and to further investigate whether these rare earth phases impede dislocation motion.
The hardness of the alloy was measured using a Vickers hardness tester with a load force of 500 kgf and a load time of 15 s. The average value was determined after excluding the maximum and minimum values from 20 repeated hardness measurements for each sample. Room temperature and high-temperature tensile tests were performed using a Gleeble-3500 thermal simulation machine with a temperature accuracy of ± 2°C and a tensile rate of 1 mm·min−1. The strength data represents the average of at least three tensile specimens to ensure the reliability of the results.
3 Results and discussion
3.1 Microstructure in as-cast and homogenized alloys
Figure 5 shows the as-cast microstructures of alloy A and alloy B obtained using OM (a, b, d, e) and SEM (c, f). In Figure 5(a) and (d), the microstructures of the alloys exhibited a typical dendritic network structure, predominantly composed of a white dendritic α-Al matrix and a black eutectic structure. It is clear from the figure that the addition of Nd noticeably refined the as-cast microstructure of the alloy, leading to a reduction in the SDAS. Figure 5(b) and (e) present the as-cast microstructure of the alloys after electrolytic polishing and anodic coating, demonstrating a significant grain refinement in the alloy with Nd addition. In Figure 5(c) and (f), numerous lamellar and irregular block eutectic phases were distributed along the grain boundaries. Using EDS analysis, the bright white block-like constituents at points B and E were identified as the Al8Cu4Nd phase, the light gray constituents at points A and D as the θ (Al2Cu) phase, and the lamellar constituents at point C as the T (AlZnMgCu) phase. According to previous literature [12,13], the layered T phase exists in the form of the Mg (Zn, Cu, Al)2 crystal structure. This is due to the fact that the atomic radius of Cu and Zn are nearly identical. During the alloy’s solidification, Cu atoms enter the MgZn2 phase through atomic diffusion and partially replace Zn atoms, forming the T (AlZnMgCu) phase, as shown in Table 2.
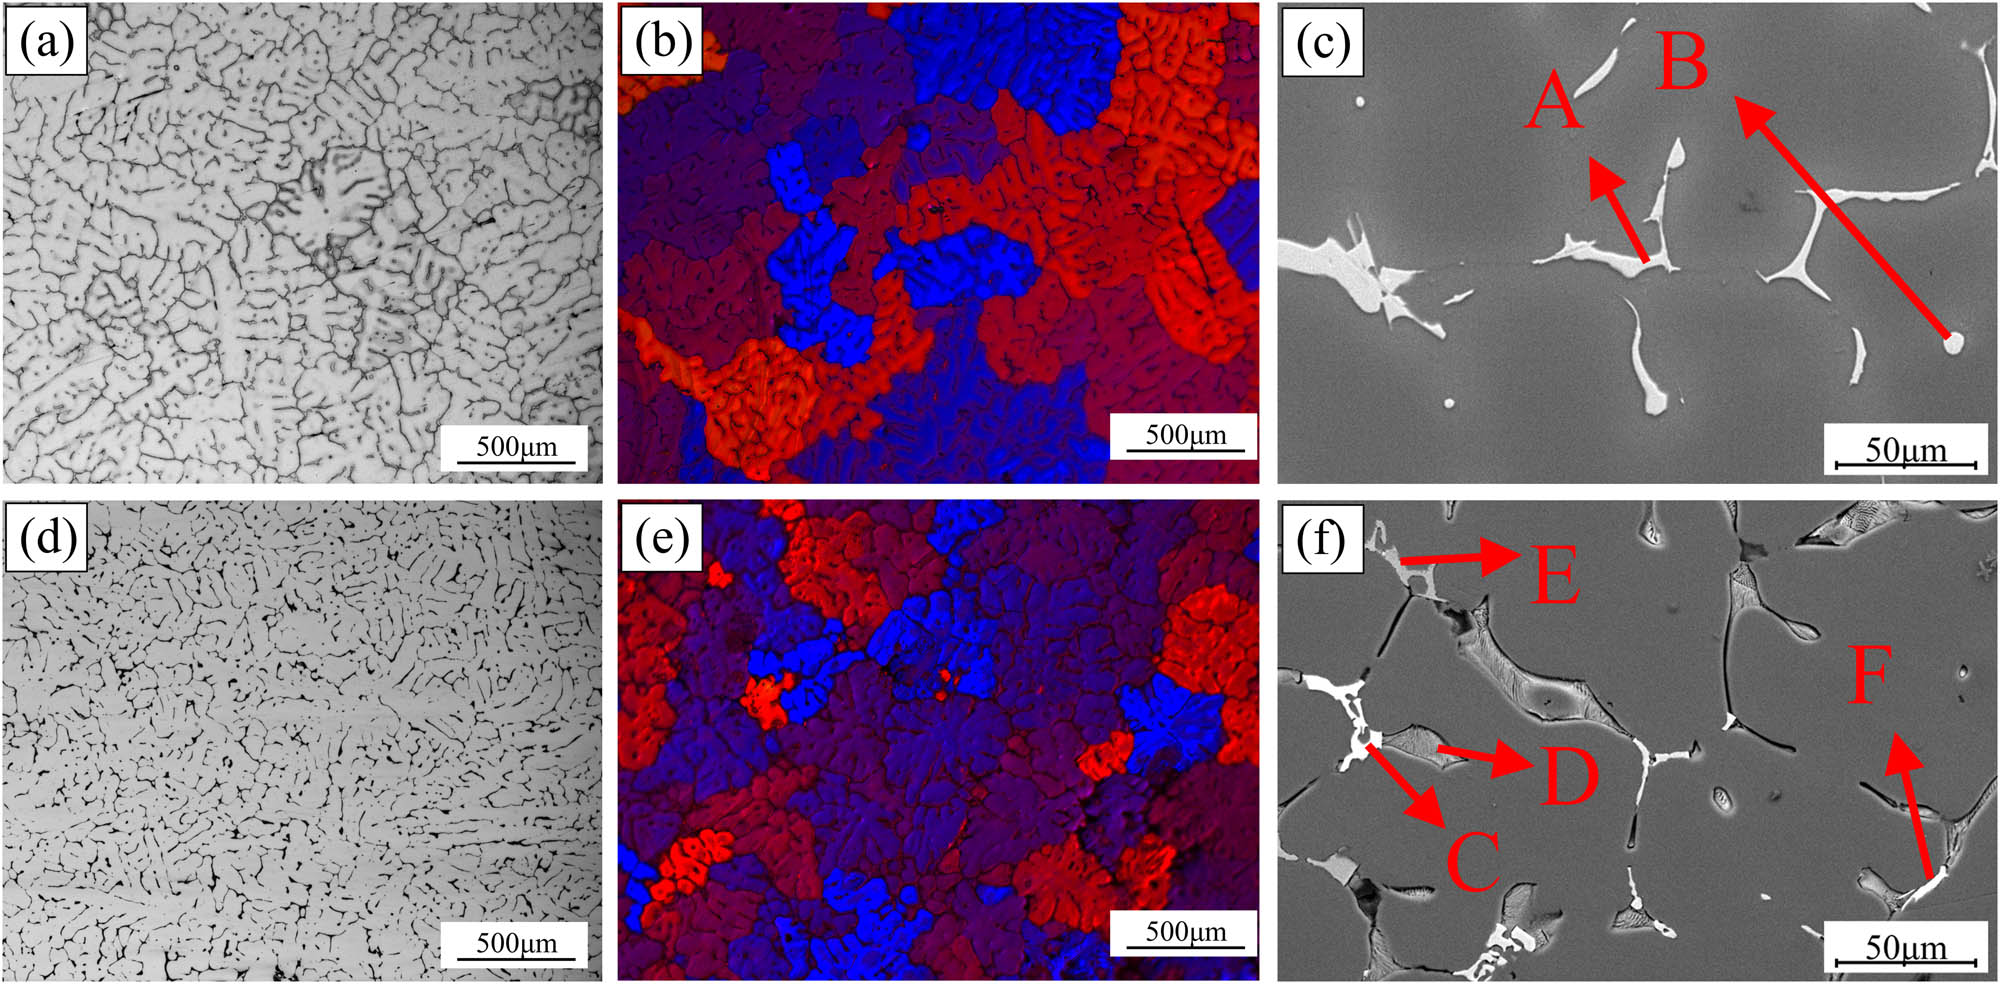
(a) and (d) Optical microscope, (b) and (e) anodic coating, and (c) and (f) SEM: (a)–(c) alloy A; (d)–(f) alloy B.
| Point | Al | Zn | Mg | Cu | Fe | Nd | Likely phases |
|---|---|---|---|---|---|---|---|
| A | 66.79 | 5.06 | 0.23 | 26.28 | 0.80 | 0.05 | Al2Cu |
| B | 67.57 | 1.19 | 0.10 | 31.07 | 0.04 | 0.03 | Al2Cu |
| C | 67.79 | 3.50 | 1.52 | 23.07 | 0.12 | 5.99 | Al8Cu4Nd |
| D | 50.51 | 13.72 | 15.02 | 18.70 | 0.04 | 0.01 | T-AlZnMgCu |
| E | 73.90 | 0.68 | 2.20 | 23.16 | 0.02 | 0.04 | Al2Cu |
| F | 73.16 | 2.05 | 3.05 | 17.32 | 0.22 | 4.20 | Al8Cu4Nd |
| G | 53.42 | 5.99 | 0.39 | 31.99 | 0.94 | 7.29 | Al8Cu4Nd |
| H | 60.82 | 1.22 | 17.27 | 20.45 | 0.07 | 0.17 | Al2CuMg |
| I | 70.36 | 0.87 | 0.43 | 19.54 | 8.76 | 0.09 | Al7Cu2Fe |
The SDAS and average grain size of alloy A and alloy B in the as-cast state were measured using ImageJ software. Compared to alloy A, the addition of 0.26 wt% Nd in alloy B resulted in a 48.1% reduction in the average SDAS (53.2 μm) and a 50.5% reduction in the average grain size (258.98 μm).
The addition of the rare earth element Nd significantly refined the as-cast microstructure due to its high chemical activity and small solid solubility, leading to solute redistribution during crystal nucleation and growth and a change in the composition undercooling zone [14,15]. This inhibited the growth of dendrites during solidification. With the increase of the composition undercooling zone, the necking and melting of dendrites and second-phase spheroidization at the interface intensified and provided more nucleation particles which improved the nucleation rate in the composition undercooling zone [16]. The enlargement of the undercooling zone reduced the secondary dendrite spacing, refined the as-cast microstructure, and increased the interface area [17,18,19,20].
Figure 5 shows more pronounced dendritic segregation in the as-cast structure. The presence of a dendritic network structure diminished the alloy’s processing performance, reduced its strength and toughness, and increased its corrosion sensitivity. In order to eliminate the defects caused by the casting process, the alloy underwent a homogenization treatment after casting, and Figure 6 shows the microstructures and grain size distribution of alloy A and alloy B after homogenization. In comparison to Figure 5(a) and (d), the grains of alloy A and alloy B in the homogenized microstructures exhibited an equiaxed morphology, and the eutectic constituents at the grain boundaries were significantly reduced, resulting in narrower grain boundaries (as shown in Figure 6(a) and (c)). Grain size distribution analysis in Figure 6(b) and (d) reveals that the alloy with the addition of rare earth elements exhibited grain sizes ranging from 60 to 90 μm, while the alloy without rare earth addition exhibited grain sizes ranging from 150 to 255 μm. Thus, the addition of rare earth elements is beneficial to the stability of the alloy’s grain size, indicating the uniformity of the microstructure and providing a basis for subsequent hot deformation processes.
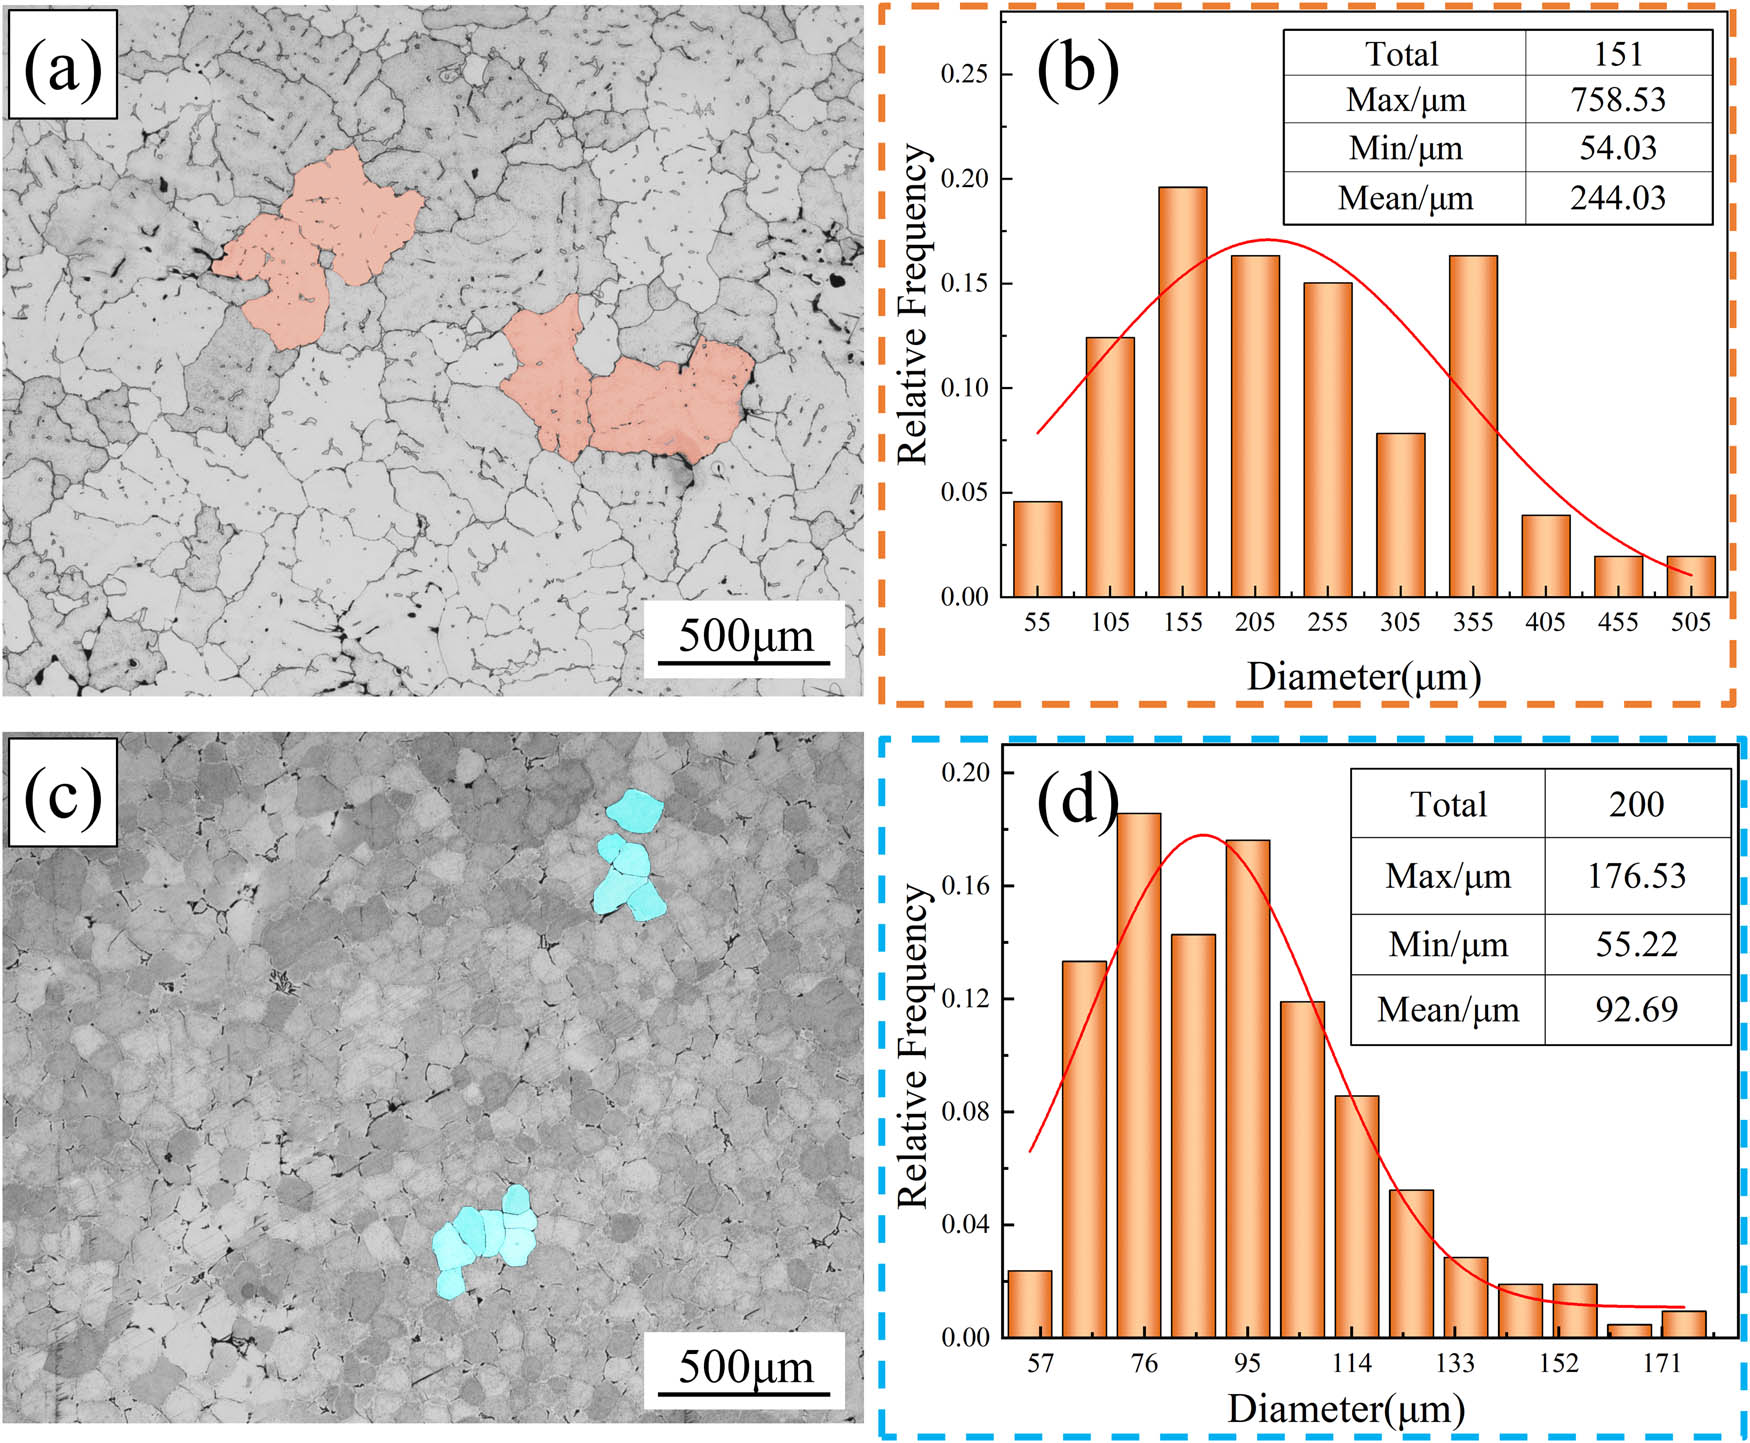
Optical micrographs and grain size distribution of the homogenization alloys: (a) and (b) alloy A; (c) and (d) alloy B.
In order to further understand the distribution of elements, elemental face scans were performed on alloy B before and after the homogenization treatment (as shown in Figure 7). A comparison between Figure 7(a) and (b) reveals a relatively weaker aggregation of Cu elements at the grain boundaries after homogenization, with Cu more abundantly present in the interior of the grains. The segregation effect of the rare earth element Nd also significantly improved after homogenization, although some Nd accumulation can still be observed at the white bright block (as shown in Figure 7, point G). The element molar ratios for the bright white polygonal block structure were calculated using EDS analysis. These ratios were found to be n Al:n Cu:n Nd ≈ 8:4:1. Based on these data and reports available in literature [17], this structure can be confidently identified as the Al8Cu4Nd phase. It can be seen from the energy spectrum results in Table 2 that there is a lower amount of Zn atom content present in the S phase compared with the Zn atom content of Mg (Zn, Cu, Al)2. The decrease of Zn atom content indicates that Zn atoms diffuse from the Mg (Zn, Cu, Al)2 phases to the matrix, resulting in the transformation of Mg (Zn, Cu, Al)2 to Al2CuMg [21,22] (Figure 7, point H). The existence of the S phase after homogenization is mainly due to the diffusion rate of Cu being much lower than that of Zn and Mg, due to which Cu atoms are easily enriched at the grain boundaries during homogenization (as shown in Figure 7).

SEM images and corresponding elements planar distributions of alloy B: (a) as-cast; (b) homogenization.
3.2 Recrystallization behavior
It is well known that coarse recrystallized grains greatly reduce the mechanical properties of the alloy. To determine the volume fraction of recrystallization, the samples were corroded using Graff’s reagent after extrusion and solid solution treatment. After treatment with Graff’s reagent, grain boundaries and sub-grain boundaries, which are sensitive to corrosion, appear black, while recrystallized grains appear white [23].
Figure 8 shows the OM images of the extruded samples. The metallographic structure consists of a large number of fine sub-grains and some coarse recrystallized grains. After extrusion, the grains are elongated along the ED direction and narrowed in the ND direction (as shown in Figure 8(a)–(d)). It is evident from the images that the recrystallization volume fraction of alloy B decreased significantly, and the recrystallization distribution was more uniform. The recrystallization volume fraction in the extrusion direction was calculated using ImageJ software, and the results are shown in Figure 9. The recrystallization volume fractions of alloy A and alloy B were found to be 33.5 and 22.7%, respectively. This means that in comparison to alloy A, the recrystallization volume fraction of alloy B decreased by 32.2%. This can be attributed to the precipitation of the fine rare earth phases in the alloy containing rare earth elements, which effectively pin GBs during hot deformation, thereby inhibiting recovery and recrystallization and preserving the deformed structure [24,25].
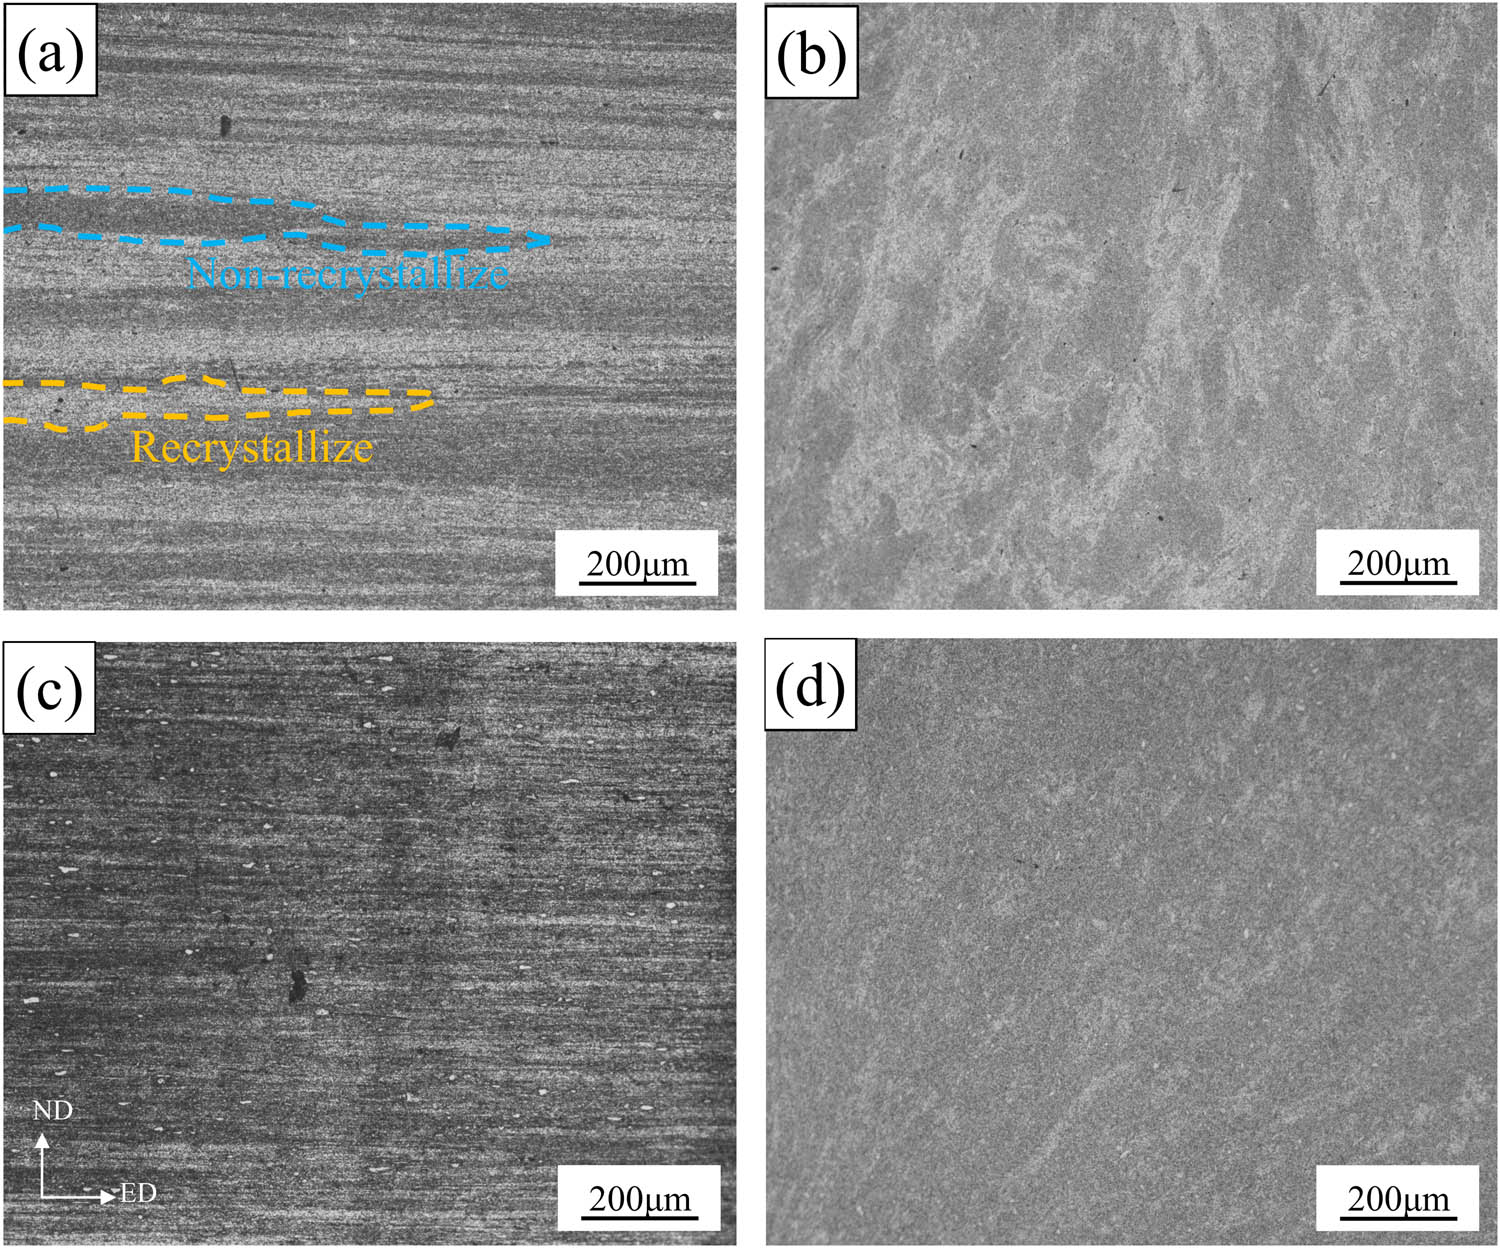
Metallographic organization of the extruded state along the ED and ND directions: (a) and (b) alloy A; (c) and (d) alloy B.
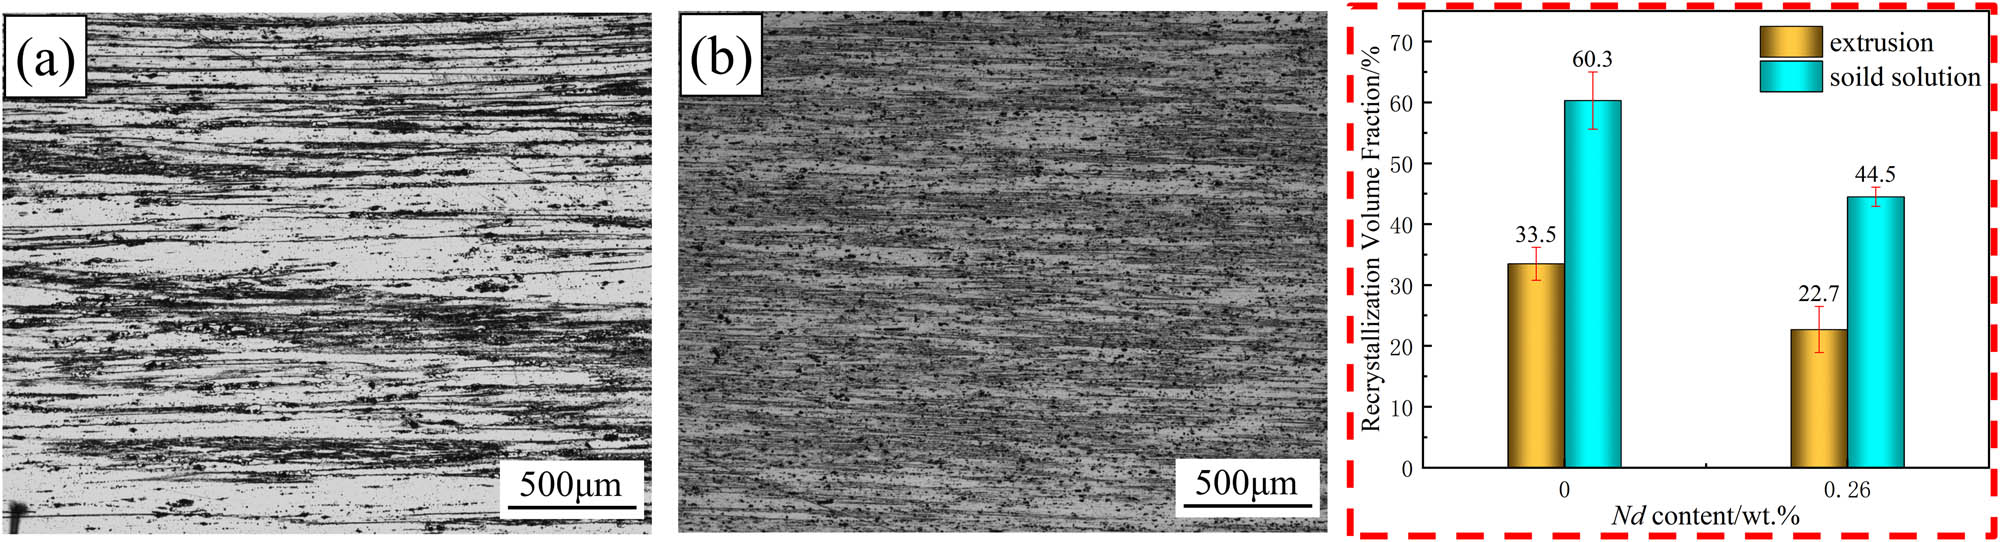
Metallographic diagram and recrystallization volume fraction diagram after solution treatment: (a) alloy A; (b) alloy B.
Figure 9 displays the metallographic image and recrystallization volume fraction after solid solution treatment. The figure shows that alloy A exhibited an obvious recrystallization phenomenon, with a recrystallization ratio of 60.3%. In contrast, alloy B maintained a predominantly non-recrystallized structure, with a recrystallization ratio of 44.5%, which is a decrease of 26.2% compared to alloy A. These results indicate that the addition of Nd has a better effect in inhibiting recrystallization and retaining the deformation recovery structure.
Figure 10 shows the SEM images of alloy A and alloy B after solid solution treatment. From Figure 10(a) and (b), it is observed that the alloy contains various sizes of hard and brittle phases after extrusion and solid solution treatment, ranging in size from 1 to 15 μm. The presence of larger-sized hard and brittle phases adversely affects the mechanical properties. By analyzing the volume fraction of residual secondary phases in the 10 SEM images using ImageJ software, it was found that the volume fraction of residual secondary phases in alloy B increased by 30.1% compared to alloy A. This indicates that the addition of the rare earth element Nd led to an increase in the content of hard and brittle phases in the alloy, resulting in reduced ductility. In alloy B, a significant amount of bright white block-like phases was observed, which persisted during subsequent aging processes and significantly impaired the mechanical properties of the alloy. To determine the composition of this phase, XRD and EDS analyses were performed on alloy B (as shown in Figure 11 and Table 3). The abundant bright white block-like phase was identified as the Al8Cu4Nd phase (as indicated by points A and B in Figure 10).
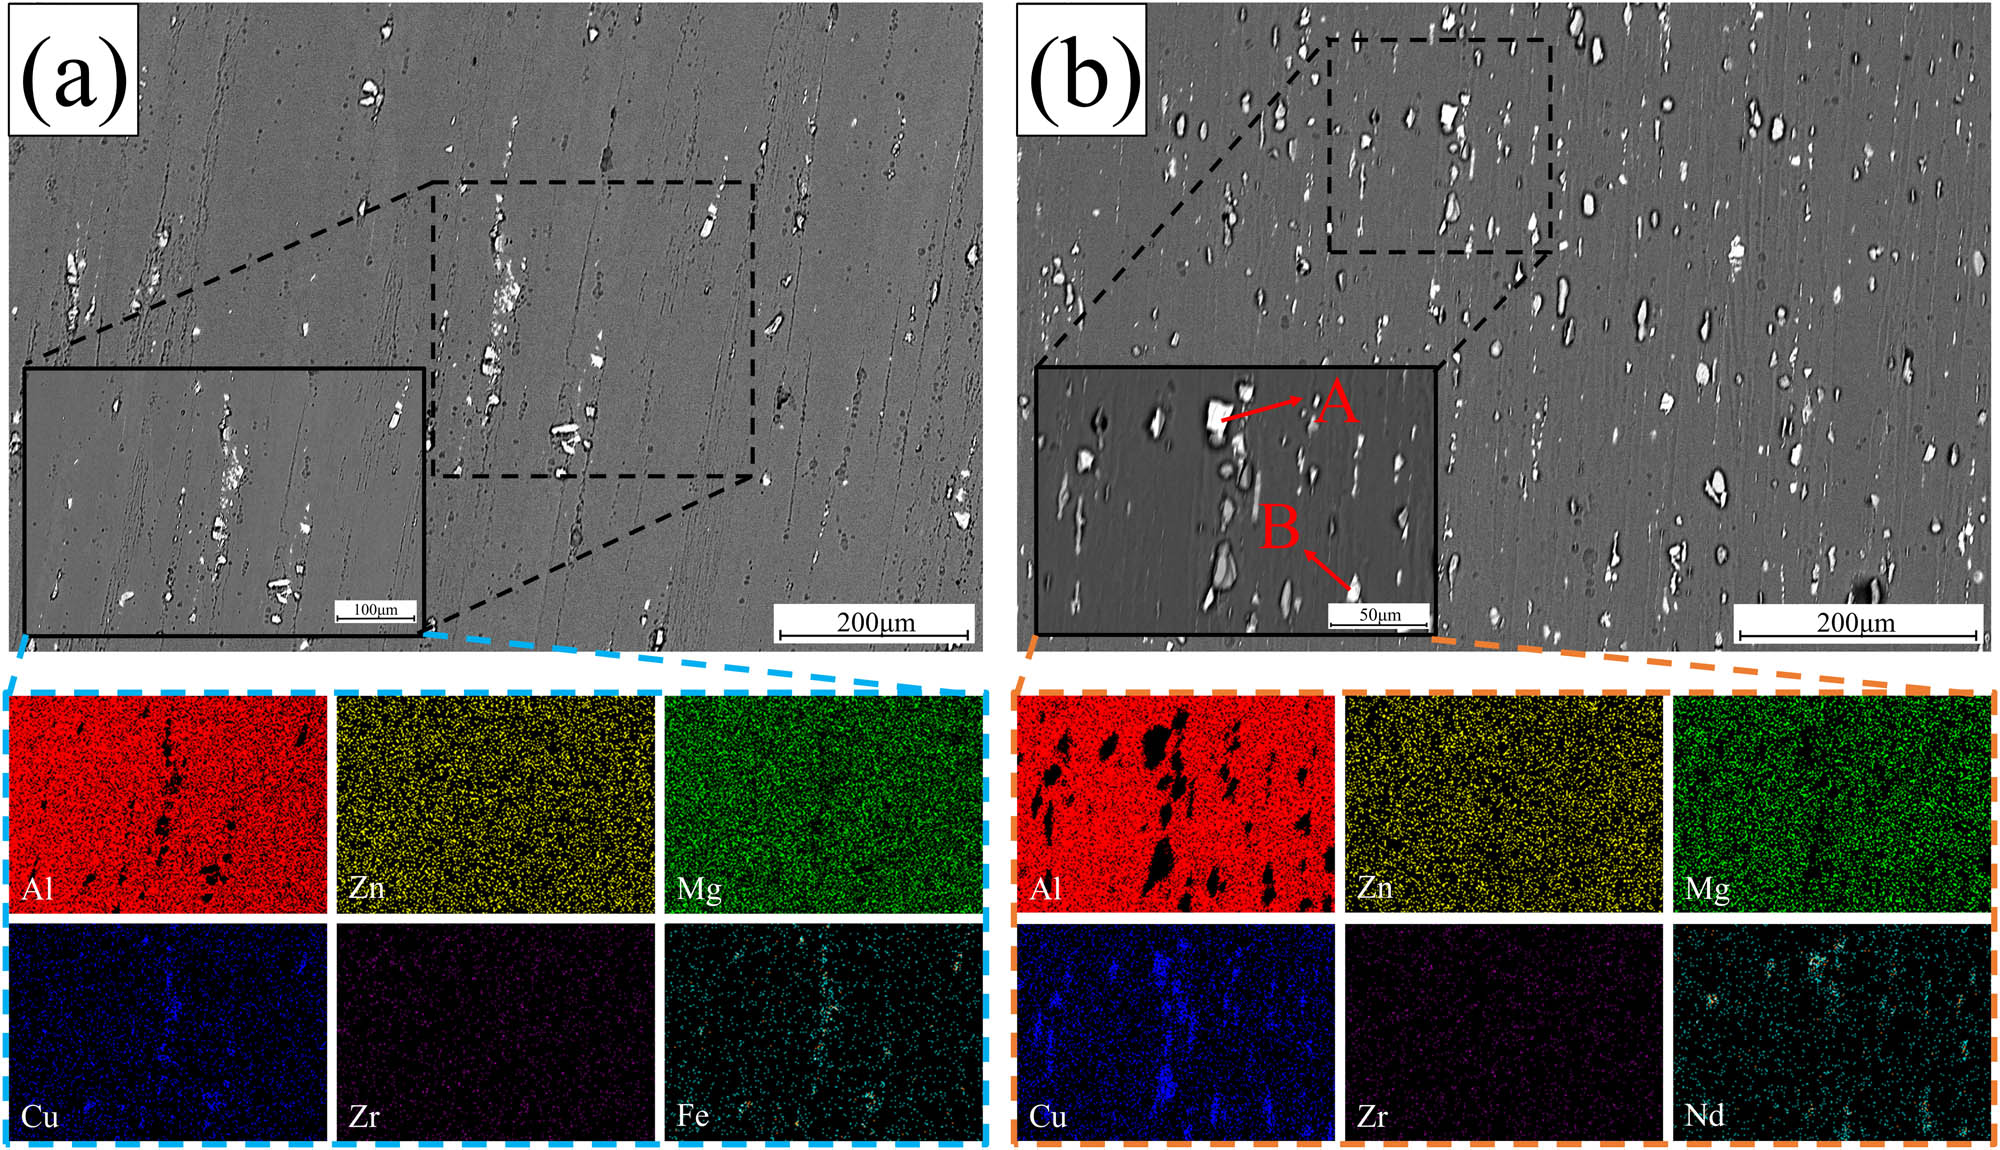
SEM images and corresponding elements planar distributions after solid solution alloy: (a) alloy A; (b) alloy B.
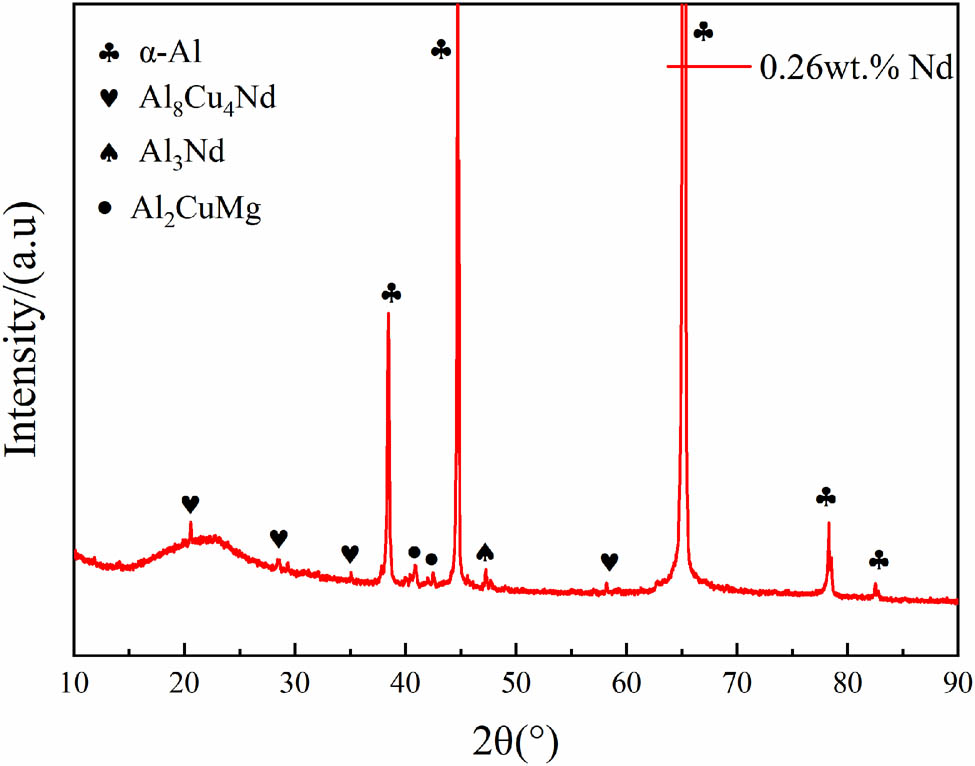
XRD Curve of alloy B after solid solution.
EDS Results of second-phase shown in Figure 10 (at.%)
| Point | Al | Zn | Mg | Cu | Fe | Zr | Nd | Likely phase |
|---|---|---|---|---|---|---|---|---|
| A | 60.24 | 5.22 | 1.10 | 27.42 | — | 0.25 | 5.76 | Al8Cu4Nd |
| B | 57.12 | 6.57 | 0.99 | 29.34 | — | 0.27 | 5.69 | Al8Cu4Nd |
3.3 Composition of rare earth phase
Figure 12(a) presents a bright-field transmission electron microscopy (TEM) image of alloy B displaying cluster-state nanoscale dispersed phases. Additionally, Figure 12(b) and (c) show high-resolution images highlighting the presence of Al–Nd phases, while Figure 12(d) represents the corresponding Fourier transform (FFT) pattern. From Figure 12(c), the interplanar spacing of the rare earth phase along the
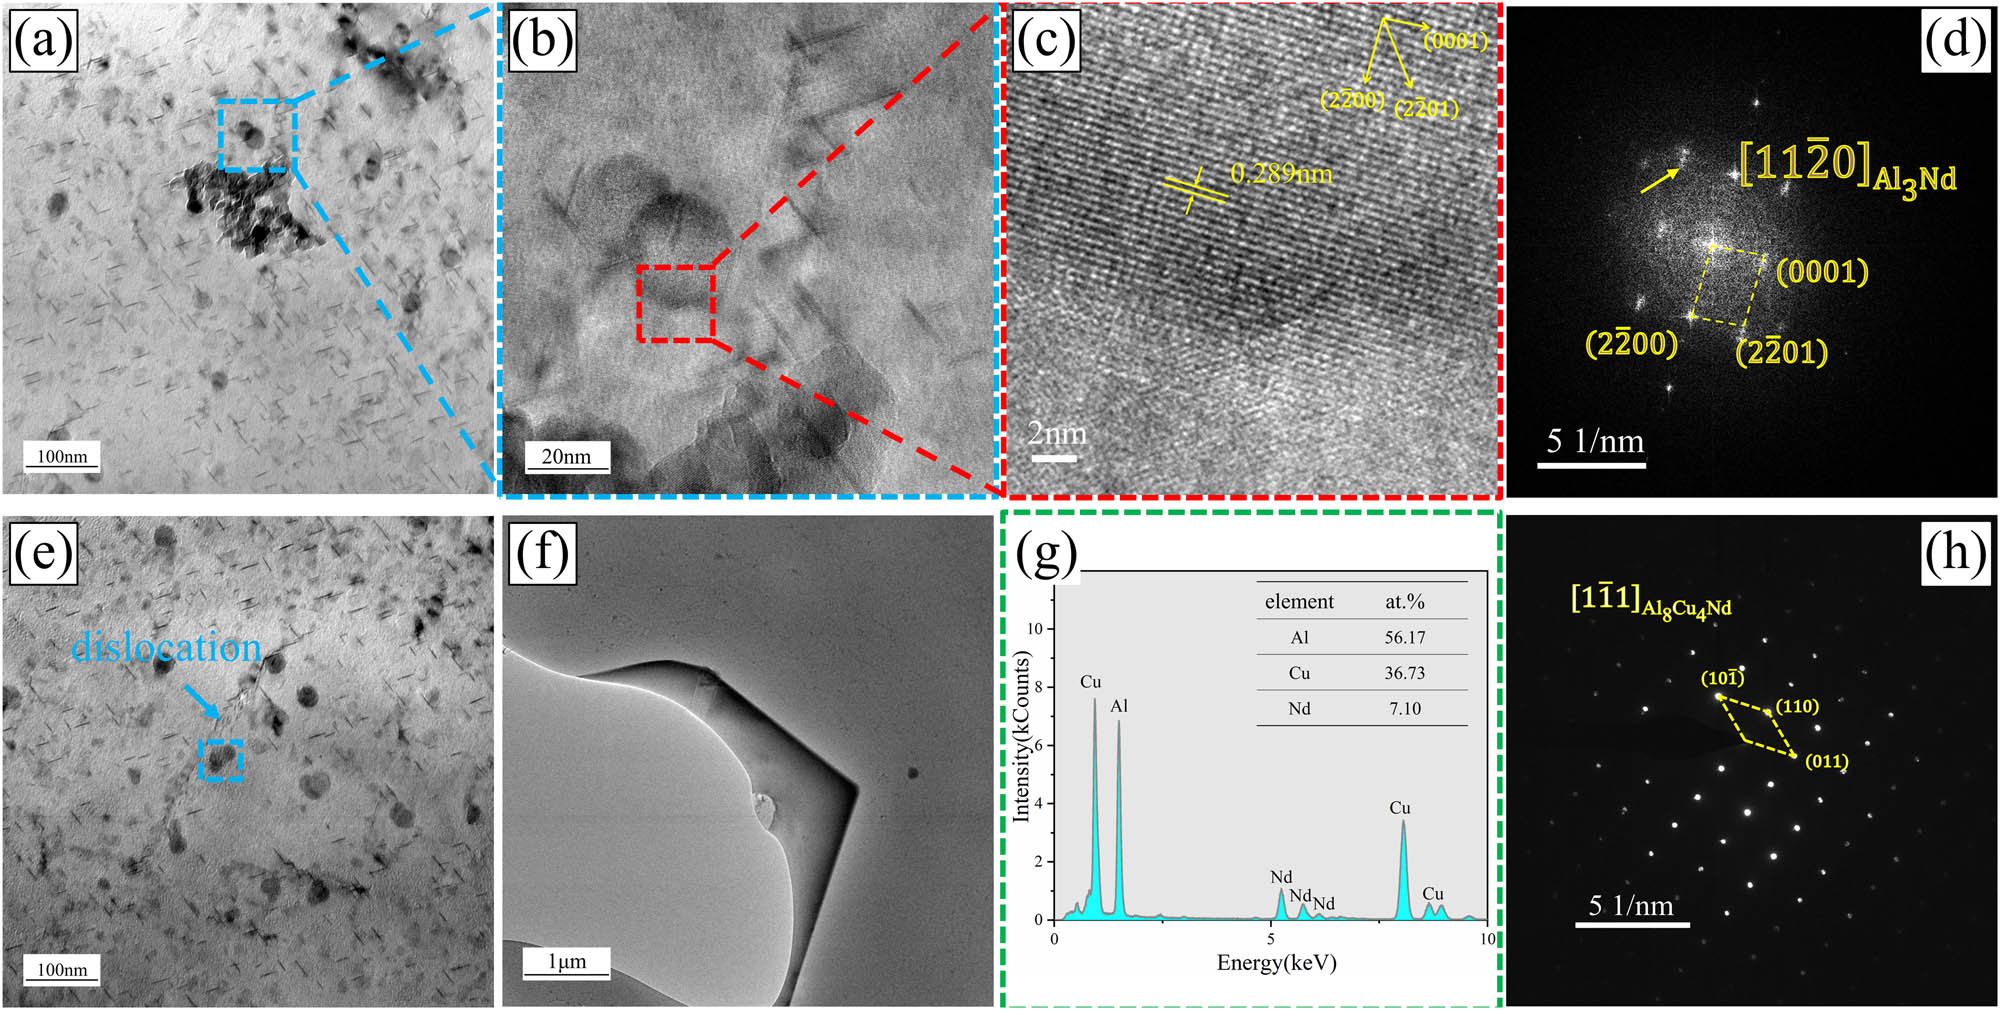
TEM images of alloy B: (a) TEM bright field image of cluster nano-dispersion phase; (b and c) HRTEM of rare earth phase; (d) FFT image corresponding to image (c); (e) rare earth phase hinders dislocation movement; (f) TEM bright field image of Al8Cu4Nd; (g) EDS analysis results of Al8Cu4Nd phase; and (h) SAED diagram of Al8Cu4Nd phase.
Figure 12(f) displays the micrometer-scale Al8Cu4Nd phase observed under TEM. To determine the composition of the large phase block, EDS and SAED analyses were conducted, which revealed an approximate molar ratio of nAl:nCu:nNd ≈ 8:4:1 for the phase (as shown in Figure 12(g)). Additionally, calibration using the SAED diffraction pattern along the
Therefore, in the Al–Zn–Mg–Cu–Zr alloy, the rare earth element Nd primarily consists in the form of the block-like micrometer-scale Al8Cu4Nd phase and the nanometer-scale Al3Nd phase. The Al3Nd phase within the grains mostly appears as spherical clusters. Figure 12(e) demonstrates the presence of spherical cluster-like Al3Nd phases (indicated by the blue dashed box) near dislocations within the grains, which hinder dislocation motion and exhibit strong stabilizing effects on the substructures in the deformed microstructure.
3.4 First-principles calculation of Al8Cu4Nd phase
In this study, a bulk Al8Cu4Nd phase was found in the prepared alloy B, and the mechanical properties of the phase were calculated using first principles based on density functional theory. The lattice constant and atomic positions of the Al8Cu4Nd phase were optimized, and the calculated crystal structure parameters were a = b = 8.96114 Å, c = 5.136493 Å, and α = β = γ = 90°. These values are consistent with the crystal structure parameters reported in the literature [7,26,27] (a = b = 8.789 Å, c = 5.143 Å, α = β = γ = 90°), indicating that the calculated parameters are reasonable. The crystal structure model is shown in Figure 13.
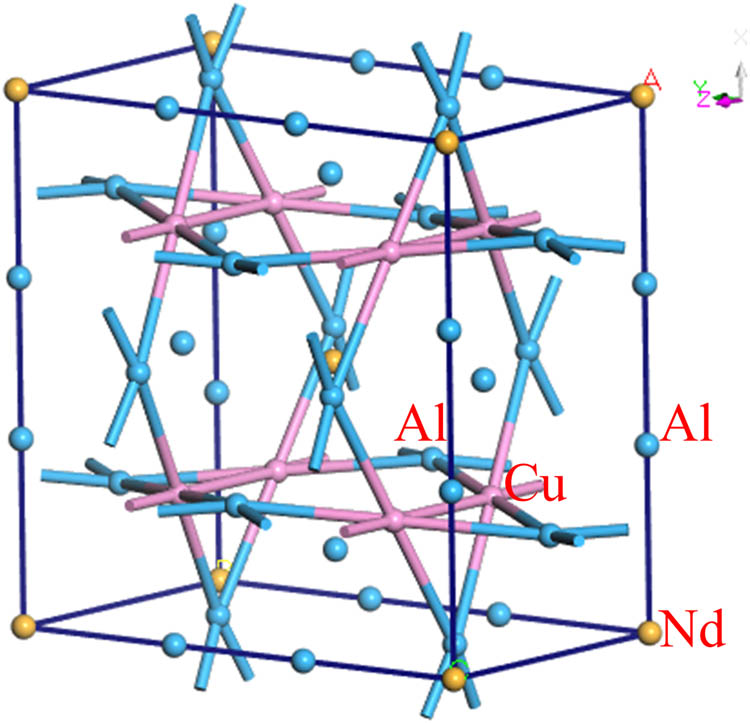
Crystal structure of Al8Cu4Nd.
The enthalpy of formation (ΔH) is utilized to characterize the alloying ability of the solid solution and intermetallic compound, with more negative values indicating easier compound formation and stronger alloying ability. Cohesive energy (E) is used to characterize the stability of a compound, with more negative values indicating higher stability and resistance to deformation [28]. The enthalpy of formation ΔH and cohesive energy E are calculated using formulas (1) and (2) [28,29,30].
In the formulas, E
tot represents the total energy of the crystal;
Enthalpy of formation and cohesive energy for the second phases present in alloy B
| Phase | Enthalpy of formation (eV per atom) | Cohesive energy (eV per atom) |
|---|---|---|
| Al2Cu | −0.2033 [31] | −3.9934 [31] |
| MgZn2 | −0.1428 [29] | −1.3767 [29] |
| Al3Zr | −0.51 [32] | −5.01 [32] |
| Al2CuMg | −0.2501 [31] | −3.4615 [31] |
| Al8Cu4Nd | −0.4184 | −3.3491 |
The calculation results indicate that all precipitated phases in the alloy had negative values, suggesting spontaneous reactions without the need for an external energy supply. Among the precipitated phases, Al3Zr exhibited the highest formation enthalpy and cohesive energy, indicating its ease of formation and higher stability. As shown in Table 4, the formation enthalpy and cohesive energy of the Al8Cu4Nd phase are −0.4184 and −3.3491 eV per atom, respectively. The phases are ranked in terms of formation enthalpy as follows: Al3Zr > Al8Cu4Nd > Al2CuMg > Al2Cu > MgZn2, while the ranking based on cohesive energy is: Al3Zr > Al2Cu > Al2CuMg > Al8Cu4Nd > MgZn2. The Al8Cu4Nd phase has a higher formation enthalpy and lower binding energy, indicating its ease of formation and relative stability in alloy B.
Al8Cu4Nd possesses a tetragonal crystal system [31], with six independent single-crystal elastic constants C11, C12, C13, C33, C44, and C66. The elastic constants of the single crystal are calculated using the optimized cell. By employing the calculation formula from literature [31], the polycrystalline elastic parameters (shear modulus G, bulk modulus B, Young’s modulus E, Poisson’s ratio ν) of the Al8Cu4Nd equilibrium phase were derived from the single-crystal elastic constants. The calculation results are shown in Tables 5 and 6.
Single crystal elastic constants of precipitated phase (GPa)
| Compounds | C11 | C12 | C13 | C33 | C44 | C55 | C66 |
|---|---|---|---|---|---|---|---|
| Al2Cu | 163.82 [31] | 78.16 [31] | 14.72 [31] | 246.67 [31] | 33.84 [31] | — | 37.26 [31] |
| MgZn2 | 85.84 [33] | 84.17 [33] | 19.86 [33] | 133.35 [33] | 19.81 [33] | — | — |
| Al3Zr | 203.11 [32] | 63.15 [32] | 43.21 [32] | 201.54 [32] | 83.61 [32] | — | 103.27 [32] |
| Al2CuMg | 156.47 [31] | 33.37 [31] | 62.61 [31] | 168.75 [31] | 43.74 [31] | 93.02 [31] | 50.71 [31] |
| Al8Cu4Nd | 189.1 | 53.1 | 54.7 | 193.6 | 61.4 | — | 59.02 |
Shear modulus G, Bulk modulus B, Young’s modulus E, and Poisson’s ratio ν for Al8Cu4Nd
| Compounds | G (GPa) | B (GPa) | E (GPa) | B/G | ν |
|---|---|---|---|---|---|
| Al2Cu | 47.21 [31] | 87.66 [31] | 120.08 [31] | 1.85 [31] | 0.27 [31] |
| MgZn2 | 20.17 [33] | 61.42 [33] | 54.54 [33] | 3.04 [33] | 0.35 [33] |
| Al3Zr | 85.7 [32] | 106.6 [32] | 202.8 [32] | 1.256 [32] | 0.17 [32] |
| Al2CuMg | 60.62 [31] | 80.80 [31] | 145.48 [31] | 1.33 [31] | 0.19 [31] |
| Al8Cu4Nd | 63.54 | 99.63 | 157.22 | 1.56 | 0.24 |
The shear modulus (G) characterizes the resistance to reversible deformation under shear stress, while the bulk modulus (B) characterizes the resistance to volume change and measures the average bonding strength of solid atoms. Young’s modulus (E) characterizes the ability to resist elastic deformation, with smaller values indicating better plasticity [34,35]. Poisson’s ratio (ν) expresses the brittleness and plasticity of a solid, with larger values indicating better material plasticity. According to Pugh’s empirical criterion, a larger B/G value indicates better material plasticity. If the B/G value is less than 1.75, the material is brittle; otherwise, it is considered plastic [35,36].
According to Table 6, the shear modulus of Al8Cu4Nd is 63.54 GPa, the bulk modulus is 99.63 GPa, Young’s modulus is 157.22 GPa, the B/G ratio is 1.56, and the Poisson’s ratio is 0.24. Compared to other compounds reported in Table 6, Al8Cu4Nd exhibits higher mechanical properties. Its shear and Young’s moduli are second only to Al3Zr, indicating its ability to resist deformation and withstand external stress. In terms of bulk modulus, it is second only to Al3Zr, reflecting a strong atomic bonding strength that enhances the structural stability and mechanical performance of the alloy [37] (corresponding to Table 4). Furthermore, based on the data in Table 6, the Poisson’s ratio of the Al8Cu4Nd phase is lower than that of MgZn2 and Al2Cu, and the B/G value is below 1.75, indicating that this phase is brittle and prone to significant deformation and fracture under stress. Considering the data from both Tables 4 and 6, Al8Cu4Nd exhibits high structural stability, deformation resistance, and brittle characteristics, which contribute to the improvement of the alloy’s mechanical properties.
3.5 Mechanical properties
3.5.1 Hardness test
Figure 14 shows the hardness of two different alloys after four-stage aging and thermal exposure at 120°C for 100 h. It can be clearly observed that the addition of rare earth Nd has a significant impact on the softening resistance of the alloy. In comparison to alloy A, the hardness of alloy B increased by 4.9%, reaching a value of 192.4 HV. Following the 120°C·100 h−1 thermal exposure, the hardness of the alloy A decreased by 17.7%, while the hardness of alloy B decreased by 6.6%. These results demonstrate that the addition of rare earth Nd can maintain a relatively high hardness value, ensuring good high-temperature stability even after prolonged thermal exposure.
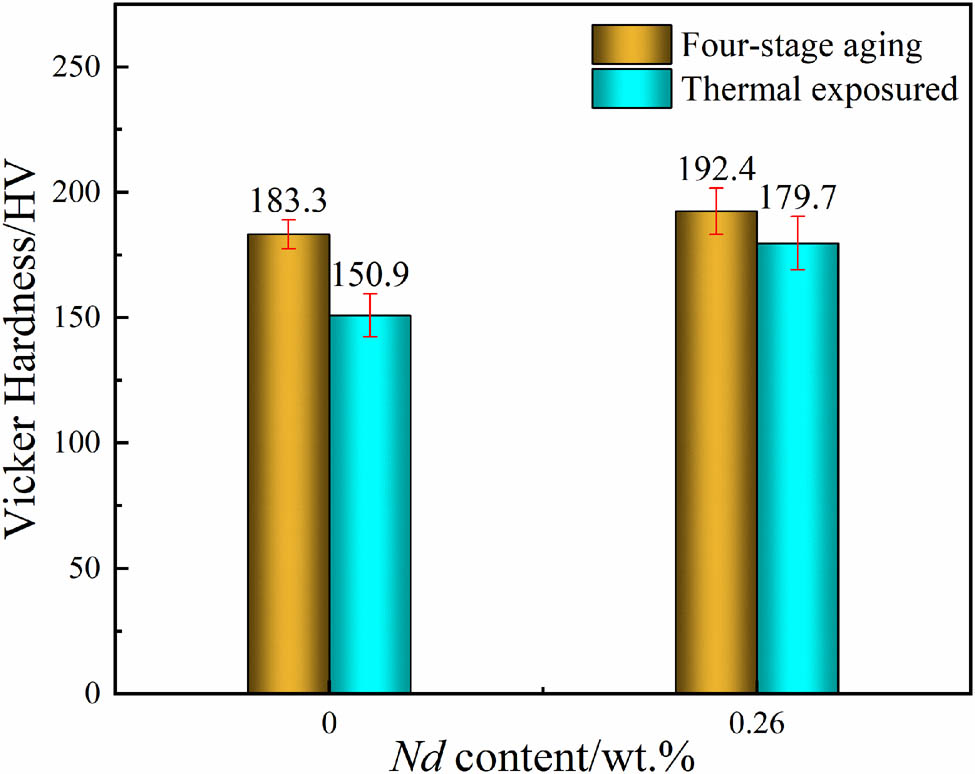
Hardness plot after four-stage aging and 120°C·100 h−1 thermal exposure.
Several factors influence the hardness of the alloy. During the solidification process of the alloy in casting, the rare earth element Nd, due to its relatively high diffusion rate, experiences aggregation at the forefront of the solid/liquid interface constrained by the solidification diffusion kinetics (as shown in Figure 7). Consequently, solute redistribution occurs during the nucleation and growth of crystals, resulting in compositional changes in the undercooled region [14,15]. This phenomenon exerts a certain inhibitory effect on the growth of dendrites during alloy solidification, thereby refining the grain size. Additionally, the presence of second-phase strengthening within the grains contributes to the observed hardness. With the addition of rare earth Nd, high-melting-point rare earth phases are formed, which effectively impede the motion of dislocations (as shown in Figure 12) and enhance the hardness of the alloy [38].
3.5.2 Tensile test
Figure 15 presents the engineering stress-strain curves of alloys A and B after four-stage aging and tensile testing at 120°C. From Figure 15 and Table 7, it is evident that temperature significantly influences the mechanical properties of the Al–Zn–Mg–Cu–Zr alloy. At room temperature, the addition of 0.26 wt% Nd increased the tensile strength of the alloy to 670.4 MPa, which is 37.5% higher than that of the alloy without rare earth addition (487.5 MPa). This enhancement can be attributed to the precipitation of fine Al3Nd dispersoids within the grains following the aging treatment, effectively impeding dislocation motion (as shown in Figure 12). During tensile testing at 120°C, the alloy with 0.26 wt% Nd exhibited a tensile strength of 396.2 MPa, which is 50.6% higher than that of the alloy without rare earth addition (263.0 MPa). These results indicate that the rare earth element Nd has a positive effect on the high-temperature performance of the alloy.
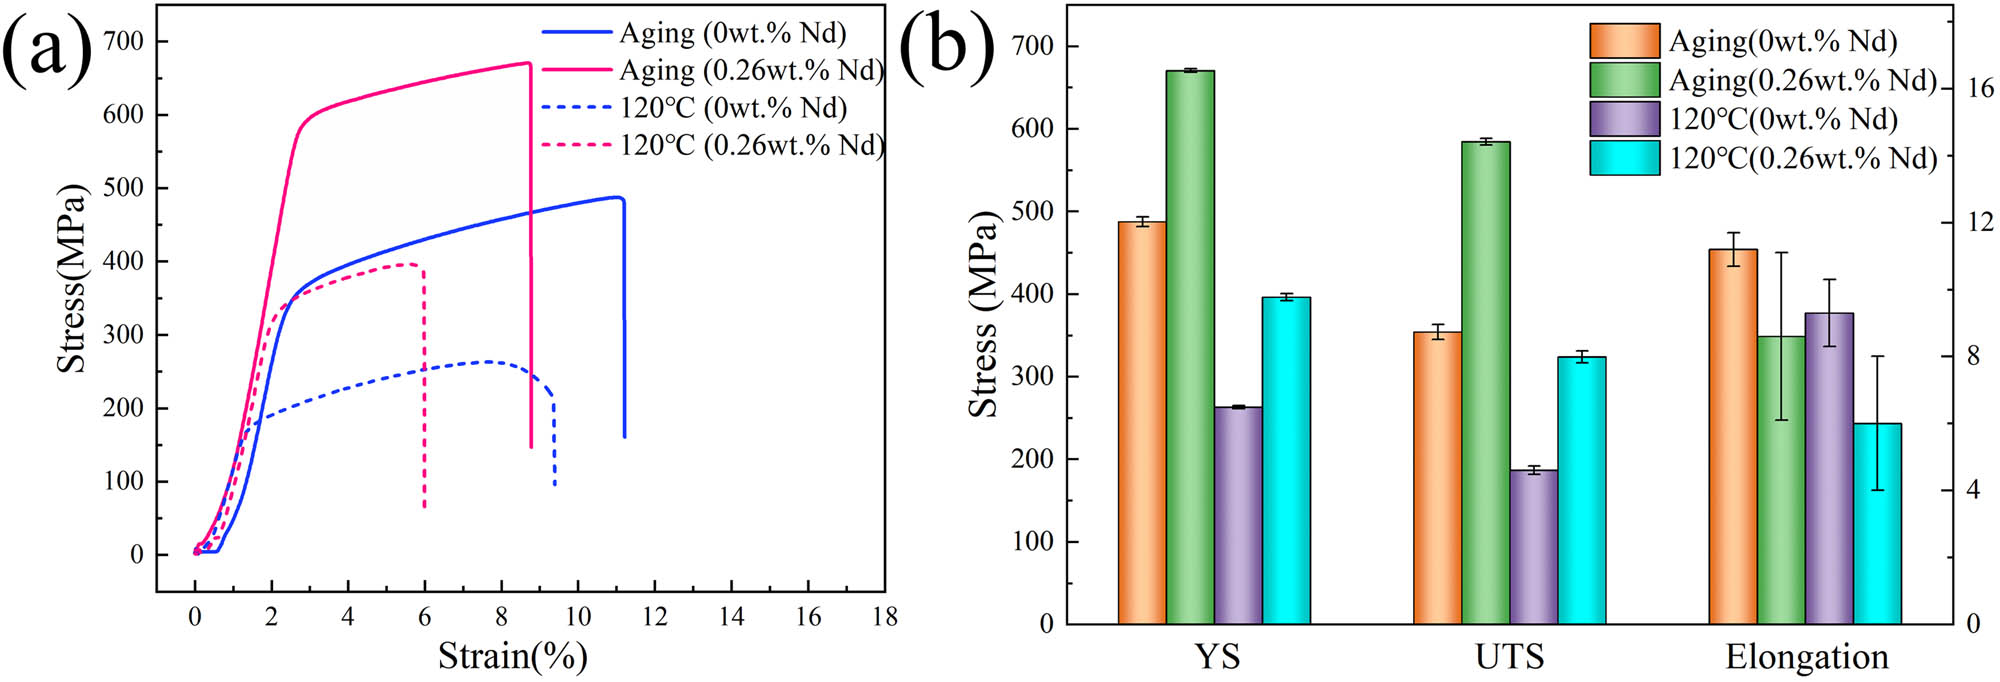
(a) Engineering stress–strain curves after four-stage aging and hot tensile at 120°C; (b) mechanical properties of the alloys after four-stage aging and hot tensile at 120°C.
Mechanical properties of the alloys after four-stage aging and hot tensile at 120°C
| Alloys | Four-stage aging treated | 120°C Hot tensile | ||||
|---|---|---|---|---|---|---|
| σ b (MPa) | σ 0.2 (MPa) | δ (%) | σ b (MPa) | σ 0.2 (MPa) | δ (%) | |
| A | 487.5 ± 6 | 354.0 ± 9 | 11.2 ± 0.5 | 263.0 ± 2 | 186.6 ± 5 | 9.3 ± 1 |
| B | 670.4 ± 2 | 584.5 ± 4 | 8.6 ± 2.5 | 396.2 ± 4 | 323.8 ± 7 | 6.0 ± 2 |
Regarding the elongation behavior shown in Figure 15, the addition of rare earth elements generally leads to a decrease in elongation. This decrease can be attributed to the presence of larger-sized high-melting-point rare earth phases (Al8Cu4Nd) within the alloy, ranging in size from 5 to 15 μm, which are prone to fracture during thermal deformation. The fractured Al8Cu4Nd phase is no longer intact, leading to the formation of cracks [20]. The presence of block-like rare earth phases adversely affects fracture toughness [20].
4 Conclusion
This study investigated the effects of rare earth Nd on the microstructure and mechanical properties of the Al–Zn–Mg–Cu–Zr alloy. The mechanical properties of the Al8Cu4Nd phase were calculated using first principles. Based on the findings of this study, the following conclusions can be drawn:
The addition of the Nd element in the Al–Zn–Mg–Cu–Zr alloy significantly improves the grain and dendrite size. The as-cast microstructure mainly consists of an α-Al matrix, lamellar T (AlZnMgCu) phase, a small amount of light gray θ (Al2Cu) phase, and bright white block Al8Cu4Nd phase. After homogenization treatment, the alloy with rare earth elements exhibits equiaxed grains with minimal changes in grain size, indicating structural uniformity and providing a foundation for subsequent hot deformation processes. The grain boundaries contain bright white bulk Al8Cu4Nd and gray S (Al2CuMg) phases.
After extrusion, the recrystallization volume fractions of the alloy without Nd and the alloy with 0.26 wt% Nd are 33.5 and 22.7%, respectively. Compared to the alloy without rare earth elements, the recrystallization volume fraction of the alloy with 0.26 wt% Nd is reduced by 32.2%. After solution treatment, the recrystallization volume fractions of the alloy without Nd and the alloy with 0.26 wt% Nd are 60.3% and 44.5%, respectively. Compared to the alloy without Nd, the recrystallization volume fraction of the alloy with 0.26 wt% Nd decreased by 26.2%. These results show that Nd has a significant effect on inhibiting recrystallization.
The addition of rare earth Nd to the Al–Zn–Mg–Cu–Zr alloy results in the presence of a micron-sized Al8Cu4Nd phase and nano-sized Al3Nd phase. The Al3Nd phase predominantly appears as spherical clusters within the grains and near dislocations, hindering dislocation movement, exhibiting a strong stabilizing effect on the substructure in the deformed state, and improving the mechanical properties of the alloy.
The Al8Cu4Nd phase has a higher formation enthalpy and lower binding energy, indicating its ease of formation and relative stability in the alloy. Compared to other compounds, Al8Cu4Nd exhibits high mechanical properties. Its shear modulus and Young’s modulus are second only to Al3Zr, indicating its ability to resist deformation and withstand external stress. In terms of bulk modulus, it is second only to Al3Zr, reflecting strong atomic bonding strength, which enhances the structural stability and mechanical performance of the alloy. In addition, the Al8Cu4Nd phase has a lower Poisson’s ratio compared to MgZn2 and Al2Cu, and the B/G value is below 1.75, indicating that the phase is brittle and prone to significant deformation and fracture under stress. In summary, Al8Cu4Nd exhibits high structural stability, deformation resistance, and brittle characteristics.
After the four-stage aging treatment, the hardness (192.4 HV) of the alloy containing 0.26 wt% Nd is 4.9% higher than that of the alloy without Nd. After thermal exposure, the hardness of the alloy without rare earth elements decreased by 17.7%, while the hardness of the alloy with 0.26 wt% Nd decreased by 6.6%. The alloy with Nd addition can maintain a high hardness value over an extended period at high temperatures. The tensile strength of the alloy with 0.26 wt% Nd at room temperature reaches 670.4 MPa, which is 37.5% higher than that of the alloy without rare earth (487.5 MPa). At 120°C, the tensile strength of the alloy with 0.26 wt% Nd reached 396.2 MPa, which was 50.6% higher than that of the alloy without rare earth (263.0 MPa), indicating that the rare earth element Nd can enhance the high-temperature mechanical properties of the alloy.
Acknowledgments
This research was funded by National Natural Science Foundation of China (Grant No. 51764043); Scientific and Technological Program of Innovation and Guidance of Inner Mongolia (Grant No. CBJ2018017); Inner Mongolia Youth Talent Program of Science and Technology (Grant No. NJYT-20-A16); Inner Mongolia Natural Science and Technology (Grant No. 2020MS05061). In addition, the authors thank the anonymous reviewers for their fruitful suggestions to improve the article.
-
Funding information: This research was funded by National Natural Science Foundation of China (Grant No. 51764043); Scientific and Technological Program of Innovation and Guidance of Inner Mongolia (Grant No. KCBJ2018017); Inner Mongolia Youth Talent Program of Science and Technology (Grant No. NJYT-20-A16); Inner Mongolia Natural Science and Technology (Grant No. 2020MS05061).
-
Author contributions: Experimental design, data analysis and writing – original draft preparation, Jianpeng Hao; writing – review and editing, Liangming Yan; first-principles calculation, Yuxin Dai. All authors have accepted responsibility for the entire content of this manuscript and approved its submission.
-
Conflict of interest: The authors state no conflict of interest.
-
Data availability statement: The datasets generated during and/or analyzed during the current study are available from the corresponding author on reasonable request.
References
[1] Wang, Y. C., L. F. Cao, X. D. Wu, Y. Zou, and G. J. Huang. Research progress on microstructure and properties of 7xxx series aluminum alloy for oil drill pipe. Materials Reports, Vol. 33, No. 7, 2019, pp. 1190–1197.Suche in Google Scholar
[2] Jabra, J., M. Romios, J. Lai, E. Lee, M. Setiawan, J. R. Ogren, et al. The effect of thermal exposure on the mechanical properties of 2099-T6 die forgings, 2099-T83 extrusions, 7075-T7651 plate, 7085-T7452 die forgings, 7085-T7651 plate, and 2397-T87 plate aluminum alloys. Journal of Materials Engineering and Performance, Vol. 15, No. 5, 2006, pp. 601–607.10.1361/105994906X136142Suche in Google Scholar
[3] Liu, Y. G., C. Feng, Q. Shi, Q. Lu, X. J. Li, and T. Xu. Petroleum and natural gas industries - aluminum alloy drill pipe. CHN. Patent 20659, 2017.Suche in Google Scholar
[4] Wang, X. H., J. Guo, J. Yan, L. Luo, M. Ye, and Y. H. Lin. Research progress on material production process and wear of aluminum alloy drilling rods. Transactions of Materials and Heat Treatment, Vol. 34, No. 1, 2013, pp. 1–6.Suche in Google Scholar
[5] Wang, Y., X. Wu, L. Cao, X. Tong, M. J. Couper, and Q. Liu. Effect of trace Er on the microstructure and properties of Al-Zn-Mg-Cu-Zr alloys during heat treatments. Materials Science & Engineering A, Vol. 792, 2020, pp. 1–13.10.1016/j.msea.2020.139807Suche in Google Scholar
[6] Sun, M. T., Z. Liu, X. H. Xie, Z. P. Chen, and T. Chen. Effect of NdXAlY compound on solidification microstructure refinement in semi-solid A356-Nd alloy. Chin Rare Earths, Vol. 40, No. 2, 2019, pp. 70–80.Suche in Google Scholar
[7] Knipling, K. E., D. C. Dunand, and D. N. Seidman. Criteria for developing castable, creep-resistant aluminum-based alloys – A review. International Journal of Materials Research, Vol. 97, No. 3, 2006, pp. 246–265.10.1515/ijmr-2006-0042Suche in Google Scholar
[8] Li, Y. Effects of trace Sc and Ti additions on microstructure and mechanical properties of commercially pure aluminum. Masteral dissertation. Zhengzhou University, He Nan, 2009.Suche in Google Scholar
[9] Zhang, L. G. Phase diagram and microstructural evolution of Al-Cu-RE alloy. Doctoral dissertation. Central South University, Chang Sha, 2010.Suche in Google Scholar
[10] Ning, Y. T., X. M. Zhou, and H. Dai. Study on metastable expansion of solid solubility of rare earth elements in Al. Acta Metallurgica Sinica, Vol. 10, No. 3, 1992, pp. 49–54.Suche in Google Scholar
[11] Zhai, F. L., L. P. Wang, X. Gao, Y. C. Feng, S. C. Zhao, and L. Wang. Study on phases formation and modification ability of rare earth elements La, Ce, Sm and Er in Al-Zn-Mg-Cu-Zr alloy. Transactions of the Indian Institute of Metals, Vol. 74, No. 11, 2021, pp. 2639–2649.10.1007/s12666-021-02337-zSuche in Google Scholar
[12] Liu, Y., D. M. Jiang, W. L. Xie, J. Hu, and B. Ma. Solidification phases and their evolution during homogenization of a DC cast Al-8.35Zn-2.5Mg-2.25Cu alloy. Materials Characterization, Vol. 96, 2014, pp. 173–183.10.1016/j.matchar.2014.04.004Suche in Google Scholar
[13] Wang, J. J., Y. C. Huang, Y. Liu, and L. Xu. Effects of Zn, Mg and Cu elements on as-cast microstructure and properties of Al-Zn-Mg-Cu-Zr-Er aluminum alloy. Hot Processing Technology, Vol. 48, No. 11, 2019, pp. 18–23.Suche in Google Scholar
[14] Wang, Y., B. Q. Xiong, Z. H. Li, S. H. Huang, K. Wen, X. W. Li, et al. As-cast microstructure of Al-Zn-Mg-Cu-Zr alloy containing trace amount of Sc. Rare Metals, Vol. 38, No. 4, 2019, pp. 343–349.10.1007/s12598-018-1136-5Suche in Google Scholar
[15] Liu, H., J. Sun, H. J. Fang, C. L. Shi, and K. Yu. Effect of Ce on microstructure and properties of 7B04 aluminum alloy. Heat Treatment of Metals, Vol. 43, No. 10, 2018, pp. 31–35.Suche in Google Scholar
[16] Du, L. and Y. Hong. Effect of La on microstructure and properties of AZ61 magnesium alloy. Journal of Materials Heat Treatment, Vol. 33, No. 1, 2012, pp. 42–46.Suche in Google Scholar
[17] Zhang, X. M., W. T. Wang, B. Liu, M. A. Chen, Y. Liu, Z. G. Gao, et al. Effect of Nd on microstructure and heat resistance of 2519 aluminum alloy. The Chinese Journal of Nonferrous Metals, Vol. 19, No. 1, 2009, pp. 15–20.Suche in Google Scholar
[18] Tian, S. K., J. Y. Li, J. L. Zhang, and D. Lv. Effect of Sc on microstructure and properties of 7056 aluminum alloy. Journal of Engineering Science, Vol. 4110, 2019, pp. 1298–1306.Suche in Google Scholar
[19] Mei, F. Q., S. H. Wang, C. F. Fang, L. G. Meng, F. Jia, H. Hao, et al. Effect of Gd on microstructure and mechanical properties of Al-Zn-Mg-Cu-Zr alloy. The Chinese Journal of Nonferrous Metals, Vol. 38, No. 2, 2012, pp. 258–261.Suche in Google Scholar
[20] Huang, Y. C., C. C. Zhang, X. W. Ren, Y. Liu, S. Z. Chen, and Y. L. Wang. The existence form of trace Er in high strength Al-Zn-Mg-Cu alloy and its genetic effect. Rare Metal Materials and Engineering, Vol. 48, No. 9, 2019, pp. 2848–2856.Suche in Google Scholar
[21] Yuan, X. X., D. F. Yin, X. X. Yu, K. G. Pan, S. K. Lu, T. Hu, et al. Homogenization annealing and microstructure evolution of Al-Zn-Mg-Cu-Zr-0.12Ce alloy ingots. Chinese Journal of Nonferrous Metals, Vol. 27, No. 3, 2017, pp. 459–467.Suche in Google Scholar
[22] Fan, X. G., D. M. Jiang, and Q. C. Meng. The microstructural evolution of an Al-Zn-Mg-Cu alloy during homogenization. Materials Letters, Vol. 6012, 2011, pp. 1475–1479.10.1016/j.matlet.2005.11.049Suche in Google Scholar
[23] Lin, H. Q., L. Y. Ye, L. Sun, T. Xiao, S. D. Liu, Y. L. Deng, et al. Effect of three-step homogenization on microstructure and properties of 7N01 aluminum alloys. Chinese Journal of Nonferrous Metals, Vol. 28, No. 2, 2018, pp. 829–838.10.1016/S1003-6326(18)64716-8Suche in Google Scholar
[24] Liu, C. Y., G. B. Teng, Z. Y. Ma, L. L. Wei, W. B. Zhou, H. F. Huang, et al. Mechanical properties and thermal stability of 7055 Al alloy by minor Sc addition. Rare Metals, Vol. 39, No. 6, 2020, pp. 725–732.10.1007/s12598-018-1190-zSuche in Google Scholar
[25] Wen, K., B. Q. Xiong, Y. Q. Fan, Y. A. Zhang, Z. H. Li, X. W. Li, et al. Transformation and dissolution of second phases during solution treatment of an Al-Zn-Mg-Cu alloy containing high zinc. Rare Metals, Vol. 37, No. 5, 2018, pp. 376–380.10.1007/s12598-016-0768-6Suche in Google Scholar
[26] Felner, I. and I. Nowik. Magnetism and hyperfine interactions of 57Fe, 151Eu, 155Gd, 161Dy, 166Er and 170Yb in RM4Al8 compounds (R = rare earth or Y, M = Cr, Mn, Fe, Cu). Journal of Physics & Chemistry of Solids, Vol. 40, No. 12, 1979, pp. 1035–1044.10.1016/0022-3697(79)90135-5Suche in Google Scholar
[27] Wang, H. M., R. Zheng, G. R. Li, and P. S. Li. First-principles study of electronic structure and magnetic properties of MgZn2 phase. Chinese Journal of Inorganic Chemistry, Vol. 31, No. 11, 2015, pp. 2143–2151.Suche in Google Scholar
[28] Huang, Y. C., Z. B. Xiao, H. H. Zhang, and Y. Liu. Effect of equilibrium phase on properties of Al-7.8Zn-1.6Mg-1.8Cu-0.12Zr aluminum alloy: First-principles study. Journal of Aeronautical Materials, Vol. 34, No. 3, 2014, pp. 28–34.Suche in Google Scholar
[29] Wu, M. M., L. Wen, B. Y. Tang, L. M. Peng, and W. J. Ding. First-principles study of elastic and electronic properties of MgZn2 and ScZn2 phases in Mg-Sc-Zn alloy. Journal of Alloys and Compounds, Vol. 506, No. 1, 2010, pp. 412–417.10.1016/j.jallcom.2010.07.018Suche in Google Scholar
[30] Guan, Y. Z., H. Y. Zhang, and W. Li. First-principles study on alloying stability, electronic structure, and mechanical properties of Al-based inter-metallics. Physica B Condensed Matter, Vol. 406, No. 1, 2011, pp. 1149–1153.10.1016/j.physb.2010.12.071Suche in Google Scholar
[31] Zhang, J., Y. H. Huang, C. Mao, and P. Peng. Structural, elastic and electronic properties of θ (Al2Cu) and S (Al2CuMg) strengthening precipitates in Al-Cu-Mg series alloys: First-principles calculations. Solid State Communications, Vol. 152, No. 23, 2012, pp. 2100–2104.10.1016/j.ssc.2012.09.003Suche in Google Scholar
[32] Li, C. M., X. Q. Jiang, N. P. Cheng, J. F. Tang, and Z. Q. Chen. First-principles investigation on formation energy, elasticity and interfacial properties of refining phase Al3(Zr, Sc) in Al alloys. Rare Metal Materials and Engineering, Vol. 49, No. 1, 2020, pp. 2557–2566.Suche in Google Scholar
[33] Chen, Q., Z. W. Huang, Z. D. Zhao, and D. Y. Shu. First principles study on elastic properties, thermodynamics and electronic structural of AB2 type phases in magnesium alloy. Solid State Communications, Vol. 162, No. 10, 2013, pp. 1–7.10.1016/j.ssc.2013.03.008Suche in Google Scholar
[34] Zhang, C., Y. J. Wan, W. J. Zou, X. Shang, and Y. B. Zhang. Composition optimization for Al-Zn-Mg-Cu alloys based on thermodynamics and first-principles calculations. Computational and Theoretical Chemistry, Vol. 1201, No. 1, 2021, id. 113293.10.1016/j.comptc.2021.113293Suche in Google Scholar
[35] Parvin, R., F. Parvin, M. S. Ali, and A. Islam. Band structure, Fermi surface, elastic, thermodynamic, and optical properties of AlZr3, AlCu3 and AlCu2Zr: First-principles study. Chinese Physics B, Vol. 25, No. 8, 2016, id. 083101.10.1088/1674-1056/25/8/083101Suche in Google Scholar
[36] Wan, Y., Y. Zeng, X. Qian, Q. Yang, and B. Jiang. First-principles calculations of structural, elastic and electronic properties of second phases and solid solutions in Ti-Al-V alloys. Physica B: Physics of Condensed Matter, Vol. 591, No. 15, 2020, id. 412241.10.1016/j.physb.2020.412241Suche in Google Scholar
[37] Cui, X. M., Z. L. Yu, F. Liu, Z. X. Du, and P. C. Bai. Influence of secondary phases on crack initiation and propagation during fracture process of as-cast Mg-Al-Zn-Nd alloy. Materials Science & Engineering, A, Vol. 759, No. 1, 2019, pp. 708–714.10.1016/j.msea.2019.05.062Suche in Google Scholar
[38] Wang, C. H., L. J. Yang, X. F. Xu, H. J. Fang, and Z. F. Lv. Effect of La on microstructure and properties of 7136 amluminum alloy. Heat Treatment of Metals, Vol. 44, 11, 2019, pp. 34–38.Suche in Google Scholar
© 2023 the author(s), published by De Gruyter
This work is licensed under the Creative Commons Attribution 4.0 International License.
Artikel in diesem Heft
- Review Articles
- Progress in preparation and ablation resistance of ultra-high-temperature ceramics modified C/C composites for extreme environment
- Solar lighting systems applied in photocatalysis to treat pollutants – A review
- Technological advances in three-dimensional skin tissue engineering
- Hybrid magnesium matrix composites: A review of reinforcement philosophies, mechanical and tribological characteristics
- Application prospect of calcium peroxide nanoparticles in biomedical field
- Research progress on basalt fiber-based functionalized composites
- Evaluation of the properties and applications of FRP bars and anchors: A review
- A critical review on mechanical, durability, and microstructural properties of industrial by-product-based geopolymer composites
- Multifunctional engineered cementitious composites modified with nanomaterials and their applications: An overview
- Role of bioglass derivatives in tissue regeneration and repair: A review
- Research progress on properties of cement-based composites incorporating graphene oxide
- Properties of ultra-high performance concrete and conventional concrete with coal bottom ash as aggregate replacement and nanoadditives: A review
- A scientometric review of the literature on the incorporation of steel fibers in ultra-high-performance concrete with research mapping knowledge
- Weldability of high nitrogen steels: A review
- Application of waste recycle tire steel fibers as a construction material in concrete
- Wear properties of graphene-reinforced aluminium metal matrix composite: A review
- Experimental investigations of electrodeposited Zn–Ni, Zn–Co, and Ni–Cr–Co–based novel coatings on AA7075 substrate to ameliorate the mechanical, abrasion, morphological, and corrosion properties for automotive applications
- Research evolution on self-healing asphalt: A scientometric review for knowledge mapping
- Recent developments in the mechanical properties of hybrid fiber metal laminates in the automotive industry: A review
- A review of microscopic characterization and related properties of fiber-incorporated cement-based materials
- Comparison and review of classical and machine learning-based constitutive models for polymers used in aeronautical thermoplastic composites
- Gold nanoparticle-based strategies against SARS-CoV-2: A review
- Poly-ferric sulphate as superior coagulant: A review on preparation methods and properties
- A review on ceramic waste-based concrete: A step toward sustainable concrete
- Modification of the structure and properties of oxide layers on aluminium alloys: A review
- A review of magnetically driven swimming microrobots: Material selection, structure design, control method, and applications
- Polyimide–nickel nanocomposites fabrication, properties, and applications: A review
- Design and analysis of timber-concrete-based civil structures and its applications: A brief review
- Effect of fiber treatment on physical and mechanical properties of natural fiber-reinforced composites: A review
- Blending and functionalisation modification of 3D printed polylactic acid for fused deposition modeling
- A critical review on functionally graded ceramic materials for cutting tools: Current trends and future prospects
- Heme iron as potential iron fortifier for food application – characterization by material techniques
- An overview of the research trends on fiber-reinforced shotcrete for construction applications
- High-entropy alloys: A review of their performance as promising materials for hydrogen and molten salt storage
- Effect of the axial compression ratio on the seismic behavior of resilient concrete walls with concealed column stirrups
- Research Articles
- Effect of fiber orientation and elevated temperature on the mechanical properties of unidirectional continuous kenaf reinforced PLA composites
- Optimizing the ECAP processing parameters of pure Cu through experimental, finite element, and response surface approaches
- Study on the solidification property and mechanism of soft soil based on the industrial waste residue
- Preparation and photocatalytic degradation of Sulfamethoxazole by g-C3N4 nano composite samples
- Impact of thermal modification on color and chemical changes of African padauk, merbau, mahogany, and iroko wood species
- The evaluation of the mechanical properties of glass, kenaf, and honeycomb fiber-reinforced composite
- Evaluation of a novel steel box-soft body combination for bridge protection against ship collision
- Study on the uniaxial compression constitutive relationship of modified yellow mud from minority dwelling in western Sichuan, China
- Ultrasonic longitudinal torsion-assisted biotic bone drilling: An experimental study
- Green synthesis, characterizations, and antibacterial activity of silver nanoparticles from Themeda quadrivalvis, in conjugation with macrolide antibiotics against respiratory pathogens
- Performance analysis of WEDM during the machining of Inconel 690 miniature gear using RSM and ANN modeling approaches
- Biosynthesis of Ag/bentonite, ZnO/bentonite, and Ag/ZnO/bentonite nanocomposites by aqueous leaf extract of Hagenia abyssinica for antibacterial activities
- Eco-friendly MoS2/waste coconut oil nanofluid for machining of magnesium implants
- Silica and kaolin reinforced aluminum matrix composite for heat storage
- Optimal design of glazed hollow bead thermal insulation mortar containing fly ash and slag based on response surface methodology
- Hemp seed oil nanoemulsion with Sapindus saponins as a potential carrier for iron supplement and vitamin D
- A numerical study on thin film flow and heat transfer enhancement for copper nanoparticles dispersed in ethylene glycol
- Research on complex multimodal vibration characteristics of offshore platform
- Applicability of fractal models for characterising pore structure of hybrid basalt–polypropylene fibre-reinforced concrete
- Influence of sodium silicate to precursor ratio on mechanical properties and durability of the metakaolin/fly ash alkali-activated sustainable mortar using manufactured sand
- An experimental study of bending resistance of multi-size PFRC beams
- Characterization, biocompatibility, and optimization of electrospun SF/PCL composite nanofiber films
- Morphological classification method and data-driven estimation of the joint roughness coefficient by consideration of two-order asperity
- Prediction and simulation of mechanical properties of borophene-reinforced epoxy nanocomposites using molecular dynamics and FEA
- Nanoemulsions of essential oils stabilized with saponins exhibiting antibacterial and antioxidative properties
- Fabrication and performance analysis of sustainable municipal solid waste incineration fly ash alkali-activated acoustic barriers
- Electrostatic-spinning construction of HCNTs@Ti3C2T x MXenes hybrid aerogel microspheres for tunable microwave absorption
- Investigation of the mechanical properties, surface quality, and energy efficiency of a fused filament fabrication for PA6
- Experimental study on mechanical properties of coal gangue base geopolymer recycled aggregate concrete reinforced by steel fiber and nano-Al2O3
- Hybrid bio-fiber/bio-ceramic composite materials: Mechanical performance, thermal stability, and morphological analysis
- Experimental study on recycled steel fiber-reinforced concrete under repeated impact
- Effect of rare earth Nd on the microstructural transformation and mechanical properties of 7xxx series aluminum alloys
- Color match evaluation using instrumental method for three single-shade resin composites before and after in-office bleaching
- Exploring temperature-resilient recycled aggregate concrete with waste rubber: An experimental and multi-objective optimization analysis
- Study on aging mechanism of SBS/SBR compound-modified asphalt based on molecular dynamics
- Evolution of the pore structure of pumice aggregate concrete and the effect on compressive strength
- Effect of alkaline treatment time of fibers and microcrystalline cellulose addition on mechanical properties of unsaturated polyester composites reinforced by cantala fibers
- Optimization of eggshell particles to produce eco-friendly green fillers with bamboo reinforcement in organic friction materials
- An effective approach to improve microstructure and tribological properties of cold sprayed Al alloys
- Luminescence and temperature-sensing properties of Li+, Na+, or K+, Tm3+, and Yb3+ co-doped Bi2WO6 phosphors
- Effect of molybdenum tailings aggregate on mechanical properties of engineered cementitious composites and stirrup-confined ECC stub columns
- Experimental study on the seismic performance of short shear walls comprising cold-formed steel and high-strength reinforced concrete with concealed bracing
- Failure criteria and microstructure evolution mechanism of the alkali–silica reaction of concrete
- Mechanical, fracture-deformation, and tribology behavior of fillers-reinforced sisal fiber composites for lightweight automotive applications
- UV aging behavior evolution characterization of HALS-modified asphalt based on micro-morphological features
- Preparation of VO2/graphene/SiC film by water vapor oxidation
- A semi-empirical model for predicting carbonation depth of RAC under two-dimensional conditions
- Comparison of the physical properties of different polyimide nanocomposite films containing organoclays varying in alkyl chain lengths
- Effects of freeze–thaw cycles on micro and meso-structural characteristics and mechanical properties of porous asphalt mixtures
- Flexural performance of a new type of slightly curved arc HRB400 steel bars reinforced one-way concrete slabs
- Alkali-activated binder based on red mud with class F fly ash and ground granulated blast-furnace slag under ambient temperature
- Facile synthesis of g-C3N4 nanosheets for effective degradation of organic pollutants via ball milling
- DEM study on the loading rate effect of marble under different confining pressures
- Conductive and self-cleaning composite membranes from corn husk nanofiber embedded with inorganic fillers (TiO2, CaO, and eggshell) by sol–gel and casting processes for smart membrane applications
- Laser re-melting of modified multimodal Cr3C2–NiCr coatings by HVOF: Effect on the microstructure and anticorrosion properties
- Damage constitutive model of jointed rock mass considering structural features and load effect
- Thermosetting polymer composites: Manufacturing and properties study
- CSG compressive strength prediction based on LSTM and interpretable machine learning
- Axial compression behavior and stress–strain relationship of slurry-wrapping treatment recycled aggregate concrete-filled steel tube short columns
- Space-time evolution characteristics of loaded gas-bearing coal fractures based on industrial μCT
- Dual-biprism-based single-camera high-speed 3D-digital image correlation for deformation measurement on sandwich structures under low velocity impact
- Effects of cold deformation modes on microstructure uniformity and mechanical properties of large 2219 Al–Cu alloy rings
- Basalt fiber as natural reinforcement to improve the performance of ecological grouting slurry for the conservation of earthen sites
- Interaction of micro-fluid structure in a pressure-driven duct flow with a nearby placed current-carrying wire: A numerical investigation
- A simulation modeling methodology considering random multiple shots for shot peening process
- Optimization and characterization of composite modified asphalt with pyrolytic carbon black and chicken feather fiber
- Synthesis, characterization, and application of the novel nanomagnet adsorbent for the removal of Cr(vi) ions
- Multi-perspective structural integrity-based computational investigations on airframe of Gyrodyne-configured multi-rotor UAV through coupled CFD and FEA approaches for various lightweight sandwich composites and alloys
- Influence of PVA fibers on the durability of cementitious composites under the wet–heat–salt coupling environment
- Compressive behavior of BFRP-confined ceramsite concrete: An experimental study and stress–strain model
- Interval models for uncertainty analysis and degradation prediction of the mechanical properties of rubber
- Preparation of PVDF-HFP/CB/Ni nanocomposite films for piezoelectric energy harvesting
- Frost resistance and life prediction of recycled brick aggregate concrete with waste polypropylene fiber
- Synthetic leathers as a possible source of chemicals and odorous substances in indoor environment
- Mechanical properties of seawater volcanic scoria aggregate concrete-filled circular GFRP and stainless steel tubes under axial compression
- Effect of curved anchor impellers on power consumption and hydrodynamic parameters of yield stress fluids (Bingham–Papanastasiou model) in stirred tanks
- All-dielectric tunable zero-refractive index metamaterials based on phase change materials
- Influence of ultrasonication time on the various properties of alkaline-treated mango seed waste filler reinforced PVA biocomposite
- Research on key casting process of high-grade CNC machine tool bed nodular cast iron
- Latest research progress of SiCp/Al composite for electronic packaging
- Special Issue on 3D and 4D Printing of Advanced Functional Materials - Part I
- Molecular dynamics simulation on electrohydrodynamic atomization: Stable dripping mode by pre-load voltage
- Research progress of metal-based additive manufacturing in medical implants