Dual-biprism-based single-camera high-speed 3D-digital image correlation for deformation measurement on sandwich structures under low velocity impact
-
Weiling Zhang
 ,
Zhongwei Zhang
,
Zhongwei Zhang

Abstract
Herein, a single-camera stereo digital image correlation (DIC) method is developed for dynamic deformation measurement, and a dual-biprism high-speed stereo camera system is proposed to capture surface images. Then, full-field displacement and strain distributions are obtained after correlation and differential calculation using the stereo-DIC algorithm. After a typical experiment is performed to verify the accuracy of the proposed system, full-field displacement and strain distributions of sandwich panels subjected to low-velocity impacts are determined. These results show that the proposed system is an efficient and convenient tool for dynamic deformation measurement.
1 Introduction
Sandwich structures have been widely used in the aerospace, civil engineering, and construction industries because of their high stiffness-to-weight and strength-to-weight ratios, favorable energy-absorbing capacity, and excellent heat resistance and sound insulation [1]. During establishment or in service in an engineering context, sandwich panels produce significant deformation or cracks and lose their original protective function under the impact of external objects [2]. Furthermore, the external and internal damages caused by the impacts can cause a sudden catastrophic failure due to the reduction of stiffness and strength of structures. Thus, it is important to implement deformation measurement and understand the mechanical behavior of the structures during impacts [3].
As a noncontact optical measurement technique, a digital image correlation (DIC) method is widely used to investigate the mechanical behavior and damage fracture of sandwich structures due to the advantages of environmental vulnerability, simple experimental setup, and specimen preparation, and wide range of measurement sensitivity and resolution [4,5]. To measure the 3D shape and deformation of objects, three-dimensional DIC (3D-DIC) was developed based on the principle of binocular stereo vision [6,7]. 3D-DIC has been widely used in multidisciplinary fields such as vibration monitoring [8], nondestructive testing [9], biomedical [10], and mechanical and microstructural characteristics [11,12]. In conjunction with high-speed cameras, 3D-DIC can be used for the dynamic deformation measurement. In recent years, high-speed 3D-DIC has been applied to study the mechanical properties of composite structures subjected to low-velocity impact (LVI). For example, some researchers used it to explore the failure mechanism of sandwich plate [13], the evolution of low-speed impact-damage of composite laminates [14], and the deformation/failure processes of hybrid lamina composites [15].
However, the traditional high-speed 3D-DIC measurement system composed of dual cameras has some limitations. For example, stringent synchronization of the two cameras is required, particularly when they are applied to high-speed measurements. Moreover, the system has high hardware costs. Furthermore, some regions cannot be determined when applying the system to objects in a narrow area because the baseline length between the two cameras is insufficient in such areas. To overcome the disadvantage of synchronization, researchers have developed various single-camera 3D-DIC methods, such as diffraction-based [16], mirror-assisted [17,18], prism-based [19,20], and illumination source-based techniques [21,22]. Most of these systems were always limited to quasi-static deformation measurements in our knowledge.
In this study, a dual-biprism-based single-camera 3D DIC system was proposed for the high-speed deformation measurement. On the basis of the dual biprism stereo camera 3D DIC method mentioned in a previous study, we aim to investigate the feasibility and practicality of this technique for dynamic deformation measurements. A single high-speed camera was used to capture the surface images of honeycomb sandwich panels subjected to LVI. Subsequently, the full-field displacement and strain distributions were obtained after correlation and differential calculation using the stereo-DIC algorithm.
2 Methodology and system
2.1 Dual-biprism-based DIC
Figure 1 shows a schematic of the dual-biprism-based single-camera dynamic (DSD) DIC system, which consists of a high-speed camera, two biprisms, and a mirror. The biprisms were placed symmetrically on both sides of the optical axis of the camera, and the bases were fitted at a certain angle. When the specimen was placed at an appropriate distance in front of the biprism system, the left and right halves of the camera sensor could be imaged equally. The obtained subimages were equivalent to the specimen images obtained from different perspectives using two virtual cameras, as shown in Figure 2. According to the optical geometric model of the biprism [9], the imaging coordinate matrix of the system can be expressed as follows:
where

Schematic of the dual-biprism-based single-camera dynamic DIC system.

FOV of the proposed system.
The field of view (FOV) can be changed by adjusting the angle between the two prisms or the position between the two prisms and camera. According to the virtual camera theory, there are two virtual optical axes. We assume that the FOVs of the right and left virtual cameras are represented by regions 1 and 2, respectively. The overlap of regions 1 and 2, as indicated by the yellow area, is the common observation field of the proposed system. As shown in Figure 2, the FOV can be expressed as follows:
where
where
2.2 Experimental set-up
Figure 3 shows a schematic of the experimental setup for the dynamic deformation measurement of the specimen subjected to LVI. The system consists of two parts: the proposed dual-biprism-based single-camera dynamic DIC system and the LVI test platform. A high-speed camera with 1,024 × 1,024 pixels and 6,400 full frame rate (Fastcam Mini AX200, PHOTRON Co., Ltd.) was used to record the deformation processing. To reduce the measurement error caused by external vibration, the DIC system was placed on an isolation platform composed of a cement base and a rubber base. During the experiment, a mirror reflection system was set up to record the images by the high-speed camera. The mirror was fixed in an inclined support with an angle of 45° to the horizontal direction. Two cold light sources were used to illuminate the nonimpact surface of the specimen, and the camera was focused on the nonimpact surface through the reflection of the mirror to perform the deformation measurement.

(a) Schematic of the experimental system for LVI, (b) mirror reflection system, and (c) test fixture.
2.3 Experimental procedure
Figure 4 shows the experimental procedure used to determine the full-field deformation using the proposed method. The first step involved image acquisition. A series of calibration and surface images of the specimen were recorded using the DSD system. For the surface images, one undeformed image was captured as a reference and the others were targets. The second step involved image cropping. When a biprism pair was placed in front of the camera, the sensor was split into two halves. Subsequently, one image was split into two equal subimages. Hence, the coupled images were cropped along the perspective boundaries, as indicated by the dotted yellow lines in Figure 4(a-1) and (a-2). The corresponding subimage pairs are shown in Figure 4(b-1) and (b-2). Calibration was performed to obtain the intrinsic and extrinsic parameters of camera. 3D shape reconstruction and displacement calculations can be achieved by performing stereo matching. In this study, the matching strategy illustrated in Figure 4(d) was applied owing to the lack of incremental correlation and error accumulation and better robustness. After determining displacement, the full-field strain distributions were obtained using different algorithms [23,24]. The iterative least-square method was used in this research.

Main experimental procedure of dual-biprism-based DIC. (a-1) calibration images, (a-2) deformtion images, (b-1) cropped calibation images, (b-2) cropped deformation images, (c) coordinate transformation, (d) matching strategy, (e) displacement distribution, and (f) strain distribution.
3 Experimental verification
To verify the accuracy of the proposed system, in-plane and out-of-plane displacements were measured and compared with the applied data. The calibration board was placed on the support, and the virtual images reflected by the plane mirror can be observed via the DSD system for calibration and displacement measurement. Figure 5 shows the schematic of the validation experiment. The two biprisms had the same optical parameters and sizes, with a refractive index of 1.5163 and a wedge angle of 45°. The plate used in the validation experiment was sized 100 mm × 100 mm × 1 mm, and the surface was sprayed with a random speckle. In-plane and out-of-plane translations were achieved using a 3D translation platform with an accuracy of 10 μm. During testing, the plate was fixed to the translation table, moving from −2.5 to −2.5 mm along the x, y, and z directions.

Relationship between applied and measured displacements: (a) x direction, (b) y direction, and (c) z direction.
Figure 5(a)–(c) represent the relationship between 3D displacement and the applied displacement measured along the x, y, and z directions, respectively. As shown in the figure, displacement occurred only along the axial direction of the movement, whereas almost no displacement occurred along other directions. Figure 6 shows the standard deviation of the different applied displacements along the three directions. The figure shows that the error increased with the translation distance. Furthermore, the standard deviation of the out-of-plane displacement was slightly greater than that of in-plane displacement, but all values were less than 30 μm. Therefore, the measurement accuracy of the entire system is relatively high.

Standard deviations of different applied displacements.
4 Application on sandwich plates
4.1 Materials
The proposed system was also applied on sandwich panels subjected to LVI. The face sheets and honeycomb core were made of aluminum and glued with an epoxy resin adhesive, as shown in Figure 7. The constituents of this alloy are listed in Table 1, and the mechanical properties of the honeycomb core and panel materials are listed in Table 2. The cell was a single layer of a positive hexagonal honeycomb with a length, thickness, and height of 6, 0.05, and 10 mm, respectively. The thickness of the front and rear panels was 0.5 mm, and the total thickness of the honeycomb sandwich structure was 11 mm. The honeycomb sandwich plates were cut into 100 mm × 100 mm before testing.
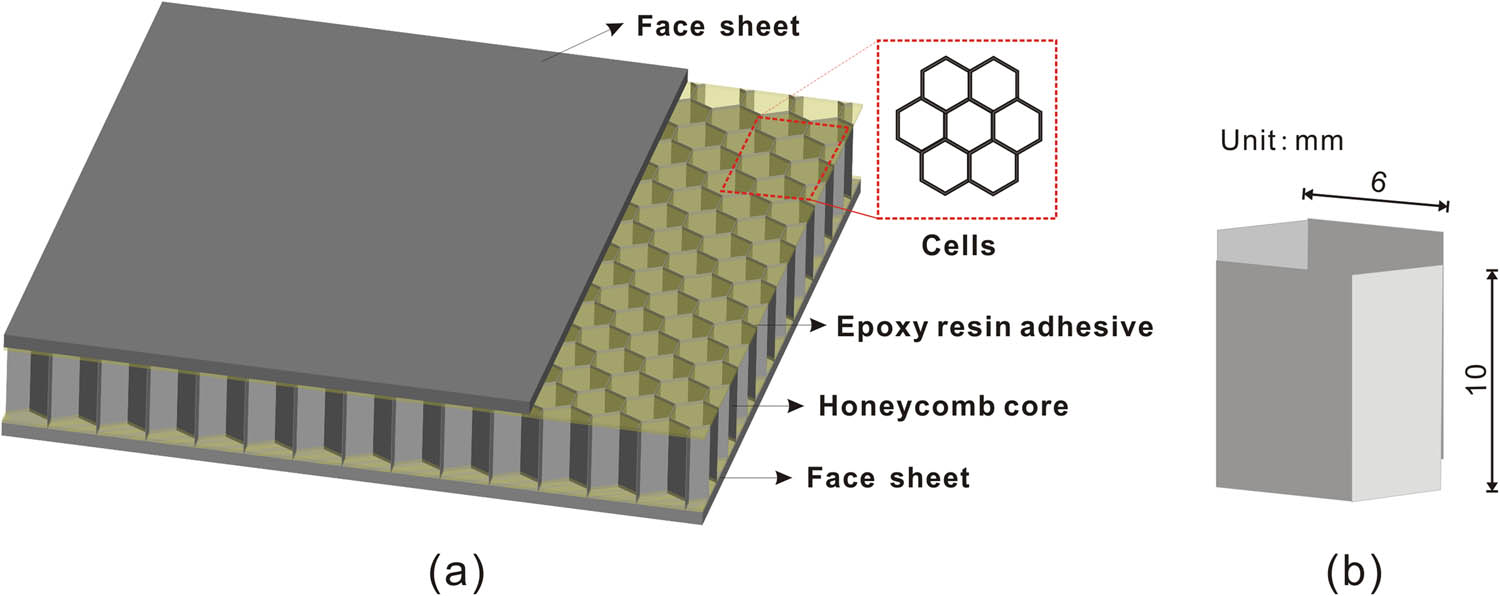
(a) Schematic diagram of structure of honeycomb sandwich plate and (b) dimension of cell.
Global chemical composition of aluminum alloy
| Element | Al | Si | Fe | Cu | Mn | Mg | Zn | Ti | Other |
|---|---|---|---|---|---|---|---|---|---|
| wt% | 99.18 | 0.25 | 0.35 | 0.05 | 0.03 | 0.03 | 0.05 | 0.03 | 0.03 |
Mechanical properties of honeycomb core and panel materials
| Young’s modulus of elasticity (GPa) | Poisson’s ratio | Density (g·cm−3) | |
|---|---|---|---|
| Honeycomb core | 68 | 0.32 | 2.70 |
| Panel | 70 | 0.34 | 2.71 |
4.2 Results and discussion
Both the single and repeated LVI tests were performed using a drop-weight impact machine with a 12-mm diameter hemispherical impactor according to the ASTM-D7136/D7136 M standard. The total mass of the impactor was 2.7 kg, and the maximum falling height of the setup was 2.0 m. The proposed optical system was used to record the deformation of the rear panels of sandwich structures. After calculating the displacement following the procedure mentioned earlier, the maximum displacement of the rear panel can be obtained.
Figure 8 shows the maximum displacement–time histories of the sandwich structure after LVIs. As is well known, the maximum displacement of the first impact at the same time is always greater than that of the second impact. The rate of shift change under the first impact was greater than that under the second impact, but the peak force arrived later. In addition, for the first impact, the maximum displacement tends to fall after the peak point, which indicates that there is a strain energy release and deformation rebound stage, and the sample still has impact-resistance and energy absorption properties. In contrast, although the second shock reached the peak displacement earlier, the maximum displacement was only 28% that of the first. In the unloading stage of the second impact, the specimen did not undergo significant displacement decline but exhibited a relatively flat fluctuation, which indicates that the specimen did not release energy on the observation surface. When the intact sample experienced the first impact, accompanied by collapse of the impact surface, compaction of the honeycomb core, and deformation of the nonimpact surface, the resistance to the impact force prolonged the entire loading process time.

Maximum displacement–time histories for sandwich structure after LVIs.
For the first impact with a monotonically increasing displacement, the course of the first impact can be divided into segments t 1, t 2, and t 3 based on the time required for the same displacement obtained by deformation. As the displacement increases by t 1, t 2, and t 3 gradually increase, which indicates that the increment in impact deformation decreases.
For the first impact, the curve increases monotonically and sharply before the displacement reaches the maximum value of 2.98 mm. After the peak point, the curve decreases slowly. Three points on the displacement–time curve were used to mark three different stages for the first impact history of the sandwich plate as shown in Figure 8. Starting from the reference, the time elapsed for each segment was t
1, t
2, and t
3, corresponding to the range of changes in the maximum displacement values of
Similarly, the second impact can be divided into t
4 and t
5 stages. Notably, t
4 and t
5 represent displacement fluctuation segments with a steady rising phase. The maximum displacement increments are
Figures 9 and 10 show the out-of-plane displacement distributions of the observed surfaces at typical moments during the first and second LVIs, respectively. When no visual damage occurred on the observation surface, the deformation was mainly concentrated at the impact position as an ellipse and spread. As shown in Figure 9, with the increasing impact force, the overall displacement of the observation surface increased, thereby resulting in a more concentrated trend when the specimen was subjected to the first LVI. At 4.1 ms, the observation surface was damaged, which is the reason for the sudden drop in the slope, as shown in Figure 8. Subsequently, the damage area gradually expanded.

Typical out-of-plane displacements of the structure subjected to the first LVI at different times.

Typical out-of-plane displacements of the structure subjected to the second LVI at different times.
When the structure was under the second LVI, the region adjacent to the impact center deviated less from the impact center, although the maximum displacement was still concentrated near the impact center. The deformation increment decreased significantly, which was caused primarily by the collapse and fracture of the honeycomb core material absorbing the impact and limited panel bearing force. It can also be found in Figures 9 and 10 that the damage area increased with impact time for the first LVI, while it did not increase significantly for the second LVI. The reason is that the honeycomb core improved the damage resistance as it helped in absorbing the impact energy during the impact. Most of the energy was absorbed and dispersed by transferring it to the adjacent honeycomb core, reducing the likelihood of puncture failure of the rear panel in the first impact. As for the second impact, the panels and core were broken at the initial state, and there was little damage expansion after penetration.
Figure 11 shows a comparison of the out-of-plane displacement distributions along the cross-section. The displacement of the first impact exhibited a good symmetrical distribution. Under the loading of the punch, the right side of the impact center cracked first until the end of the first LVI, and the maximum cracking width reached 6.4 mm. It should be noted that the crack position was random and influenced by many factors, such as the flatness, support, collimation of the impact, and integrity of the internal structure. For the second LVI, the distribution of displacement exhibited good symmetry only after 2.1 ms. The width of the region adjacent to the impact center changed less after the specimen was penetrated.

Out-of-plane displacements distributions along the cross section: (a) first impact and (b) second impact.
The full-field strain distributions of the sandwich structure were obtained based on the strain calculation algorithm. Figures 12 and 13 show the normal strains in the x and y directions for the first LVI at different times. The figures show that the strain concentration occurred primarily around the impact regions. The strain magnitudes increased as LVI proceeded. Moreover, the closer it is to the impact center, the greater the change in amplitude. In contrast, the strain in the area away from the impact center was smaller and had no significant fluctuations during impact processing. The normal strain in the x direction was presented as a vertically symmetrical butterfly shape except at 5 ms. This is because the areas located on the left and right sides were under compression, whereas the impact regions were in a state of tension. A similar distribution was also observed in the normal strain in the y direction.

Normal strain in the x direction for the first LVI at different times.

Normal strain in y direction for the first LVI at different times.
Figures 14 and 15 show the normal strains in the x and y directions for the second LVI at different times. As in the first impact, the strain magnitudes increased as the LVI proceeded, and the change in the amplitude was great closer to the impact center. However, the difference is that the strain no longer exhibited a butterfly-shaped distribution, but a flower-shaped distribution. Moreover, there are compressive and tensile areas around the impact point with a symmetrical distribution. In particular, the loading affected the core materials and panels around the impact area, although the panels were punched through. Then, a clear strain distribution around the impact region and fluctuations in the far-field are observed. This fluctuation faded with the impact time. It indicates that, during the impact, most of the energy was absorbed by the honeycomb core and panels near the impact center, causing severe plastic deformation, fragmentation, and buckling in the first LVI. As for the second impact, the impact energy spread out along the horizontal direction and reached the edges, while the energy transfer was slow in the vertical direction.

Normal strain in the x direction for the second LVI at different times.

Normal strain in the y direction for the second LVI at different times.
5 Conclusion
In this study, a dual-biprism-based single-high-speed camera stereo DIC system was developed for dynamic deformation measurement. The system comprises two biprisms, one reflection mirror, and a single high-speed camera, which makes it low cost and easy to implement and maintain. Moreover, it overcomes the synchronization issue associated with the use of two high-speed cameras. The effectiveness and accuracy of the system were verified using in-plane and out-of-plane displacement experiments.
The proposed system was used to investigate the full-field displacement and strain distributions of honeycomb sandwich panels subjected to LVI. For both the first and second LVIs, the overall displacement of the observation surface increased with the increasing impact force, thus leading to a more concentrated trend. For the first LVI, the strain magnitudes increased as the LVI proceeded. Furthermore, the change in amplitude was closer to the impact center. The normal strains in the x and y directions were presented as vertically symmetrical butterfly shapes, except at 5 ms. For the second LVI, the normal strains in the x and y directions were flower shaped owing to the compressive and tensile stresses around the impact center.
Although the proposed DSD DIC system achieved a good performance on determining the surface deformation of sandwich structures during the impacts in the current research. It has its own limitation of the loss of the spatial resolution as the CCD sensor was split into two halves to capture the stereo views. Further research on the developed system without resolution loss can be expected. Moreover, it is worth studying how to use the real-time displacement and strain field information for the design or property-enhancement of the materials in the future.
Acknowledgments
The authors thank the anonymous reviewers for their fruitful suggestions to improve the article.
-
Funding information: This work was supported by the National Natural Science Foundation of China (Nos. 12172200 and 11672167).
-
Author contributions: All authors have accepted responsibility for the entire content of this manuscript and approved its submission.
-
Conflict of interest: The authors state no conflict of interest.
References
[1] Dai, X., H. Ye, W. Yang, J. Qi, Y. Liu, T. Yuan, et al. Mechanical behaviors of inner and outer sidewalls of honeycomb cores subjected to out-of-plane compression. Aerospace Science and Technology, Vol. 127, 2022, id. 107659.10.1016/j.ast.2022.107659Search in Google Scholar
[2] Ahmad, S. I., H. Hamoudi, A. Abdala, Z. K. Ghouri, and K. M. Youssef. Graphene-reinforced bulk metal matrix composites: synthesis, microstructure, and properties. Reviews on Advanced Materials Science, Vol. 59, No. 1, 2020, pp. 67–114.10.1515/rams-2020-0007Search in Google Scholar
[3] Chen, Z., Y. Zhang, J. Wang, G. Hota, R. Liang, Y. Zhang, et al. Experimental and modeling investigations of the behaviors of syntactic foam sandwich panels with lattice webs under crushing loads. Reviews on Advanced Materials Science, Vol. 60, No. 1, 2021, pp. 450–465.10.1515/rams-2021-0040Search in Google Scholar
[4] Dai, X., T. Yuan, Z. Zu, H. Ye, X. Cheng, and F. Yang. Experimental investigation on the response and residual compressive property of honeycomb sandwich structures under single and repeated low velocity impacts. Materials Today Communications, Vol. 25, No. 1, 2020, id. 101309.10.1016/j.mtcomm.2020.101309Search in Google Scholar
[5] Ye, H., X. Dai, T. Yuan, J. Zhou, J. Zhang, and S. Shao. Residual compression property and response of honeycomb sandwich structures subjected to single and repeated quasi-static indentation. Reviews on Advanced Materials Science, Vol. 60, No. 1, 2021, pp. 404–417.10.1515/rams-2021-0033Search in Google Scholar
[6] Su, Z., J. Pan, S. Zhang, S. Wu, Q. Yu, and D. Zhang. Characterizing dynamic deformation of marine propeller blades with stroboscopic stereo digital image correlation. Mechanical Systems and Signal Processing, Vol. 162, 2021, id. 108072.10.1016/j.ymssp.2021.108072Search in Google Scholar
[7] Su, Y., Z. Gao, H. Tu, Y. Wang, Y. Liu, Z. Fang, et al. Uniformity and isotropy of speckle pattern cause the doubled random error phenomenon in digital image correlation. Optics and Lasers in Engineering, Vol. 131, 2020, id. 106097.10.1016/j.optlaseng.2020.106097Search in Google Scholar
[8] Wu, R., D. Zhang, Q. Yu, Y. Jiang, and D. Arola. Health monitoring of wind turbine blades in operation using three-dimensional digital image correlation. Mechanical Systems and Signal Processing, Vol. 130, 2019, pp. 470–483.10.1016/j.ymssp.2019.05.031Search in Google Scholar
[9] Yuan, T., X. Dai, X. Shao, Z. Zu, X. Cheng, F. Yang, and X. He. Dual-biprism-based digital image correlation for defect detection of pipelines. Optical Engineering, Vol. 58, No. 1, 2019, id. 014107.10.1117/1.OE.58.1.014107Search in Google Scholar
[10] Shao, X., X. Dai, Z. Chen, and X. He. Real-time 3D digital image correlation method and its application in human pulse monitoring. Applied Optics, Vol. 4, No. 55, 2016, id. 696.10.1364/AO.55.000696Search in Google Scholar PubMed
[11] Zhao, Y. and Y. Gu. Deformation mechanisms and plasticity of ultrafine-grained Al under complex stress state revealed by digital image correlation technique. Nanotechnology Reviews, Vol. 10, No. 1, 2021, pp. 73–86.10.1515/ntrev-2021-0007Search in Google Scholar
[12] Zhong, X., Z. Bai, J. Wu, H. Long, H. Deng, Z. Chen, et al. Microstructural characteristics and nano-modification of interfacial transition zone in concrete: A review. Nanotechnology Reviews, Vol. 11, No. 1, 2022, pp. 2078–2100.10.1515/ntrev-2022-0125Search in Google Scholar
[13] Bai, R., J. Guo, Z. Lei, D. Liu, and C. Yan. Compression after impact behavior of composite foam-core sandwich panels. Composite Structures, Vol. 225, 2019, id. 111181.10.1016/j.compstruct.2019.111181Search in Google Scholar
[14] Tuo, H., Z. Lu, X. Ma, J. Xing, and C. Zhang. Damage and failure mechanism of thin composite laminates under low-velocity impact and compression-after-impact loading conditions. Composites Part B: Engineering, Vol. 163, 2019, pp. 642–654.10.1016/j.compositesb.2019.01.006Search in Google Scholar
[15] Hao, X., T. Jin, X. Ma, X. Shu, and X. Li. Dynamic response of single curved fiber-metal hybrid lamina composites subject to low-velocity impact. International Journal of Impact Engineering, Vol. 164, 2022, id. 104209.10.1016/j.ijimpeng.2022.104209Search in Google Scholar
[16] Pan, B., L. Yu, and Q. Zhang. Review of single-camera stereo-digital image correlation techniques for full-field 3D shape and deformation measurement. Science China-Technological Sciences, Vol. 61, 2018, pp. 2–20.10.1007/s11431-017-9090-xSearch in Google Scholar
[17] Wang, R., X. Li, and Y. Zhang. Analysis and optimization of the stereo-system with a four-mirror adapter. Journal of the European Optical Society-Rapid Publications, Vol. 3, 2008, id. 08033.10.2971/jeos.2008.08033Search in Google Scholar
[18] Yu, L. and B. Pan. Structure parameter analysis and uncertainty evaluation for single-camera stereo-digital image correlation with a four-mirror adapter. Applied Optics, Vol. 55, 2016, pp. 6936–6946.10.1364/AO.55.006936Search in Google Scholar PubMed
[19] Lim, K. B. and Y. Xiao. Virtual stereovision system: new understanding on single-lens stereovision using a biprism. Journal of Electronic Imaging, Vol. 14, 2005, id. 043020.10.1117/1.2137654Search in Google Scholar
[20] Wu, L., J. Zhu, and H. Xie. A modified virtual point model of the 3D DIC technique using a single camera and a bi-prism. Measurement Science & Technology, Vol. 25, No. 11, 2014, id. 115008.10.1088/0957-0233/25/11/115008Search in Google Scholar
[21] Yu, L. and B. Pan. Color stereo-digital image correlation method using a single 3CCD color camera. Experimental Mechanics, Vol. 57, 2017, pp. 649–657.10.1007/s11340-017-0253-7Search in Google Scholar
[22] Li, J., X. Dan, W. Xu, Y. Wang, G. Yang, and L. Yang. 3D digital image correlation using single color camera pseudo-stereo system. Optics and Laser Technology, Vol. 95, 2017, pp. 1–7.10.1016/j.optlastec.2017.03.030Search in Google Scholar
[23] Pan, B., K. Qian, H. Xie, and A. Asundi. Two-dimensional digital image correlation for in-plane displacement and strain measurement: a review. Measurement Science and Technology, Vol. 20, 2009, id. 062001.10.1088/0957-0233/20/6/062001Search in Google Scholar
[24] Dai, X., H. Ye, T. Yuan, X. Shao, Z. Zu, X. Cheng, et al. Strain determination based on strain gauge-guided radial basis function and digital image correlation. Optics and Lasers in Engineering, Vol. 126, 2020, id. 105894.10.1016/j.optlaseng.2019.105894Search in Google Scholar
© 2023 the author(s), published by De Gruyter
This work is licensed under the Creative Commons Attribution 4.0 International License.
Articles in the same Issue
- Review Articles
- Progress in preparation and ablation resistance of ultra-high-temperature ceramics modified C/C composites for extreme environment
- Solar lighting systems applied in photocatalysis to treat pollutants – A review
- Technological advances in three-dimensional skin tissue engineering
- Hybrid magnesium matrix composites: A review of reinforcement philosophies, mechanical and tribological characteristics
- Application prospect of calcium peroxide nanoparticles in biomedical field
- Research progress on basalt fiber-based functionalized composites
- Evaluation of the properties and applications of FRP bars and anchors: A review
- A critical review on mechanical, durability, and microstructural properties of industrial by-product-based geopolymer composites
- Multifunctional engineered cementitious composites modified with nanomaterials and their applications: An overview
- Role of bioglass derivatives in tissue regeneration and repair: A review
- Research progress on properties of cement-based composites incorporating graphene oxide
- Properties of ultra-high performance concrete and conventional concrete with coal bottom ash as aggregate replacement and nanoadditives: A review
- A scientometric review of the literature on the incorporation of steel fibers in ultra-high-performance concrete with research mapping knowledge
- Weldability of high nitrogen steels: A review
- Application of waste recycle tire steel fibers as a construction material in concrete
- Wear properties of graphene-reinforced aluminium metal matrix composite: A review
- Experimental investigations of electrodeposited Zn–Ni, Zn–Co, and Ni–Cr–Co–based novel coatings on AA7075 substrate to ameliorate the mechanical, abrasion, morphological, and corrosion properties for automotive applications
- Research evolution on self-healing asphalt: A scientometric review for knowledge mapping
- Recent developments in the mechanical properties of hybrid fiber metal laminates in the automotive industry: A review
- A review of microscopic characterization and related properties of fiber-incorporated cement-based materials
- Comparison and review of classical and machine learning-based constitutive models for polymers used in aeronautical thermoplastic composites
- Gold nanoparticle-based strategies against SARS-CoV-2: A review
- Poly-ferric sulphate as superior coagulant: A review on preparation methods and properties
- A review on ceramic waste-based concrete: A step toward sustainable concrete
- Modification of the structure and properties of oxide layers on aluminium alloys: A review
- A review of magnetically driven swimming microrobots: Material selection, structure design, control method, and applications
- Polyimide–nickel nanocomposites fabrication, properties, and applications: A review
- Design and analysis of timber-concrete-based civil structures and its applications: A brief review
- Effect of fiber treatment on physical and mechanical properties of natural fiber-reinforced composites: A review
- Blending and functionalisation modification of 3D printed polylactic acid for fused deposition modeling
- A critical review on functionally graded ceramic materials for cutting tools: Current trends and future prospects
- Heme iron as potential iron fortifier for food application – characterization by material techniques
- An overview of the research trends on fiber-reinforced shotcrete for construction applications
- High-entropy alloys: A review of their performance as promising materials for hydrogen and molten salt storage
- Effect of the axial compression ratio on the seismic behavior of resilient concrete walls with concealed column stirrups
- Research Articles
- Effect of fiber orientation and elevated temperature on the mechanical properties of unidirectional continuous kenaf reinforced PLA composites
- Optimizing the ECAP processing parameters of pure Cu through experimental, finite element, and response surface approaches
- Study on the solidification property and mechanism of soft soil based on the industrial waste residue
- Preparation and photocatalytic degradation of Sulfamethoxazole by g-C3N4 nano composite samples
- Impact of thermal modification on color and chemical changes of African padauk, merbau, mahogany, and iroko wood species
- The evaluation of the mechanical properties of glass, kenaf, and honeycomb fiber-reinforced composite
- Evaluation of a novel steel box-soft body combination for bridge protection against ship collision
- Study on the uniaxial compression constitutive relationship of modified yellow mud from minority dwelling in western Sichuan, China
- Ultrasonic longitudinal torsion-assisted biotic bone drilling: An experimental study
- Green synthesis, characterizations, and antibacterial activity of silver nanoparticles from Themeda quadrivalvis, in conjugation with macrolide antibiotics against respiratory pathogens
- Performance analysis of WEDM during the machining of Inconel 690 miniature gear using RSM and ANN modeling approaches
- Biosynthesis of Ag/bentonite, ZnO/bentonite, and Ag/ZnO/bentonite nanocomposites by aqueous leaf extract of Hagenia abyssinica for antibacterial activities
- Eco-friendly MoS2/waste coconut oil nanofluid for machining of magnesium implants
- Silica and kaolin reinforced aluminum matrix composite for heat storage
- Optimal design of glazed hollow bead thermal insulation mortar containing fly ash and slag based on response surface methodology
- Hemp seed oil nanoemulsion with Sapindus saponins as a potential carrier for iron supplement and vitamin D
- A numerical study on thin film flow and heat transfer enhancement for copper nanoparticles dispersed in ethylene glycol
- Research on complex multimodal vibration characteristics of offshore platform
- Applicability of fractal models for characterising pore structure of hybrid basalt–polypropylene fibre-reinforced concrete
- Influence of sodium silicate to precursor ratio on mechanical properties and durability of the metakaolin/fly ash alkali-activated sustainable mortar using manufactured sand
- An experimental study of bending resistance of multi-size PFRC beams
- Characterization, biocompatibility, and optimization of electrospun SF/PCL composite nanofiber films
- Morphological classification method and data-driven estimation of the joint roughness coefficient by consideration of two-order asperity
- Prediction and simulation of mechanical properties of borophene-reinforced epoxy nanocomposites using molecular dynamics and FEA
- Nanoemulsions of essential oils stabilized with saponins exhibiting antibacterial and antioxidative properties
- Fabrication and performance analysis of sustainable municipal solid waste incineration fly ash alkali-activated acoustic barriers
- Electrostatic-spinning construction of HCNTs@Ti3C2T x MXenes hybrid aerogel microspheres for tunable microwave absorption
- Investigation of the mechanical properties, surface quality, and energy efficiency of a fused filament fabrication for PA6
- Experimental study on mechanical properties of coal gangue base geopolymer recycled aggregate concrete reinforced by steel fiber and nano-Al2O3
- Hybrid bio-fiber/bio-ceramic composite materials: Mechanical performance, thermal stability, and morphological analysis
- Experimental study on recycled steel fiber-reinforced concrete under repeated impact
- Effect of rare earth Nd on the microstructural transformation and mechanical properties of 7xxx series aluminum alloys
- Color match evaluation using instrumental method for three single-shade resin composites before and after in-office bleaching
- Exploring temperature-resilient recycled aggregate concrete with waste rubber: An experimental and multi-objective optimization analysis
- Study on aging mechanism of SBS/SBR compound-modified asphalt based on molecular dynamics
- Evolution of the pore structure of pumice aggregate concrete and the effect on compressive strength
- Effect of alkaline treatment time of fibers and microcrystalline cellulose addition on mechanical properties of unsaturated polyester composites reinforced by cantala fibers
- Optimization of eggshell particles to produce eco-friendly green fillers with bamboo reinforcement in organic friction materials
- An effective approach to improve microstructure and tribological properties of cold sprayed Al alloys
- Luminescence and temperature-sensing properties of Li+, Na+, or K+, Tm3+, and Yb3+ co-doped Bi2WO6 phosphors
- Effect of molybdenum tailings aggregate on mechanical properties of engineered cementitious composites and stirrup-confined ECC stub columns
- Experimental study on the seismic performance of short shear walls comprising cold-formed steel and high-strength reinforced concrete with concealed bracing
- Failure criteria and microstructure evolution mechanism of the alkali–silica reaction of concrete
- Mechanical, fracture-deformation, and tribology behavior of fillers-reinforced sisal fiber composites for lightweight automotive applications
- UV aging behavior evolution characterization of HALS-modified asphalt based on micro-morphological features
- Preparation of VO2/graphene/SiC film by water vapor oxidation
- A semi-empirical model for predicting carbonation depth of RAC under two-dimensional conditions
- Comparison of the physical properties of different polyimide nanocomposite films containing organoclays varying in alkyl chain lengths
- Effects of freeze–thaw cycles on micro and meso-structural characteristics and mechanical properties of porous asphalt mixtures
- Flexural performance of a new type of slightly curved arc HRB400 steel bars reinforced one-way concrete slabs
- Alkali-activated binder based on red mud with class F fly ash and ground granulated blast-furnace slag under ambient temperature
- Facile synthesis of g-C3N4 nanosheets for effective degradation of organic pollutants via ball milling
- DEM study on the loading rate effect of marble under different confining pressures
- Conductive and self-cleaning composite membranes from corn husk nanofiber embedded with inorganic fillers (TiO2, CaO, and eggshell) by sol–gel and casting processes for smart membrane applications
- Laser re-melting of modified multimodal Cr3C2–NiCr coatings by HVOF: Effect on the microstructure and anticorrosion properties
- Damage constitutive model of jointed rock mass considering structural features and load effect
- Thermosetting polymer composites: Manufacturing and properties study
- CSG compressive strength prediction based on LSTM and interpretable machine learning
- Axial compression behavior and stress–strain relationship of slurry-wrapping treatment recycled aggregate concrete-filled steel tube short columns
- Space-time evolution characteristics of loaded gas-bearing coal fractures based on industrial μCT
- Dual-biprism-based single-camera high-speed 3D-digital image correlation for deformation measurement on sandwich structures under low velocity impact
- Effects of cold deformation modes on microstructure uniformity and mechanical properties of large 2219 Al–Cu alloy rings
- Basalt fiber as natural reinforcement to improve the performance of ecological grouting slurry for the conservation of earthen sites
- Interaction of micro-fluid structure in a pressure-driven duct flow with a nearby placed current-carrying wire: A numerical investigation
- A simulation modeling methodology considering random multiple shots for shot peening process
- Optimization and characterization of composite modified asphalt with pyrolytic carbon black and chicken feather fiber
- Synthesis, characterization, and application of the novel nanomagnet adsorbent for the removal of Cr(vi) ions
- Multi-perspective structural integrity-based computational investigations on airframe of Gyrodyne-configured multi-rotor UAV through coupled CFD and FEA approaches for various lightweight sandwich composites and alloys
- Influence of PVA fibers on the durability of cementitious composites under the wet–heat–salt coupling environment
- Compressive behavior of BFRP-confined ceramsite concrete: An experimental study and stress–strain model
- Interval models for uncertainty analysis and degradation prediction of the mechanical properties of rubber
- Preparation of PVDF-HFP/CB/Ni nanocomposite films for piezoelectric energy harvesting
- Frost resistance and life prediction of recycled brick aggregate concrete with waste polypropylene fiber
- Synthetic leathers as a possible source of chemicals and odorous substances in indoor environment
- Mechanical properties of seawater volcanic scoria aggregate concrete-filled circular GFRP and stainless steel tubes under axial compression
- Effect of curved anchor impellers on power consumption and hydrodynamic parameters of yield stress fluids (Bingham–Papanastasiou model) in stirred tanks
- All-dielectric tunable zero-refractive index metamaterials based on phase change materials
- Influence of ultrasonication time on the various properties of alkaline-treated mango seed waste filler reinforced PVA biocomposite
- Research on key casting process of high-grade CNC machine tool bed nodular cast iron
- Latest research progress of SiCp/Al composite for electronic packaging
- Special Issue on 3D and 4D Printing of Advanced Functional Materials - Part I
- Molecular dynamics simulation on electrohydrodynamic atomization: Stable dripping mode by pre-load voltage
- Research progress of metal-based additive manufacturing in medical implants