Optimizing the ECAP processing parameters of pure Cu through experimental, finite element, and response surface approaches
-


Abstract
The main aim of the current work is to investigate the effect of equal channel angular pressing (ECAP) processing parameters, namely, number of passes, ECAP die angle, route type, and processing temperature on the mechanical and electrical properties of pure copper (Cu). The finite element method was used to simulate the homogeneity of stress and plastic strain distribution during ECAP processing. The response surface methodology (RSM) was used to identify the optimum ECAP processing parameters by analyzing the impact of ECAP conditions on responses. A second-order regression model and analysis of variance were created to analyze the ECAP condition of optimum responses. A genetic algorithm (GA) was also applied to optimize the ECAP condition. Finally, a hybrid RSM–GA was created to improve the optimization of ECAP responses and corresponding conditions evaluated using GA. The developed models were validated and compared with the experimental findings to prove that they are reliable as predictive tools. The optimization findings revealed that route Bc was more effective in improving the hardness, yield stress, ductility, and impact energy whereas route A was more effective in improving the ultimate tensile strength and the electrical conductivity of the Cu billets. Furthermore, the optimum die angle, number of passes, and processing temperature for the mechanical and electrical properties were also identified individually.
1 Introduction
Due to their high conductivity, corrosion resistance [1,2,3], high formability, and relatively elevated strength [4], copper (Cu) and Cu alloys are strongly nominated in a huge diverse of industrial applications such as automobile industries, transportation industries [1,4], electronic and electric industries [1,3,4,5], and structural applications [4,6]. In addition, the grain refining up to the ultrafine-grained (UFG) level or nano-sized (NS) level through severe plastic deformation (SPD) techniques produces superior Cu that possesses outstanding strength and ductility [7,8,9,10,11]. SPD techniques have the potential to refine both the pure and alloys of Cu to improve both the mechanical, electrochemical and physical properties [12,13,14,15].
Many SPD techniques are available now such as equal channel angular pressing (ECAP) [16,17,18,19,20], high pressure torsion [21,22,23,24], accumulative rolling bonding [25], twist extrusion [26] and multi-channel spiral twist extrusion [27,28,29,30]. Among the different SPD techniques, ECAP is the most effective technique in producing the UFG and NS materials [31,32,33,34] as well as improving the ductility [6,18]. As a result of its ability on forming large-scale samples compared to the SPD counterparts, ECAP is a promising candidate for further development of different industrial applications [35]. ECAP die consists of two channels with the same cross-section intersecting at a channel angle Φ, and with an angle of curvature, Ψ. The channel die angle has a significant effect on the shear strain imposed on the processed materials [6]. In addition, the ECAP processing route type also has a significant effect on both the microstructural evolution and mechanical properties of the ECAPed billets [15]. The common ECAP route types are A, Bc, and C. The processed sample is not rotated at all between the subsequent passes, whereas in routes Bc and C, the sample is rotated 90° and 180°, respectively, between subsequent passes [15]. The equivalent strain (ε eq) during ECAP processing in terms of the number of passes (n) can be calculated from equation (1) [17].
The development of functional outcomes in mathematical forms becomes a crucial requirement in now-a-days’ digital database era [36,37,38]. Prior research investigations used the response surface methodology (RSM) to optimize ECAP processing parameters of the commercial pure Cu. The processes can be created, altered, and optimized using RSM, an empirical collection of mathematical and statistical tools. With a set of efficient parameters based on their individual and combined effects, RSM blends real and simulated responses efficiency behavior [39]. The finite element method (FEM) was used by Daryadel [40] to model the ECAP process on the aluminum alloy AA7075 with Cu casing. The maximum necessary force and strain were examined using RSM in relation to the four ECAP parameters of channel angle, corner angle, friction coefficient, and casing thickness. By contrasting the experimental and simulation data, the predicted outcomes were confirmed. Analysis of variance (ANOVA) is used to illustrate the regression models for calculating the maximum forming force and strain. According to the author, channel angle has the greatest impact on the resultant force. Similar to how channel and corner angle affected strain, Cu thickness and friction coefficient had no discernible impact on the strain. Finally, for channel angle, corner angle, friction coefficient, and casing thickness, respectively, the estimated optimal ECAP conditions for decreasing the maximum forming force and increasing the strain were 93.64°, 0°, 0.001°, and 1.62 mm. In order to improve the mechanical properties, the ECAP technique was utilized after cold compacting and hot extruding the recycled billets of aluminum alloy AA6061 chip, according to Abbas et al.’s [41] investigation. Surface roughness and metal removal rate were measured as performance factors for the ECAP process under varied cutting parameters and the number of passes. The authors concluded that the parameter feed had the greatest impact on the generated surface roughness. The optimal multi-objective value of the generated surface and the metal removal rate were also obtained using the method of the desirability function. The lowest value of surface roughness and the highest rate of metal removal were achieved with the following cutting parameters: 195 m·min−1 cutting velocity, 0.073 mm·rev−1, 0.4 mm cut depth, and 3 passes of the ECAP process.
For modeling and optimization under RSM, central composite design (CCD) is used. CCD, desire function (DF), and genetic algorithm (GA) can be utilized to improve any process’ reaction performance without creating localized uncertainty at the optimum location [39]. GA is used to optimize the RSM without introducing localized optimum point uncertainty. Science and engineering have employed GA as an intelligent and successful technique for solving real-world optimization problems in a cost-effective approach. In each individual, the GA generates an optimization algorithm and a random number of generations, whereas the conventional convention algorithm generates only a single point and uses a deterministic rule to determine the next generation. Every generation evaluates each person’s fitness function. The GA employs criteria to establish a global minimum fitness function value and guarantees convergence of the outcome [42,43].
To improve the process condition, many researchers have employed hybrid RSM–GA. Deshwal et al. [44] employed a statistical method outfitted with a variety of hybrid static tools to study the tensile strength of a poly lactic acid (PLA)-generated item produced by 3D printing technology known as fused deposition modeling (FDM). A study was done to determine how the infill density, temperature, and speed of the FDM process affected the maximum tensile strength. Hybrid optimization techniques including genetic algorithm–artificial neural network (GA–ANN), GA–RSM, and genetic algorithm–adaptive neuro-fuzzy interface system (GA-ANFIS) are used to optimize the parameters of the FDM process. The percentage accuracy of GA–ANN, GA–RSM, and GA–ANFIS, respectively, is 99.89, 99.3, and 99.55%, according to the author’s analysis. Additionally, the GA–ANN method yielded PLA with a maximum tensile strength of 47.0212 MPa at optimal conditions of 100% infill density, 210°C temperature, and 124.778 mm·s−1 speed.
There are not many research works looking at ECAP performance numerically. Therefore, the present study aims to obtain the optimal ECAP conditions of performance characteristics: impact toughness (I T), electrical conductivity (E C), hardness at two different positions, center (H C) and edge (H E), and tensile characteristics such as yield strength (σ y), ultimate tensile strength (σ u), and ductility (D u). An experiment is conducted on pure commercial Cu under various ECAP conditions, such as the number of passes (N), ECAP die angle (φ), processing temperature, and the type of processing route. The research design is based on RSM, and is used to identify the optimum ECAP parameter levels by analyzing the impact of ECAP conditions on responses. A second-order regression model and ANOVA were created to analyze the ECAP condition of optimum responses. A GA was applied to optimize the ECAP condition. Finally, hybrid RSM–GA was created to improve the optimization of ECAP responses and the corresponding conditions were evaluated using GA.
2 Methodology
2.1 FEM
The ECAP process was simulated using FEM to predict the stress and strain distribution along the longitudinal and transverse sections (LS and TS) of the ECAPed billets using Simufact forming software (version 13.3.1, MSC software corporation, Newport Beach, California, United States). The ECAP processing was simulated at both room temperature (RT) and at 200°C through route Bc at a ram speed of 0.05 mm·s−1 using the cold forming extrusion module. The FEM model consists of two-halves ECAP die, plunger, and Cu billets. The ECAP die and plunger were invisible during simulation for better visualization. The ECAP die parts were modeled as rigid discrete elements made from non-deformable material whereas the Cu billets were modeled as deformable elements. The dimension of the simulated ECAP die and Cu billets (sample diameter is 20 mm with 60 mm length) and the experimental counterparts were identical. The material of the Cu billets was selected from the Simufact forming built-in library in which the mechanical and thermal properties were pre-described. A hexahedral mesh with a mesh size of 0.5 mm was used with the total number of nodes ranging from 9,500 to 15,000 elements depending on the specimen’s degree of deformation of the Cu billets. Based on the degree of deformation of the material, a modification in the dimension and geometry of the deformed billets was taken into consideration as an additional precaution. The Cu billets were modeled as a strain hardenable rigid plastic material as well as an isotropic linear elastic material. During processing, the mesh system was immediately modified as the components became too skewed. Re-meshing criteria were used based on a strain change of 0.1 mm·mm−1. A software built-in tabulated flow curve model was used, as Cu strain hardening exponent and yield constant are both dependent on temperature and strain rate. The Coulomb’s friction model was used with a die friction factor of 0.07 which agreed with the previous studies [45,46]. The tracked elements were chosen in the sample center which exposed to the least deformation and near the peripheries which exposed to the maximum deformation [17].
The behavior of the Cu billets during ECAP processing, the Cu model adopted in Simufact forming software is shown in equation (2).
where σ F is the flow stress, C is the yield constant, ϕ is the strain, and N is the strain hardening exponent. In the FE model, both the yield constant and strain hardening exponent are dependent on the processing temperature.
2.2 Experimental procedure
Billets of a commercial pure Cu with a chemical composition of (0.5% Zn, 0.46% Si, traces of elements Sn, Mn, Al, Fe, and the balance is Cu, wt%) were received as rolled rods 20 mm in diameter and 50 cm length. Figure 1 shows the scanning electron microscope (SEM) micrograph coupled with the energy-dispersive spectroscopy (EDS) analyses of the Cu billets. The as-received (AR) rods were machined to form the ECAP billets with 20 mm diameter and 60 mm length. The Cu billets were annealed at 400°C for 2 h followed by furnace cooling. The as-annealed (AA) Cu billets were processed through ECAP up to 6-passes of different routes (A, Bc, and C) using 2 ECAP dies with internal channel angles of 90° and 120° and an outer corner angle of ψ = 20° (Figure 2) which generated an equivalent strain of 1.054 and 0.634 per pass, respectively, according to equation (1). ECAP processing was carried out at three different temperatures of RT, 100°C, and 200°C at a ram speed of 0.05 mm·s−1. A graphite-based lubricant was used to reduce the friction during processing.
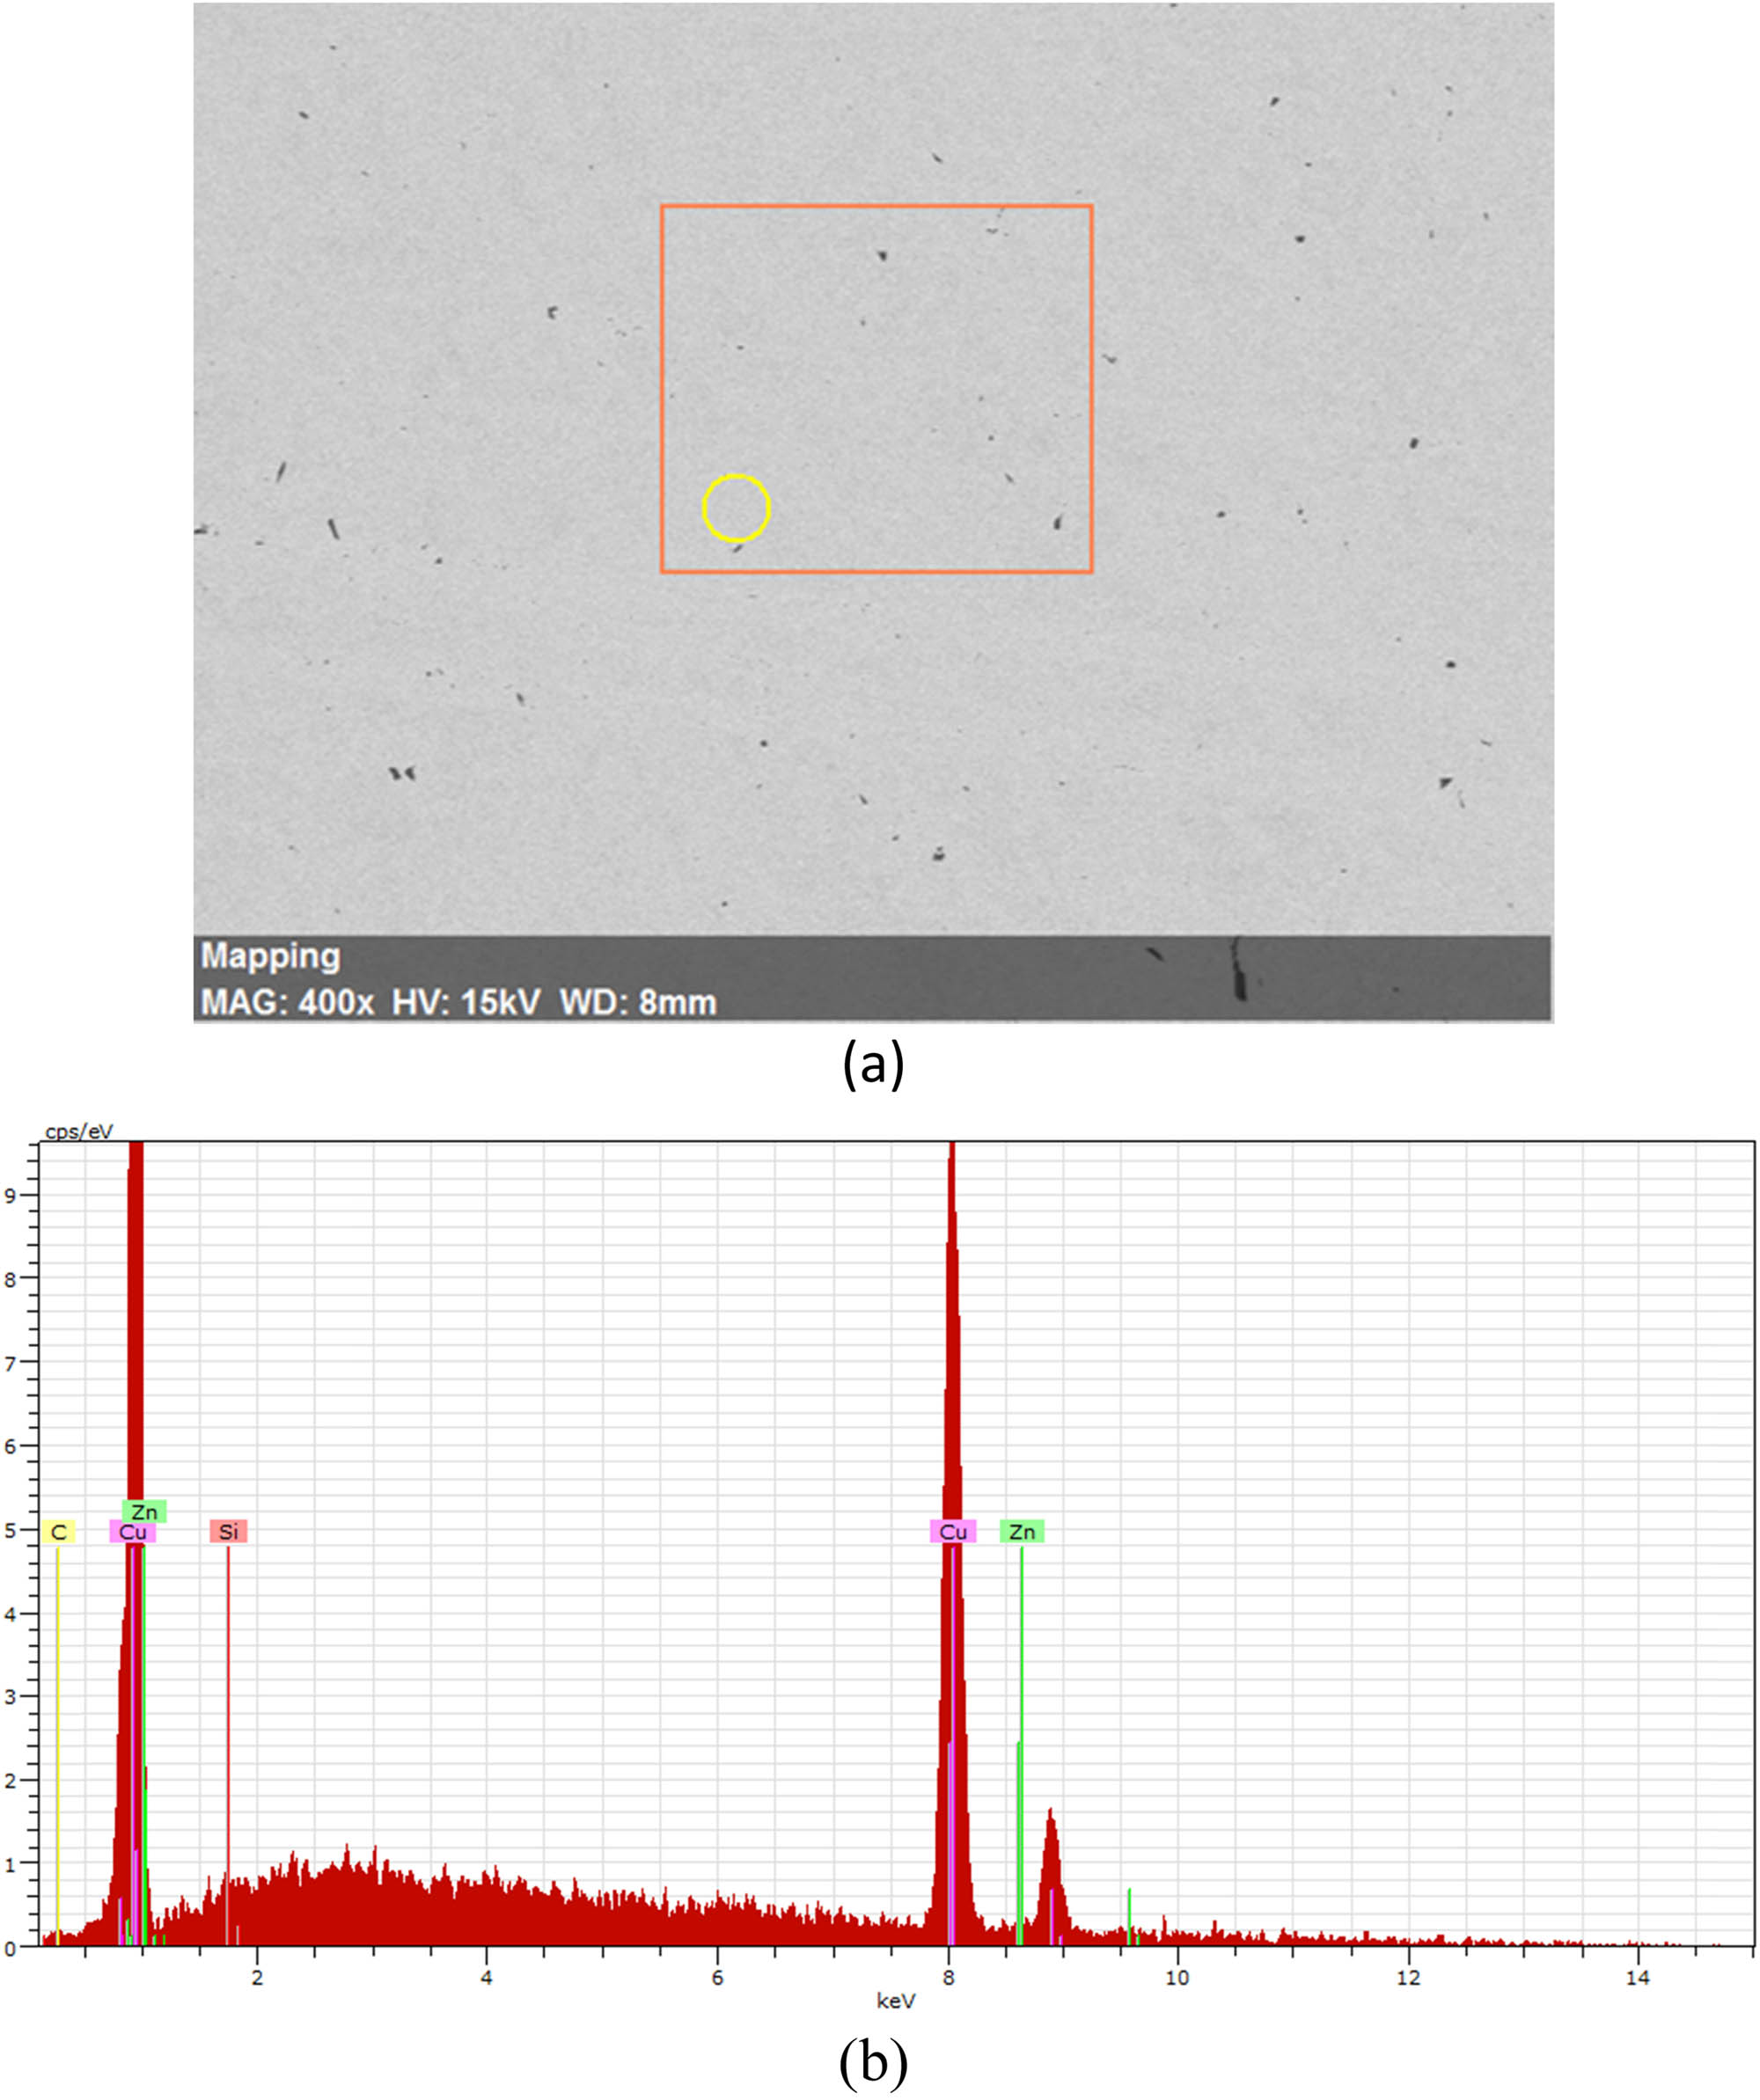
(a) SEM micrographs and (b) EDS analysis of the AR Cu billets (the orange frame shows the elemental mapping area and the yellow circle shows the area of the EDS analysis).

Schematic of the ECAP dies with internal channel angle of (a) 90° and (b) 120°.
Microstructural evolution of the Cu billets was characterized by optical microscope (OM) and field emission SEM. Cu billets were mounted, ground using 600, 800, 1,000, and 1,200 grit silicon carbide sandpaper, polished to a mirror-like finish using alumina solution, and finally etched using a mixture of HCl and HNO3 solutions with a volume ratio of 3:1 as a final preparation step. The chemical composition analysis of the Cu billets was conducted using EDS.
The tensile test was carried out for the Cu billets before and after ECAP processing on a 100 kN universal testing machine (Instron 4210, Norwood, MA, USA) at RT at a strain rate of 10−3 s−1. The tensile samples were prepared according to the specifications set by the American Society for Testing of Materials (E8M/ASTM). Two tensile samples were machined from the center of the Cu billets and tested per processing condition. In addition, the AA and ECAPed Cu billets were sectioned along their central longitudinal axis perpendicular to the extrusion direction, and then ground and polished to a mirror-like surface. Vicker’s microhardness tests (HV) were carried out under an applied load of 1 kg for 15 s in both the central and peripheral regions of the samples. Five equispaced indentations were measured and the displayed results were the average of the recorded values.
The impact test was carried out for the Cu samples before and after ECAP process using Charpy V-notch testing machine (Time JB-W 500). The Cu samples are in the form of a square bar with cross section of 10 mm × 10 mm and a length of 55 mm. The V-notch was machined with angle, radius, and depth of 45ᵒ, 0.025 mm, and 2 mm, respectively. Furthermore, the electrical conductivity of the Cu billets was measured at RT on AG 4311B RLC-meter (Ando, Japan) at zero frequency. A thin circular disk of 20 mm diameter and 1 mm thickness was prepared for the Cu billets. Four Cu wires were stretched across the opening of a Teflon (or other non-conductive plastic block), glued in place, parallel and with precisely-known separation (gage length) between the two inner wires. The Cu billet surfaces were polished before testing to clean the surface. The electrical conductivity was expressed as a relative percentage of the international annealed copper standard (%IACS).
2.3 Design of experiment and regression model
The ECAP conditions of commercial pure Cu are the number of passes, die internal channel angle, ECAP processing temperature, and processing route. Three different levels were employed in this investigation as shown in Table 1.
ECAP parameters and corresponding levels
| ECAP conditions | Symbol | Unit | Condition levels | ||
|---|---|---|---|---|---|
| −1 | 0 | 1 | |||
| Number of passes | N | Pass | 2 | 4 | 6 |
| ECAP die angle | φ | ° | 90 | 120 | — |
| Processing temperature | T | K | 298 | 373 | 473 |
| Processing route type | — | — | A | Bc | C |
In this study, RSM was used to design the combination of ECAP’s conditions levels. 21 runs were performed and several ECAP responses were examined, namely, impact toughness (I T), electrical conductivity (E C), hardness at two different positions, center (H C) and edge (H E), and tensile characteristics such as yield strength (σ y), ultimate tensile strength (σ u), and ductility (D u) as shown in Table 2.
Design of experiment of ECAP parameters
| Run | ECAP condition | |||
|---|---|---|---|---|
| N | Φ | T | Processing route type | |
| 1 | 2 | 120 | 473 | A |
| 2 | 2 | 90 | 473 | C |
| 3 | 2 | 120 | 298 | C |
| 4 | 6 | 120 | 473 | A |
| 5 | 2 | 90 | 373 | A |
| 6 | 6 | 120 | 473 | C |
| 7 | 6 | 120 | 473 | C |
| 8 | 6 | 120 | 298 | C |
| 9 | 6 | 120 | 298 | A |
| 10 | 2 | 90 | 373 | A |
| 11 | 4 | 90 | 298 | C |
| 12 | 4 | 120 | 373 | C |
| 13 | 6 | 90 | 473 | Bc |
| 14 | 2 | 90 | 473 | C |
| 15 | 2 | 90 | 298 | Bc |
| 16 | 4 | 120 | 373 | A |
| 17 | 6 | 90 | 298 | A |
| 18 | 4 | 90 | 298 | C |
| 19 | 2 | 120 | 298 | A |
| 20 | 2 | 120 | 373 | Bc |
| 21 | 6 | 90 | 473 | Bc |
Four conditions can be investigated with a minimal number of experiments using this technique in order to model a second-order response surface. A powerful tool used to formulate, analyze, improve, and optimize is called RSM. The interaction between one or more measured responses such as impact toughness, electrical conductivity, and tensile characteristics and the critical input conditions can also be evaluated using regression modeling polynomial models, such as linear, two-way interaction, and full quadratic models were used to evaluate the experimental data [42,47,48]. Stat-Ease Design Expert software (version 13.0.5) was used to analyze the experimental data, which is a useful tool for optimizing complex systems for scientific and industrial applications [49,50].
The input conditions of the ECAP process are divided into numeric conditions such as the number of passes, die angle, and processing temperature and categorical conditions such as processing route. To transform the categorical to a numerical condition, dummy coding was utilized sometimes called binary coding. Dummy coding conveys all of the essential information about the categorical conditions using only ones and zeros [51]. For categorical variables: route A, route Bc, and route C; the dummy variables were codded by x 1 and x 2.
3 Results and discussion
3.1 Finite element analysis
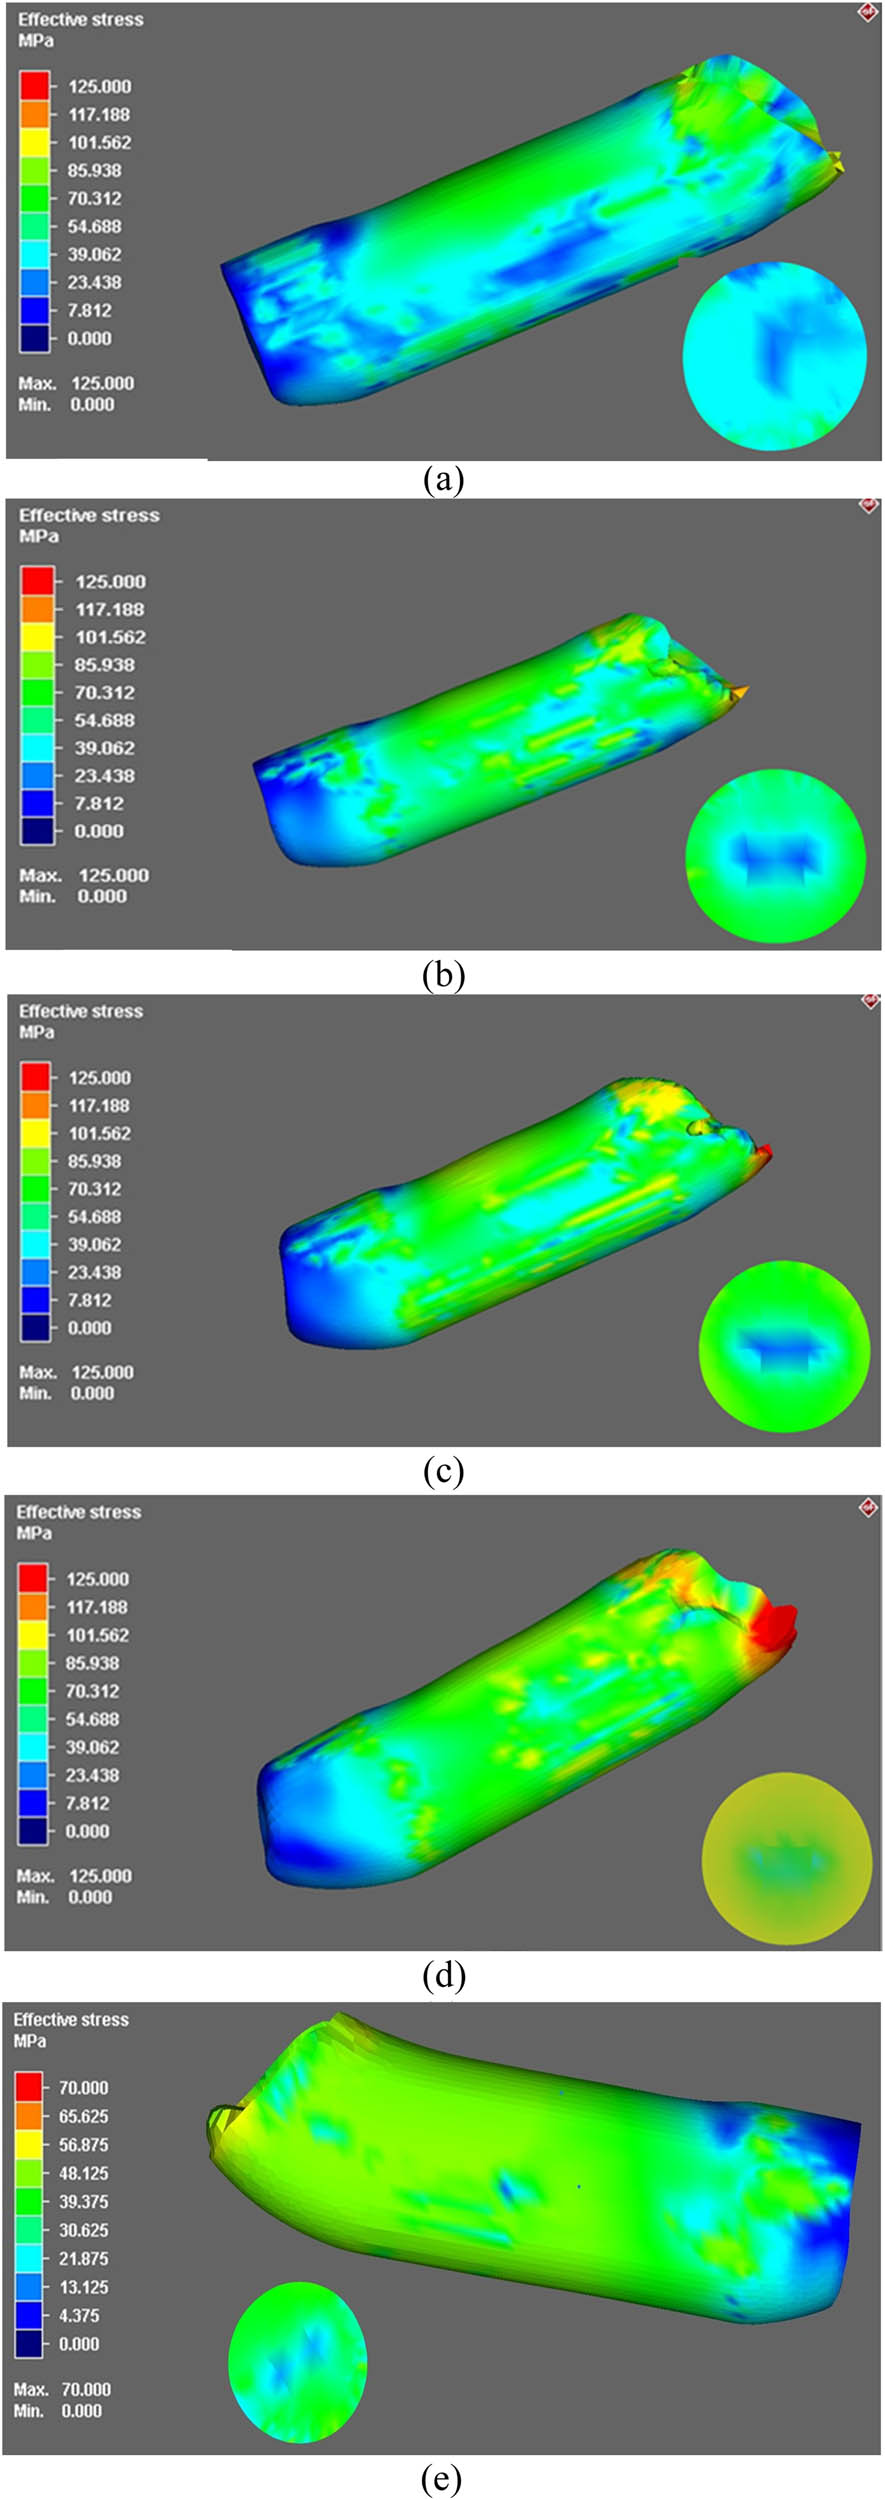
The distribution of the stress along both LS and TS for Cu billets processed through the 90°-die is shown in Figure 3 in three-dimension (3D) plots. Similar plots for the Cu billets processed through the 120°-die are shown in Figure 4. In addition, the strain distribution for the Cu billets processed through the 90°-die and the 120°-die are shown in Figures 5 and 6, respectively. The TS is chosen in the middle of the processed billets. Furthermore, the required force needed to deform the Cu billets are shown in Figure 7 as a function of the stroke. From Figures 3 and 4, it can have revealed that the peripheral areas of the processed billets exhibited higher stresses than the central areas due to the contact with the internal walls of the ECAP dies. In addition, the top sections of the billets exhibited higher stresses due to the contact with the plunger. Furthermore, the upper parts of the billets exhibited higher stresses compared to the lower parts due to the contact between the upper parts of the billets with the die internal corner angle which agreed with the earlier findings [45].
Stress distribution along both the LS and TS of the Cu billets processed through ECAP using the 90°-die through 1-P (a), 2-Bc (b), 3-Bc (c), 4-Bc (d) at RT, and 1-P (e) at 200°C.

Stress distribution along both the LS and TS of the Cu billets processed through ECAP using the 120°-die through 1-P (a), 2-Bc (b), 3-Bc (c), and 4-Bc (d).

Strain distribution along both the LS and TS of the Cu billets processed through ECAP using the 90°-die through 1-P (a), 2-Bc (b), 3-Bc (c), 4-Bc (d) at RT, and 1-P (e) at 200°C.

Strain distribution along both the LS and TS of the Cu billets processed through ECAP using the 120°-die through 1-P (a), 2-Bc (b), 3-Bc (c), and 4-Bc (d).

Force vs displacement of the Cu billets processed through (a) 90°-die and (b) 120°-die.
For the 90°-die, processing at RT through 1-pass (1-P) exhibited maximum stress of 70.3 MPa at the upper peripheral parts of the LS whereas both the central areas and the lower parts displayed a stress of 23.4 MPa (Figure 3a). On the other hand, the TS exhibited more uniform distribution of the stress with a value of 39 MPa whereas its central region displayed a stress of 23 MPa. Increasing the number of passes up to 2-passes of route Bc (2-Bc) at RT experienced more uniform distribution of the stress with a maximum value of 85.9 MPa which was recorded at the peripheral areas of the LS whereas the central regions revealed a stress of 39 MPa and the lower parts revealed a minimum recorded stress of 23 MPa as shown in Figure 3b. On the other hand, the TS exhibited a stress of 70.3 MPa at the peripheral region whereas the central regions displayed a stress of 39 MPa. Processing through 3-Bc at RT resulted in increasing the maximum stress up to 101.5 MPa at the top peripheral regions of the LS whereas the TS displayed maximum stress of 70.3 MPa at the peripheral areas (Figure 3c). Accumulating the strain up to 4-Bc at RT exhibited almost uniform distribution of the stress along the LS (85.9 MPa) with a maximum stress of 117 MPa at the top peripheral regions whereas the TS displayed maximum stress of 101.5 MPa at the peripheral areas coupled with a minimum stress of 70.3 MPa as shown in Figure 3d. Furthermore, to investigate the effect of the processing temperature on the stress distribution during ECAP processing, the stress distribution during ECAP processing through 1-pass at 200°C is shown in Figure 3e. From Figure 3e, it was clear that ECAP processing at 200°C revealed higher homogeneity of the stress distribution across both the LS and TS of 48.125 MPa which indicated that lower stress was attained compared to ECAP processing at RT. In addition, the bottom part of the ECAPed billet revealed lower stress which ranged between 4.375 and 21.875 MPa as shown in Figure 3e.
A similar trend was depicted for the Cu billets which were processed using the 120°-die. 1-P processing displayed maximum stress of 70.3 MPa at the top peripheral regions of the LS whereas the TS displayed a dominated stress of 23.4 MPa as shown in Figure 4a. Increasing the number of passes up to 2-Bc displayed a maximum stress of 85.9 MPa at the LS whereas the TS revealed a maximum stress of 39 MPa (Figure 4b). More uniform distribution of the stress was depicted at the 3-Bc with a maximum of 101.5 MPa which were displayed in minor areas of the top peripheral areas whereas the TS exhibited maximum stress of 54.6 MPa as shown in Figure 4c. 4-Bc condition resulted in spreading the areas with a maximum stress of 101.5 MPa along the LS compared to 3-Bc counterpart whereas the TS displayed maximum stress of 70.3 MPa in the peripheral areas (Figure 4d). It is worth mentioning here that 4-Bc using the 90°-die revealed a more homogenous distribution of the stress along both the LS and TS.
On the contrary, the strain distribution plots revealed a more homogenous distribution along both the LS and TS. ECAP processing at RT through 1-P using the 90°-die exhibited a uniform strain distribution with an average value of 0.375 along both the LS and TS whereas the upper peripheral regions of the LS exhibited a strain of 1.125 as shown in Figure 5a which agreed to the strain value calculated from equation (1). Increasing the strain up to 2-Bc at RT resulted in increasing the strain up to 1.875 at the central regions of the LS whereas the upper peripheral areas recorded 2.625 as shown in Figure 5b. In addition, the central areas of the TS displayed a strain of 1.125 whereas the peripheral areas displayed higher strain of 1.875 (Figure 5b). Similar trend was revealed for the 3-Bc condition at RT, the strain increased to 1.875 and 3.375 at the central and peripheral areas of the LS, respectively whereas the central regions of the TS recorded a strain of 1.875 which dominated the strain distribution with a few peripheral areas which recorded a strain of 2.625 as shown in Figure 5c. Accumulation of the plastic strain up to 4-Bc at RT revealed almost homogenous distribution of the strain along the LS (3.375) whereas the top parts of the billet revealed a combination between a strain of 4.875, 5.625, and 6 as seen in Figure 5d. The TS exhibited a cored distribution with a strain of 2.625 recorded at the center and a strain of 4.125 recorded at the peripheries. On the other hand, ECAP processing at 200°C revealed areas with low strain at the central regions of the LS, while the upper areas displayed higher strain of 1.125 as shown in Figure 5e. The bottom part of the ECAP billets was dominated by lower strain value which ranged from 0.125 up to 0.375. Similar findings were depicted in the TS where the strain was ranged between 0.625 at the central regions and 1.125 which were recorded at the upper and lower peripheral regions.
Lower strain values were depicted for the Cu billets processed using the 120°-die. Processing through 1-P recorded almost dominated strain of 0.75 along both the LS and TS whereas the upper parts of the LS and the peripheral regions of the TS revealed higher strain as shown in Figure 6a. Increasing the plastic strain up to 2-Bc displayed a strain of 1.125 and 1.75 at the central and peripheral areas of the LS whereas the TS displayed a dominated strain of 1.125 with a few peripheral areas which recorded a strain of 1.75 as shown in Figure 6b. Homogenous distribution of the strain (2.25) was depicted along the LS of the 3-Bc condition whereas the TS revealed a cored distribution with strain value of 1.125 and 2.25 displayed at the central and peripheral areas as shown in Figure 6c. Different strain distributions were displayed for the 4-Bc billets as the top part revealed a strain of 4 followed by an intermediate area which displayed a strain of 3.25 whereas the subsequent area recorded a strain of 2.25 as shown in Figure 6d. In addition, a cored distribution was recorded along the TS with a higher peripheral value of 3.25 and lower central value of 1.75.
The deformation force required to extrude the Cu billets is shown in Figure 7 as a function of the processing time. For the 90°-die, 1-P displayed a maximum force of 13.8 kN as shown in Figure 7a. Increasing the number of passes up to 2-Bc resulted in increasing the required deformation force up to 16.7 kN. An additional increase in the deformation force was depicted for the Cu billets processed through 3-Bc. Furthermore, 4-Bc resulted in increasing the deformation force up to 18 kN as shown in Figure 7a. Similar trend was revealed for the Cu billets processed using the 120°-die. 1-P processing depicted a maximum defamation force of 13.3 kN as shown in Figure 7b. Additional increase in the required deformation force was depicted for the Cu billets processed through 2-Bc and 3-Bc. Furthermore, increasing the number of passes up to 4-Bc exhibited an increasing deformation force of 16.4 kN. Accordingly, the aforementioned findings revealed the effect of ECAP die angle on deformation force as the 90°-die required a higher deformation force compared to the 120°-die. In addition, increasing the number of passes resulted in increasing the deformation force which can be attributed to strain hardening resulting from ECAP processing through multiple passes.
3.2 Microstructural evolution
The Cu samples processed through seven different parameter sets as well as the AA sample were studied using the OM to characterize the microstructural evolution, their micrographs are shown in Figure 8. The AA sample, Figure 8a, was observed to mostly consist of irregular coarse grains; however, the sample’s grain sizes ranged from very fine to considerably coarse. Upon inspection of the samples processed through 2-Bc at φ = 90° and at RT, as seen in Figure 8b, it was observed that processing resulted in a seemingly UFG structure orientated parallel to the extrusion direction (ED). Processing via 4-Bc at RT led to outstanding grain refinement, as seen in Figure 8c. The latter sample showed a completely recrystallized microstructure dominated by UFG equiaxed grains.

OM micrographs of the AA (a), Cu billets and ECAPed billets processed through 2-Bc _90°-die (b), 6-Bc_90°-die (c), 6-A_90°-die (d), 6-C_90°-die (e), 6-Bc_90°-die (f), 2-Bc_120°-die (g), and 6-Bc_120°-die (h) at RT (b, c, d, e, g, and h) and at 200°C (f).
To investigate the effect of the ECAP route type on the microstructure, Cu billets were processed through 6 passes of route A and route C (6-A and 6-C, respectively) using the 90°-die at RT. Similar to 6-Bc condition, processing through 6-A revealed a relatively UFG structure as shown in Figure 8d. On the other hand, it was revealed that route A resulted in more elongated grains compared to the equiaxed grains resulting from route Bc which agreed with the previous study [52]. Processing through 6-C exhibited coarser equiaxed grains compared to route Bc (Figure 8e). It is worth mentioning here that after even passes of route C processing, the plastic strain of the foregoing odd passes is reversed and hence, resulting in the remaining equiaxed grains, which agreed with an earlier study [53]. Furthermore, Cu billet was processed through 6-Bc using the 90°-die at 200°C to investigate the effect of the processing temperature on the microstructure of the ECAP-processed Cu (Figure 8f). From Figure 8f it was clear that, increasing the processing temperature up to 200°C exhibited a significant effect on the grain size as coarser equiaxed grains dominated the microstructure compared to the RT processed counterparts as shown in Figure 8f.
To study the influence of ECAP die angle on the Cu microstructure, the OM micrographs of two sets of billets were investigated. Both the sets were processed via 2-Bc and 6-Bc at RT, one set was processed using φ = 90° (Figure 8b and c) and the other via φ = 120° (Figure 8g and h). The 90° and 120° 2-Bc processed billets showed equivalent microstructures, mostly characterized by having UFG and being parallel to the ED, seen in Figures 8b and g. Figure 8g shows that the grains produced from the 120° die have lower shear orientation angles than their 90° 2-Bc counterpart, due to the lower plastic strain associated with that die angle, as evidenced by equation (1). The previous results comply with the FEM findings, verifying them. Finally, 6-Bc processing produced UFG structures using both die angles, albeit processing via the 90° die resulted in finer grains.
3.3 ANOVA for mechanical and electrical behavior
Table A1 (Appendix) displayed the experimental findings of four factors (number of passes, die channel angle, processing temperature, and ECAP route type) with the responses. Many trails of regression transformation form and interaction between independent variables were examined in order to model the output responses of ECAP. The best regression coefficient (R 2) indicates that the models generated in the experimental research are statistically significant. Equations (3)–(9) represent the ECAP responses of commercial pure Cu, namely, hardness at two different positions, center (H C) and edge (H E), tensile characteristics such as yield strength (σ y), ultimate tensile strength (σ u), ductility (D u), impact toughness (I T), and electrical conductivity (E C).
For all equations, if x 1 = 1 and x 2 = 0, then the route type is (A), if x 1 = 0 and x 2 = 1, then the route type is (Bc), and if x 1 = 0 and x 2 = 0, then the route type is (C).
ANOVA is used to examine independent conditions, N, φ, T, x 1, and x 2, in order to determine which ones have a significant impact on the performance response, H C, H E, σ y, σ u, D u, I T, and E C [54]. Table 3 presents the statistical tests, namely, F-value, P-value, lack of fit, adequate precision, regression coefficient (R 2), adjusted R 2, and predicted R 2 of the seven models.
Statistical tests of ECAP responses of commercial pure Cu
| Response | F-value (F > 4) | P-value (P < 0.05) | Lack of fit (P > 0.05) | Adeq. precision (ratio >4) | R² | Adj R² | Pred R² |
|---|---|---|---|---|---|---|---|
| H C | 142.24 | <0.0001 | 0.3990 | 40.1907 | 0.9943 | 0.9873 | 0.9227 |
| H E | 129.89 | <0.0001 | 0.7027 | 40.6710 | 0.9937 | 0.9861 | 0.9525 |
| σ y | 96.73 | <0.0001 | 0.0776 | 34.2257 | 0.9875 | 0.9773 | 0.9429 |
| σ u | 82.72 | <0.0001 | 0.1449 | 27.1270 | 0.9822 | 0.9703 | 0.9361 |
| D u | 92.25 | <0.0001 | 0.2488 | 32.6722 | 0.9893 | 0.9786 | 0.9721 |
| I T | 123.80 | <0.0001 | 0.6385 | 42.7757 | 0.9957 | 0.9876 | 0.9722 |
| E C | 21.01 | <0.0001 | 0.8413 | 15.5261 | 0.9334 | 0.8889 | 0.9021 |
The F-value is the difference between the variation attributed to individual factors and the variance due to the error term. F-value of ECAP responses greater than 4 indicates that changing an input ECAP parameter has a significant impact on the responses quality criterion [55]. Die angle has the greatest impact on I T and D u, otherwise, the number of passes followed by processing temperature has significant effect on E C, H C, H E, σ y, and σ u.
The significant effects with p-values less than 0.05 indicate that the independent parameters, as well as the individual model coefficients and interaction terms, are statistically different from zero at the 95% confidence level [56].
The ECAP responses’ lack of fit is greater than 0.05, implying that the model is good [55]. Adequate precision determine the model’s validity by computing the signal-to-noise (S/N) ratio. It is recommended that the ratio exceeds four which indicates that there is sufficient signal and the model can be applicable to navigate the design space [57]. The regression coefficient R 2 is high and indicates that the ECAP responses’ model created by the experimental is desirable. The adjusted R 2 for the seven responses is close to the predicted coefficient R 2.
Over the duration of 21 iterations, Figures 9–11 present the relationships between the actual and predicted responses H C, H E, σ y, σ u, D u, I T, and E C. Each observed response of pure Cu samples is compared with the predicted responses calculated from the regression model and their respective correlation graphs. It demonstrates that the majority of the predicted results are extremely close to the actual experimental results, with a slight deviation between the expected and real values. Also, it indicates that the ECAP responses’ regression models are excellent and helpful to predict the optimization of ECAP conditions for best responses.

Predicted and actual value of H C and H E for Cu.

Predicted and actual values of σ y, σ u, and D u for Cu.
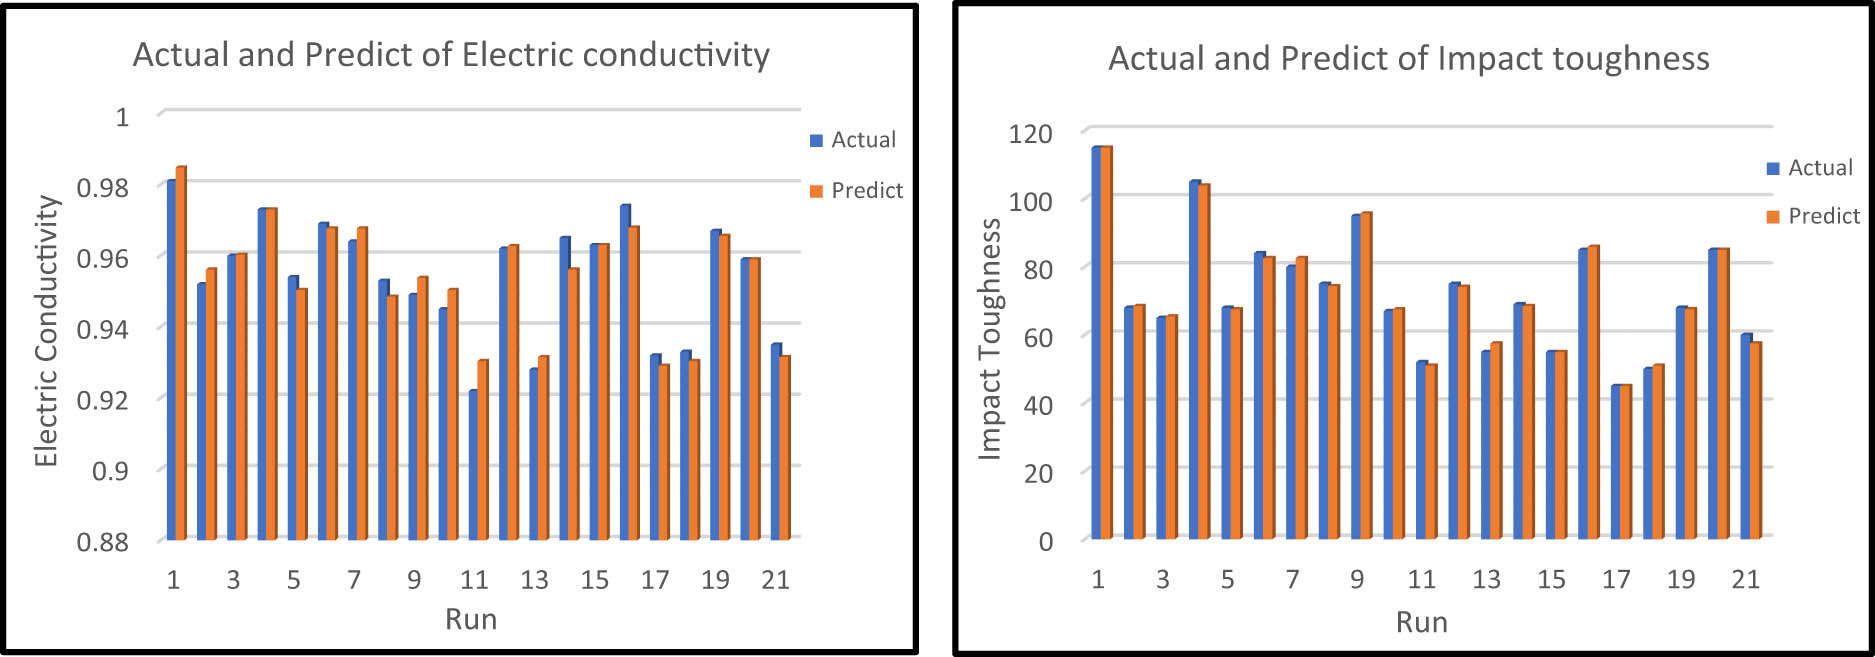
Predicted and actual values of I T and E C for Cu.
The predicted and actual values of H C and H E are presented in Figure 9. The minimum error % between the actual and predicted H C was found in run (10) with a percentage of 0.02%. However, the maximum error % between the actual and predicted H C was found in run (7) with a percentage of 0.97%. Similarly, the minimum error % between the actual and predicted H E was found in run (1) with a percentage of 0.007%. However, the maximum error % between the actual and predicted H E was found in run (6) with a percentage of 0.79%.
The predicted and actual values of σ y, σ u, and D u are presented in Figure 10. The minimum error % between the actual and predicted σ y was found in run (12) with a percentage of 0.37%. However, the maximum error % between the actual and predicted σ y was found in run (1) with a percentage of 9.4%. Similarly, the minimum error % between the actual and predicted σ u was found in run (11) with a percentage of 0.04%. However, the maximum error % between the actual and predicted σ u was found in run (19) with a percentage of 2.06%. Finally, the minimum error % between the actual and predicted D u was found in runs (15 and 20) with a percentage of 0%. However, the maximum error % between the actual and predicted D u was found in run (10) with a percentage of 2.1%.
In addition, Figure 11 shows the predicted and actual values of I T and E C. The difference error % did not exceed 3.18 and 0.92% for I T and E C, respectively. The minimum error between the actual and predicted I T and E C are close to 0%.
3.4 Effect of ECAP processing parameters on Cu properties
3.4.1 Hardness distribution
A three-dimensional interaction effect of ECAP parameters, N and φ, on H C and H E at different processing temperatures is shown in Figures 12 and 13. For all processing routes in hardness response, at different processing temperatures, the increase in N results in increase in the hardness response and there is an inverse relationship between the φ and hardness response. The AA billets exhibited an almost constant Vicker’s hardness value of 100 along the billet’s TS from the central area to the peripheral regions. The 90°-die exhibited higher hardness values at both the central and close to the peripheries of the processed billets which can be attributed to the effect of imposed plastic strain. As mentioned before, the 90°-die and 120°-die imposed the Cu billets to a shear strain of 1.054 and 0.634 per pass, respectively, according to equation (1), so that the Cu billets processed using the 90°-die exhibited higher hardness values.

Response surface plot of H C as a function of die angle, number of passes, route type, and processing temperature.

Response surface plot of H E as a function of die angle, number of passes, route type, and processing temperature.
The maximum optimum H C at routes A, Bc, and C are 148.8 HV, 170 HV, and 145 HV which are obtained at 6-passes, 90°-die, and 298 K as shown in Figure 12. In this context, the experimental results of Cu at different processing temperatures show that the maximum optimum H C (149 HV) obtained at 6-passes, 90°, 298 K, and route type is A which is in agreement with the results obtained by the regression model. Similarly, Figure 13 shows the maximum optimum H E at routes A, Bc, and C with values of 157.5 HV, 172 HV, and 152.5 HV which are obtained at 6 passes, 90°-die, and 298 K. In this context, the experimental results of Cu at different processing temperatures show that the maximum optimum H E (158 HV) obtained at 6-passes, 90°, 473 K, and route type A is in agreement with the results obtained by the regression model.
From the aforementioned findings, it was clear that the peripheral regions exhibited higher hardness values compared to the central counterparts that can be attributed to the friction between the Cu billets with the internal walls of the ECAP dies which agreed with the previous study [6] and FEM findings. Furthermore, processing through multiple passes resulted in increasing the homogeneity of the hardness distribution as both the central and peripheral regions recorded too close values of hardness. In addition, accumulation of the plastic strain through processing via multiple passes resulted in increasing the hardness values in both the central and peripheral regions which agreed with the report by Djavanroodi et al. [58]. A high density of low angle grain boundaries (LAGBs) was transformed by the ECAP process into high angle grain boundaries subsequently producing an UFG structure, as seen in Figure 8. This process occurred on merit of the formation, multiplication, and motion of dislocations during ECAP processing [6,14,16,17], leading to dislocation motion impedance and subsequently a strengthened Cu billet [14,16]. Thus, a conclusion can be reached that grain refinement is an effective strengthening mechanism that produces improved Cu hardness [6,17].
Another effective parameter that affected the properties of the processed billets is the route type. It was confirmed that route type Bc is the most effective route in grain refining which generated an almost equiaxed UFG structure (Figure 8c). Accordingly, the most effective route in increasing the ECAPed billets hardness is route Bc due to its more refined grains compared to the other route types. On the other hand, route A resulted in more elongated fine grains (Figure 8d) whereas route C resulted in almost equiaxed coarser grains compared to the other route types (Figure 8e), and hence sample processed through route A exhibited lower hardness values in both the central and peripheral regions compared to route Bc counterparts but it recorded higher hardness values in both the central and peripheral regions when compared with route C counterparts.
Additionally, despite the RT processing revealing higher hardness values in both the central and close to the peripheries compared to the sample processed at 100 and 200°C, ECAP processing at higher temperatures revealed a more homogenous distribution of the hardness which agreed with the previous study [6]. It is worth mentioning here that, ECAP processing at high temperature resulted in strain softening which leads to grain coarsening (as shown in Figure 8f) compared to the samples processed at RT (Figure 8c).
Similar findings were reported in previous studies. Xu et al. [11] reported an increase in the hardness of pure Cu by 45.3% after processing through 8-Bc at RT. Dalan et al. [59] reported that RT processing was more effective in increasing the hardness due to the grain refinement compared to ECAP processing at 300°C. Whereas Jayakumar et al. [12] reported that the hardness of Cu–Cr–Zr alloy was saturated after 4-Bc using a 105°-die at RT and increasing the number of passes over 4-passes revealed an insignificant change. Wei et al. [60] presented that ECAP processing through 4-Bc resulted in increasing Vicker’s hardness of Cu billets from 63 up to 145. Ngam et al. [61] processed Cu–0.1 wt% Zr through ECAP via 8-Bc at RT which resulted in increasing the Vicker’s microhardness from 95 to 143 HV and they attributed this behavior to the effect of reefing the grain size on strengthening the alloy according to Hall–Petch [15]. Tong et al. [62] reported that the Vicker’s microhardness of Cu–0.36Cr–0.49Zr alloy increased significantly after the first ECAP processing after which it became almost constant till processing through 8-passes. Huang et al. [9] reported similar behavior as reported by Tong et al. [62] for Cu–0.25Se–0.25Te Alloy.
3.4.2 Tensile properties
The interaction effect of ECAP processing parameters on the tensile properties is shown in Figure 14 (σ y), Figure 15 (σ u), and Figure 16 (D u) in three-dimensional plots, while generating interaction graphs and response surface plots at different processing temperatures between two variables, namely, N and φ, at a constant processing route.

Response surface plot of σ y as a function of die angle, number of passes, route type, and processing temperature.

Response surface plot of σ u as a function of die angle, number of passes, route type, and processing temperature.

Response surface plot of D u as a function of die angle, number of passes, route type, and processing temperature.
The AA Cu billets displayed σ y, σ u, and D u of 82 MPa, 225 MPa, and 36%, respectively. According to the regression model, for all processing routes at different processing temperatures, the increase in N results in an increase in σ y and there is a slight effect between φ and σ y. At route A, the maximum optimum σ y is 223.4 MPa obtained at 6-passes, 120°, and 298 K. At route Bc, the maximum optimum σ y is 232.2 MPa obtained at 6-passes, 90°, and 298 K. Finally, the maximum optimum σ y of route C is 222.8 MPa obtained at 6-passes, 90°, and 298 K as shown in Figure 14. In this context, the experimental results of Cu at different processing temperatures show that the maximum optimum σ y (225 MPa) obtained at 6-passes, 120°, 298 K, and route type A is in agreement with results obtained by the regression model.
The σ u of the ECAP process has a similar trend of σ y at routes A, Bc, and C. The σ u was obtained at 6 passes, 90° ECAP die angle, and 298 K. Figure 15 shows the values of σ u are 353.4, 351.3, and 348.4 MPa for routes A, Bc, and C, respectively. In this context, the experimental results of Cu at different processing temperatures show that the maximum optimum σ u (353 MPa) obtained at 6-passes, 90°, 298 K, and route type A is in agreement with the results obtained by the regression model.
All the Cu billets exhibited a ductile fracture which start with the formation of the neck followed by a cup and cone fracture at 45° from the loading direction. For routes A, Bc, and C, the D u percentage decreased with the increase in N. Also, there is an inverse proportional relation between φ and D u. The minimum D u of route A is 14.6% obtained at 6-passes, 90°, and 298 K. For route Bc, the value of D u is 16.25% obtained at 4-passes, 90°, and 298 K. The minimum D u is 15.5% of route C obtained at 6-passes, 90°, and 298 K as shown in Figure 16. In this context, the experimental results of Cu at different processing temperatures show that the minimum optimum D u (14.8%) obtained at 6 passes, 90°, 298 K, and route type A is in agreement with the results obtained by the regression model.
From the tensile properties, it can be revealed that ECAPed billets exhibited a significant increase in σ y and σ u coupled without a significant reduction in the ductility compared to the AA counterparts. In addition, from Figure 14, it was revealed that the processing conditions 6-Bc, 90°-die, and 298 K resulted in the best σ y which indicated that route Bc is the most effective route in increasing the σ y due to the significant reduction in grain size (Figure 8c). Furthermore, the 90°-die resulted significantly in improving the σ y due to the higher imposed plastic strain according to equation (1). In addition, processing in the RT resulted in a significant reduction in the grain size and hence, better σ y was recorded. Additionally, the accumulation of the shear strain up to 6-passes resulted in increasing σ u for all routes A, Bc an C which can be attributed to the increase in dislocation density which hinders the mobility of the dislocation [63]. On the other hand, both routes A and Bc exhibited a too close value of the maximum σ u (353.4 and 351.4 MPa) using the 90°-die at RT.
The reduction in the Cu D u after ECAP processing can be attributed to the refinement in the grain size. In addition, it was revealed that the 120°-die experienced better Du compared to the sample processed through the 90°-die due to the lower imposed strain of the 120°-die according to equation (1) which agreed with the FEM findings. Furthermore, the processing temperature has a significant effect on the Cu ductility as the RT processing resulted in strain hardening, and hence, lower ductility was recorded. On the hand, increasing the ECAP processing temperature resulted in strain softening, and hence, higher ductility was recorded. In the same context, it was clear that route Bc is the most effective route in grain refining so it exhibited lower ductility compared to the other route types.
Similar behavior was reported in previous studies. Wu et al. [64] reported a significant increase in the σ u and σ y of pure Cu billets after ECAP processing through route Bc at RT coupled with a decrease in the D u up to 22% and these were attributed to the grain refinement strengthening. Wei et al. [60] reported that 4-A processing at RT resulted in increasing both the σ u and σ y of pure Cu from 62 and 121 MPa up to 365 and 389 MPa, respectively, coupled with a reduction in the D u from 50.1 to 19.8. Whereas Wang et al. [65] showed that 12-Bc at RT resulted in increasing the σ u and σ y of pure Cu from 89.6 and 222 MPa up to 403.9 and 440.8 MPa coupled with a significant reduction in the D u up to 14.5. Tian et al. [66] investigated the effect of ECAP route type on the tensile properties of Cu–8wt% Ag alloy using a 90°-die at RT. They found that 4-A revealed more effectiveness in increasing both the σ u and σ y coupled with higher elongation at fracture compared to route Bc and C. Ngam et al. [61] used ECAP processing for 8-Bc at RT to increase both the σ u and σ y as well as D u compared to the AA counterpart. While Tong et al. [62] processed Cu–0.36Cr–0.49Zr alloy through 8-Bc at 450°C which resulted in increasing the tensile strength of the alloy up to 580 MPa with recording a significant decrease in the ductility. Similar behavior was reported by Zhu et al. [67] for Cu–0.2wt% Mg and Cu–0.4wt% Mg alloys and by Ko et al. [68] for Cu–3 wt% Ag alloy and by Ni et al. [69] for Cu–1wt% TiC alloy.
3.4.3 Impact toughness
According to the regression model, Figure 17 shows the three-dimensional interaction effect of ECAP parameters, N and φ, on I T at different processing temperatures, while generating interaction graphs and response surface plots at different processing temperatures between two variables, namely, N and φ, at a constant processing route. The absorbed energy during the impact test of the AA was 60 J·cm−2. For route A, at different processing temperatures, the increase in ECAP die angle results in decrease in I T. There is a proportional relation between N and I T. The maximum optimum I T (115 J·cm−2) was obtained at 2-passes, 120°-die, and 200°C. Also, for route Bc, at different processing temperatures, an increase in both N and φ will increase the I T. In this context, the maximum optimum I T (185.29 J·cm−2) was obtained at 6-passes, 120°-die, and 200°C. Furthermore, for route C at different processing temperature, the increase in φ results in a decrease in I T. There is a proportional relation between N and I T. The maximum optimum I T (112.895 J·cm−2) was obtained at 2-passes, 120°-die, and 200°C. In this context, the experimental results of Cu at different processing temperatures show that the maximum optimum I T (115 J·cm−2) obtained at 2-passes, 120°-die, 200°C, and route type A is in agreement with the results obtained by the regression model. The great majority of the ECAPed billets exhibited higher absorbed impact energy compared to the AA except for some ECAP samples which were processed at RT (Table A1) which agreed with the previous studies [63,70]. It is worth mentioning here that ECAP processing at higher temperatures resulted in improving the absorbed impact energy. On the contrary, the Cu sample processed through 6-Bc using the 90°-die at 200°C exhibited lower impact energy compared to the AA can be attributed to the presence of brittle particles along the grain boundaries which agreed with the previous study [70]. In addition, the impact findings (Table A1) revealed that the 120°-die experienced higher impact energy compared to the 90°-die which can be attributed to the lower imposed strain. Fang et al. [70] suggested that ECAP processing resulted in changing the metals from brittle mode to ductile mode after processing through multiple passes which is related to the transition of the microstructure as the impact energy is too sensitive to microstructural changes [65]. In addition, they reported that ECAP processing can produce tougher alloys despite it resulting in decreasing the elongation of the ECAPed samples [70,71]. Jiang et al. [71] reported that the impact energy of Al–6 wt% Si is improved markedly after grain refinement. In addition, they stated that the maximum absorbed energy of the alloy was found to be close to the RT, and this temperature of peak impact energy increases with the increase in the number of ECAP processing passes. Meyer et al. [72] reported the improvement in the impact energy of magnesium alloy AZ31B after ECAP processing up to 4-passes at 260°C.
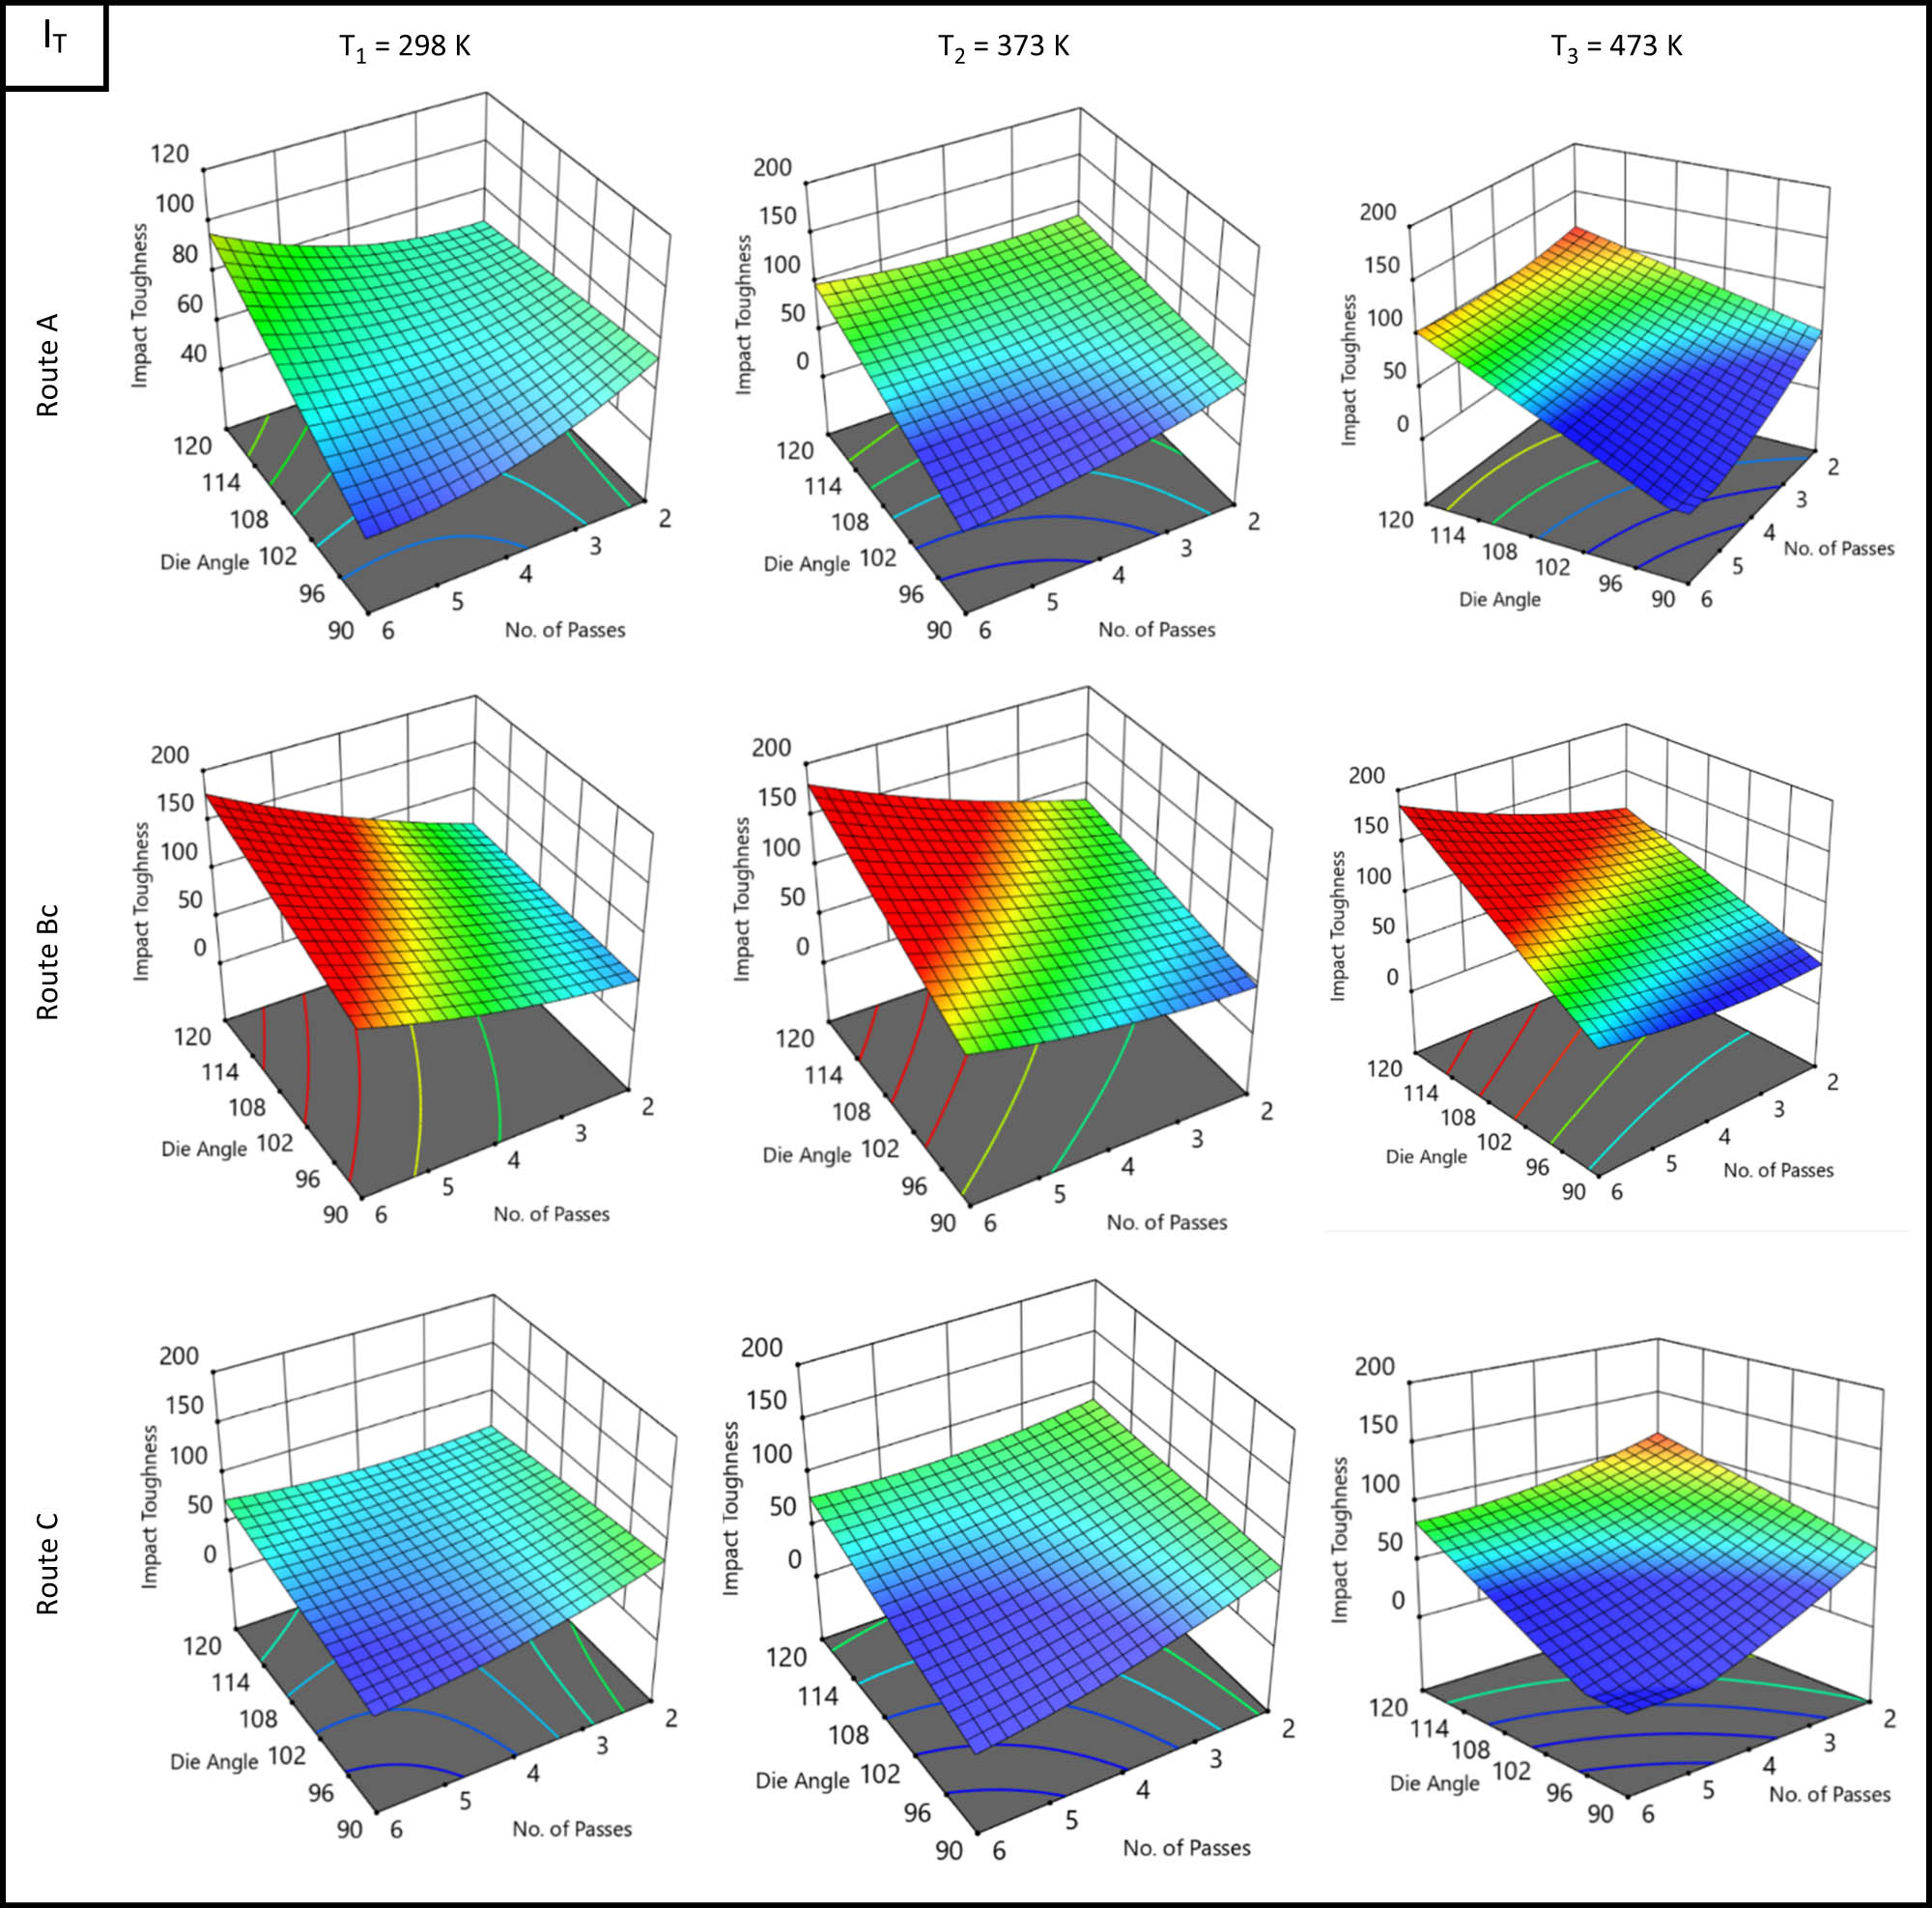
Response surface plot of I T as a function of die angle, number of passes, route type, and processing temperature.
3.4.4 Electrical conductivity
According to the regression model, Figure 18 shows the three-dimensional interaction effect of ECAP parameters, N and φ, on E C at different processing temperatures. For all processing routes, at different processing temperature, the increase in φ result in increase in the E C and there is a slight effect of N and E C. The maximum optimum E C at route A is (98.484%) obtained at 2-passes, 120°-die, and 200°C. Also, for route Bc, the maximum optimum E C (98.229%) was obtained at 2-passes, 90°-die, and 200°C. Finally, the maximum optimum E C at route C is (97.958%) obtained at 2-passes, 120°-die, and 200°C. In this context, the experimental results of Cu at different processing temperatures show that the maximum optimum E C (98.1%) obtained at 2-passes, 120°-die, 200°C, and route type A is in agreement with the results obtained by the regression model.

Response surface plot of E C as a function of die angle, number of passes, route type, and processing temperature.
Analysis of the AA billet’s electric conductivity found an E C of 99.4% IACS; however, processing caused trivial decreases in E C values, such that they ranged from 92.2% up to 98.1% IACS, as shown in Table A1. The previous findings [73] provide conclusive evidence that ECAP processing can be used to strengthen Cu billets without influencing its E C. This is evidenced by the fact that processing for up to 6-Bc resulted in a maximum reduction of 6.6% in the E C relative to the AA samples, as well as the fact that the E C decreased as the number of passes increased. ECAP processing resulted in an increase in the number of dislocations, grain boundaries, and other defects, which caused electron scattering [5]. Zhao et al. reported a similar phenomenon for the Al–Mg–Si alloy [74], as well as increases in E C with the processing temperature. Finally, they also found that decomposition of impurities can be achieved by increasing diffusion kinetics, which was validated by Dalan et al. [59,75], albeit for the Cu–0.81Cr–0.07Zr alloy. Dalan et al. further concluded that the number of ECAP passes did not influence the E C. Furthermore, they concluded that for a sample processed for 4-passes, route Bc provided better E C than route A. Zhu et al. [67] found that the E C of the Cu-Mg alloy drops with the increase in grain refinement, as well as increase in the dislocation and point defect density, which occur due to extensive processing. Kommel et al. reported that the E C of the Cu–Cr alloy decreases further when the alloy is processed as well as with the increase in the processing temperature [76]. Kumar et al. [77] showed that the density of the defects produced from cyclic channel die compression influences the E C of oxygen-free highly conductive Cu, as it decreases with the increase in defect density. The previously reported decrease in E C with the number of ECAP passes was further confirmed by research done by Ko et al. [68] and Wei et al. [60] on the Cu–3 wt% Ag alloy and pure Cu, respectively. However, Ciemiorek et al. [78] found that a decrease in the E C of Cu occurred after the first pass, only for the E C to rise again with the progression of processing till 8-passses. Finally, Cho et al. [79] investigated the Cu–15Ag alloy and found that for 8-pass processing, the highest E C values were produced, in a descending order: route C, route A, and finally route Bc.
3.5 RSM optimization
Based on the comprehensive analysis of each independent variable, this section presents the optimal ECAP condition of the desired response using Stat-Ease Design Expert software (version 13.0.5). In this context, Figure 19 shows the RSM optimization results of H C and H E. The optimization target is set to “In range,” and the solution destination is set to “Maximize.” Larger-is-better characteristics are the predicted output of the DF. The maximum H C of 150.423 HV was obtained at die angle (A) = 99.25°, number of passes (B) = 4-passes, processing temperature (C) = 34.7°C, dummy variable x 1(D) = 0, and dummy variable x 2(E) = 1 as shown in Figure 19a. In addition, Figure 19b shows the optimal ECAP condition of H E. The maximum H E of 158.927 HV was obtained at die angle (A) = 104.86°, number of passes (B) = 6-passes, processing temperature (C) = 129°C, dummy variable x 1(D) = 0, and dummy variable x 2(E) = 1.

RSM optimization results of (a) H C and (b) H E.
The optimum RSM condition of tensile response, namely, σ y and σ u are presented in Figure 20. The optimization target is set to “In range,” and the solution destination is set to “Maximize.” Larger-is-better characteristics are the predicted output of the DF The maximum σ y of 225.8 MPa was obtained at die angle (A) = 95.15°, number of passes (B) = 6-passes, processing temperature (C) = 40°C, dummy variable x 1(D) = 0, and dummy variable x 2(E) = 1 as shown in Figure 20a. In addition, Figure 20b shows the optimal ECAP condition of σ u. The maximum σ u of 348.73 MPa was obtained at die angle (A) = 90.6°, number of passes (B) = 6-passes, processing temperature (C) = RT, dummy variable x 1(D) = 1, and dummy variable x 2(E) = 0.

RSM optimization results of (a) σ y and (b) σ u.
The RSM optimization results of D u are presented in Figure 21. the optimization target is set to “In range,” and the solution destination is set to “Maximize.” The DF’s predicted output is in the form of “Larger-is-better” characteristics. The maximum D u of 31.76% was obtained at die angle (A) = 111°, number of passes (B) = 6-passes, processing temperature (C) = 200°C, dummy variable x 1(D) = 0, and dummy variable x 2(E) = 1.

RSM optimization results of Du.
Figure 22 shows the optimal condition of I T response of the Cu ECAP process. The optimization target is set to “In range,” and the solution destination is set to “Maximize.” The DF’s predicted output is in the form of “larger-is-better” characteristics. The optimal process condition values such as die angle (A) = 109.5°, number of passes (B) = 6-passes, processing temperature (C) = 191.25°C, dummy variable x 1(D) = 0, and dummy variable x 2(E) = 1 for maximum I T value of 141.214 J·cm−2.

RSM optimization results of I T.
Furthermore, Figure 23 presents the RSM optimization results of E C copper ECAP process and corresponding conditions. The optimization target is set to “In range,” and the solution destination is set to “Maximize.” The DF’s predicted output is in the form of “larger-is-better” characteristics. The optimal process condition values such as die angle (A) = 119°, number of passes (B) = 2-passes, processing temperature (C) = 200°C, dummy variable x 1(D) = 1, and dummy variable x 2(E) = 0 for maximum E C value of 98.405%.
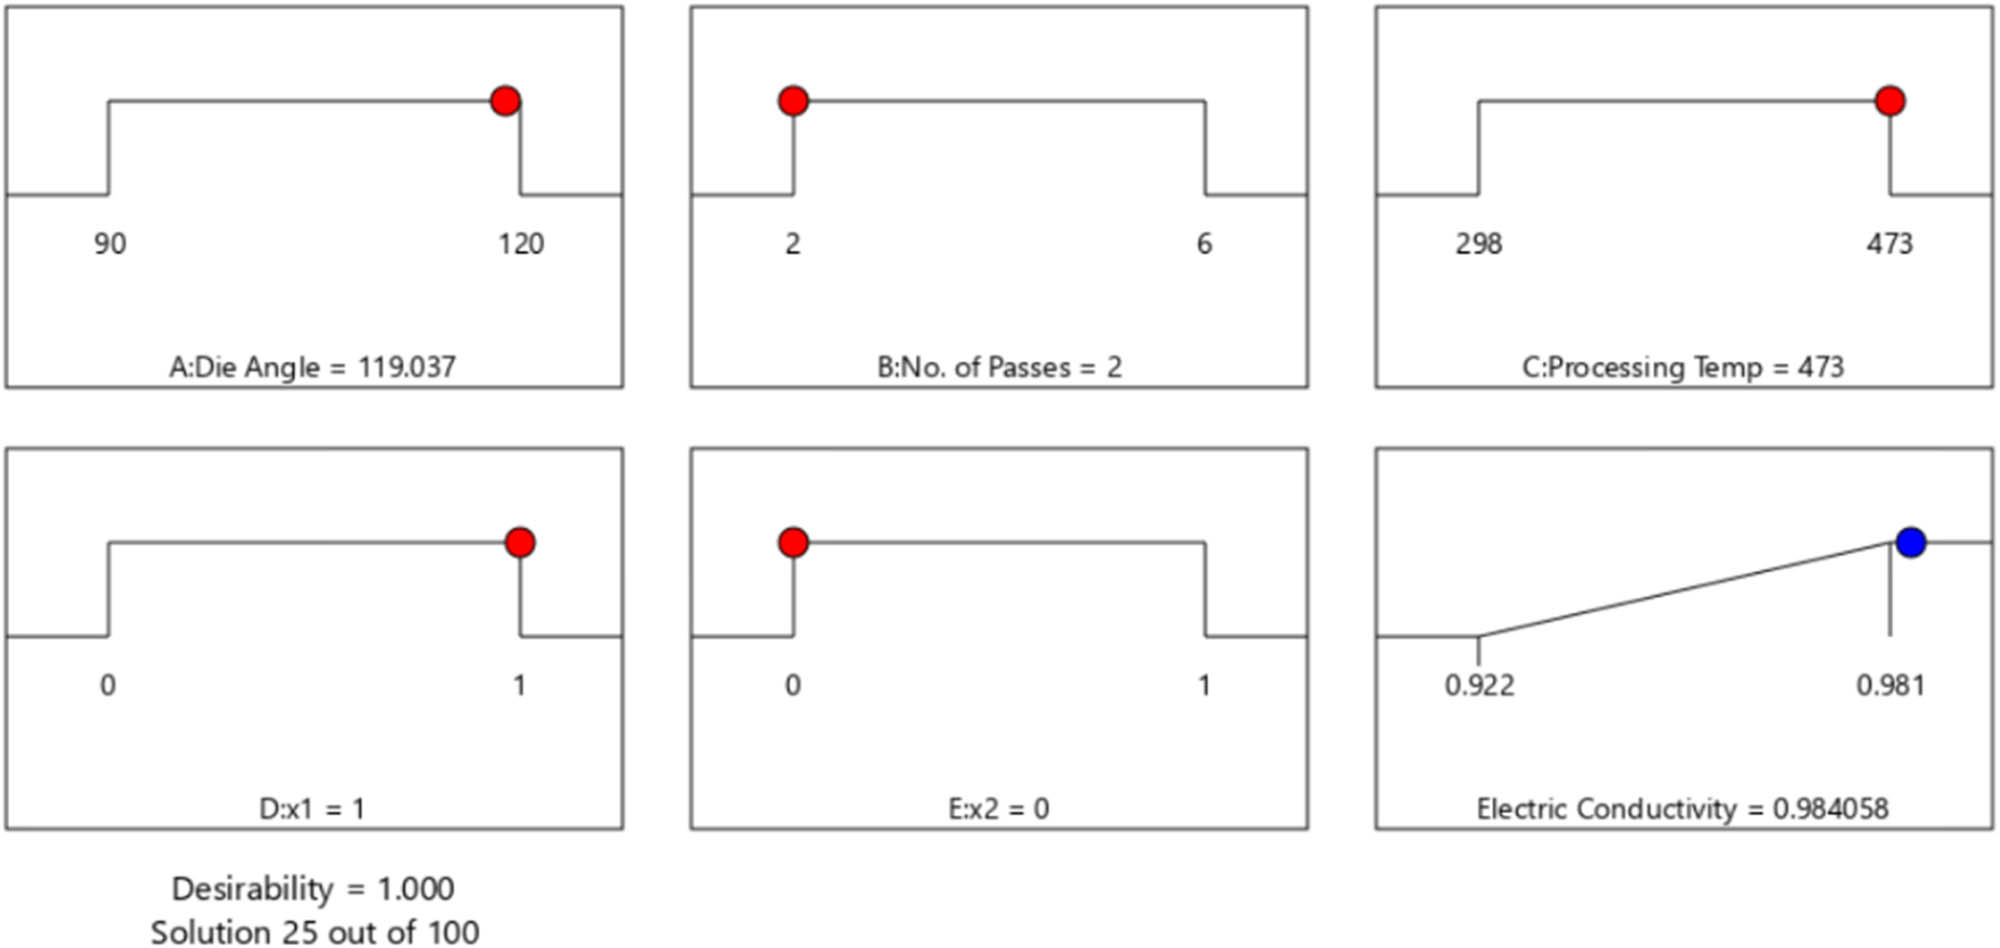
RSM optimization results of E c.
3.6 GA and hybrid RSM–GA results
Finally, GA is used to determine the optimum set of the ECAP conditions, N, φ, T, x 1, and x 2, which contribute to the higher possible H C, H E, σ y, σ u, Du, I T, and E C. Each ECAP response proposed in equations (3)–(9) is taken as the fitness function and subjected to the ECAP boundary condition, N, φ, T, x 1, and x 2 by using GA can be expressed as:
Minimize ECAP (N, φ, T, x 1, x 2),
subjected to the following ECAP constraints:
1 ≤ N ≤ 4 (pass)
90 ≤ φ ≤ 120(°)
298 ≤ T ≤ 473(K)
x 1 ϵ [0,1]
x 2 ϵ [0,1]
The optimization of hardness response by GA is presented in Figure 24. The highest possible H C and H E proposed in equations 3 and 4 are taken as the fitness functions and subjected to the ECAP boundary condition. The best value of H C and H E by GA is 148.867 HV and 157.203 HV, respectively, obtained at 6-passes, 90°-die angle, RT processing temperature, and route A. Hybrid RSM–GA of H C and H E was performed to improve the results of GA. The maximum optimum H C and H E by hybrid RSM–GA are 148.867 HV and 157.493 HV, respectively, obtained at 6-passes, 90°-die angle, RT processing temperature, and route A as shown in Figure 24.

Optimum H C and H E by GA and hybrid RSM–GA.
The optimization of tensile response σ y, σ u, and Du, by GA, is presented in Figure 25. The maximization of σ y, σ u, and D u proposed in equations (5)–(7) is taken as the fitness function, and subjected to the ECAP boundary condition. The best highest value of σ y is 223.418 MPa obtained at 6-passes, 120° die angle, RT processing temperature, and route A. Also, the best highest value of σ u is 348.732 MPa obtained at 6-passes, 90°-die angle, RT processing temperature, and route A. Finally, the maximum percentage of D u by GA is 35.77% obtained at 6-passes, 120°-die angle, 200°C processing temperature, and route Bc.

Optimum σ y, σ u, and D u by GA and hybrid RSM–GA.
The maximum σ y by hybrid RSM–GA is 223.421 MPa obtained at 6-passes, 120°-die angle, RT processing temperature, and route A. Also, the best highest value of σ u by hybrid RSM–GA is 348.733 MPa obtained at 6-passes, 90°-die angle, RT processing temperature, and route A. Finally, the maximum optimum Du% by hybrid RSM–GA is 35.77% obtained at 6-passes, 120°-die angle, 200°C processing temperature, and route Bc. Table 4 summarizes the comparison of ECAP response values at experimental, RSM, GA, and hybrid RSM–GA.
Summary results of commercial pure copper ECAP process
| Response | Experimental | RSM | GA | RSM-GA | |
|---|---|---|---|---|---|
| I T | Value | 115 | 141.214 | 114.998 | 114.998 |
| Cond. | 2-passes, 120°, 200°C, route A | 6-passes, 109°, 191.25°C, route Bc | 2-passes, 120°, 200°C, route A | 2-passes, 120°, 200°C, route A | |
| E C | Value | 98.1 | 98.405 | 98.4721 | 98.4809 |
| Cond. | 2-passes, 120°, 200°C, route A | 2-passes, 119°, 200°C, route A | 2-passes, 120°, 200°C, route A | 2-passes, 120°, 200°C, route A | |
| H C | Value | 149 | 150.423 | 148.867 | 148.867 |
| Cond. | 6-passes, 90°, 298 K, route A | 4-passes, 99°, 3.7°C, route Bc | 6-passes, 90°, RT, route A | 6-passes, 90°, RT, route A | |
| H E | Value | 158 | 158.927 | 157.203 | 157.493 |
| Cond. | 6-passes, 90°, RT, route A | 6-passes, 104.8°, 129°C, route Bc | 6-passes, 90°, 26.5°C, route A | 6-passes, 90°, RT, route A | |
| σ y | Value | 225 | 225.8 | 223.418 | 223.421 |
| Cond. | 6-passes, 120°, RT, route A | 6-passes, 95.15°, 40°C, route Bc | 6-passes, 120°, RT, route A | 6-passes, 120°, RT, route A | |
| σ u | Value | 353 | 348.733 | 348.732 | 348.733 |
| Cond. | 6-passes, 90°, RT, route A | 6-passes, 90°, RT, route A | 6-passes, 90°, RT, route A | 6-passes, 90°, RT, route A | |
| D u | Value | 14.8 | 14.7385 | 14.5144 | 14.5142 |
| Cond. | 6-passes, 90°, RT, route A | 6-passes, 90°, RT, route A | 6-passes, 90°, RT, route A | 6-passes, 90°, RT, route A | |
In addition, Figure 26 shows the performance results of I T and E C obtained by MATLAB. The best highest value of I T and E C obtained by GA is 114.998 J·cm−2 and 98.47%, respectively. The corresponding ECAP’s conditions for best of both I T and E C are obtained at 2-passes, 120°-die angle, 200°C processing temperature, and route A. Hybrid of RSM–GA was performed in order to improve the results of GA. An initial population of hybrid RSM–GA based on RSM optimum ECAP condition of N, φ, T, x 1, and x 2 of I T and E C. The maximum optimum I T and E C by hybrid RSM–GA are 114.998 J·cm−2 and 98.48%, respectively, obtained at 2-passes, 120°-die angle, 473 K processing temperature, and route A.

Optimum I T and E C by GA and hybrid RSM–GA.
4 Conclusion
In the current study, commercial pure Cu were processed using 2 ECAP dies with angles of 90° and 120°. Several ECAP routes (A, Bc, and C) were employed up to 6-passes. The ECAPed samples were processed at RT, 100°C, and 200°C. The effect of ECAP parameters on microstructural evolution, tensile properties, Vicker’s microhardness, impact toughness, and electrical conductivity was analyzed. RSM, ANOVA, GA, and RSM–GA were used to optimize the ECAP processing parameters and arrived at the following conclusions:
In the early passes, both the equivalent stress and plastic strain exhibited a heterogeneous distribution, while in the subsequent passes more homogenous distribution was achieved.
Route Bc is the most effective route type in grain refining.
The 90°-die is more effective in producing a UFG grain structure compared to the 120°-die.
The RSM revealed that the processing conditions of 6-Bc using about 105°-die at 129°C is the optimum processing parameter in improving the Cu hardness as it leads to an increase in the hardness by 59% compared to the AA counterpart.
The optimum processing condition for improving σ y and σ u are 4-A using about 95°-die at 40°C and 6-A using the 90°-die at 40°C, respectively, as they resulted in increasing σ y and σ u by 175 and 54%, respectively, compared to the AA condition.
The RSM optimization showed that the processing conditions of 6-Bc using 111°-die at 200°C are more effective in improving the Cu ductility.
The processing condition of 6-Bc using about 109.5°-die at 191°C is the optimum condition for improving the Cu ductility.
ECAP processing can strengthen the Cu billets without a significant effect on their electric conductivity.
Acknowledgments
Researchers would like to thank the Deanship of Scientific Research, Qassim University, for funding the publication of this project.
-
Funding information: The authors state no funding involved.
-
Author contributions: Abdulrahman I. Alateyah: writing – original draft, writing – review and editing, methodology, formal analysis, and project administration; Mahmoud El-Shenawy: writing – original draft, writing – review and editing, resources, methodology, and formal analysis; Ahmed Nassef: writing – review and editing, project administration, and validation; Medhat El-Hadek: writing – review and editing, project administration, and validation; Mohamed M. Z. Ahmed: writing – review and editing, project administration, and validation; Hanan Kouta: writing – original draft preparation, formal analysis, methodology, and investigation; Samar El Sanabary: writing – original draft preparation, formal analysis, methodology, and investigation; Waleed H. El-Garaihy: writing – original draft, writing – review and editing, resources, methodology, formal analysis, and project administration. All authors have accepted responsibility for the entire content of this manuscript and approved its submission.
-
Conflict of interest: The authors state no conflict of interest.
-
Data availability statement: All data generated or analysed during this study are included in this published article [and its supplementary information files].
Appendix
Design of experiment of ECAP parameters and process response
| Run | ECAP Condition | ECAP response | |||||||||
|---|---|---|---|---|---|---|---|---|---|---|---|
| N | φ | T | Processing route type | Hardness | Tensile strength | I T (J·cm−2) | E C (% IACS) | ||||
| H E (HV) | H C (HV) | σ y (MPa) | σ u (MPa) | D u (%) | |||||||
| 1 | 2 | 120 | 473 | A | 128 | 122 | 108 | 264 | 28.5 | 115 | 98.1% |
| 2 | 2 | 90 | 473 | C | 127 | 119 | 112 | 268 | 28 | 68 | 95.2% |
| 3 | 2 | 120 | 298 | C | 124 | 116 | 124 | 285 | 25 | 65 | 96% |
| 4 | 6 | 120 | 473 | A | 137 | 132 | 167 | 318 | 23 | 105 | 97.3% |
| 5 | 2 | 90 | 373 | A | 139 | 129 | 126 | 288 | 25.6 | 68 | 95.4% |
| 6 | 6 | 120 | 473 | C | 141 | 134 | 158 | 316 | 24.6 | 84 | 96.9% |
| 7 | 6 | 120 | 473 | C | 139 | 132 | 162 | 322 | 23.9 | 80 | 96.4% |
| 8 | 6 | 120 | 298 | C | 145 | 137 | 212 | 324 | 20 | 75 | 95.3% |
| 9 | 6 | 120 | 298 | A | 149 | 142 | 225 | 332 | 19 | 95 | 94.9% |
| 10 | 2 | 90 | 373 | A | 137 | 130 | 122 | 284 | 26.4 | 67 | 94.5% |
| 11 | 4 | 90 | 298 | C | 151 | 143 | 176 | 342 | 17 | 52 | 92.2% |
| 12 | 4 | 120 | 373 | C | 139 | 129 | 132 | 328 | 20.8 | 75 | 96.2% |
| 13 | 6 | 90 | 473 | Bc | 145 | 141 | 179 | 338 | 22 | 55 | 92.8% |
| 14 | 2 | 90 | 473 | C | 129 | 120 | 114 | 265 | 28.4 | 69 | 96.5% |
| 15 | 2 | 90 | 298 | Bc | 138 | 137 | 166 | 304 | 19 | 55 | 96.3% |
| 16 | 4 | 120 | 373 | A | 142 | 132 | 138 | 325 | 20.5 | 85 | 97.4% |
| 17 | 6 | 90 | 298 | A | 158 | 149 | 208 | 353 | 14.8 | 45 | 93.2% |
| 18 | 4 | 90 | 298 | C | 152 | 142 | 168 | 338 | 17.6 | 50 | 93.3% |
| 19 | 2 | 120 | 298 | A | 128 | 119 | 126.5 | 302 | 22.5 | 68 | 96.7% |
| 20 | 2 | 120 | 373 | Bc | 121 | 118 | 112 | 278 | 27 | 85 | 95.9% |
| 21 | 6 | 90 | 473 | Bc | 147 | 143 | 176 | 332 | 22.8 | 60 | 93.5% |
References
[1] Ma, M., Z. Li, W. Qiu, Z. Xiao, Z. Zhao, Y. Jiang, et al. Development of homogeneity in a Cu-Mg-Ca alloy processed by equal channel angular pressing. Journal of Alloys and Compounds, Vol. 820, 2020, id. 153112.10.1016/j.jallcom.2019.153112Search in Google Scholar
[2] Ma, M., Z. Li, W. Qiu, Z. Xiao, Z. Zhao, and Y. Jiang. Microstructure and properties of Cu–Mg–Ca alloy processed by equal channel angular pressing. Journal of Alloys and Compounds, Vol. 788, 2019, pp. 50–60.10.1016/j.jallcom.2019.01.335Search in Google Scholar
[3] Abib, K., J. A. M. Balanos, B. Alili, and D. Bradai. On the microstructure and texture of Cu-Cr-Zr alloy after severe plastic deformation by ECAP. Materials Characterization, Vol. 112, 2016, pp. 252–258.10.1016/j.matchar.2015.12.026Search in Google Scholar
[4] Alateyah, A. I., M. M. Z. Ahmed, Y. Zedan, H. M. El-Hafez, M. O. Alawad, and W. H. El-Garaihy. Experimental and numerical investigation of the ECAP processed copper: Microstructural evolution, crystallographic texture and hardness homogeneity. Metals, Vol. 11, No. 4, 2021, 10.3390/met11040607.Search in Google Scholar
[5] Krishna, S. C., N. Chawake, R. S. Kottada, A. K. Jha, B. Pant, and P. V. Venkitakrishnan. High strength and good ductility in Cu-3Ag-0.5Zr alloy by cryo-rolling and aging. Journal of Materials Engineering and Performance, Vol. 26, 2017, pp. 350–357.10.1007/s11665-016-2419-3Search in Google Scholar
[6] Murashkin, M. Y., I. Sabirov, X. Sauvage, and R. Z. Valiev. Nanostructured Al and Cu alloys with superior strength and electrical conductivity. Journal of Materials Science, Vol. 51, 2016, pp. 33–49.10.1007/s10853-015-9354-9Search in Google Scholar
[7] Islamgaliev, R. K., K. M. Nesterov, and R. Z. Valiev. Structure, strength, and electric conductivity of a Cu-Cr copper-based alloy subjected to severe plastic deformation. The Physics of Metals and Metallography, Vol. 116, 2015, pp. 209–218.10.1134/S0031918X14090063Search in Google Scholar
[8] Král, P., J. Dvořák, M. Kvapilová, W. Blum, and V. Sklenička. The influence of long-term annealing at room temperature on creep behaviour of ECAP-processed copper. Materials Letter, Vol. 188, 2017, pp. 235–238.10.1016/j.matlet.2016.11.002Search in Google Scholar
[9] Huang, R., D. Zhu, X. Liao, and Q. Yan. Effect of ECAP process and subsequent annealing on microstructure and properties of Cu-0.25Se-0.25Te alloy. Journal of Electronic Materials, Vol. 49, 2020, pp. 2617–2624.10.1007/s11664-020-07975-5Search in Google Scholar
[10] Bochvar, N. R., O. V. Rybalchenko, D. V. Shangina, and S. V. Dobatkin. Effect of equal-channel angular pressing on the precipitation kinetics in Cu-Cr-Hf alloys. Materials Science & Engineering, A, Vol. 757, 2019, pp. 84–87.10.1016/j.msea.2019.04.073Search in Google Scholar
[11] Xu, X. X., F. L. Nie, J. X. Zhang, W. Zheng, Y. F. Zheng, C. Hu, et al. Corrosion and ion release behavior of ultra-fine grained bulk pure copper fabricated by ECAP in Hanks solution as potential biomaterial for contraception. Materials Letters, Vol. 64, 2010, pp. 524–527.10.1016/j.matlet.2009.11.065Search in Google Scholar
[12] Jayakumar, P. K., K. Balasubramaniana, and G. R. Tagore. Recrystallisation and bonding behaviour of ultrafine grained copper and Cu–Cr–Zr alloy using ECAP. Materials Science & Engineering, A, Vol. 538, 2012, pp. 7–13.10.1016/j.msea.2011.12.069Search in Google Scholar
[13] Patil, A., S. Bontha, and M. R. Ramesh. Effect of ECAP on sliding wear behaviour of Mg-Zn-Gd-Zr alloy. Materials Today: Proceedings, Vol. 20, 2020, pp. 97–102.10.1016/j.matpr.2019.10.045Search in Google Scholar
[14] Alateyah, A. I., T. A. Aljohani, M. O. Alawad, H. Abd El-Hafez, A. N. Almutairi, E. S. Alharbi, et al. Improved corrosion behavior of AZ31 alloy through ECAP processing. Metals, Vol. 11, No. 2, 2021, pp. 1–19.10.3390/met11020363Search in Google Scholar
[15] Alateyah, A. I., M. Alharbi, H. M. El-Hafez, and W. H. El-Garaihy. The effect of equal-channel angular pressing processing on microstructural evolution, hardness homogeneity, and mechanical properties of pure aluminum. SAE International Journal of Materials & Manufacturing, Vol. 14, No. 2, 2020, pp. 1–13.10.4271/05-14-02-0009Search in Google Scholar
[16] Alateyah, A. I., M. M. Z. Ahmed, M. O. Alawad, S. Elkatatny, Y. Zedan, A. Nassef, et al. Effect of ECAP die angle on the strain homogeneity, microstructural evolution, crystallographic texture and mechanical properties of pure magnesium: numerical simulation and experimental approach. Journal of Materials Research and Technology, Vol. 17, 2022, pp. 1491–1511.10.1016/j.jmrt.2022.01.088Search in Google Scholar
[17] El-Shenawy, M., M. M. Z. Ahmed, A. Nassef, M. El-Hadek, B. Alzahrani, Y. Zedan, et al. Effect of ECAP on the plastic strain homogeneity, microstructural evolution, crystallographic texture and mechanical properties of AA2xxx aluminum alloy. Metals, Vol. 1, No. 6, 2021, pp. 1–23.10.3390/met11060938Search in Google Scholar
[18] El-Garaihy, W. H., A. I. Alateyah, M. O. Alawad, and T. A. Aljohani. Improving the corrosion behavior and mechanical properties of biodegradable Mg-Zn-Zr alloys through ECAP for usage in biomedical applications. Magnesium Technology, Springer, Cham, 2022, pp. 259–269. https://link.springer.com/chapter/10.1007/978-3-030-92533-8_45.10.1007/978-3-030-92533-8_45Search in Google Scholar
[19] Yang, Z., A. Ma, B. Xu, J. Jiang, and J. Sun. Corrosion behavior of AZ91 Mg alloy with a heterogeneous structure produced by ECAP. Corrosion Science, Vol. 187, 2021, id. 109517.10.1016/j.corsci.2021.109517Search in Google Scholar
[20] Valiev, R. Z. and T. G. Langdon. Principles of equal channel angular pressing as a processing tool for grain refinement. Progress in Materials Science, Vol. 51, 2006, pp. 881–981.10.1016/j.pmatsci.2006.02.003Search in Google Scholar
[21] El-Garaihy, W. H., E. S. M. A. Rassoul, and H. G. Salem. Consolidation of high performance AA6061 and AA6061-SiCp composite processed by high pressure torsion. In Materials Science Forum, Trans Tech Publications, Zurich, Switzerland, 2014, pp. 2623–2628.10.4028/www.scientific.net/MSF.783-786.2623Search in Google Scholar
[22] Kong, Y., Q. Pu, Z. Jia, M. Liu, H. J. Roven, J. Jia, et al. Microstructure and property evolution of Al-0.4Fe-0.15Zr-0.25Er alloy processed by high pressure torsion. Journal of Alloys and Compounds, Vol. 824, 2020, id. 153949.10.1016/j.jallcom.2020.153949Search in Google Scholar
[23] Bednarczyk, W., J. Kawałko, M. Wątroba, N. Gao, M. J. Starink, P. Bała, et al. Microstructure and mechanical properties of a Zn-0.5Cu alloy processed by high-pressure torsion. Materials Science & Engineering, A, Vol. 776, 2020, id. 139047.10.1016/j.msea.2020.139047Search in Google Scholar
[24] Salem, H. G., W. H. El-Garaihy, and E. S. M. A. Rassoul. Influence of high pressure torsion on the consolidation behavior and mechanical properties of AA6061-SiCp composites powders. TMS Annu Meet, 1, 2012, 553-560.10.1002/9781118356074.ch71Search in Google Scholar
[25] Ghazanlou, S. I., B. Eghbali, and R. Petrov. Microstructural evolution and strengthening mechanisms in Al7075/graphene nano-plates/carbon nano-tubes composite processed through accumulative roll bonding. Materials Science & Engineering, A, Vol. 807, 2021, id. 140877.10.1016/j.msea.2021.140877Search in Google Scholar
[26] She, J., P. Peng, A. T. Tang, J. Y. Zhang, J. J. Mao, T. T. Liu, et al. Novel on-line twist extrusion process for bulk magnesium alloys. Materials & Design, Vol. 182, 2019, id. 108011.10.1016/j.matdes.2019.108011Search in Google Scholar
[27] El-Garaihy, W. H., D. M. Fouad, and H. G. Salem. Multi-channel spiral twist extrusion (MCSTE): A novel severe plastic deformation technique for grain refinement. Metallurgical and Materials Transactions A, Vol. 49, No. 7, 2018, pp. 2854–2864.10.1007/s11661-018-4621-4Search in Google Scholar
[28] Fouad, D. M., A. Moataz, W. H. El-Garaihy, and H. G. Salem. Numerical and experimental analysis of multi-channel spiral twist extrusion processing of AA5083. Materials Science & Engineering, A, Vol. 764, 2019, id. 138216.10.1016/j.msea.2019.138216Search in Google Scholar
[29] Fouad, D. M., W. H. El-Garaihy, M. M. Z. Ahmed, M. M. E. Seleman, and H. G. Salem. Influence of multi-channel spiral twist ex-trusion (MCSTE) processing on structural evolution, crystallographic texture and mechanical properties of AA1100. Materials Science & Engineering, A, Vol. 737, 2018, pp. 166–175.10.1016/j.msea.2018.09.039Search in Google Scholar
[30] Fouad, D. M., W. H. El-Garaihy, M. M. Z. Ahmed, I. Albaijan, M. M. E. Seleman, and H. G. Salem. Grain structure evolution and mechanical properties of multi-channel spiral twist extruded AA5083. Metals, Vol. 11, No. 8, 2021, 10.3390/met11081276.Search in Google Scholar
[31] Habibi, A., M. Ketabchi, and M. Eskandarzadeh. Nano-grained pure copper with high-strength and high-conductivity produced by equal channel angular rolling process. Journal of Materials Processing Technology, Vol. 211, 2011, pp. 1085–1090.10.1016/j.jmatprotec.2011.01.009Search in Google Scholar
[32] Molodova, X., A. Khorashadizadeh, G. Gottstein, M. Winning, and R. J. Hellmig. Thermal stability of ECAP processed pure Cu and CuZr. International Journal of Materials Research, Vol. 98, 2007, pp. 269–275.10.3139/146.101468Search in Google Scholar
[33] El-Danaf, E. A., M. S. Soliman, A. A. Almajid, and M. M. El-Rayes. Enhancement of mechanical properties and grain size refinement of commercial purity aluminum 1050 processed by ECAP. Materials Science & Engineering, A, Vol. 458, 2007, pp. 226–234.10.1016/j.msea.2006.12.077Search in Google Scholar
[34] Bagherzadeh, S., K. Abrinia, and Q. Han. Analysis of plastic deformation behavior of ultrafine-grained aluminum processed by the newly developed ultrasonic vibration enhanced ECAP: Simulation and experiments. Journal of Manufacturing Processes, Vol. 50, 2020, pp. 485–497.10.1016/j.jmapro.2020.01.010Search in Google Scholar
[35] Krajňák, T., P. Minárik, J. Stráská, J. Gubicza, L. Dluhoš, K. Máthis, et al. Influence of temperature of ECAP processing on the microstructure and microhardness of as-cast AX41 alloy. Journal of Materials Science, Vol. 55, 2020, pp. 3118–3129.10.1007/s10853-019-04171-7Search in Google Scholar
[36] El-Garaihy, W. H., E. A. Rassoul, A. Alateyah, A. M. Alaskari, and S. Oraby. Data manipulation approach and parameters interrelationships of the high-pressure torsion for AA6061-15%SiCp composite. SAE International Journal of Materials & Manufacturing, Vol. 11, No. 3, 2018, pp. 167–182.10.4271/05-11-03-0017Search in Google Scholar
[37] El-Garaihy, W. H., A. M. Alaskari, E. A. Ameshaiei, and S. E. Oraby. On the effect of HPT processing conditions on relative density, mechanical properties and microstructural evolution of hot compacted AA6061- mathematical empirical and response surface approach. Advanced Materials Letters, Vol. 8, No. 5, 2016, pp. 620–628.10.5185/amlett.2017.1402Search in Google Scholar
[38] El-Garaihy, W. H., S. E. Oraby, E. M. A. Rassoul, and H. G. Salem. On the effect of SiC content and processing temperature on relative density and hardness of hot compacted aluminum AA6061 composite – mathematical empirical and response surface approach. Journal of Materials Science Research, Vol. 4, No. 3, 2015, pp. 1–14.10.5539/jmsr.v4n3p1Search in Google Scholar
[39] Ghaedi, M., F. N. Azad, K. Dashtian, S. Hajati, A. Goudarzi, and M. Soylak. Central composite design and genetic algorithm applied for the optimization of ultrasonic-assisted removal of malachite green by ZnO nanorod-loaded activated carbon. Spectrochimica Acta Part A: Mol Biomolecular Spectrosc, Vol. 167, 2016, pp. 157–164.10.1016/j.saa.2016.05.025Search in Google Scholar PubMed
[40] Daryadel, M. Study on equal channel angular pressing process of AA7075 with Cu casing by finite element-response surface couple method. International Journal of Engineering, Vol. 33, No. 12, 2020, pp. 2538–2548.10.5829/ije.2020.33.12c.15Search in Google Scholar
[41] Abbas, A. T., M. A. Taha, A. E. Ragab, E. A. El-Danaf, and M. I. Abd El Aal. Effect of equal channel angular pressing on the surface roughness of solid state recycled aluminum alloy 6061 chips. Advances in Materials Science and Engineering, Vol. 2017, 2017, pp. 1–12.10.1155/2017/5131403Search in Google Scholar
[42] Dadrasi, A., S. Fooladpanjeh, and A. A. Gharahbagh. Interactions between HA/GO/epoxy resin nanocomposites: Optimization, modeling and mechanical performance using central composite design and genetic algorithm. Journal of the Brazilian Society of Mechanical Sciences and Engineering, Vol. 41, No. 2, 2019.10.1007/s40430-019-1564-7Search in Google Scholar
[43] Santhosh, A. J., A. D. Tura, I. T. Jiregna, W. F. Gemechu, N. Ashok, and M. Ponnusamy. Optimization of CNC turning parameters using face centred CCD approach in RSM and ANN-genetic algorithm for AISI 4340 alloy steel. Results in Engineering, Vol. 11, 2021, id. 100251.10.1016/j.rineng.2021.100251Search in Google Scholar
[44] Deshwal, S., A. Kumar, and D. Chhabra. Exercising hybrid statistical tools GA-RSM, GA-ANN and GA-ANFIS to optimize FDM process parameters for tensile strength improvement. CIRP Journal of Manufacturing Science and Technology, Vol. 31, 2020, pp. 189–199.10.1016/j.cirpj.2020.05.009Search in Google Scholar
[45] Deng, G. Y., C. Lu, L. H. Su, X. H. Liu, and A. K. Tieu. Modeling texture evolution during ECAP of copper single crystal by crystal plasticity FEM. Materials Science & Engineering, A: Structural Materials: Properties, Microstructure and Processing, Vol. 534, 2012, pp. 68–74.10.1016/j.msea.2011.11.042Search in Google Scholar
[46] Deng, G. Y., C. Lu, A. K. Tieu, L. H. Su, N. N. Huynh, and X. H. Liu. Crystal plasticity investigation of friction effect on texture evolution of Al single crystal during ECAP. Journal of Materials Science, Vol. 45, 2010, pp. 4711–4717.10.1007/s10853-010-4674-2Search in Google Scholar
[47] Kilickap, E., M. Huseyinoglu, and A. Yardimeden. Optimization of drilling parameters on surface roughness in drilling of AISI 1045 using response surface methodology and genetic algorithm. The International Journal of Advanced Manufacturing Technology, Vol. 52, No. 1–4, 2011, pp. 79–88.10.1007/s00170-010-2710-7Search in Google Scholar
[48] Hazir, E. and T. Ozcan. Response surface methodology integrated with desirability function and genetic algorithm approach for the optimization of CNC machining parameters. Arabian Journal for Science and Engineering, Vol. 44, No. 3, 2019, pp. 2795–2809.10.1007/s13369-018-3559-6Search in Google Scholar
[49] Munusamy, T. D., S. Y. Chin, and M. M. R. Khan. Photoreforming hydrogen production by carbon doped exfoliated g-C3N4: Optimization using design expert® software. Materials Today: Proceedings, Vol. 57, No. 3, 2021, pp. 1162–1168.10.1016/j.matpr.2021.10.106Search in Google Scholar
[50] Rezić, I. Prediction of the surface tension of surfactant mixtures for detergent formulation using Design Expert software. Monatshefte für Chemie-Chemical Monthly, Vol. 142, No. 12, 2011, pp. 1219–1225.10.1007/s00706-011-0554-ySearch in Google Scholar
[51] Makki, A. A., R. A. Stewart, K. Panuwatwanich, and C. Beal. Development of a domestic water end use consumption forecasting model for South-East Queensland. The 6th IWA Specialist Conference on Efficient Use and Management of Water, International Water Association, Australia, 2011.Search in Google Scholar
[52] Gu, C. F. and L. S. Tóth. The origin of strain reversal texture in equal channel angular pressing. Acta Materialia, Vol. 59, 2011, pp. 5749–5757.10.1016/j.actamat.2011.05.051Search in Google Scholar
[53] Illgen, C., P. Frint, M. Gruber, W. Volk, and M. F. X. Wagner. Evolution of grain refinement in AA5083 sheet metal processed by ECAP. The Minerals, Metals & Materials Series, 2021, pp. 362–369.10.1007/978-3-030-36408-3_52Search in Google Scholar
[54] Elsanabary, S. and H. K. Kouta. Optimization of inertia friction welding of dissimilar polymeric PA6-PVC hollow cylinders by genetic algorithm. Port-Said Engineering Research Journal, Vol. 25, No. 1, 2021, pp. 91–100.10.21608/pserj.2020.33683.1048Search in Google Scholar
[55] Gopal, M. Optimization of machining parameters on temperature rise in CNC turning process of aluminium–6061 using RSM and genetic algorithm. International Journal of Modern Manufacturing Technologies, Vol. 12, No. 1, 2020, pp. 36–43.Search in Google Scholar
[56] Dritsa, V., F. Rigas, D. Doulia, E. J. Avramides, and I. Hatzianestis. Optimization of culture conditions for the biodegradation of lindane by the polypore fungus Ganoderma australe. Water, Air, & Soil Pollution, Vol. 204, No. 1, 2009, pp. 19–27.10.1007/s11270-009-0022-zSearch in Google Scholar
[57] Asghar, A., A. A. Abdul Raman, and W. M. A. W. Daud. A comparison of central composite design and Taguchi method for optimizing Fenton process. The Scientific World Journal, Vol. 2014, 2014, pp. 1–15.10.1155/2014/869120Search in Google Scholar PubMed PubMed Central
[58] Djavanroodi, F., B. Omranpour, M. Ebrahimi, and M. Sedighi. Designing of ECAP parameters based on strain distribution uniformity. Progress in Natural Science: Materials International, Vol. 22, 2012, pp. 452–460.10.1016/j.pnsc.2012.08.001Search in Google Scholar
[59] Dalan, F. C., G. F. de Lima Andreani, D. N. Travessa, S. Faizova, I. A. Faizov, and K. R. Cardoso. Effect of ECAP processing on distribution of second phase particles, hardness and electrical conductivity of Cu−0.81Cr−0.07Zr alloy. Transactions of Nonferrous Metals Society of China, Vol. 32, 2022, pp. 217–232.10.1016/S1003-6326(21)65789-8Search in Google Scholar
[60] Wei, K. X., Z. Q. Chu, L. C. Yang, W. Wei, Q. B. Du, I. V. Alexandrov, et al. Performance evaluation of electrical discharge machining using ultrafine-grained Cu electrodes processed by equal channel angular pressing and deep cryogenic treatment. Journal of Materials Engineering and Performance, Vol. 30, 2021, pp. 281–289.10.1007/s11665-020-05351-2Search in Google Scholar
[61] Ngam, J. W., M. Kawasaki, and T. G. Langdon. A comparison of microstructures and mechanical properties in a Cu–Zr alloy processed using different SPD techniques. Journal of Materials Science, Vol. 48, 2013, pp. 4653–4660.10.1007/s10853-012-7072-0Search in Google Scholar
[62] Tong, Y. X., Y. Wang, Z. M. Qian, D., T. Zhang, L. Li, and Y. F. Zheng. Achieving high strength and high electrical conductivity in a CuCrZr alloy using equal-channel angular pressing. Acta Metallurgica Sinica (English Letters), Vol. 31, 2018, pp. 1084–1088.10.1007/s40195-018-0766-9Search in Google Scholar
[63] Tolaminejad, B. and K. Dehghani. Microstructural characterization and mechanical properties of nanostructured AA1070 aluminum after equal channel angular extrusion. Materials & Design, Vol. 34, 2012, pp. 285–292.10.1016/j.matdes.2011.08.003Search in Google Scholar
[64] Wu, Y., J. Yang, X. Shen, and R. Zhu. Cyclic creep of ultrafine-grained pure Cu under cyclic tension deformation. Journal of Materials Engineering and Performance, Vol. 26, 2017, pp. 837–842.10.1007/s11665-017-2500-6Search in Google Scholar
[65] Wang, Y. L., R. Lapovok, J. T. Wang, Y. S. Qi, and Y. Estrin. Thermal behavior of copper processed by ECAP with and without back pressure. Materials Science & Engineering, A: Structural Materials: Properties, Microstructure and Processing, Vol. 628, 2015, pp. 21–29.10.1016/j.msea.2015.01.021Search in Google Scholar
[66] Tian, Y. Z., Q. Q. Duan, H. J. Yang, H. F. Zou, G. Yang, S. D. Wu, et al. Effects of route on microstructural evolution and mechanical properties of Cu-8 Wt Pct Ag alloy processed by equal channel angular pressing. Metallurgical and Materials Transactions A: Physical Metallurgy and Materials Science, Vol. 41, 2010, pp. 2290–2303.10.1007/s11661-010-0313-4Search in Google Scholar
[67] Zhu, C., A. Ma, J. Jiang, X. Li, D. Song, D. Yang, et al. Effect of ECAP combined cold working on mechanical properties and electrical conductivity of Conform-produced Cu–Mg alloys. Journal of Alloys and Compounds, Vol. 582, 2014, pp. 135–140.10.1016/j.jallcom.2013.08.007Search in Google Scholar
[68] Ko, Y. G., S. Namgung, B. U. Lee, and D. H. Shin. Mechanical and electrical responses of nanostructured Cu–3 wt%Ag alloy fabricated by ECAP and cold rolling. Journal of Alloys and Compounds, Vol. 504, 2010, pp. 448–451.10.1016/j.jallcom.2010.02.198Search in Google Scholar
[69] Ni, S., J. Jiang, J. Chen, D. Song, and A. Ma. Microstructure and properties of in-situ synthesized Cu-1wt% TiC alloy followed by ECAP and post-annealing. Progress in Natural Science: Materials International, Vol. 26, No. 6, 2016, pp. 643–649.10.1016/j.pnsc.2016.11.013Search in Google Scholar
[70] Fang, D. R., Y. Z. Tian, Q. Q. Duan, S. D. Wu, Z. F. Zhang, N. Q. Zhao, et al. Effects of equal channel angular pressing on the strength and toughness of Al–Cu alloys. Journal of Materials Science, Vol. 46, 2011, pp. 5002–5008.10.1007/s10853-011-5419-6Search in Google Scholar
[71] Jiang, J., T. Yuan, J. Shi, L. Zhang, A. Ma, and D. Song. Enhanced impact toughness at ambient temperature of ultrafine-grained Al-26 wt.% Si alloy produced by equal-channel angular pressing. Journal of Materials Engineering and Performance, Vol. 272018, pp. 2131–2137.10.1007/s11665-018-3283-0Search in Google Scholar
[72] Meyer, L. W., M. Hockauf, B. Zillmann, and I. Schneider. Strength, ductility and impact toughness of the magnesium alloy AZ31B after equal-channel angular pressing. International Journal of Material Forming, Vol. 2, No. 1, 2009, pp. 61–64.10.1007/s12289-009-0545-2Search in Google Scholar
[73] Lipińska, M., P. Bazarnik, and M. Lewandowska. The influence of severe plastic deformation processes on electrical conductivity of commercially pure aluminum and 5483 aluminum alloy. Archives of Civil and Mechanical Engineering, Vol. 16, 2016, pp. 717–723.10.1016/j.acme.2016.04.013Search in Google Scholar
[74] Zhao, N. and C. Ban. Developing a high‑strength Al–Mg–Si alloy with improved electrical conductivity by a novel ECAP route. Metals And Materials International, Vol. 132, 2022, pp. 1–16.10.1007/s12540-021-01152-xSearch in Google Scholar
[75] Dalan, F. C., G. F. de Lima Andreani, D. N. Travessa, S. Faizova, I. A. Faizov, and K. R. Cardoso. Effect of ECAP processing on hardness, electrical conductivity, and precipitation kinetics of the Cu‑0.81Cr‑0.07Zr alloy. Journal of Electronic Materials, Vol. 50, 2021, pp. 6171–6182.10.1007/s11664-021-09144-8Search in Google Scholar
[76] Kommel, L., J. Huot, and B. O. Shahreza. Effect of hard cyclic viscoplastic deformation on the microstructure, mechanical properties, and electrical conductivity of Cu-Cr alloy. Journal of Materials Engineering and Performance, Vol. 51, 2022, pp. 1–13.10.1007/s11665-022-06997-wSearch in Google Scholar
[77] Satheesh Kumar, S. S. and T. Raghu. Electrical conductivity, thermal stability, and lattice defect evolution during cyclic channel die compression of OFHC copper. Journal of Materials Engineering and Performance, Vol. 24, 2015, pp. 726–736.10.1007/s11665-014-1359-zSearch in Google Scholar
[78] Ciemiorek, M., L. Pawliszak, W. Chromiński, L. Olejnik, and M. Lewandowska. Enhancing the electrical conductivity of electrolytic tough pitch copper rods processed by incremental equal channel angular pressing. Metallurgical and Materials Transactions A, Vol. 51A, 2020, id. 3749.10.1007/s11661-020-05818-wSearch in Google Scholar
[79] Cho, K. J. and S. I. Hong. Modification of microstructure and strength/conductivity properties of Cu-15 Ag in-situ composites by equal-channel angular pressing. Metals And Materials International, Vol. 18, No. 2, 2012, pp. 355–360.10.1007/s12540-012-2022-6Search in Google Scholar
© 2023 the author(s), published by De Gruyter
This work is licensed under the Creative Commons Attribution 4.0 International License.
Articles in the same Issue
- Review Articles
- Progress in preparation and ablation resistance of ultra-high-temperature ceramics modified C/C composites for extreme environment
- Solar lighting systems applied in photocatalysis to treat pollutants – A review
- Technological advances in three-dimensional skin tissue engineering
- Hybrid magnesium matrix composites: A review of reinforcement philosophies, mechanical and tribological characteristics
- Application prospect of calcium peroxide nanoparticles in biomedical field
- Research progress on basalt fiber-based functionalized composites
- Evaluation of the properties and applications of FRP bars and anchors: A review
- A critical review on mechanical, durability, and microstructural properties of industrial by-product-based geopolymer composites
- Multifunctional engineered cementitious composites modified with nanomaterials and their applications: An overview
- Role of bioglass derivatives in tissue regeneration and repair: A review
- Research progress on properties of cement-based composites incorporating graphene oxide
- Properties of ultra-high performance concrete and conventional concrete with coal bottom ash as aggregate replacement and nanoadditives: A review
- A scientometric review of the literature on the incorporation of steel fibers in ultra-high-performance concrete with research mapping knowledge
- Weldability of high nitrogen steels: A review
- Application of waste recycle tire steel fibers as a construction material in concrete
- Wear properties of graphene-reinforced aluminium metal matrix composite: A review
- Experimental investigations of electrodeposited Zn–Ni, Zn–Co, and Ni–Cr–Co–based novel coatings on AA7075 substrate to ameliorate the mechanical, abrasion, morphological, and corrosion properties for automotive applications
- Research evolution on self-healing asphalt: A scientometric review for knowledge mapping
- Recent developments in the mechanical properties of hybrid fiber metal laminates in the automotive industry: A review
- A review of microscopic characterization and related properties of fiber-incorporated cement-based materials
- Comparison and review of classical and machine learning-based constitutive models for polymers used in aeronautical thermoplastic composites
- Gold nanoparticle-based strategies against SARS-CoV-2: A review
- Poly-ferric sulphate as superior coagulant: A review on preparation methods and properties
- A review on ceramic waste-based concrete: A step toward sustainable concrete
- Modification of the structure and properties of oxide layers on aluminium alloys: A review
- A review of magnetically driven swimming microrobots: Material selection, structure design, control method, and applications
- Polyimide–nickel nanocomposites fabrication, properties, and applications: A review
- Design and analysis of timber-concrete-based civil structures and its applications: A brief review
- Effect of fiber treatment on physical and mechanical properties of natural fiber-reinforced composites: A review
- Blending and functionalisation modification of 3D printed polylactic acid for fused deposition modeling
- A critical review on functionally graded ceramic materials for cutting tools: Current trends and future prospects
- Heme iron as potential iron fortifier for food application – characterization by material techniques
- An overview of the research trends on fiber-reinforced shotcrete for construction applications
- High-entropy alloys: A review of their performance as promising materials for hydrogen and molten salt storage
- Effect of the axial compression ratio on the seismic behavior of resilient concrete walls with concealed column stirrups
- Research Articles
- Effect of fiber orientation and elevated temperature on the mechanical properties of unidirectional continuous kenaf reinforced PLA composites
- Optimizing the ECAP processing parameters of pure Cu through experimental, finite element, and response surface approaches
- Study on the solidification property and mechanism of soft soil based on the industrial waste residue
- Preparation and photocatalytic degradation of Sulfamethoxazole by g-C3N4 nano composite samples
- Impact of thermal modification on color and chemical changes of African padauk, merbau, mahogany, and iroko wood species
- The evaluation of the mechanical properties of glass, kenaf, and honeycomb fiber-reinforced composite
- Evaluation of a novel steel box-soft body combination for bridge protection against ship collision
- Study on the uniaxial compression constitutive relationship of modified yellow mud from minority dwelling in western Sichuan, China
- Ultrasonic longitudinal torsion-assisted biotic bone drilling: An experimental study
- Green synthesis, characterizations, and antibacterial activity of silver nanoparticles from Themeda quadrivalvis, in conjugation with macrolide antibiotics against respiratory pathogens
- Performance analysis of WEDM during the machining of Inconel 690 miniature gear using RSM and ANN modeling approaches
- Biosynthesis of Ag/bentonite, ZnO/bentonite, and Ag/ZnO/bentonite nanocomposites by aqueous leaf extract of Hagenia abyssinica for antibacterial activities
- Eco-friendly MoS2/waste coconut oil nanofluid for machining of magnesium implants
- Silica and kaolin reinforced aluminum matrix composite for heat storage
- Optimal design of glazed hollow bead thermal insulation mortar containing fly ash and slag based on response surface methodology
- Hemp seed oil nanoemulsion with Sapindus saponins as a potential carrier for iron supplement and vitamin D
- A numerical study on thin film flow and heat transfer enhancement for copper nanoparticles dispersed in ethylene glycol
- Research on complex multimodal vibration characteristics of offshore platform
- Applicability of fractal models for characterising pore structure of hybrid basalt–polypropylene fibre-reinforced concrete
- Influence of sodium silicate to precursor ratio on mechanical properties and durability of the metakaolin/fly ash alkali-activated sustainable mortar using manufactured sand
- An experimental study of bending resistance of multi-size PFRC beams
- Characterization, biocompatibility, and optimization of electrospun SF/PCL composite nanofiber films
- Morphological classification method and data-driven estimation of the joint roughness coefficient by consideration of two-order asperity
- Prediction and simulation of mechanical properties of borophene-reinforced epoxy nanocomposites using molecular dynamics and FEA
- Nanoemulsions of essential oils stabilized with saponins exhibiting antibacterial and antioxidative properties
- Fabrication and performance analysis of sustainable municipal solid waste incineration fly ash alkali-activated acoustic barriers
- Electrostatic-spinning construction of HCNTs@Ti3C2T x MXenes hybrid aerogel microspheres for tunable microwave absorption
- Investigation of the mechanical properties, surface quality, and energy efficiency of a fused filament fabrication for PA6
- Experimental study on mechanical properties of coal gangue base geopolymer recycled aggregate concrete reinforced by steel fiber and nano-Al2O3
- Hybrid bio-fiber/bio-ceramic composite materials: Mechanical performance, thermal stability, and morphological analysis
- Experimental study on recycled steel fiber-reinforced concrete under repeated impact
- Effect of rare earth Nd on the microstructural transformation and mechanical properties of 7xxx series aluminum alloys
- Color match evaluation using instrumental method for three single-shade resin composites before and after in-office bleaching
- Exploring temperature-resilient recycled aggregate concrete with waste rubber: An experimental and multi-objective optimization analysis
- Study on aging mechanism of SBS/SBR compound-modified asphalt based on molecular dynamics
- Evolution of the pore structure of pumice aggregate concrete and the effect on compressive strength
- Effect of alkaline treatment time of fibers and microcrystalline cellulose addition on mechanical properties of unsaturated polyester composites reinforced by cantala fibers
- Optimization of eggshell particles to produce eco-friendly green fillers with bamboo reinforcement in organic friction materials
- An effective approach to improve microstructure and tribological properties of cold sprayed Al alloys
- Luminescence and temperature-sensing properties of Li+, Na+, or K+, Tm3+, and Yb3+ co-doped Bi2WO6 phosphors
- Effect of molybdenum tailings aggregate on mechanical properties of engineered cementitious composites and stirrup-confined ECC stub columns
- Experimental study on the seismic performance of short shear walls comprising cold-formed steel and high-strength reinforced concrete with concealed bracing
- Failure criteria and microstructure evolution mechanism of the alkali–silica reaction of concrete
- Mechanical, fracture-deformation, and tribology behavior of fillers-reinforced sisal fiber composites for lightweight automotive applications
- UV aging behavior evolution characterization of HALS-modified asphalt based on micro-morphological features
- Preparation of VO2/graphene/SiC film by water vapor oxidation
- A semi-empirical model for predicting carbonation depth of RAC under two-dimensional conditions
- Comparison of the physical properties of different polyimide nanocomposite films containing organoclays varying in alkyl chain lengths
- Effects of freeze–thaw cycles on micro and meso-structural characteristics and mechanical properties of porous asphalt mixtures
- Flexural performance of a new type of slightly curved arc HRB400 steel bars reinforced one-way concrete slabs
- Alkali-activated binder based on red mud with class F fly ash and ground granulated blast-furnace slag under ambient temperature
- Facile synthesis of g-C3N4 nanosheets for effective degradation of organic pollutants via ball milling
- DEM study on the loading rate effect of marble under different confining pressures
- Conductive and self-cleaning composite membranes from corn husk nanofiber embedded with inorganic fillers (TiO2, CaO, and eggshell) by sol–gel and casting processes for smart membrane applications
- Laser re-melting of modified multimodal Cr3C2–NiCr coatings by HVOF: Effect on the microstructure and anticorrosion properties
- Damage constitutive model of jointed rock mass considering structural features and load effect
- Thermosetting polymer composites: Manufacturing and properties study
- CSG compressive strength prediction based on LSTM and interpretable machine learning
- Axial compression behavior and stress–strain relationship of slurry-wrapping treatment recycled aggregate concrete-filled steel tube short columns
- Space-time evolution characteristics of loaded gas-bearing coal fractures based on industrial μCT
- Dual-biprism-based single-camera high-speed 3D-digital image correlation for deformation measurement on sandwich structures under low velocity impact
- Effects of cold deformation modes on microstructure uniformity and mechanical properties of large 2219 Al–Cu alloy rings
- Basalt fiber as natural reinforcement to improve the performance of ecological grouting slurry for the conservation of earthen sites
- Interaction of micro-fluid structure in a pressure-driven duct flow with a nearby placed current-carrying wire: A numerical investigation
- A simulation modeling methodology considering random multiple shots for shot peening process
- Optimization and characterization of composite modified asphalt with pyrolytic carbon black and chicken feather fiber
- Synthesis, characterization, and application of the novel nanomagnet adsorbent for the removal of Cr(vi) ions
- Multi-perspective structural integrity-based computational investigations on airframe of Gyrodyne-configured multi-rotor UAV through coupled CFD and FEA approaches for various lightweight sandwich composites and alloys
- Influence of PVA fibers on the durability of cementitious composites under the wet–heat–salt coupling environment
- Compressive behavior of BFRP-confined ceramsite concrete: An experimental study and stress–strain model
- Interval models for uncertainty analysis and degradation prediction of the mechanical properties of rubber
- Preparation of PVDF-HFP/CB/Ni nanocomposite films for piezoelectric energy harvesting
- Frost resistance and life prediction of recycled brick aggregate concrete with waste polypropylene fiber
- Synthetic leathers as a possible source of chemicals and odorous substances in indoor environment
- Mechanical properties of seawater volcanic scoria aggregate concrete-filled circular GFRP and stainless steel tubes under axial compression
- Effect of curved anchor impellers on power consumption and hydrodynamic parameters of yield stress fluids (Bingham–Papanastasiou model) in stirred tanks
- All-dielectric tunable zero-refractive index metamaterials based on phase change materials
- Influence of ultrasonication time on the various properties of alkaline-treated mango seed waste filler reinforced PVA biocomposite
- Research on key casting process of high-grade CNC machine tool bed nodular cast iron
- Latest research progress of SiCp/Al composite for electronic packaging
- Special Issue on 3D and 4D Printing of Advanced Functional Materials - Part I
- Molecular dynamics simulation on electrohydrodynamic atomization: Stable dripping mode by pre-load voltage
- Research progress of metal-based additive manufacturing in medical implants