Effect of the axial compression ratio on the seismic behavior of resilient concrete walls with concealed column stirrups
-
Weiguang Yuan
 ,
Qiang Xiao
,
Qiang Xiao

Abstract
The axial compression ratio is one of the important factors affecting the seismic performance of reinforced concrete (RC) walls. Thus, the axial compression ratio is critical in the seismic design of RC walls. In addition to the axial compression ratio, the other significant experimental parameter is the stirrup form of the boundary elements. To study the effect of the axial compression ratio and the stirrup form on the seismic behavior of ductile RC walls reinforced by prestressed concrete strands, four full-scale concrete walls were constructed and subjected to reversed cyclic lateral loading while experiencing constant axial compression, with axial load ratios set at 0.17 and 0.26. The considered stirrup forms of the boundary elements are circular and compound, respectively. All specimens exhibit significant drift-hardening capability with a small residual drift and a small crack width. The ultimate capacity, ductility, stiffness and attenuation process, hysteretic characteristics, energy dissipation capacity, residual deformation, and maximum and residual crack width of the shear walls are compared and analyzed. The experimental results and comparisons between the two groups of shear walls with different axial compression ratios and stirrup forms of concealed columns are presented. The characteristics of the envelope curve are also analyzed, and a simplified bilinear envelope curve model is proposed to better fit the test results.
Nomenclature
-
-
area of tensile reinforcements
-
-
area of compressed steel bar
-
-
area of PC strands in the tension area
-
-
distance between the joint action point of reinforcement in the boundary element and section edge
-
-
compression of concrete in compression zone
-
-
elastic modulus of concrete
- E p
-
-
-
elastic modulus of ordinary reinforcement
-
-
yield strength of ordinary reinforcement
-
-
load values of the positive and reverse peak points at time i, respectively
- G
-
-
-
cross-sectional height
- l
-
height of the wall
- l p
-
height of the plastic hinge region
-
-
- R ef
-
drift ratio caused by bending deformation in the elastic region
- R shear
-
shear deformation
- R slip
-
deformation caused by slip of rebars and PC strands
- T p
-
-
-
tensile force of ordinary reinforcement in tensile area
-
-
compression of ordinary reinforcement in compression area
-
-
tensile strength of longitudinally distributed reinforcements
-
-
compression of longitudinally distributed reinforcements
-
-
section width of walls
-
-
height of the compression zone when the section yields
-
-
displacement values of the positive and reverse peak points at time i, respectively
-
-
value of DTs at height h i on the left and right sides of specimens, respectively
-
-
axial deformation on left and right sides of the specimen at a height of
-
-
curvature of the wall section
- ∆ f
-
bending deformation in the plastic hinge region
-
-
yield strain of longitudinal steel bar in tension zone
-
-
reinforcement ratio of longitudinally distributed reinforcement
-
-
ratio of horizontal reinforcement
1 Introduction
It is effective to use PC strands to make drift-hardening concrete walls because the PC strands can provide several advantages in seismic regions [1]. Reinforced concrete (RC) walls are extensively employed as the primary lateral force-resisting components in high-rise building structures situated in earthquake-prone regions worldwide. Accordingly, the seismic performance of RC walls directly affects the seismic safety of the RC structure [2]. To effectively control the damage of the resilient concrete wall reinforced by PC strands in the edge zones of the wall panel, it is essential to study the resilient concrete wall in depth so that it can be better popularized and applied in practical engineering.
According to previous research results from researchers [3,4,5,6], code for seismic design of buildings [7], and technical specification for concrete structures of tall building [8] related to the design of RC wall structure, there are numerous factors affecting the seismic performance of a shear wall, including the shear span ratio, axial compression ratio, the ratio of the stirrup form of the edge member, the section form of the member, and the longitudinal and horizontal reinforcement ratios [9,10]. Researchers have paid attention to the axial compression ratio because the axial compression ratio has a significant influence on the seismic performance of shear walls. For example, with the increase in the axial compression ratio, the cracking of the concrete wall is restrained, and the ultimate capacity of the shear wall structure is enhanced to a certain extent. However, when the axial compression ratio increases to a certain extent, it leads to a reduction in the ductility of the shear wall, causing the strength and rigidity to obviously degenerate and ultimately yield. Therefore, it is important to determine a reasonable axial compression ratio to control the seismic performance of shear walls. The existing codes and standards also have corresponding regulations on the axial compression ratio. JGJ3-2010 points out that the axial compression ratio of a short-limb shear wall with a seismic grade of one or two and three should not be greater than 0.45, 0.50, and 0.55, respectively, and that the limit value of the axial compression ratio of a short shear wall with a rectangular section should be reduced by 0.1. FEMA273 stipulates that the seismic force will not be effectively resisted when the axial compression ratio of the shear wall is greater than 0.35 [11].
The performance-based seismic design of a building structure requires effective control of the deformation of the structure. Since the edge constraints have a crucial impact on the seismic performance of shear walls, the rational configuration of the form of the stirrup can form the effective restraint of the concrete on the edge of the shear wall so that the shear wall can perform well during an earthquake. From the aspect of structural measures only, both GB50011-2010 and JGJ3-2010 have presented a corresponding regulation on the restraint edge components, such as the reinforcement ratio of the longitudinal reinforcement and stirrup, confinement range, and characteristic value of the stirrup. Figure 1 presents the stirrup forms of the column. As such, the effect of edge components on the seismic performance of shear walls cannot be ignored. However, the relationship between the edge components and the seismic performance of resilient concrete walls has not been widely examined in the literature. In the work of Yuan et al. [1], the residual deformations, maximum crack width, residual crack width, and other indicators were evaluated to assess the recoverable function of shear walls. However, the influence of the axial compression ratio and the form of confinement reinforcement on the seismic behavior of concrete walls has not been investigated. Therefore, this work is committed to studying the impact of two forms of stirrup reinforcement (4 × 3) and one form of circular stirrup reinforcement shown in Figure 1 on the seismic performance of resilient concrete walls under different axial compression ratios for further research. In addition, the influence of the axial compression ratio and the form of boundary elements on the resilience of the walls is also investigated.

Hooping forms of the column. (a) Compound hooping, (b) circular hooping, and (c) spiral hooping.
2 Review of previous studies
Deng et al. [12] conducted quasistatic experimental tests on four RC shear wall specimens with a strength grade of C80, and the axial compression ratios of the two groups were 0.21 and 0.28. The experiment indicated that when the axial compression ratio increased and the number and range of the stirrups of the confining edge of the shear wall were improved, the shear wall could still maintain good ductility, and the deformation ability of the shear wall was better.
To investigate its seismic behavior, Fang et al. [13] conducted quasistatic tests on ten shear wall specimens constructed with steel tube-confined high-strength concrete (HSC). The shear span ratio was 2.44, with axial compression ratios specified at 0.46, 0.5, 0.64, and 0.7. Their experimental findings indicated that shear walls with steel tube-confined HSC exhibited notable initial stiffness, high bearing capacity, ductility, and hysteretic performance. The specimens exhibited complete hysteretic loops, pointing to substantial ductility and efficient energy dissipation, even under the influence of a high axial compression ratio of 0.7. The test results also demonstrated the effective resolution of the brittle behavior associated with the use of HSC in shear walls.
Quasistatic tests of nine RC shear walls with different shear span ratios were carried out under cyclic lateral loading by Li and Li [14]. The axial compression ratios were 0.1, 0.2, and 0.3. By comparing the failure behavior and damage grades of the walls based on the analysis of the test and hysteresis loop, it can be concluded that with the increase in the axial compression ratio, to some extent, the bearing capacity of shear walls will increase if the shear span ratio is the same, but the ductility of these walls will decrease, and the degradation of strength and stiffness will be more serious.
Chen et al. [15] developed a macromodel of static elastic‒plastic analysis for RC shear walls with flexural deformation. They also worked out ill-conditioned equations in the full range static elastic‒plastic analysis program of shear walls, by which the influence of the axial load ratio, the confinement degree of the boundary zone, and the aspect ratio on the seismic behavior of the shear wall was studied. Their study showed that the influence of mechanical properties and the axial compression ratio of the shear wall with or without constraints was the same. When the axial compression ratio was small, the force was controlled by the limit point. In contrast, when the axial compression ratio was high, the limit point of the ultimate concrete compressive strain was controlled. The bearing capacity increased with the increase in the axial compression ratio, but it was not obvious when the axial compression ratio was too large.
Lefas et al. [16] carried out tests on 13 large-scale wall models. The aim of the tests was to investigate the effect of the axial load on the wall behavior. The obtained results indicated that the axial compression ratio had a great influence on the ductility. When the axial compression ratio was increased, the ductility decreased. When large compression was applied or when the axial compression ratio reached more than 0.25, the ductility decreased greatly.
Farvashany et al. [17] built seven large-scale HSC shear wall specimens loaded to failure under in-plane constant axial load and increasing horizontal loads. The axial compression ratio varied from 0.043 to 0.216. Liang et al. [18] proposed that a high-strength stirrup was used to improve the deformation capacity of the shear wall at the end of the shear wall, and four shear walls with rectangular sections were tested. The axial compression ratio varied from 0.21 to 0.28. The above experimental results showed that the deformation capacity of the shear wall decreased with the increase in the axial compression ratio. The horizontal load-bearing capacity of the shear wall cannot increase by increasing the horizontally distributed tendons, but it can increase its ultimate deformability.
Park et al. [19] conducted a nonlinear numerical analysis aimed at assessing the moment–curvature relationship and deformability of walls primarily influenced by flexure. These walls featured partially confined end zones, and the study considered the impact of the axial compression ratio. The findings revealed that introducing lateral confinement in the end zones of the cross-section enhanced the wall’s deformability. This improvement was attributed to the reduction in the depth of the compression zone and the increased deformability of the confined concrete. Notably, the deformability of the wall experienced a significant boost since the compressive strength of the confined end zones approached the applied axial force.
Liu et al. [20] employed the finite element analysis program to conduct a nonlinear analysis of a precast shear wall subjected to one-way loading by ANSYS software. The focus was on investigating the influence of the axial compression ratio on both the bearing capacity and deformability of the precast shear wall. The finite element analysis results indicated that within the axial compression ratio range of 0.2–0.4, an increase in this ratio correlated with heightened bearing capacity and stiffness of the specimen. Conversely, deformability and ductility exhibited a decreasing trend as the axial compression ratio increased.
Wu et al. [21] conducted pseudo-static tests on three instances of non-template insulation shear walls, each with varying axial compression ratios (0, 0.1, and 0.2), to explore their seismic and cooperative performance. The findings revealed that as the axial compression ratio increased, the prefabricated concrete template exhibited a gradual rise in cracking load, a downward shift in the position of horizontal cracks, increased ultimate bearing capacity and stiffness, and a decrease in ductility.
Three walls, unbonded, posttensioned (PTT), and precast concrete shear walls, were fabricated by Erkmen and Schultz [22]. Apart from the initial tendon posttensioning stress, the influence of the net vertical compressive force arising from both the wall’s self-weight and external gravity loads (specifically, 3 and 48 kips for the PTT specimen) was examined using the model designed for the PTT specimen. Three different levels of external vertical loads were taken into account, with the axial vertical load magnitude being the sole variable. The projected responses of the wall suggest that a reduced vertical load did not compromise the self-centering ability of the wall. However, it did lead to a modest decrease in lateral load capacity and energy dissipation during cyclic loading.
Bai and Liang [4] studied the relationships among the ductility ratio, axial load ratio, and the characteristic value of the stirrup content for concrete structural walls. The results showed that increasing the boundary confinement ratio of the walls can raise the allowable axial load ratio. Finally, the allowable axial load ratio was proposed with various confinement ratios, which satisfied a certain ductility demand.
Based on the review of the abovementioned studies, it is clear that the axial compression ratio is one of the important factors that affects the seismic performance of RC walls and thus is an important part of the seismic design of RC walls. In addition to the axial compression ratio, the boundary elements of RC walls are also important factors. To study new resilient concrete walls reinforced by PC strands, this study also investigates the influence of the axial compression ratio and the form of boundary elements on the resilience of the walls.
3 Experimental program
3.1 Materials and concrete walls
The concrete used to fabricate the tested walls was mixed using Portland cement and coarse aggregates with a maximum diameter of 20 mm. The compressive strength of the concrete was determined using three concrete prisms (150 mm × 150 mm × 300 mm) cured under the same environmental conditions as the walls according to the standard test methods for concrete physical and mechanical properties [23]. The compressive strength of the concrete on the 28th day was approximately 42.3 MPa. Based on the standard for test methods of the physical and mechanical properties of concrete [23], the measured elastic modulus was 30,800 MPa, as shown in Table 1.
Outlines of the test walls
| Notation |
|
E c (MPa) | P/(A g f c) | Form of hoop and stirrup rate in the edge zone | Reinforcements in the wall panel | Tensile rebars in the edge zone | Stirrup ratio in the edge zone | ||
|---|---|---|---|---|---|---|---|---|---|
| p h (%) | p v (%) | Grade | p t (%) |
|
|||||
| SSW-N17 | 42.3 | 30,800 | 0.17 | Compound | 0.71 | 0.71 | PC15.2 | 0.33 | 3.01 |
| SSW-N26 | 0.26 | ||||||||
| CSW-N17 | 0.17 | Circular | 1.57 | ||||||
| CSW-N26 | 0.26 | ||||||||
Note: p t = the steel ratio of concentrated PC strands (A st/(0.95t w l w)).
Table 2 presents the mechanical properties of the utilized steels. Figure 2 displays the tensile stress‒strain curves of the steels. As shown in Figure 2, the PC15.2 strand exhibits an apparent yield plateau in the stress‒strain relations, the yielding strength of which was determined to be a 0.2% offset yielding strength.
Tensile properties of the steels
| Notation | Location | Yield strength f y (MPa) | Yield strain ε y (%) | Tensile strength f su (MPa) | Elongation (%) | Young’s modulus E s (MPa) |
|---|---|---|---|---|---|---|
| C6 | Stirrup in edge zone | 392 | 0.19 | 534.5 | 32.0 | 2.04 × 10⁵ |
| C8 | Reinforcement in wall panel | 420 | 0.21 | 634.2 | 21.4 | 2.01 × 10⁵ |
| PC15.2 | Tensile rebar in edge zone | 1,754a) | 0.89 | 1887.8 | 4.3 | 1.96 × 10⁵ |
Note: a) 0.2% offset yield strength.

Stress–strain curves of the used steels. (a) HRB400-Φ6, (b) HRB400-Φ8, and (c) PC15.2.
As depicted in Figure 3, the terminations of every PC strand in all test walls were secured to steel plates with a thickness of 10 mm. One end of the duct (approximately 90 mm long) housing each PC strand and the other bolting was clamped together by nuts to counteract the adverse impact of early slippage of PC strands on the seismic performance of the walls. Figure 3 illustrates the anchorage detailing of the PC strands.

Detailing of the anchorage for the PC strands (in mm). (a) End plate in the wall, (b) end plate, and (c) details of anchorage.
Four full-scale concrete walls were constructed and subjected to quasistatic reversed cyclic loading under constant compression in the testing process. The tested walls had identical geometries, and the dimensions of the wall panels were 2,360 mm in height, 1,280 mm in length, and 200 mm in width. A loading beam was located at the top of the wall panels, as shown in Figure 4. The shear span ratio (h w/l w) was 2.0, where h w (2,560 mm) is the height from the base of the wall panel to the point of application of the lateral force and l w is the lateral length of the wall panel. More details can be found in the study by Yuan et al. [1].
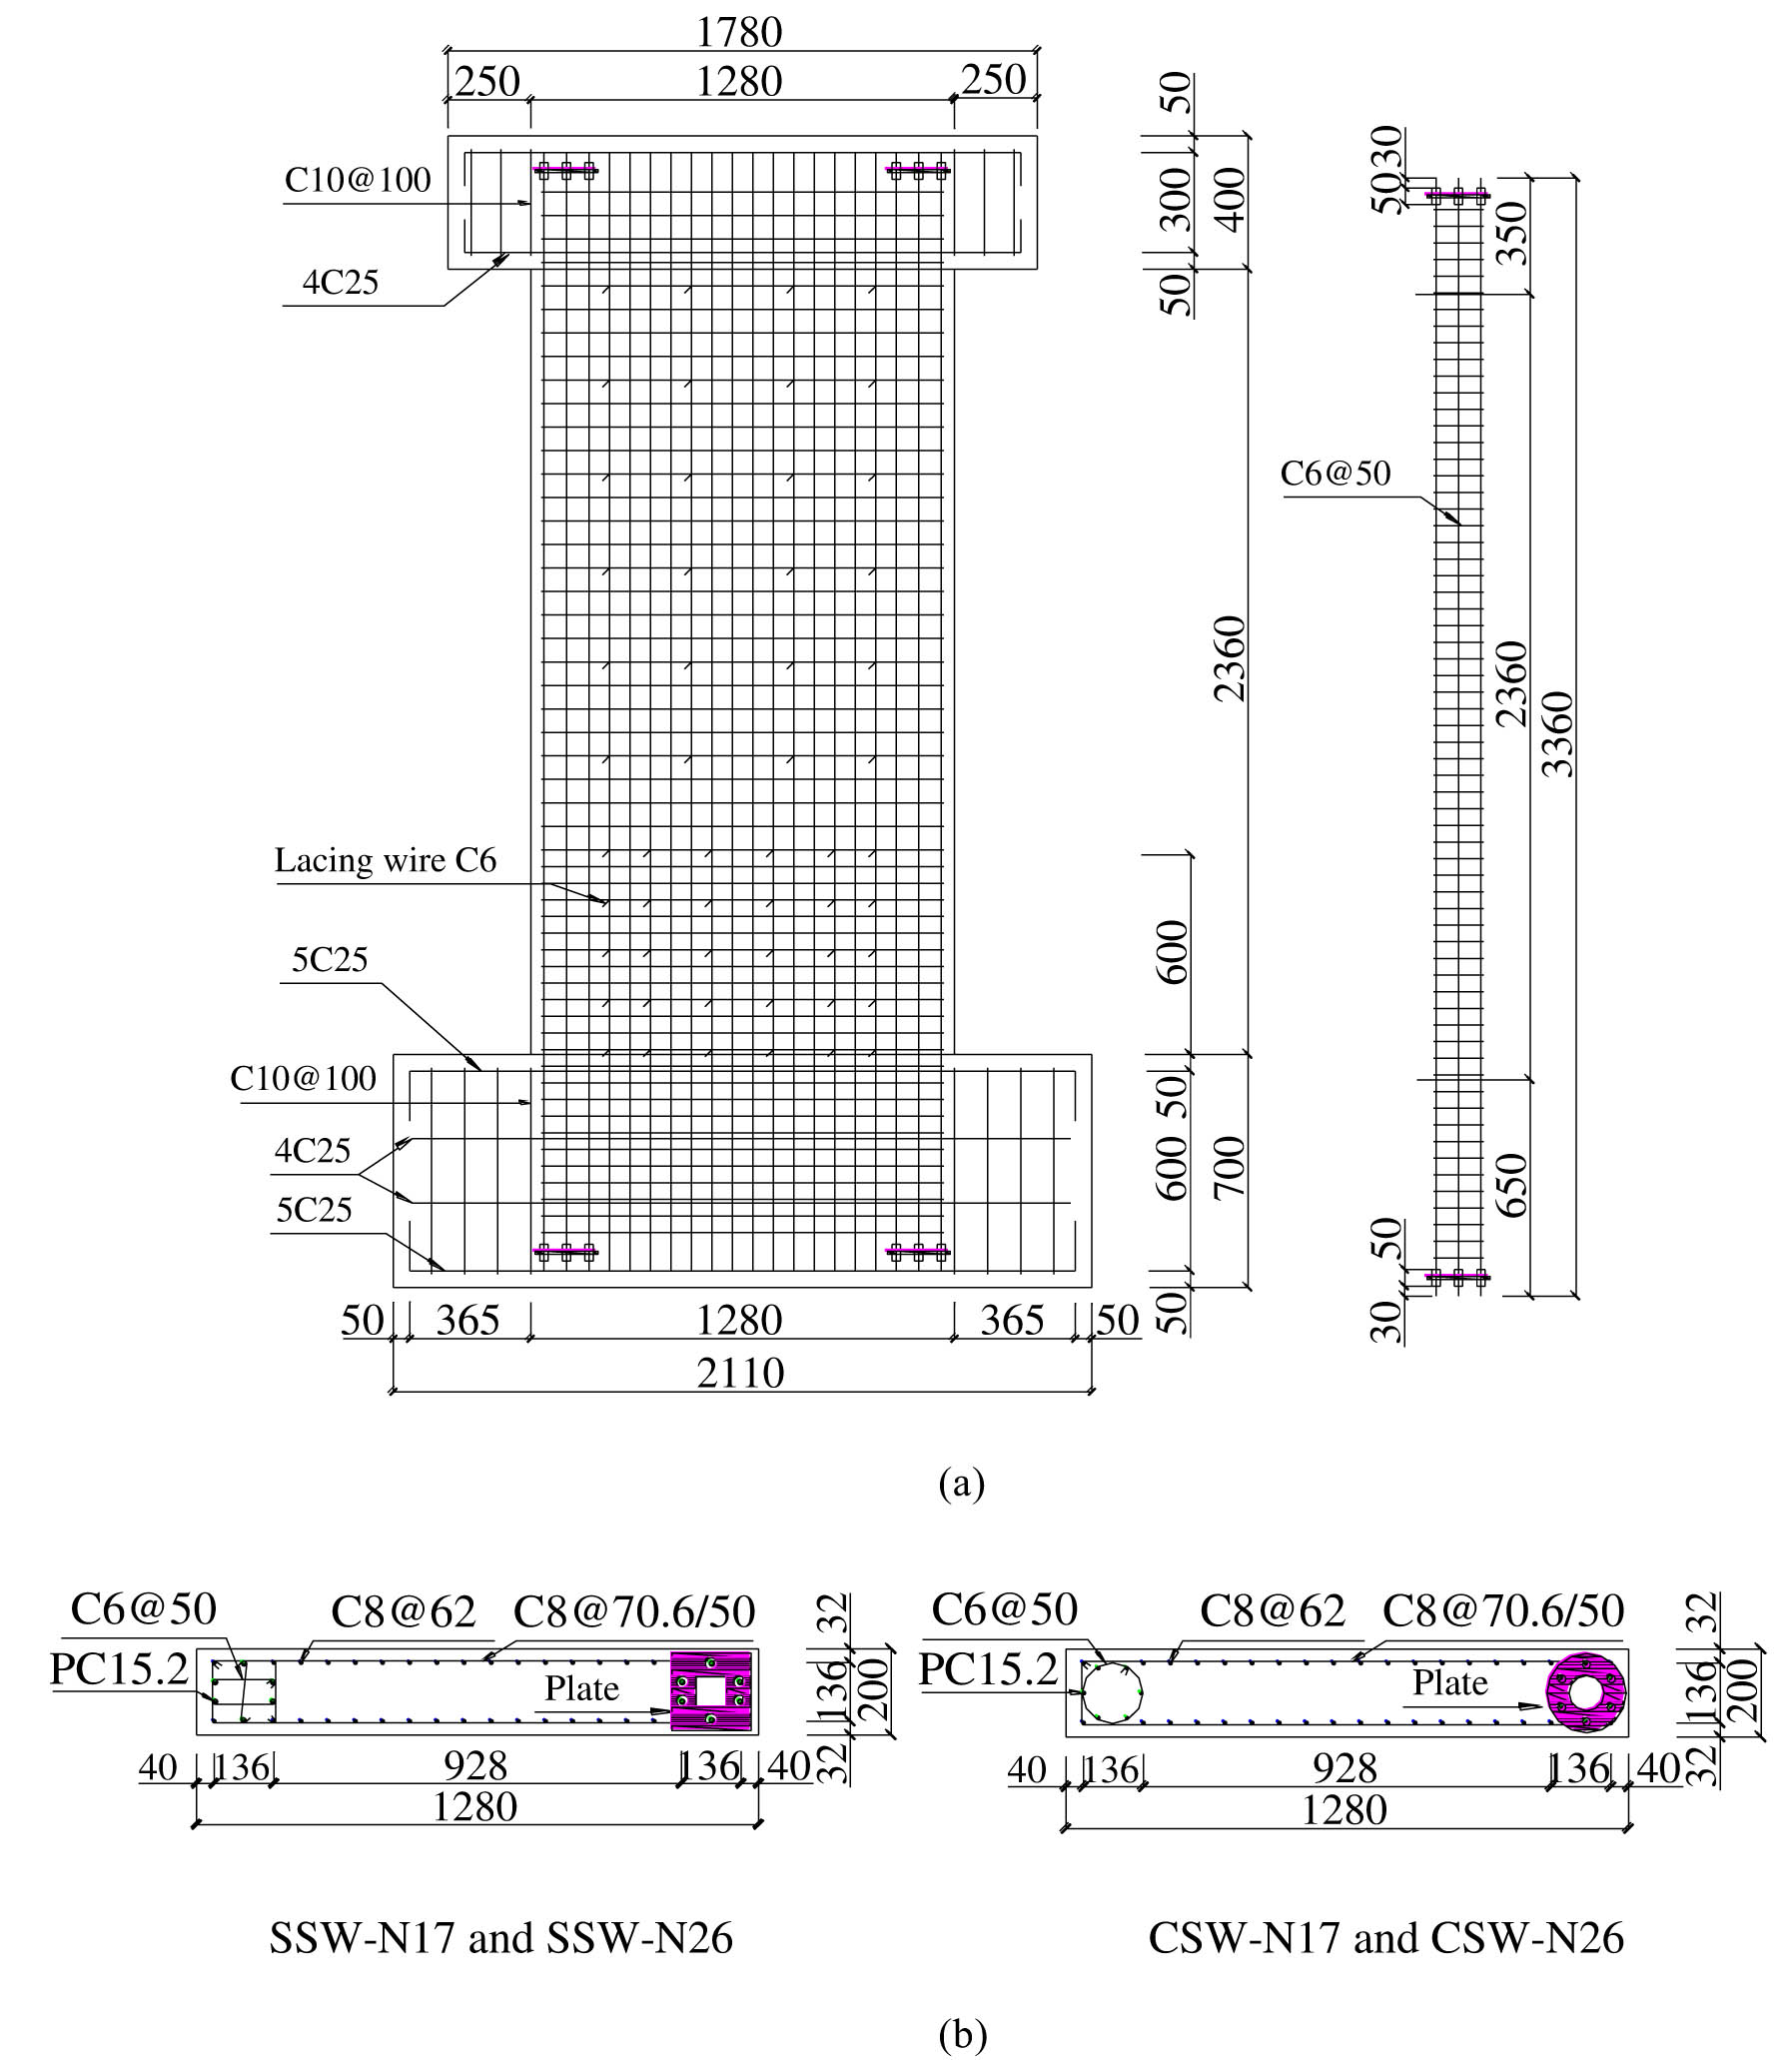
Reinforcement details and dimensions of test walls (in mm). (a) Elevation and (b) cross section of wall panel.
According to the stirrup forms of the boundary elements, the specimens were divided into two groups, with two specimens in each group. A composite stirrup was used for the first group of specimens SSW-N17 and SSW-N26, and the experimental axial compression ratios were 0.17 and 0.26, respectively. The experimental axial compression ratio was selected as 0.17 because this ratio approximately corresponded to the gravity load at the base of a 15-story wall, while 0.26 was chosen since it represented the upper bound of the short-pier concrete shear wall. The stirrup form of the second group of specimens CSW-N17 and CSW-N26 was a circular stirrup, and the experimental axial compression ratios were also 0.17 and 0.26, respectively. Although the reinforcement ratios of the two stirrup reinforcement types are different, under the action of low and high axial load ratios, the specimens with different stirrup reinforcement types show similar performances at the same axial load ratio. Therefore, it can be inferred that if the same performance requirements are adopted, specimens with circular stirrup reinforcement require less steel compared to specimens with composite stirrup reinforcement, making it more economical. The axial load ratio is defined as P/(A g f c), where P is the applied compressive force and A g is the sectional area of the wall panel. Table 1 shows the actual f c and η at the stage of testing.
Each wall panel included Class III (Grade 400) deformed longitudinal and transverse reinforcement, represented as C8, with the numeral 8 indicating the nominal diameter of the reinforcement. The reinforcement details are illustrated in Figure 2. As can be observed from Table 1 and Figure 2, the reinforcement ratios of the longitudinal and transverse C8 rebars (p
v and p
h) were all approximately 0.71%, and the reinforcement ratios of the transverse C8 rebars at the plastic hinge region were 1.0%. The tensile rebars of all specimens in the edge zones consisted of six PC strands (PC15.2) of deformed rebars, giving a tensile steel ratio (p
t) of 0.33%. The PC15.2 strand used was composed of seven high-strength 5 mm diameter wires and had a nominal diameter of 15.2 mm [24]. The boundary elements in the form of compound and circular stirrups were confined by deformed C6 (Class III) rebars with a spacing of 50 mm, which were approximately six times the nominal diameter of the C12 rebar, avoiding the premature buckling of the longitudinal steels in the edge zones [25]. The concealed columns of the two groups of specimens included composite and circular stirrups. The same distance of stirrups caused the volumetric stirrup ratios (
3.2 Test apparatus and instrumentation
Figure 5 illustrates the experimental setup and instrumentation for the tests. The lower loading (foundation) beams, measuring 700 mm in height, 2,110 mm in length, and 800 mm in width, were securely anchored to the strong floor of the laboratory. To prevent both longitudinal (in-plane) and transverse (out-of-plane) movement, four hydraulic jacks and two steel beams provided restraint.

Loading apparatus.
Cyclic lateral loading was administered using a 2,500 kN capacity machine translation system (MTS) servo-controlled hydraulic actuator. This actuator was securely fastened to the laboratory strong reaction wall, positioned at a height of 2,560 mm from the top surface of the foundation beam. For constant axial compressive force, two hydraulic jacks with capacities of 2,000 kN were employed on the top of the loading beam (Figure 5).
Control over the reversed cyclic lateral loading was facilitated by the drift (R) of the wall, where R was determined by dividing the tip lateral displacement by the shear span (2,560 mm). The targeted loading program, outlined in Figure 6, is noteworthy. It is important to mention that the displacement in Figure 6 represents that of the MTS rather than the true tip displacement of the wall. Before reaching a drift of 2.0%, two full cycles were applied at each drift level. Subsequent cycles comprised a single cycle at drift levels of 2.5, 3.0, 3.5, and 4.0%.

Loading program.
Figure 7 provides an overview of the positions of the displacement transducers (DTs, used for measuring lateral and vertical displacements) and the strain gauges. The plastic hinge zone of the shear wall was primarily considered to be within a height range of approximately one time the wall width. The axial deformation was mainly concentrated within the plastic hinge zone. Therefore, displacement meters were arranged within a height range of 500 mm, and three measurement points were selected. These measurement points were evenly spaced along the wall height to obtain reliable data. The lateral displacement at the tip was monitored by a single DT labeled as “DH-0” in Figure 7. Furthermore, lateral displacements at varying heights (600, 1,200, 1,600, and 2,000 mm from the top of the foundation beam) were gauged using four pairs of DTs labeled as “DH-1” through “DH-8”. To evaluate axial deformation in three distinct regions featuring gauge lengths of 400, 800, and 1,280 mm, three pairs of DTs labeled as “DV1” through “DV6” were employed.

Location of DTs.
Strain gauges were strategically positioned on the C12 rebar, PC strand, longitudinal and transverse C8 bar within the wall panel, and C6 stirrup in the edge zones. The locations of these strain gauges are depicted in Figure 8.

Location of strain gauges.
4 Experimental results and discussion
4.1 Crack behaviors of concrete walls
Figure 9 shows the crack development of all test walls, and it can be observed that the cracks occurred at key drifts of 0.2, 0.4, 0.8, 2.0%, and at the final stage. For walls SSW-N17 and SSW-N26, flexural cracks first appeared at a height of approximately 40 mm from the upper surface of the base beam in the pull direction, and the drift ratio was approximately 0.4%. For walls CSW-N17 and CSW-N26, flexural cracks first appeared in the pull direction, and the drift ratio was approximately 0.2%. Due to the reinforcing ratio of the boundary elements being approximately twice as high in specimen SSW than in specimen CSW, the core concrete of the boundary elements in specimen SSW had a better confinement and higher strength. Therefore, the first flexural crack in specimen SSW appeared later than in specimen CSW. With the increase in lateral displacement, these initial flexural cracks expanded, triggering flexure-shear cracks and spalling of the cover concrete until the failure of the specimens.
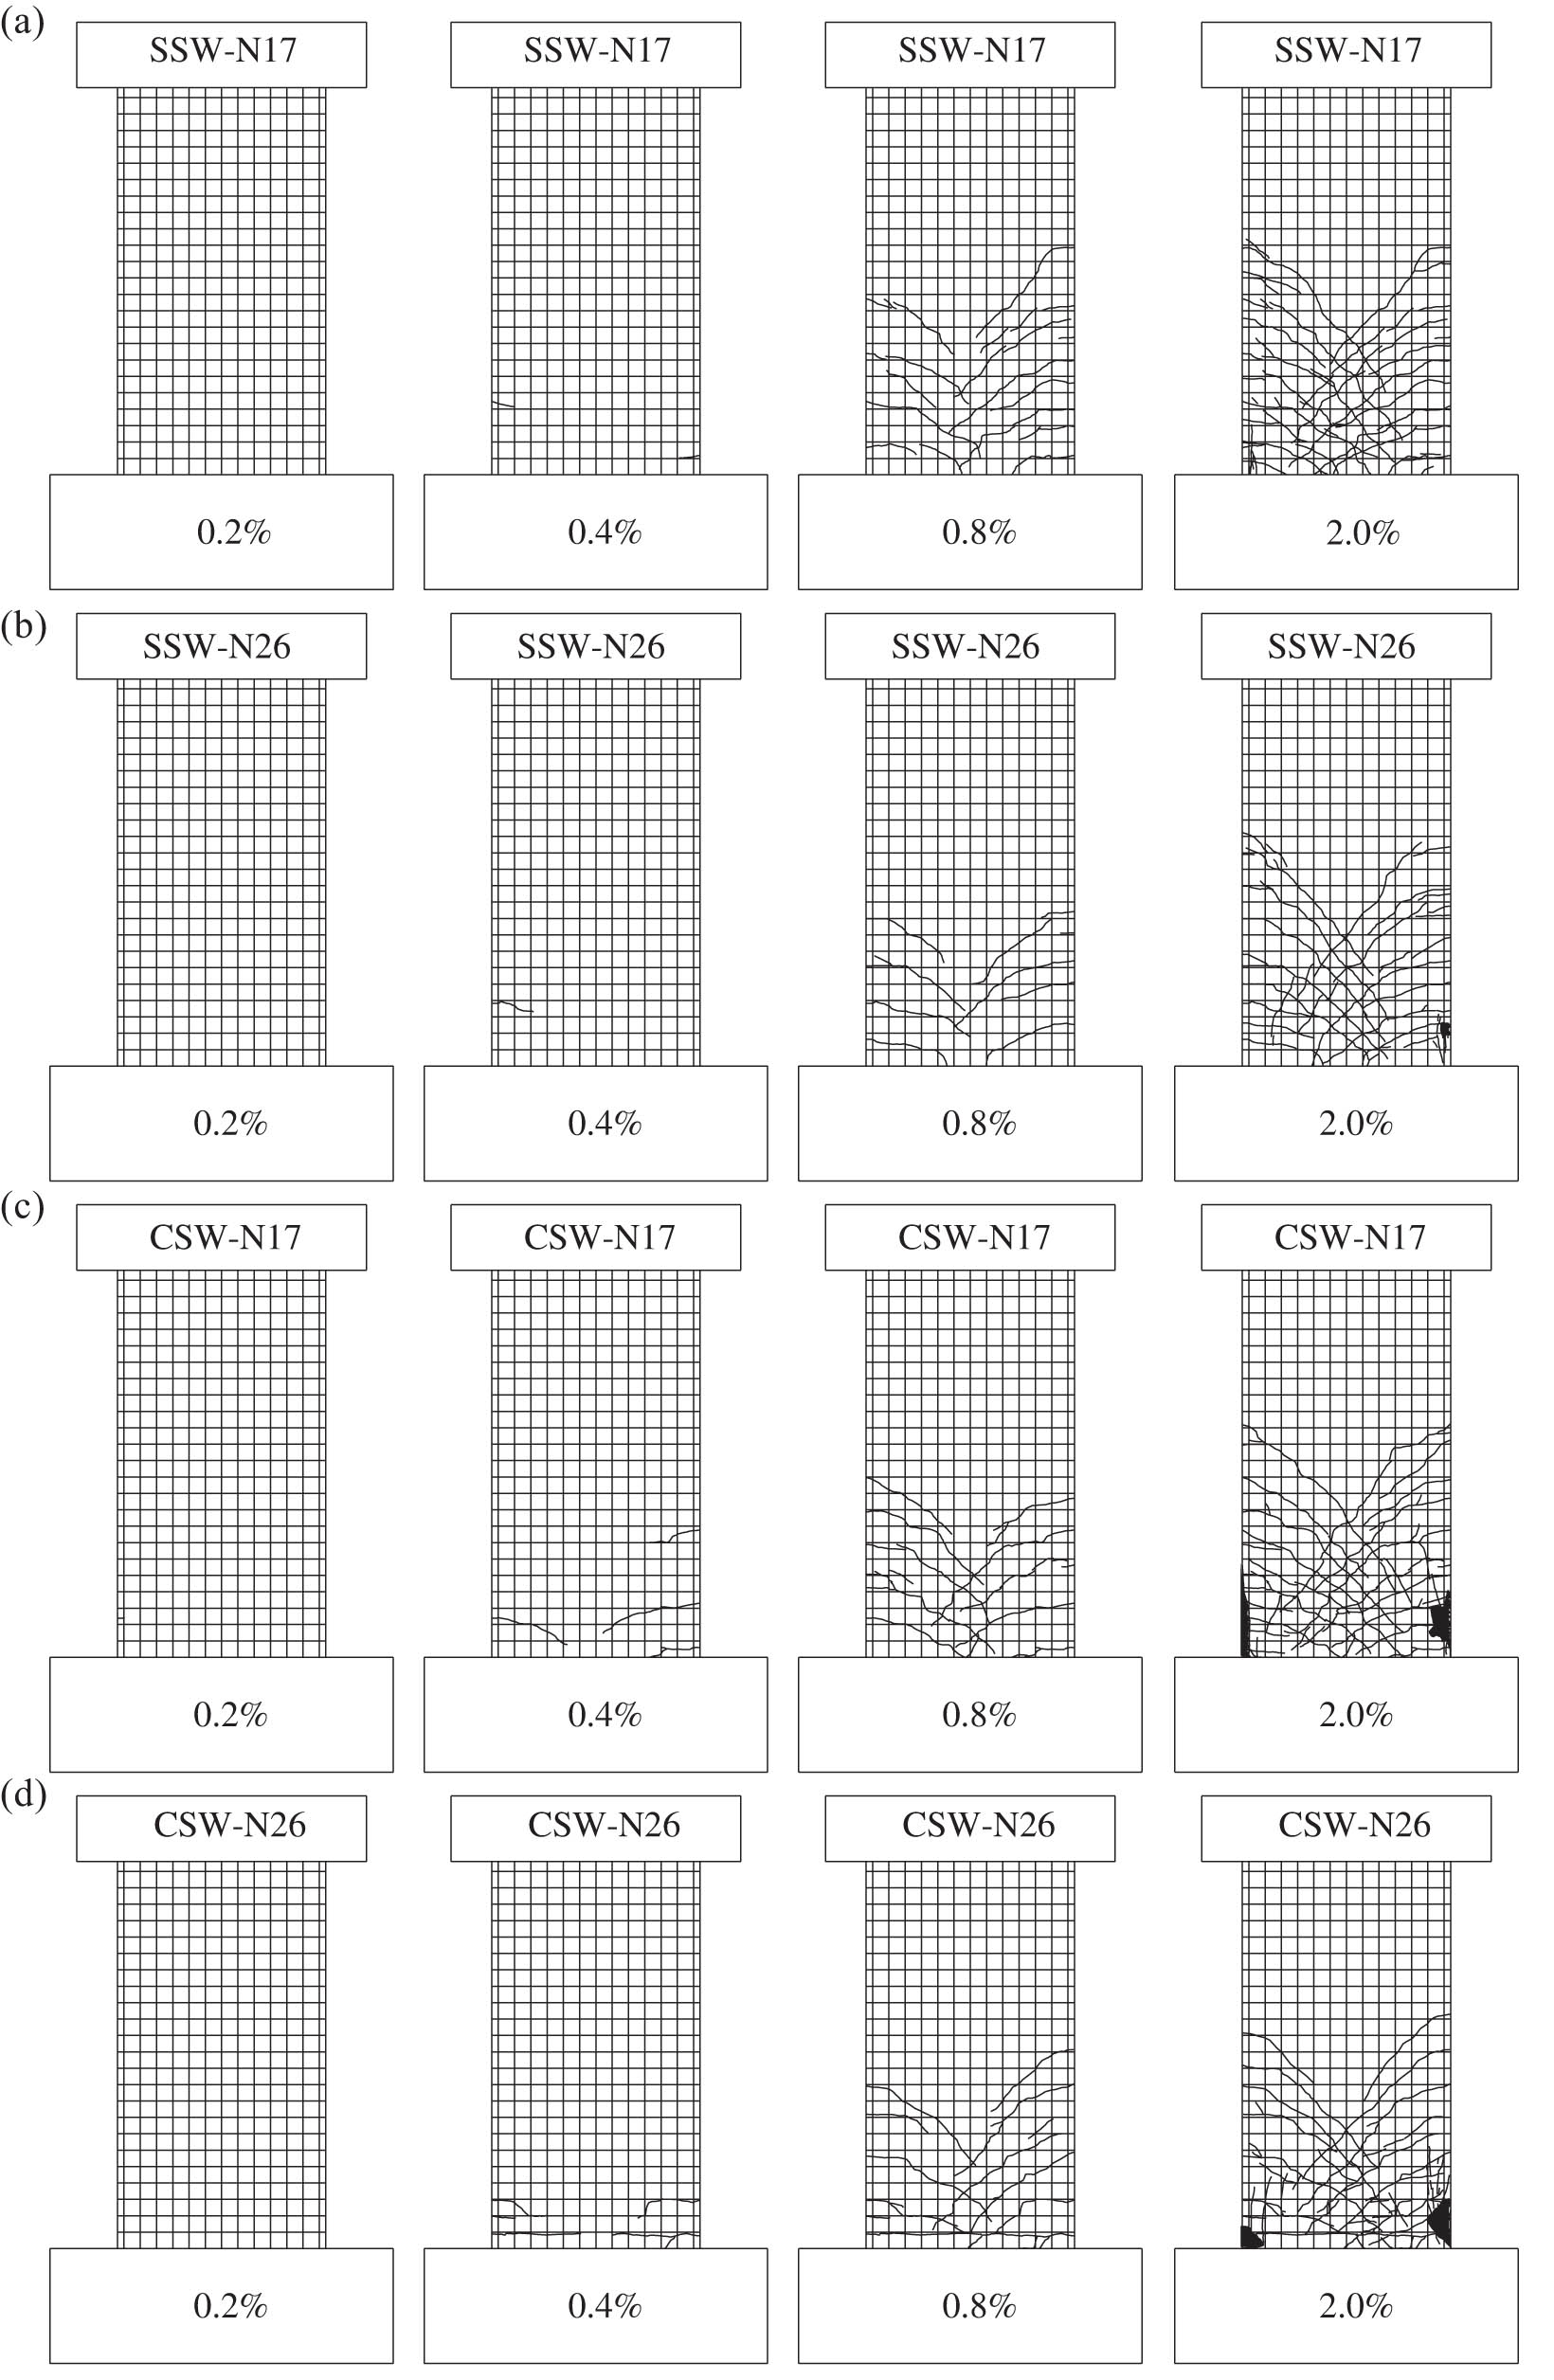
The cracks development of the shear walls: (a) SSW-N17; (b) SSW-N26; (c) CSW-N17; and (d) CSW-N26.
In contrast to the crack development of all test walls in Figure 9, the higher the axial compression ratio was, the smaller the drift ratio where spalling of the concrete shell commenced, and the lower the height of the crack development along the height of the wall from the top surface of the foundation beam, the thinner the distribution of the cracks and the greater the final damage area of the specimen. From the stirrup forms of concealed columns in the edge zones of the specimens, the crack distribution of specimens SSW-N17 (Figure 9a) and SSW-N26 (Figure 9b) was denser than that of specimens CSW-N17 (Figure 9c) and CSW-N26 (Figure 9d), and the final damage area of specimens CSW-N17 and CSW-N26 was greater than that of specimens SSW-N17 and SSW-N26.
4.2 Seismic behaviors of concrete walls
Figure 10 displays the lateral load-drift responses of all test walls, accompanied by photographs capturing the condition of the wall toe at the conclusion of the testing. Table 3 provides a concise summary of the primary test results, including the calculated ultimate strengths. It is important to highlight that the drift depicted in each graph of Figure 10 was derived by dividing the measured actual tip lateral displacement, as recorded by the “DH-0” DT, by the shear span. This drift measurement may not align precisely with the targeted drift values illustrated in Figure 7.

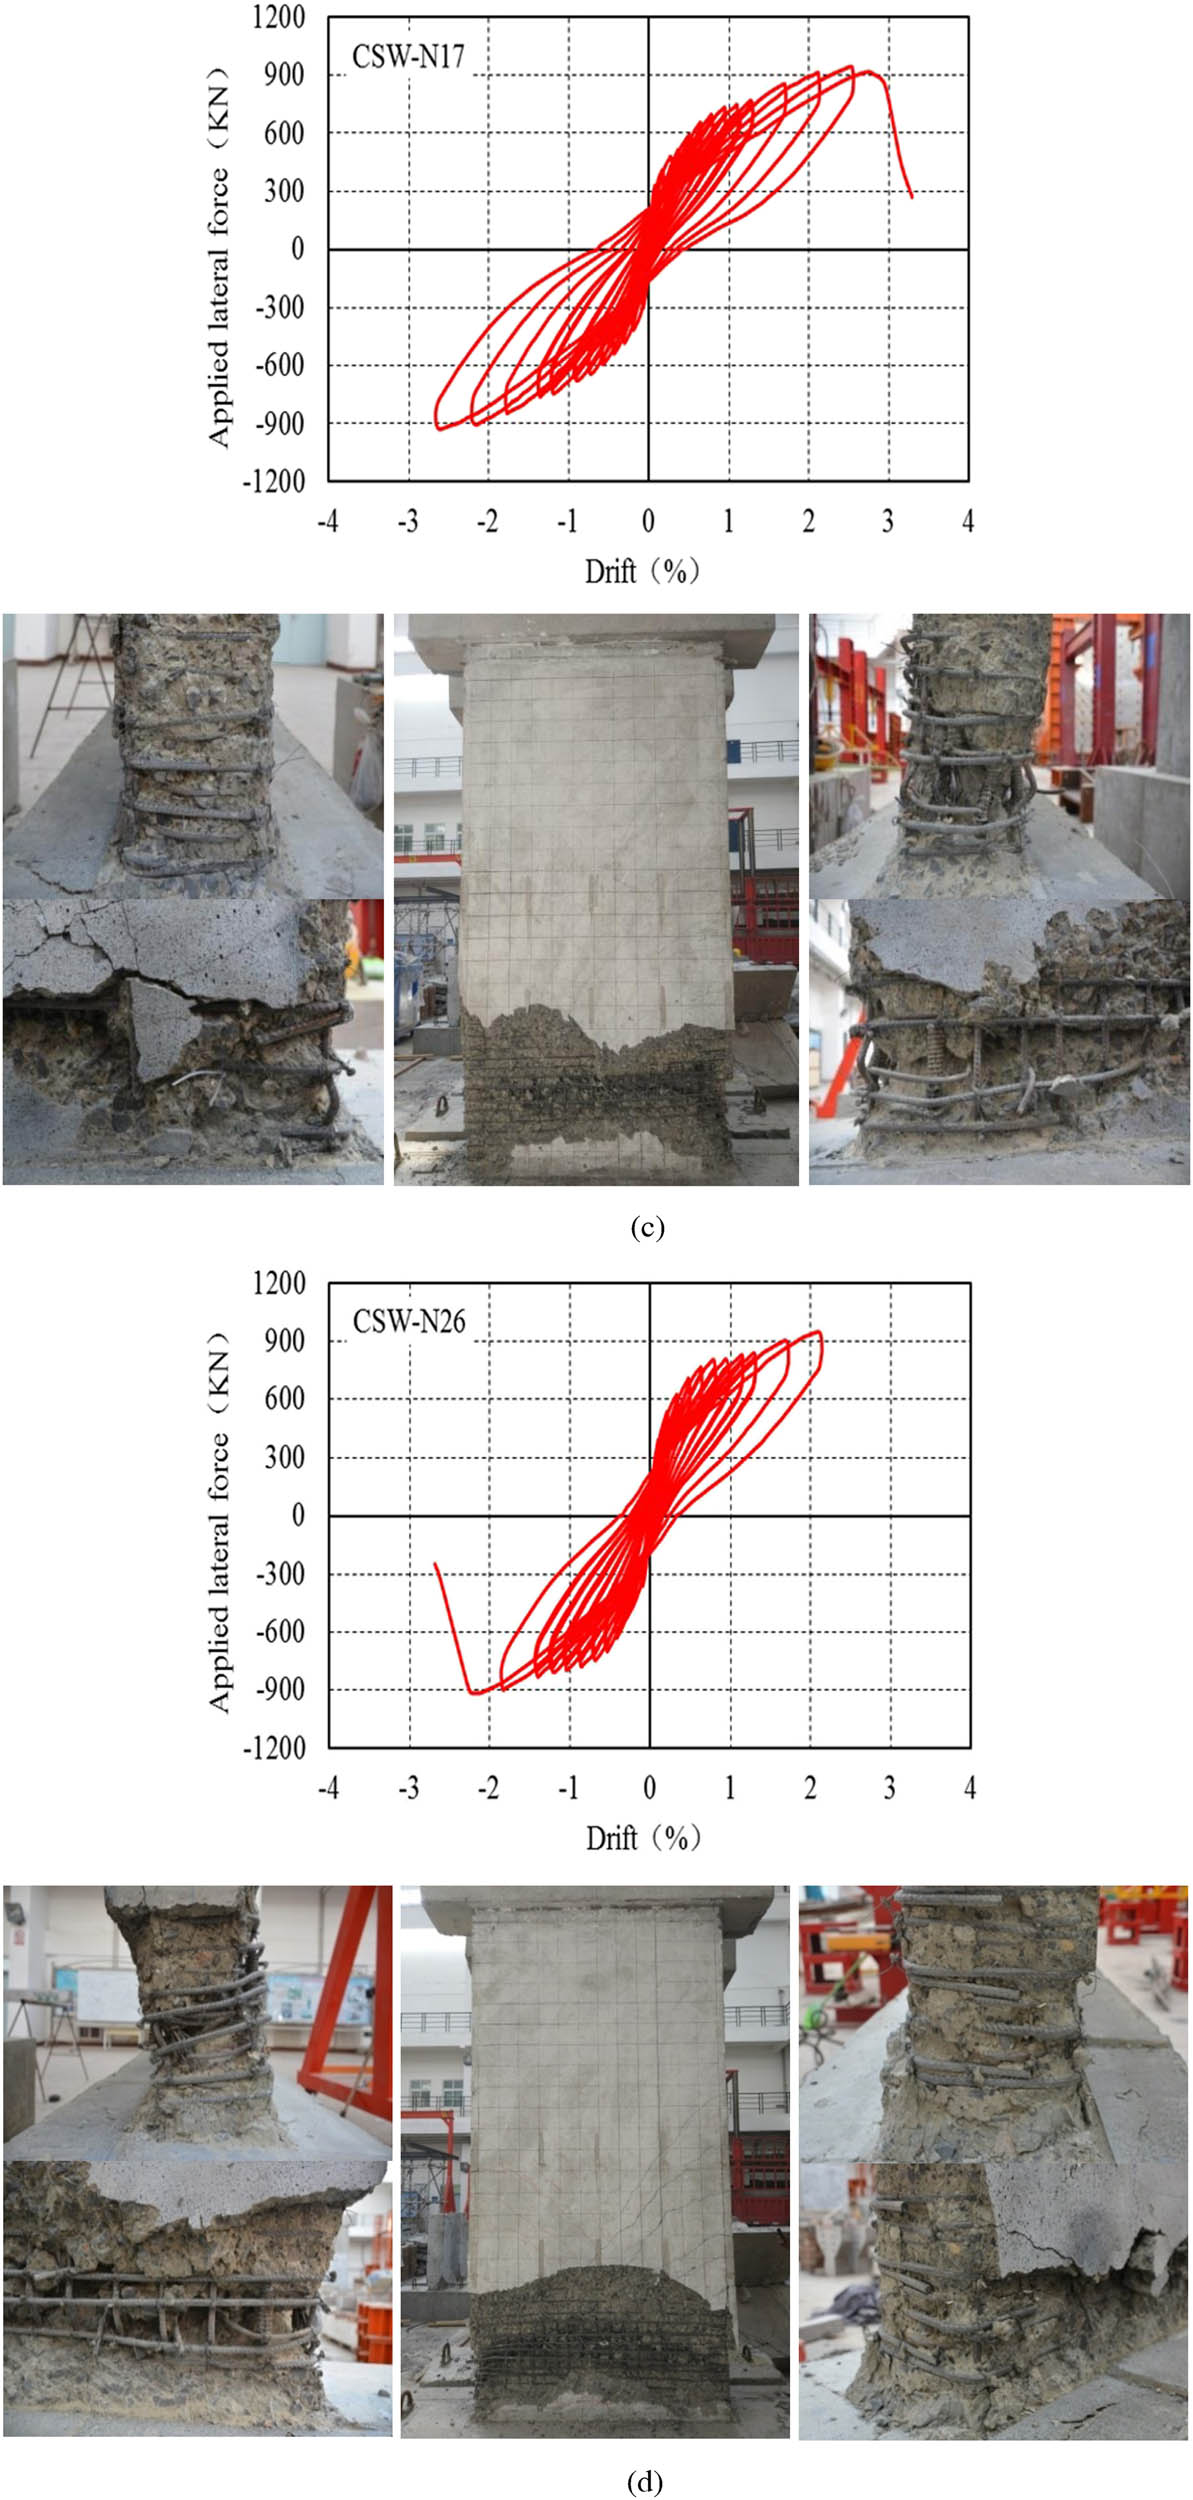
Lateral force-drift responses of test walls with photos of wall toe taken after testing. (a) SSW-N17, (b) SSW-N26, (c) CSW-N17, (d) CSW-N26.
Primary measured results
| Notation | Measured results | |||||
|---|---|---|---|---|---|---|
|
|
|
|
|
|
|
|
| SSW-N17 | 981 | 2.51 | −1,007 | −3.07 | 994 | 2.79 |
| SSW-N26 | 1,018 | 2.36 | −1,019 | −2.40 | 1,018 | 2.38 |
| CSW-N17 | 945 | 2.54 | −927 | −2.67 | 936 | 2.61 |
| CSW-N26 | 949 | 2.13 | −914 | −2.19 | 932 | 2.16 |
All specimens exhibited apparent drift-hardening behavior up to a large deformation. The loading of the test was stopped immediately when the lateral displacements of specimens SSW-N17 and SSW-N26 reached 2.79 and 2.38% (average value of push and pull directions), respectively, as they were four times the upper limit (1/120) recommended in the current JGJ3-2010 standard. From Figure 10(a) and (b), the final failure states of specimens SSW-N17 and SSW-N26 were only spalling of concrete at the wall toe from the surface of the specimens. It was also observed that the failure mode of the shear wall specimen was bending failure. The cracks occurred when the lateral displacements of specimens CSW-N17 and CSW-N26 reached 2.54% in the pushing direction and 2.19% in the pulling direction, respectively. As shown in Figure 10(c) and (d), specimens CSW-N17 and CSW-N26 eventually failed due to buckling of the longitudinal C12 rebars in the edge zones, loosening of the PC15.2 strands, and breaking of the stirrups.
SSW-N17 presented a higher drift-hardening capability than that of SSW-N26 up to a drift of 2.79% and an average maximum lateral capacity approximately 17.2% higher (in both push and pull directions) than the comparable wall SSW-N17. In comparison to the similar wall CSW-N26, wall CSW-N17 displayed drift-hardening characteristics up to a 2.61% drift and exhibited an approximately 19.2% higher maximum lateral capacity. This enhanced performance can be attributed to the relatively elevated axial compression, reducing the buckling resistance of the longitudinal rebars and PC strands by deteriorating the constraint of the surrounding concrete, leading to buckling of the longitudinal rebars and the loosening of the PC strands.
SSW-N17 presented a marginally higher drift-hardening capability than CSW-N17 and an approximately 6.9% higher maximum lateral capacity than the comparable wall CSW-N17. By comparing SSW-N26 and CSW-N26, wall SSW-N26 exhibited a drift-hardening capability up to 2.38% drift and exhibited approximately 10.2% higher maximum lateral capacity. This was due to the influence of the stirrup form of the concealed columns. The compound stirrup can improve the ductility of the structure more effectively than the circular stirrup, delaying the buckling of the longitudinal rebar effectively, mitigating the deterioration of the constraint of PC strands by the surrounding concrete, and delaying the buckling of PC strands.
In addition to the noted drift-hardening behavior, the residual drift ratios in these specimens were limited to about one-tenth of the corresponding peak drift ratios until R reached 2%. Remarkably, clear self-centering behavior is evident in Figure 10.
To better see the influence of the type of tensile rebar in the edge zones, Figure 11 compares the envelope curves of lateral loading-drift relationships for four pairs of comparable walls, walls SSW-N17 and SSW-N26, walls CSW-N17 and CSW-N26, walls SSW-N17 and CSW-N17, and walls SSW-N26 and CSW-N26. It can be observed from Figure 11 that the effect of the axial compression level and the stirrup form of the concealed columns is significant. For instance, as the axial compression ratio increases, both the initial stiffness and early lateral resistance also increase. In specimens with a shear span ratio of 2.0%, elevated axial compression did not lead to a decline in lateral resistance at significant deformations. This is due to the stable enhancement of lateral resistance provided by the PC strands, compensating not only for the reduction caused by the P-Δ effect but also for the spalling of the cover concrete.

Comparison of the measured envelope curves.
Until the drift was between 1.0 and 1.5%, there was no significant difference between the lateral resistances for walls SSW-N17 and CSW-N17 or walls SSW-N26 and CSW-N26. With the continuous increase in the drift, the lateral resistances of walls SSW-N17 and SSW-N26 continued to increase further than those of walls CSW-N17 and CSW-N26.
The above observations imply that increasing the axial compression ratio reduced the ductility and increased the bearing capacity of the specimens. The effect of the composite stirrup had the same characteristics as the effect of the circular stirrup on the axial compression ratio.
Figure 12 shows the stiffness degradation curve of all test walls. The stiffness of the component (

Stiffness degradation curves.
It is obvious that there was no significant difference regarding the effect of the stirrup form of the concealed columns. However, with the increase in the axial compression ratio, the degenerative stiffness of the specimens tended to be severe, and with the increase in the lateral displacement, the relative stiffness first increased and then decreased. From the yielding to the final failure of the specimens, the stiffness degradation was relatively gentle, and the residual stiffness of the specimens was approximately 10% of the initial stiffness.
Figure 13 illustrates the steel strains of the PC strands, measured by the strain gauges positioned at the initial tensile face of the wall section near the bottom (refer to Figure 8). The horizontal dotted lines overlaid in Figure 13 depict the yield strains of the PC strands. It is evident from Figure 13 that the PC strands did not undergo yielding until a drift of 2.5%. The steel strain of the PC strand located on the compression side was much smaller than the strain on the tensile side, implying that the PC strand cannot be compressed.

Measured steel strains of PC strand. (a) SSW-17, (b) SSW-26, (c) CSW-17, and (d) CSW-26.
It can be observed from Figure 14 that the longitudinal distribution of the strain of PC strands in the concealed column exhibited bond slip. This was attributed to the weakness of the bond connection between the PC strands and concrete. Therefore, the longitudinal distribution of strain in the PC strands tended to be more uniform along the wall. The form of the stirrup of the concealed column and the axial compression ratio only marginally affected the distribution.

The distributions of measured strains of PC strands. (a) SSW-17, (b) SSW-26, (c) CSW-17, and (d) CSW-26.
Figure 15 illustrates the lateral displacement profile across the height of the wall at various designated drifts in the push direction. The drift values indicated in Figure 15 correspond to the intended drifts in Figure 5 and do not align with the actual drifts depicted in Figures 10–13. The lateral displacement at each height represents the average of measurements from two DTs (Figure 7). As the drift increased, the lateral displacement exhibited a smooth and continuous increment along the wall height for all walls.
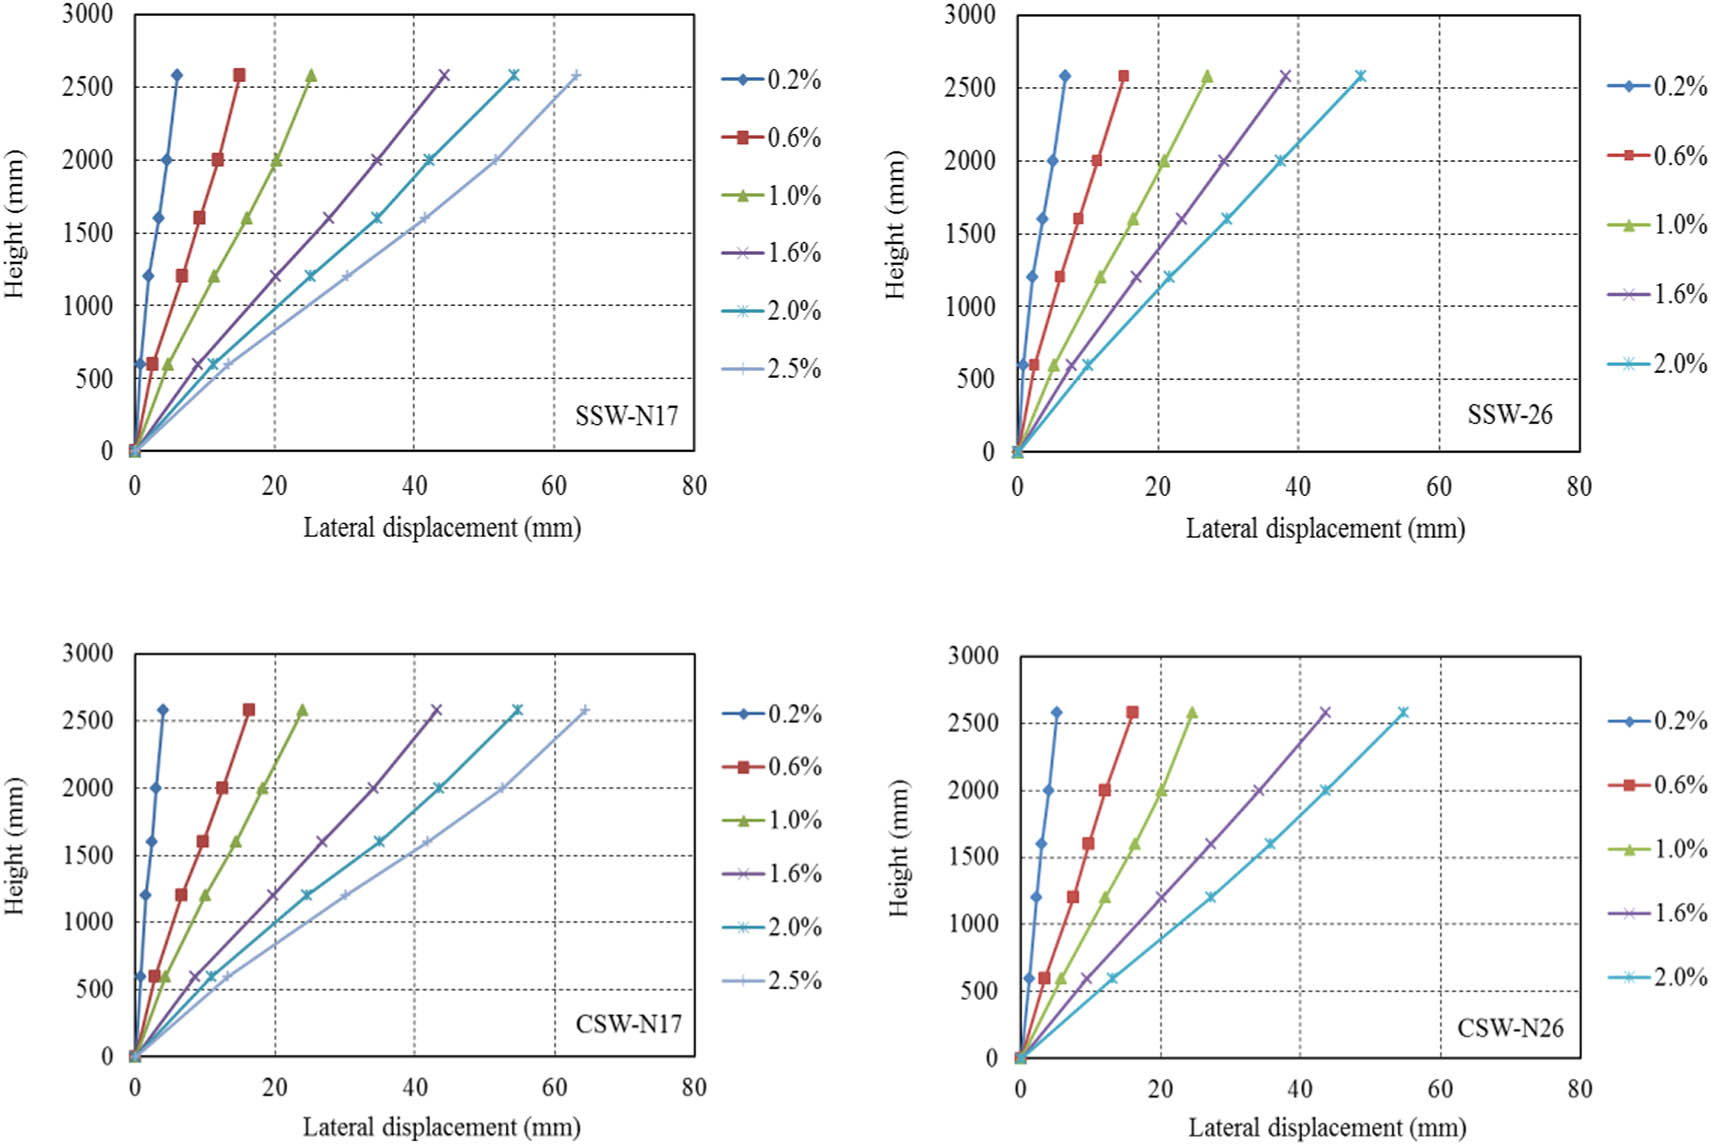
Profile of the measured lateral displacement along the height of walls. (a) SSW-17, (b) SSW-26, (c) CSW-17, and (d) CSW-26.
Figure 16 shows the average axial deformation (

Average axial deformation. (a) SSW-17, (b) SSW-26, (c) CSW-17, and (d) CSW-26.

Schematic diagram of axial deformation.
With the increase in the lateral displacement, the average axial deformation of the specimens at different heights increased linearly. From Figure 16, it can be seen that the axial deformation of the specimens was concentrated in the height range of approximately 800 mm, which represents the plastic hinge region.
To explore the drift ratio (

Schematic diagram of lateral deformation.
In Figure 19, it appears that the ratios

The drift ratio caused by bending deformation in the plastic hinge region. (a) SSW-17, (b) SSW-26, (c) CSW-17, and (d) CSW-26.
Figure 20 presents the measured equivalent viscous damping (EVD) according to the method proposed by Chopra [27]. From Figure 20, it should be noted that the EVDs of all drift-hardening walls were still approximately 10% and remained almost constant along with the drift. In summary, the axial compression ratio and the stirrup form of the concealed column in the edge zones of the wall panel only had a marginal influence on the energy dissipation capacity of the resilient concrete wall reinforced by PC strands. As such, energy consumption should not be taken into consideration in the design of resilient concrete walls reinforced by PC strands.

Comparison of the EVD.
4.3 Earthquake resilience
Figure 21 compares the measured residual drifts in the push and pull directions. It seems obvious from Figure 21 that the axial compression ratio and the stirrup form of the concealed columns have little effect on the residual drifts of all walls. The use of PC strands could reduce the residual drift ratio to approximately one-fifth of the experienced peak drift ratio at a drift ratio of less than 2.0%.

Comparison of the measured residual drift.
Figure 22 compares the maximum crack widths measured at each specific peak drift and the residual crack widths after unloading from the respective peak drift before the spalling of cover concrete became significant before a drift of 2.0%, following this point, the deterioration of cover concrete in specimens confined to conventional spirals became so extensive that the crack width lost practical significance in describing the extent of damage. In Figure 22, several horizontal lines are overlaid to signify the reparability limit and serviceability limit recommended in the AIJ guidelines [28], the ACI 318-11 code [29], and the Chinese standard GB 50011-2010 [7] for the concrete members residual crack width. The AIJ guideline sets the reparability limit at 1.0 mm, while the serviceability limits specified by the AIJ guideline, the ACI code, and the Chinese GB are 0.2, 0.4, and 0.3 mm, respectively.

Comparison of the crack widths. (a) Maximum crack width and (b) residual crack width.
Figure 22(b) demonstrates that the incorporation of PC strands can effectively diminish the residual crack width, maintaining it well below the reparability limit. This is noteworthy even when subjected to high axial load ratios and lateral seismic loading unloaded at drift ratios equal to or less than 2%. The residual crack width remains below the serviceability limit, indicating that these walls may not require any repair, provided the earthquake does not induce lateral shaking and deformation beyond 2%. It is clear to determine from Figure 22 that properly increasing the axial compression ratio and enhancing the restraint effect of the edge member can restrain the development of cracks and help to improve the repairable capability of the wall.
5 Modeling the envelope curve of resilient concrete walls
Through the analysis of the test hysteretic curves, it was found that envelope curves of these resilient concrete walls have four key points: A, B, C, and D, as shown in Figure 23, indicating the cracking of specimens, yielding of steel bars, loss of concrete surface, and failure of members. However, it was clear that the transitions of the envelope curves at the crack point (A) and the concrete surface shedding point (C) were not obvious. Therefore, the hysteretic envelope curve was approximately simplified to a bilinear model, which is shown by the dotted line (OA′B′) in Figure 23. Assuming that turning point A′ is the yield point of the member, the OA′ section represents the approximate elastic stage of the specimen under small deformation, and the A′B′ section represents the stiffness strengthening stage under large deformation.

Envelope curve model.
To determine the bilinear model, as shown in Figure 24, the following four parameters were defined: yield load (V y), yield displacement (R y), maximum load (V u), and maximum displacement (R u). The parameters were determined by theoretical analysis and test results.

Proposed envelope curve model.
5.1 Start loading to yield stage
5.1.1 Yield load V y [30,31]
It is assumed that (1) the strain distribution of the wall section is linear, (2) the tensile action of the concrete is not considered, (3) the slip of the strand is negligible in the elastic stage (under small deformation), and the strain distribution of the steel bar along the section height is linear, and (4) the stress distribution of the concrete in the compression zone is linear. In the yield state, the stress and strain distributions of the symmetrically rectangular walls are shown in Figure 25.

Sketch of stress and strain distribution of shear wall section under yield state.
The sectional curvature of the tension section when the reinforcement yields is defined as the yield curvature
According to the hypothesis of the plane section, the strain of the longitudinal steel bar in the compression zone is
According to the condition of cross-section equilibrium, the following equations can be obtained:
From Eqs. (10) and (14), the height of the compression section
The moment of bending of the cross-section of the walls can be expressed as follows:
The yield load of the walls
5.1.2 Yield displacement R y [10,32,33]
The displacement R y of walls is mainly composed of shear deformation R sy, bending deformation R by, and steel bar slip R slip. Since the member is in the elastic stage under small deformation, the curvature distribution along the height direction of the specimen is shown in Figure 26(a) under the assumption that the slip of the reinforcing bar is neglected, so the displacement of the walls is

Sketch of curvature distribution of shear walls.
Formulas (18) and (19) are substituted in formula (17).
5.2 Yield-to-peak stage
5.2.1 Maximum load V u
The maximum load V u is calculated according to the shear capacity formula of the AIJ code [25].
where
5.2.2 Maximum displacement R u
When the concrete at the compression zone edge of walls reaches the ultimate compressive strain
According to the analysis of test results and the relevant reference [34], the plastic hinge height
Wang et al. [35] proposed a truss model based on the analysis of displacement caused by shear deformation of the wall, and the shear stiffness
Eqs. (24) and (26) can be substituted in formula (23).
Order
According to the analysis of the above test results,
In this study, the accuracy of the model curve was assessed by conducting comparative analyses between the experimental curve and the predicted model curve for four resilient concrete walls, as depicted in Figure 27. The comparison results revealed a strong agreement between the analytic model curve and the experimental curve.

Comparison between predicted envelope curves and experimental results. (a) SSW-17, (b) SSW-26, (c) CSW-17, and (d) CSW-26.
6 Conclusion
To study the effect of the axial compression ratio and the stirrup form of a concealed column on the seismic behavior of resilient RC walls reinforced by PC strands in the edge zones of the wall panel, four full-scale concrete walls were prefabricated. Through experimental studies on their seismic behavior described in this study, the following conclusions can be drawn:
Increasing the axial compression ratio of the walls reduced ductility, but the energy dissipation capacity was slightly improved. The compound stirrup could improve the ductility of the structure more effectively than the circular stirrup, which effectively delayed the buckling of the longitudinal rebar, mitigating the deterioration of the constraint of the PC strands by the surrounding concrete and delaying the buckling of the PC strands.
There was no significant difference in the effect of the stirrup form of the concealed columns. However, with the increase in the axial compression ratio, the degenerative stiffness of the specimens tended to be severe, and with the increase in the lateral displacement, the relative stiffness first increased and then decreased. From the yield to the final failure of the specimens, the stiffness degradation was relatively gentle, and the residual stiffness of the specimens was approximately 10% of the initial stiffness.
By studying the deformation of the plastic hinge region, it seemed that the bending deformation caused by the plastic hinge region accounted for 20–30% of the lateral deformation, regardless of the axial compression ratio or the stirrup form of the concealed column.
The axial compression ratio and the stirrup form of the concealed columns had little effect on the residual drifts of all test walls. The use of PC strands could reduce the residual drift ratio to approximately one-fifth of the experienced peak drift ratio at a drift ratio of less than 2.0%.
Under the action of small eccentricity, increasing the axial compression ratio could effectively restrain the development of cracks, but it caused serious damage to the concrete in the compression area. Enhancing the edge constraint components could also effectively inhibit the development of cracks and further improve the ductility of walls.
The comparison between the predicted envelope curve model and the experimental curve showed that the simplified two-line envelope curve model proposed in this study is in good agreement with the test results. This provides a reference for structural engineers in the preliminary design of resilient concrete shear walls.
Acknowledgments
The experimental work described in this paper was financially supported by the National Key R&D Program of China (2016YFE 0125600), Program for Innovative Research Team of Education Ministry of China (IRT_16R67) and Thousand Talents Plan in Henan Province (ZYQR201912029). The authors also thank the laboratory staff and students at the institute of civil and transportation of Henan University of Urban Construction and Zhao Jun teacher's students at Zhengzhou University for their support and participation of this project.
-
Funding information: The experimental work described in this article was financially supported by the National Key R&D Program of China (2016YFE 0125600), Program for Innovative Research Team of Education Ministry of China (IRT_16R67) and Thousand Talents Plan in Henan Province (ZYQR201912029). The authors also thank the laboratory staff and students at the Institute of Civil and Transportation Engineering of Henan University of Urban Construction and Zhao Jun teacher’s students at Zhengzhou University for their support and participation in this project.
-
Author contributions: All authors have accepted responsibility for the entire content of this manuscript and approved its submission.
-
Conflict of interest: The authors state no conflict of interest.
-
Data availability statement: Data will be made available on request.
References
[1] Yuan, W., J. Zhao, Y. Sun, and L. Zeng. Experimental study on seismic behavior of concrete walls reinforced by PC strands. Engineering Structures, Vol. 175, 2018, pp. 577–590.10.1016/j.engstruct.2018.08.091Search in Google Scholar
[2] Nie, J., H. Hu, S. Li, F. Liu, J. Fan, M. Tao, et al. Experimental study on seismic behavior of steel plate reinforced concrete composite shear walls with square CFST concealed columns. Jiegou Xuebao/Journal of Building Structures, Vol. 34, No. 1, 2013, pp. 52–60.Search in Google Scholar
[3] Seifeldin, H. and K. Galal. In-plane seismic performance of fully grouted reinforced masonry shear walls. Journal of Structural Engineering (United States), Vol. 143, No. 7, 2017, id. 04017054.10.1061/(ASCE)ST.1943-541X.0001758Search in Google Scholar
[4] Bai, L. and X. Liang. Influence of the characteristic value of stirrup content in boundary elements on allowable axial load ratio for concrete structural walls. Industrial Structures, Vol. 39, No. 4, 2009, pp. 44–48.Search in Google Scholar
[5] Derecho, A. and M. Kianoush. The seismic design handbook. In Seismic design of reinforced concrete structures, Springer, US, 2001, pp. 463–561.10.1007/978-1-4615-1693-4_10Search in Google Scholar
[6] Priestley, M. and M. Kowalsky. Aspects of drift and ductility capacity of rectangular cantilever structural walls. Bulletin of the New Zealand National Society for Earthquake Engineering, Vol. 31, No. 2, 1998, pp. 73–85.10.5459/bnzsee.31.2.73-85Search in Google Scholar
[7] GB50011-2010. Code for seismic design of buildings, China Building Industry Press, Beijing, China, 2010.Search in Google Scholar
[8] JGJ3-2010. Technical specification for concrete structures of tall building, China Building Industry Press, Beijing, China, 2010.Search in Google Scholar
[9] Qian, J., W. Lv, and E. Fang. Seismic design of shear wall based on displacement ductility. Journal of Building Structures, Vol. 20, No. 3, 1996, pp. 42–48.Search in Google Scholar
[10] Lv, W., J. Qian, and E. Fang. The test and calculation of the ductility of reinforced concrete shear walls. Journal of Tsinghua University (Sci & Tech), Vol. 39, No. 4, 1999, pp. 88–91.Search in Google Scholar
[11] FEMA273 and NEHRP. Guidelines for the seismic rehabilitation of buildings, Federal Emergency Management Agency, Washington D.C., 1997.Search in Google Scholar
[12] Deng, M., X. Liang, and Q. Liu. Experimental study on seismic behavior of high performance concrete shear walls with new reinforcement schemes of transverse restrained bars. Journal of Xi’an University of Architecture and Technology (Natural Science Edition), Vol. 38, No. 4, 2006, pp. 99–104.Search in Google Scholar
[13] Fang, X., H. Wei, and Q. Liu. Experimental study on seismic behavior of shear walls with steel tube-confined high strength concrete. Jianzhu Jiegou Xuebao/Journal of Building Structures, Vol. 36, No. 9, 2015, pp. 1–8.Search in Google Scholar
[14] Li, H. and B. Li. Experimental study on seismic restoring performance of reinforced concrete shear walls. Jianzhu Jiegou Xuebao/Journal of Building Structures, Vol. 25, No. 5, 2004, id. 35.Search in Google Scholar
[15] Chen, Q., J. Qian, and G. Li. Static elastic-plastic analysis of shear walls with macro-model. China Civil Engineering Journal, Vol. 37, No. 39, 2004, pp. 35–43.Search in Google Scholar
[16] Lefas, I., M. Kotsovos, and N. Ambraseys. Behavior of reinforced concrete structural walls. Strength, deformation characteristics, and failure mechanism. ACI Structural Journal, Vol. 87, No. 1, 1990, pp. 23–31.10.14359/2911Search in Google Scholar
[17] Farvashany, F., S. Foster, and B. Rangan. Strength and deformation of high-strength concrete shearwalls. ACI Structural Journal, Vol. 105, No. 1, 2008, pp. 21–29.10.14359/19065Search in Google Scholar
[18] Liang, X., M. Deng, X. Zhang, and S. Tian. Experimental study on performance-based seismic design of high performance concrete shear wall. Jianzhu Jiegou Xuebao/Journal of Building Structures, Vol. 28, No. 5, 2007, pp. 80–88.Search in Google Scholar
[19] Park, H., S. Kang, L. Chung, and D. Lee. Moment-curvature relationship of flexure-dominated walls with partially confined end-zones. Engineering Structures, Vol. 29, No. 1, 2007, pp. 33–45.10.1016/j.engstruct.2006.03.035Search in Google Scholar
[20] Liu, Y., W. Yin, R. Ling, K. Ding, R. Jin, and S. Liu. Finite element analysis of the precast shear walls. Applied Mechanics and Materials, Vol. 275–277, 2013, pp. 1276–1280.10.4028/www.scientific.net/AMM.275-277.1276Search in Google Scholar
[21] Wu, F., W. Qiu, J. Ouyang, J. Li, and X. Zhou. Experiment on seismic performance of non-template insulation shear wall under varied axial compression ratios. Journal of Architecture & Civil Engineering, Vol. 35, No. 1, 2018, pp. 17–25.Search in Google Scholar
[22] Erkmen, B. and A. Schultz. Self-centering behavior of unbonded, post-tensioned precast concrete shear walls. Journal of Earthquake Engineering, Vol. 13, No. 7, 2009, pp. 1047–1064.10.1080/13632460902859136Search in Google Scholar
[23] GB/T50081-2019. Standard for test methods of concrete physical and mechanical properties, China Building Industry Press, Beijing, China, 2019.Search in Google Scholar
[24] GB/T5224-2014. Steel strand for prestressed concrete, China Building Industry Press, Beijing, China, 2014.Search in Google Scholar
[25] MLIT. Reference manuals for design codes of building structures, Ministry of Land, Infrastructure, Transport and Tourism of Japan, Tokyo, 2007.Search in Google Scholar
[26] JGJ101-96. Specificating of testing methods of for earthquakes resistant building, China Building Industry Press, Beijing, China, 1997.Search in Google Scholar
[27] Chopra, A. Dynamics of structures: Theory and applications to earthquake engineering, Prentice-Hall, Englewood Cliffs, N.J., 1995.Search in Google Scholar
[28] AIJ. Guidelines for performance evaluation of earthquake-resistant reinforced concrete buildings (Draft), Architecture Institute of Japan, Maruzen, Tokyo, 2004.Search in Google Scholar
[29] ACI318-11. Building code requirements for structural concrete and commentary, American Concrete Institute, Farmington Hills, Mich., 2011.Search in Google Scholar
[30] Ma, K., X. Liang, X. Li, and M. Deng. Restoring force model of steel reinforced concrete shear walls. Gongcheng Lixue/Engineering Mechanics, Vol. 28, No. 8, 2011, pp. 119–125 + 132.Search in Google Scholar
[31] Li, X. and X. Liang. Study on restoring force model of high-performance concrete shear walls. Journal of Earthquake Engineering and Engineering Vibration, Vol. 30, No. 5, 2010, pp. 42–48.Search in Google Scholar
[32] Thomsen IV, J. and J. Wallace. Displacement-based design of slender reinforced concrete structural walls - Experimental verification. Journal of Structural Engineering, Vol. 130, No. 4, 2004, pp. 618–630.10.1061/(ASCE)0733-9445(2004)130:4(618)Search in Google Scholar
[33] Wang, K. Experimental researches on restoring force model of reinforced concrete shear wall based on damage. Master’s Thesis. Xi’an University Of Architecture and Technology, Xi’an, 2011.Search in Google Scholar
[34] Park, R. and T. Pauay. Reinforced concrete structures, John Wiley & Son, New York, 1975.10.1002/9780470172834Search in Google Scholar
[35] Wang, B., S. Zheng, X. Guo, F. Yu, and H. Zhang. Seismic damage analysis for SRHSHPC frame columns. Gongcheng Lixue/Engineering Mechanics, Vol. 29, No. 2, 2012, pp. 61–68.Search in Google Scholar
© 2023 the author(s), published by De Gruyter
This work is licensed under the Creative Commons Attribution 4.0 International License.
Articles in the same Issue
- Review Articles
- Progress in preparation and ablation resistance of ultra-high-temperature ceramics modified C/C composites for extreme environment
- Solar lighting systems applied in photocatalysis to treat pollutants – A review
- Technological advances in three-dimensional skin tissue engineering
- Hybrid magnesium matrix composites: A review of reinforcement philosophies, mechanical and tribological characteristics
- Application prospect of calcium peroxide nanoparticles in biomedical field
- Research progress on basalt fiber-based functionalized composites
- Evaluation of the properties and applications of FRP bars and anchors: A review
- A critical review on mechanical, durability, and microstructural properties of industrial by-product-based geopolymer composites
- Multifunctional engineered cementitious composites modified with nanomaterials and their applications: An overview
- Role of bioglass derivatives in tissue regeneration and repair: A review
- Research progress on properties of cement-based composites incorporating graphene oxide
- Properties of ultra-high performance concrete and conventional concrete with coal bottom ash as aggregate replacement and nanoadditives: A review
- A scientometric review of the literature on the incorporation of steel fibers in ultra-high-performance concrete with research mapping knowledge
- Weldability of high nitrogen steels: A review
- Application of waste recycle tire steel fibers as a construction material in concrete
- Wear properties of graphene-reinforced aluminium metal matrix composite: A review
- Experimental investigations of electrodeposited Zn–Ni, Zn–Co, and Ni–Cr–Co–based novel coatings on AA7075 substrate to ameliorate the mechanical, abrasion, morphological, and corrosion properties for automotive applications
- Research evolution on self-healing asphalt: A scientometric review for knowledge mapping
- Recent developments in the mechanical properties of hybrid fiber metal laminates in the automotive industry: A review
- A review of microscopic characterization and related properties of fiber-incorporated cement-based materials
- Comparison and review of classical and machine learning-based constitutive models for polymers used in aeronautical thermoplastic composites
- Gold nanoparticle-based strategies against SARS-CoV-2: A review
- Poly-ferric sulphate as superior coagulant: A review on preparation methods and properties
- A review on ceramic waste-based concrete: A step toward sustainable concrete
- Modification of the structure and properties of oxide layers on aluminium alloys: A review
- A review of magnetically driven swimming microrobots: Material selection, structure design, control method, and applications
- Polyimide–nickel nanocomposites fabrication, properties, and applications: A review
- Design and analysis of timber-concrete-based civil structures and its applications: A brief review
- Effect of fiber treatment on physical and mechanical properties of natural fiber-reinforced composites: A review
- Blending and functionalisation modification of 3D printed polylactic acid for fused deposition modeling
- A critical review on functionally graded ceramic materials for cutting tools: Current trends and future prospects
- Heme iron as potential iron fortifier for food application – characterization by material techniques
- An overview of the research trends on fiber-reinforced shotcrete for construction applications
- High-entropy alloys: A review of their performance as promising materials for hydrogen and molten salt storage
- Effect of the axial compression ratio on the seismic behavior of resilient concrete walls with concealed column stirrups
- Research Articles
- Effect of fiber orientation and elevated temperature on the mechanical properties of unidirectional continuous kenaf reinforced PLA composites
- Optimizing the ECAP processing parameters of pure Cu through experimental, finite element, and response surface approaches
- Study on the solidification property and mechanism of soft soil based on the industrial waste residue
- Preparation and photocatalytic degradation of Sulfamethoxazole by g-C3N4 nano composite samples
- Impact of thermal modification on color and chemical changes of African padauk, merbau, mahogany, and iroko wood species
- The evaluation of the mechanical properties of glass, kenaf, and honeycomb fiber-reinforced composite
- Evaluation of a novel steel box-soft body combination for bridge protection against ship collision
- Study on the uniaxial compression constitutive relationship of modified yellow mud from minority dwelling in western Sichuan, China
- Ultrasonic longitudinal torsion-assisted biotic bone drilling: An experimental study
- Green synthesis, characterizations, and antibacterial activity of silver nanoparticles from Themeda quadrivalvis, in conjugation with macrolide antibiotics against respiratory pathogens
- Performance analysis of WEDM during the machining of Inconel 690 miniature gear using RSM and ANN modeling approaches
- Biosynthesis of Ag/bentonite, ZnO/bentonite, and Ag/ZnO/bentonite nanocomposites by aqueous leaf extract of Hagenia abyssinica for antibacterial activities
- Eco-friendly MoS2/waste coconut oil nanofluid for machining of magnesium implants
- Silica and kaolin reinforced aluminum matrix composite for heat storage
- Optimal design of glazed hollow bead thermal insulation mortar containing fly ash and slag based on response surface methodology
- Hemp seed oil nanoemulsion with Sapindus saponins as a potential carrier for iron supplement and vitamin D
- A numerical study on thin film flow and heat transfer enhancement for copper nanoparticles dispersed in ethylene glycol
- Research on complex multimodal vibration characteristics of offshore platform
- Applicability of fractal models for characterising pore structure of hybrid basalt–polypropylene fibre-reinforced concrete
- Influence of sodium silicate to precursor ratio on mechanical properties and durability of the metakaolin/fly ash alkali-activated sustainable mortar using manufactured sand
- An experimental study of bending resistance of multi-size PFRC beams
- Characterization, biocompatibility, and optimization of electrospun SF/PCL composite nanofiber films
- Morphological classification method and data-driven estimation of the joint roughness coefficient by consideration of two-order asperity
- Prediction and simulation of mechanical properties of borophene-reinforced epoxy nanocomposites using molecular dynamics and FEA
- Nanoemulsions of essential oils stabilized with saponins exhibiting antibacterial and antioxidative properties
- Fabrication and performance analysis of sustainable municipal solid waste incineration fly ash alkali-activated acoustic barriers
- Electrostatic-spinning construction of HCNTs@Ti3C2T x MXenes hybrid aerogel microspheres for tunable microwave absorption
- Investigation of the mechanical properties, surface quality, and energy efficiency of a fused filament fabrication for PA6
- Experimental study on mechanical properties of coal gangue base geopolymer recycled aggregate concrete reinforced by steel fiber and nano-Al2O3
- Hybrid bio-fiber/bio-ceramic composite materials: Mechanical performance, thermal stability, and morphological analysis
- Experimental study on recycled steel fiber-reinforced concrete under repeated impact
- Effect of rare earth Nd on the microstructural transformation and mechanical properties of 7xxx series aluminum alloys
- Color match evaluation using instrumental method for three single-shade resin composites before and after in-office bleaching
- Exploring temperature-resilient recycled aggregate concrete with waste rubber: An experimental and multi-objective optimization analysis
- Study on aging mechanism of SBS/SBR compound-modified asphalt based on molecular dynamics
- Evolution of the pore structure of pumice aggregate concrete and the effect on compressive strength
- Effect of alkaline treatment time of fibers and microcrystalline cellulose addition on mechanical properties of unsaturated polyester composites reinforced by cantala fibers
- Optimization of eggshell particles to produce eco-friendly green fillers with bamboo reinforcement in organic friction materials
- An effective approach to improve microstructure and tribological properties of cold sprayed Al alloys
- Luminescence and temperature-sensing properties of Li+, Na+, or K+, Tm3+, and Yb3+ co-doped Bi2WO6 phosphors
- Effect of molybdenum tailings aggregate on mechanical properties of engineered cementitious composites and stirrup-confined ECC stub columns
- Experimental study on the seismic performance of short shear walls comprising cold-formed steel and high-strength reinforced concrete with concealed bracing
- Failure criteria and microstructure evolution mechanism of the alkali–silica reaction of concrete
- Mechanical, fracture-deformation, and tribology behavior of fillers-reinforced sisal fiber composites for lightweight automotive applications
- UV aging behavior evolution characterization of HALS-modified asphalt based on micro-morphological features
- Preparation of VO2/graphene/SiC film by water vapor oxidation
- A semi-empirical model for predicting carbonation depth of RAC under two-dimensional conditions
- Comparison of the physical properties of different polyimide nanocomposite films containing organoclays varying in alkyl chain lengths
- Effects of freeze–thaw cycles on micro and meso-structural characteristics and mechanical properties of porous asphalt mixtures
- Flexural performance of a new type of slightly curved arc HRB400 steel bars reinforced one-way concrete slabs
- Alkali-activated binder based on red mud with class F fly ash and ground granulated blast-furnace slag under ambient temperature
- Facile synthesis of g-C3N4 nanosheets for effective degradation of organic pollutants via ball milling
- DEM study on the loading rate effect of marble under different confining pressures
- Conductive and self-cleaning composite membranes from corn husk nanofiber embedded with inorganic fillers (TiO2, CaO, and eggshell) by sol–gel and casting processes for smart membrane applications
- Laser re-melting of modified multimodal Cr3C2–NiCr coatings by HVOF: Effect on the microstructure and anticorrosion properties
- Damage constitutive model of jointed rock mass considering structural features and load effect
- Thermosetting polymer composites: Manufacturing and properties study
- CSG compressive strength prediction based on LSTM and interpretable machine learning
- Axial compression behavior and stress–strain relationship of slurry-wrapping treatment recycled aggregate concrete-filled steel tube short columns
- Space-time evolution characteristics of loaded gas-bearing coal fractures based on industrial μCT
- Dual-biprism-based single-camera high-speed 3D-digital image correlation for deformation measurement on sandwich structures under low velocity impact
- Effects of cold deformation modes on microstructure uniformity and mechanical properties of large 2219 Al–Cu alloy rings
- Basalt fiber as natural reinforcement to improve the performance of ecological grouting slurry for the conservation of earthen sites
- Interaction of micro-fluid structure in a pressure-driven duct flow with a nearby placed current-carrying wire: A numerical investigation
- A simulation modeling methodology considering random multiple shots for shot peening process
- Optimization and characterization of composite modified asphalt with pyrolytic carbon black and chicken feather fiber
- Synthesis, characterization, and application of the novel nanomagnet adsorbent for the removal of Cr(vi) ions
- Multi-perspective structural integrity-based computational investigations on airframe of Gyrodyne-configured multi-rotor UAV through coupled CFD and FEA approaches for various lightweight sandwich composites and alloys
- Influence of PVA fibers on the durability of cementitious composites under the wet–heat–salt coupling environment
- Compressive behavior of BFRP-confined ceramsite concrete: An experimental study and stress–strain model
- Interval models for uncertainty analysis and degradation prediction of the mechanical properties of rubber
- Preparation of PVDF-HFP/CB/Ni nanocomposite films for piezoelectric energy harvesting
- Frost resistance and life prediction of recycled brick aggregate concrete with waste polypropylene fiber
- Synthetic leathers as a possible source of chemicals and odorous substances in indoor environment
- Mechanical properties of seawater volcanic scoria aggregate concrete-filled circular GFRP and stainless steel tubes under axial compression
- Effect of curved anchor impellers on power consumption and hydrodynamic parameters of yield stress fluids (Bingham–Papanastasiou model) in stirred tanks
- All-dielectric tunable zero-refractive index metamaterials based on phase change materials
- Influence of ultrasonication time on the various properties of alkaline-treated mango seed waste filler reinforced PVA biocomposite
- Research on key casting process of high-grade CNC machine tool bed nodular cast iron
- Latest research progress of SiCp/Al composite for electronic packaging
- Special Issue on 3D and 4D Printing of Advanced Functional Materials - Part I
- Molecular dynamics simulation on electrohydrodynamic atomization: Stable dripping mode by pre-load voltage
- Research progress of metal-based additive manufacturing in medical implants