Space-time evolution characteristics of loaded gas-bearing coal fractures based on industrial μCT
-
 ,
,

Abstract
The space-time evolution characteristics of fractures in coal seams under external loads are of great significance for the exploration and development of coalbed methane and the safe mining of coal. In this study, the in situ industrial μCT scanning experiments of gas-bearing coal under triaxial compression conditions was carried out using a loaded coal rock industrial μCT scanning system. The computed tomography (CT) scan images of different deformation stages were obtained. The temporal characteristics and spatial evolution patterns of fractures during gas-bearing coal rupture were investigated by combining image retrieval techniques and fractal theory. The results show that (1) as the axial load increases, the maximum similarity of the CT images showed a gradually decreasing trend. (2) Under the triaxial compression conditions, the number of two-dimensional cracks in a coal-containing gas at different spatial positions exhibited a changing pattern in which it slowly decreased before rapidly increasing. (3) The patterns of change in the three-dimensional fracture rate, fracture density, and fractal dimension were quite similar, showing four stages of slow decline, slow growth, sharp growth, and slow growth again. In contrast, the Euler number exhibited the exact opposite pattern of change. (4) The coal sample space showed prominent zonal failure characteristics. The bottom of the coal sample space position (Area C) near the loading indenter had the most developed cracks and serious damage, the middle of the coal sample space position (Area B) was the second, and the upper of the coal sample space position (Area A) near the fixed indenter had slow fracture development and minimal damage.
1 Introduction
Coalbed methane (CBM) is a very valuable energy source, and its development and utilization can replace traditional natural gas, reduce greenhouse gas emissions, and improve the energy structure, playing an important role in mine safety, environmental protection, and commercial value [1,2]. Coal is a non-uniform porous medium material with a large number of natural defects such as pores and fractures randomly distributed within it, and these natural defects intersect with each other, providing the main network channels and pathways for CBM transportation. However, when a coal seam group is mined, the pores and fractures inside the coal body disturbed by mining will develop and expand dynamically and non-stably, and the physicochemical properties [3,4] and permeability characteristics [5,6] of the coal body will change, thus affecting the CBM transport. Therefore, it is of great significance to study the structural characteristics and evolution laws of pores and fractures in coal rock bodies during the process of load damage for the efficient exploitation of CBM and control of coal and gas protrusion disasters.
At present, there are several advanced techniques for testing and studying the structural characteristics of coal rock pores and fractures, such as low-press nitrogen adsorption [7], mercury intrusion porosimetry (MIP) [8,9], nuclear magnetic resonance (NMR) [10,11], scanning electron microscopy (SEM) [12], X-ray computed tomography (CT) [13,14], and digital image correlation methods (DIC) [15,16]. Among these testing methods, MIP causes irreversible damage to the specimen. Low-pressure nitrogen adsorption is only suitable for detecting the pore structure of small-sized samples. SEM and DIC are limited to observing the surface structure of the sample and cannot analyze the internal spatial morphology. NMR and CT are both non-destructive testing techniques. However, NMR is only applicable for detecting the pore structure of saturated water samples, while CT scanning, as an emerging detection technology, can achieve scanning accuracy down to a few micrometers. It not only enables non-destructive testing of samples but also allows for spatial visualization and characterization of the internal pores and fracture structures of the samples by combining digital image processing techniques. Therefore, it has been widely applied in recent years [17–20]. For example, Hao et al. [21] used CT scanning and three-dimensional reconstruction technology to analyze the influence of working conditions on the extension direction, development degree, and connectivity of cracks in coal under different working conditions. Wang et al. [22] reconstructed the mesostructure of coal samples at two scales by using dual-resolution CT scanning equipment and image processing technology and quantitatively characterized the multi-scale structural characteristics of coal seam development. On this basis, scholars have combined CT scanning equipment with loading devices to realize in situ real-time CT scanning of loaded samples [23,24], simulate the real stress environment of underground coal seam, and observe the dynamic evolution process of coal seam fracture. In addition, to quantitatively characterize the evolution law of coal seam fractures, quantitative analysis of coal-rock damage during the loading process was achieved by mathematically and statistically characterizing the characteristic parameters of fractures [25–27] (area, number, length, volume, angle, etc.). However, there is a large error in characterizing the fracture evolution under different stress levels using the traditional fracture characteristic parameter analysis method.
In order to describe the deformation and damage law of coal rock bodies more accurately, scholars have combined the relevant theories with CT technology to identify and study the pore and fracture structure of coal rock and its evolutionary characteristics. It has been shown that fractal theory is feasible to describe the complexity and self-similarity of porous media [28]. Therefore, many scholars used fractal dimension to quantitatively characterize the heterogeneity and complexity of pores and fractures in coal and rock mass. Wang et al. [29] quantitatively analyzed the microstructure of coal samples based on the three-dimensional reconstruction of CT images and fractal theory. Shi et al. [30] and Rahner et al. [31] analyzed and discussed the relationship between coal rock’s porosity, permeability, and fractal dimension. Du et al. [32] imported the three-dimensional fracture network and mineral distribution network model of coal samples into FLAC3D modeling and verified it by the fractal geometry method. However, the premise of calculating the fractal dimension is the threshold segmentation of the image. The previous threshold segmentation method will cause the loss of the basic information of the image [33,34]. Therefore, many scholars have applied the gray level co-occurrence matrix (GLCM) theory to identify and extract pores and fractures in porous media materials [35,36], thus effectively avoiding the shortcomings of the threshold segmentation method. Wu et al. [37] used the GLCM method to quantitatively extract the CT image information of different stress stages, which effectively described the characteristics and laws of fracture dynamic expansion during the failure process of loaded samples. Zhu et al. [38] analyzed microscopic damage evolution and crack characteristics of concrete samples based on the GLCM theory.
In summary, the combination of loading systems and CT scanning technology has always been a hot topic in rock mechanics to explore the deformation and failure process of coal and rock mass. However, these studies focus on the time series characteristics of the fracture network of loaded samples, and the space-time evolution of fractures is rarely reported. In addition, scholars generally use the same layer of CT scan positioning or visually similar CT scan images for analysis [39,40]. In fact, when samples are subjected to external loading, the coal matrix and minerals will undergo physical phenomena such as dislocation and movement, and the displacement generated by loading will cause changes in the CT scan layers. Meanwhile, limited by the human eye’s resolution ability, the numerous fine view information contained in CT images cannot be fully observed. Therefore, the same localized layers obtained by CT scan or CT scan sections with similar features identified by sensory discrimination can no longer fully reflect the structural changes of the same layer of coal rocks under different stress conditions. Given this, this study conducted CT scan tests of methane-containing coal samples under triaxial compression conditions using the loaded coal rock industrial CT scanning system. We revealed the spatial and temporal evolution characteristics of the destabilization damage of loaded coal rocks at the fine view scale based on the image retrieval method and fractal theory from planar two-dimensional and spatially three-dimensional perspectives. We explored the fracture evolution and distribution law of the fine view structure as a whole and locally with the external load during the destabilization damage of methane-containing coal. This study provides a theoretical basis for safe and efficient mining in coal mines.
2 Experiment
2.1 Coal sample preparation
The coal samples used in the experiment were taken from the Gengcun coal mine in Sanmenxia, Henan Province, China. The upper part of the coal seam is dominated by bright coal, and the lower part is dull in luster. The coal seam is mostly pulverized or broken, with semi-dark coal predominating, and the coal at the bottom of the seam is of poor quality. Large intact coal samples are taken from the working face, cored, and processed into standard cylinders with a diameter of about 25 mm and a height of about 50 mm using a drilling machine. Select one of the coal samples with an intact appearance and place it in a thermostat at 105°C environment. It was dried for 24 h to eliminate the effect of moisture and waited for experimental use.
2.2 Test system
All experiments were conducted using a loaded gas-bearing coal microscopy industrial CT scanning system, as shown in Figure 1, which is composed of two primary components: the industrial CT real-time scanning system and the triaxial loading percolation control system.
![Figure 1
Experimental equipment (modified from the study of Wu et al. [39]). (a) CT scanning equipment and (b) triaxial loading and seepage control system.](/document/doi/10.1515/rams-2023-0135/asset/graphic/j_rams-2023-0135_fig_001.jpg)
Experimental equipment (modified from the study of Wu et al. [39]). (a) CT scanning equipment and (b) triaxial loading and seepage control system.
The scanning equipment utilized was the Phoenix v|tome|x s industrial micro-CT system from GE, which is equipped with two different X-ray tubes with varying scanning accuracies. This can not only scan the fine structure of unloaded samples but also realize the real-time dynamic observation of loaded samples during the damage process. One of the X-ray tubes is a high-power micron tube, which has the advantage of strong X-ray penetration and is mainly suitable for scanning large samples but has the disadvantage of weak detail resolution. The other is a high-resolution nanoscale tube, which has the advantage of strong detail resolution and can observe changes in detail less than 0.5 μm, but with a maximum power of only 15 W, the ray penetration is weak and is mainly suitable for observing details of small samples. In this study, due to the large sample size, a high-power micron X-ray tube was selected to observe the fine fracture structure change characteristics of the loaded sample. The main calculated parameters of the industrial CT scanning system are shown in Table 1.
The main technical indexes of industrial micro CT scanning system
| X-ray source | Technical parameters | Parameter value |
|---|---|---|
| High-power micron-focus ray source | Tube voltage | 10–240 kV |
| Tube current | 0.01–3.0 mA | |
| Maximum power | 320 W | |
| The shortest distance from the focus to the sample | ≤4.5 mm | |
| Ability to distinguish details | ≤2 μm | |
| Minimum focus size | ≤3 μm | |
| High-resolution nano-focus ray source | Tube voltage | 10–180 kV |
| Tube current | 0.01–0.88 mA | |
| Maximum power | 15 W | |
| The shortest distance from the focus to the sample | ≤0.35 mm | |
| Ability to distinguish details | ≤0.5 μm | |
| Minimum focus size | ≤1 μm |
The triaxial loading and seepage control system mainly includes three parts: the loading module, the seepage module, and the computer software control system. The loading module mainly includes the axial pressure pump, the confining pressure pump, and the triaxial loading chamber. The triaxial loading chamber is located in the CT scanning room and can realize in situ non-destructive testing during sample loading. It is made of high-strength carbon fiber alloy material, which does not affect the scanning effect of CT and can withstand sufficient pressure. The axial pressure is controlled by the axial pressure pump to move the loading head, which can provide a maximum load of 100 kN. The axial loading displacement rate is 0.01–3.0 mm·min−1, and the maximum axial loading stroke is 20 mm. The maximum error is 0.1%. The confining pressure is provided by the confining pressure pump, which can provide a maximum of 30 MPa of confining pressure, and the maximum error is 0.05 MPa. The seepage module mainly includes high-pressure gas cylinders, seepage pipelines, pressure-reducing valves, pressure gauges, and flowmeters. The gas cylinder can increase the maximum pore pressure by 10 MPa, and the flow certification range of pressure is from 0 to 420 ml·min−1, with a maximum error of 0.42 ml·min−1. The computer software control system can control the load size, loading mode, loading rate, etc., in real time and accurately. At the same time, the real-time data generated during the test can be fed back to the control software through sensors for users to monitor in real time.
2.3 Test process
In this article, CT scanning tests were performed on coal samples under triaxial compression conditions, setting the circumferential pressure of the triaxial loading system to 5 MPa and the pore pressure to 0.5 MPa. CT imaging quality depended on the CT scanning parameters, and the optimal scanning parameters selected for the experiments were 180 kV voltage, 220 µA current, number of overlapping images (1), 2,000 ms exposure time, 1 × 1-pixel group, 2,024 × 2,024 pixel size, number of scanned images (1,200 images), and a pixel resolution of 27.4 µm. The specific experimental steps are as follows.
The experimental coal sample was fixed in a rubber sleeve of carbon fiber composite material, then loaded into a triaxial gripper and connected to an axial pressure loading cylinder and pipeline. The sample position was adjusted by controlling the X-, Y-, and Z-axis operating levers to ensure that the sample rotated 360° to occupy the center of the detector.
The room temperature was set to 25℃, and the triaxial loading equipment and CT scanning equipment were warmed up before starting the CT scan. Before initiating the scan, the loading system was adjusted to apply a pre-loading force of 1,000 N to the coal sample held in the gripper, which helped to secure the sample. Additionally, a gas cylinder was used to introduce 0.5 MPa gas into the gripper, creating stable air pressure for 3–4 h until gas adsorption equilibrium was reached. Once equilibrium was achieved, the confining pressure was set to 5 MPa, and both confining and gas pressure were kept constant as axial pressure was continuously applied to start the loading process. During loading, CT scans were taken at different stress levels to observe the development and expansion of internal fissures within the gas-bearing coal sample. To capture the complete fracture evolution process, six scans were taken at specific positions during the loading process, as shown in Figure 2.
The acquired CT projection images were reconstructed into three-dimensional digital coal cores using the software phoenix datos|x2, and then the digital coal cores were analyzed by image analysis using VG Studio MAX image processing software to extract the internal fracture information of coal samples and perform qualitative and quantitative analysis.
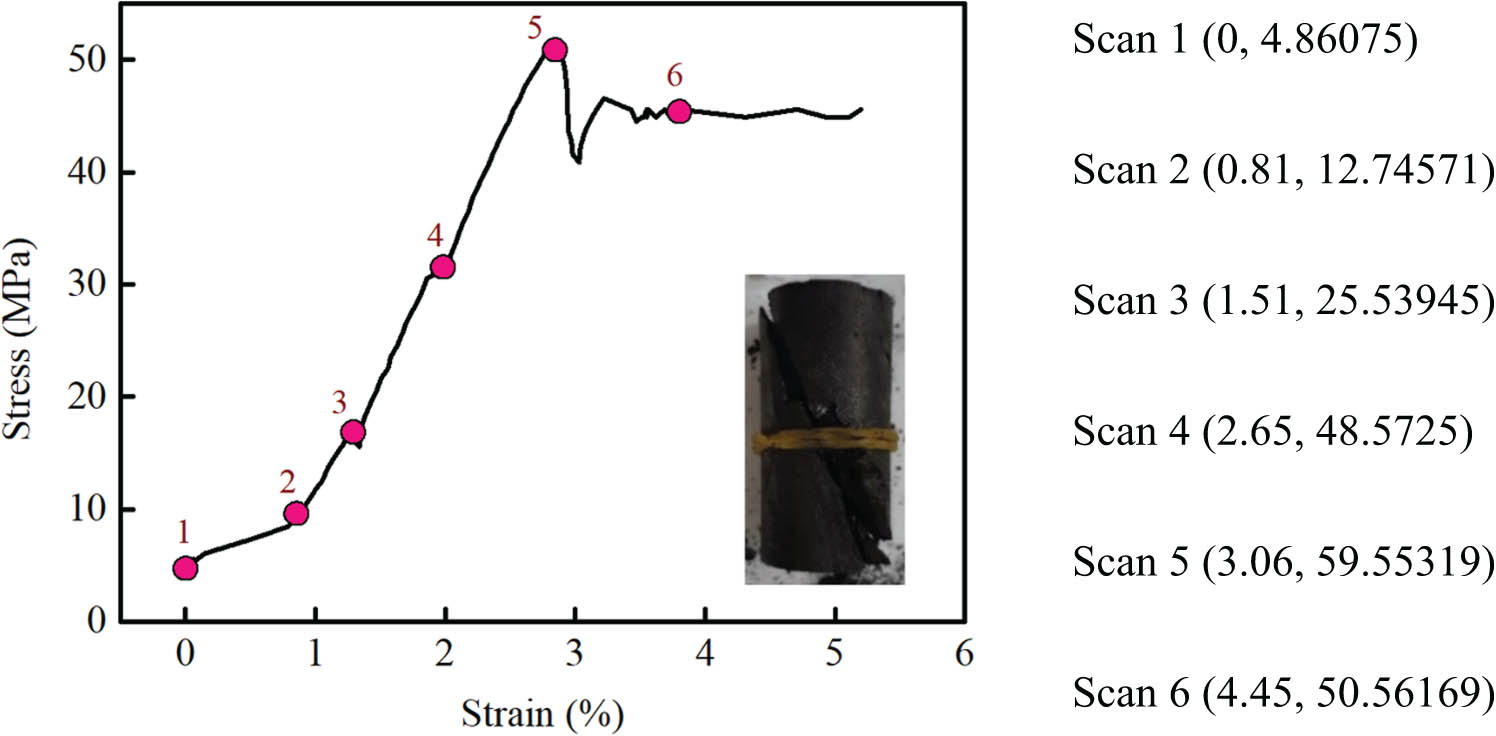
The CT scan location.
3 Methods
3.1 Image preprocessing
3.1.1 Three-dimensional reconstruction of CT data
When the conical beam emitted from the X-ray tube passes through the sample resting on the carrier table, a sample light and dark transmission map are formed on the detector due to energy attenuation and stored in the computer. When the sample is rotated with the carrier table at an angle at each interval until a scanning round is completed by rotating 360°, scanning body data are formed, and the transmission map at different angles is reconstructed in three-dimensional, which can effectively characterize the grayscale information of each part of the sample. As shown in Figure 3, the reconstruction of the collected raw data is performed using the reconstruction software phoenix datos|x2. During the reconstruction process, first, the reconstruction region of interest (ROI) needs to be defined to save computer memory and speed up data processing; second, the scan optimization button is selected, which compensates for streaks at the boundaries of CT images. Then, the projection filter button is selected to enhance the imaging recognition of the coal sample boundaries and strengthen the sharpness of the image target boundaries. Next, ring artifact reduction is utilized to reduce the streaks due to detector pixel defects, flickering pixels, or pixels with nonlinear behavior causing the appearance of ring artifacts. Finally, to achieve better CT imaging, we must select the beam hardening correction button to homogenize the imaging brightness in different thickness areas of the CT image. After the aforementioned steps, we import the reconstructed digital model into VG Studio Max software, which can accurately extract the structural information of pores and fractures of coal samples and further analyze the characterization.
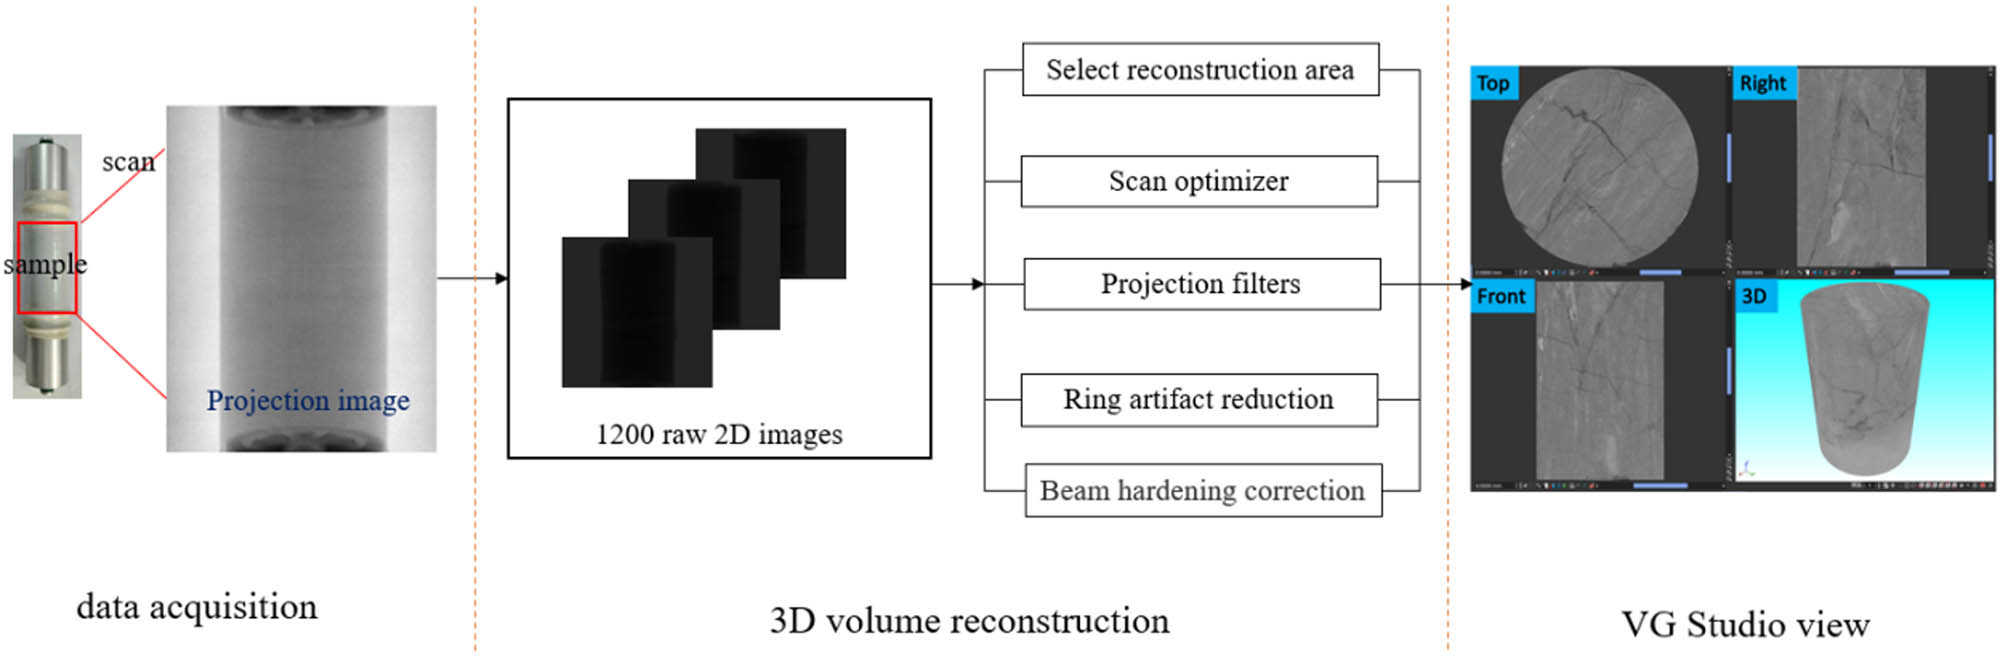
Three-dimensional reconstruction process.
3.1.2 Image binarization
Image threshold segmentation is a prerequisite for the extraction and quantitative analysis of structural information of coal rock fissures. At present, the common threshold segmentation methods mainly include the Otsu method [41], the watershed segmentation method [42], and the segmentation method of the inverse threshold of porosity [43]. The binarization of an image is to set the image gray value to 0 or 255 only, and the image shows a distinct black-and-white effect. The following transformation of the input image f to the output image g is performed:
where T is the threshold value;
As shown in Figure 4, the image noise is first removed using the Gaussian filter button of the ImageJ open-source software. Then, the grayscale histogram of the image is drawn to find out the threshold points. Finally, the image is binarized using the Otsu method to extract the cleft information of the image.
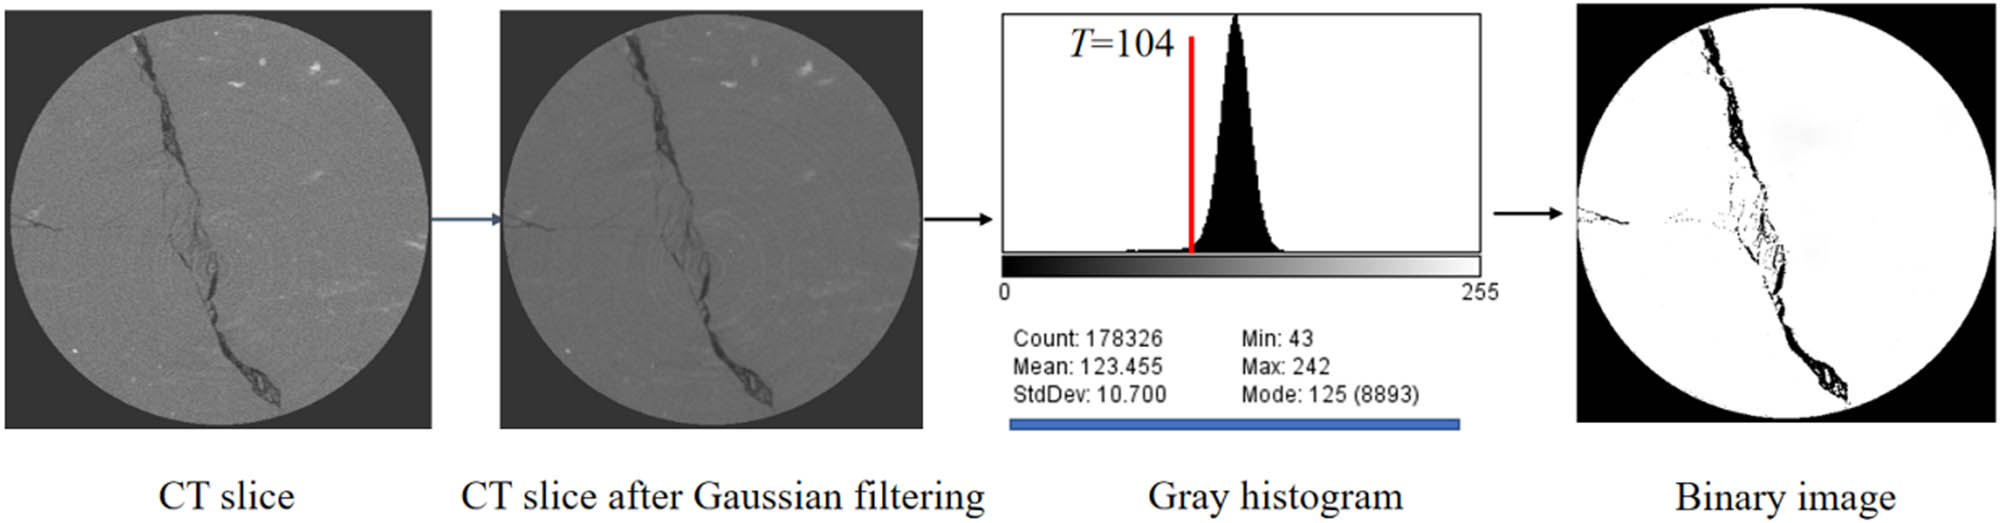
Binarization process of CT image.
3.2 Principle of CT image retrieval
As shown in Figure 5, each CT image feature in the image database is extracted, and all the extracted image features are formed into a target image feature database. When retrieving, the correlation between the sample image features and the target image feature database is calculated, so as to get the image most similar to the sample image in the database and realize image retrieval.

Image retrieval process.
Image retrieval techniques based on hashing algorithms have a wide range of applications, and there are three commonly used hashing algorithms: the average hash algorithm (aHash) [44], the different hash algorithm (dHash) [45], and the perceptual hash algorithm (pHash) [44,46]. All three algorithms obtain the hash value of an image and then compare the Hamming distance between the hash values of two images [47]; the more similar the two images are, the smaller the Hamming distance between the hash numbers of the two images. The perceptual hash algorithm uses the discrete cosine transform (DCT) to obtain the low-frequency components of the images. As long as the overall structure of the images remains the same, the hash result remains the same, avoiding the impact of gamma correction or color histogram being adjusted. Therefore, in this article, a Matlab program is prepared based on the perceptual hashing algorithm, which is used to calculate the similarity between CT images. The algorithm works as follows:
Preprocessing the image, reducing the image size to
Performing grayscale transformation, then calculating DCT, taking the upper left corner of the transformation matrix, size
Calculate the hash value, greater than the DCT mean set to 1, less than set to 0, to get the binary string.
Calculate the Hamming distance of the two strings to get the similarity value.
3.3 Fracture connectivity and complexity characterization methods
The network complexity of the fractures can be characterized by fracture rate, fracture density, and fractal dimension. According to the reconstructed three-dimensional reconstructed digital model, using the pore inclusions analysis module of the software VG Studio MAX software, the accurate extraction of fractures can be realized, and the fracture volume and fracture surface area of the sample can be calculated. The fracture rate and fracture density can characterize the fracture development inside the coal body and are important indicators to indicate the degree of fracture development in porous media [48], and they are defined as follows:
where
The three-dimensional fractal dimension of fractures can characterize the number and distribution complexity of fractures in rock space [49]; there are various ways to calculate it, such as box fractal dimension, similarity dimension, information dimension, association dimension, etc. Among them, box fractal dimension is more common, which is based on the principle of masking a surface with fractal features with cubic boxes of side length r. The number of non-empty small boxes is counted, denoted as N(r), and then a linear fit is performed on the r and N(r) data sets. The slope of the straight line is the box fractal dimension, denoted as D. The box dimension is calculated by the following equation:
Euler number is an index to characterize the fracture connectivity in porous media materials and is an important element in the study of spatial morphology of porous media [48,50]. A larger Euler number indicates a larger number of isolated closed pore fissures and poorer fissure connectivity; a smaller Euler number indicates a larger number of connected pore fissures. The Euler number is calculated as follows:
where
4 Results and analysis
4.1 Space-time evolution characteristics of two-dimensional fractures based on image retrieval
The projected view obtained from each CT scan is reconstructed into a three-dimensional digital core by phoenix datos|x2 software, which is imported into the image analysis processing software for further analysis and processing to obtain real-time scan information of any cross-sectional position of the coal sample. As shown in Figure 6(a), the distribution of internal fractures in the coal sample can be clearly displayed in the image analysis software from three views: front view, right view, and top view.

Schematic diagram of digital coal sample slice position. (a) Three views of digital coal core and (b) layer of CT images.
As shown in Figure 6(b), each reconstructed digital coal sample was divided into 1,000 top-view CT slices from bottom to top, and these slices were exported as the target image database. The top-view CT slices of the 300th, 500th, and 800th layers of the first scanning results of the coal samples were selected as sample images representing the bottom, middle, and upper parts of the coal sample, respectively. CT image similarity retrieval was performed, and the retrieval results for the 1st to 6th scanning stages are shown in Figure 7(a)–(c).

Similarity between target and sample images. (a) The similarity curve of the 300th layer, (b) the similarity curve of the 500th layer, and (c) the similarity curve of the 800th layer.
It can be seen that the CT image similarity is relatively high at the initial scan stage, which indicates a strong similarity between the sample image and the target image obtained at the first scan stage; when entering the second scan stage, the CT image similarity decreases, but it is still relatively high compared to the later stages; as the scan proceeds to the third stage, the maximum similarity of the CT image decreases further, indicating the similarity between the sample image and the target image obtained at this stage decreases, and this decreasing trend continues in the fourth and fifth scan stages until the final scan stage when the CT image similarity reaches its lowest point, which means that the internal structural characteristics of the coal sample have changed significantly in the sixth scan stage compared with the initial scan stage. In general, the similarity change curves of the first to sixth scan stages showed a gradual decrease at different locations of the coal samples. In addition, some differences in the similarity change curves at the same scan stage are also demonstrated in Figure 7, indicating the anisotropy and non-homogeneity of the internal structure of the coal samples.
From Figure 7(a)–(c), the maximum similarity and the most similar layer for three parts of the coal sample, namely, upper (800th layer), middle (500th layer), and lower (300th layer), were calculated for the first to sixth scanning stages. The specific statistical results are presented in Table 2. It can be observed that the maximum similarity of the same layer gradually decreases across different scanning stages. To avoid repetition, let us take the 300th layer as an example and provide a detailed description of the variation pattern of the maximum similarity based on the similarity retrieval results shown in Figure 7(a). In the initial scanning stage, the maximum similarity of the 300th-layer image was 1. The second scan was at the compression and density stage, when the internal pores and fractures of the coal sample began to close, and the gray values of the CT images changed, with the maximum similarity dropping to 0.93945, and the image with the highest similarity was 309th layer. With the continuous application of axial load, it entered the elastic deformation stage (3rd scan stage); at this stage, the fractures completely closed and disappeared, the maximum similarity dropped to 0.92773, and the image with the highest similarity was the 311th layer. The fourth scan was at the plastic deformation stage, where the internal fractures of the coal sample were developed and extended, with a maximum similarity of 0.89941, and the image with the highest similarity is in the 332th layer. After entering the peak (5th scan stage), the coal sample underwent destabilization damage, and the CT images underwent a large change in gray characteristics; the maximum similarity decreased to 0.84570, and the similarity image was 338th layer. In the post-peak residual deformation phase (6th scan), fractures were fully extended through, the maximum similarity was reduced to 0.82520, and the image of similarity was 324th layer.
CT images similarity retrieval results
| Scanning points | Maximum similarity | The similar layer | ||||
|---|---|---|---|---|---|---|
| L = 300 | L = 500 | L = 800 | L = 300 | L = 500 | L = 800 | |
| 1 | 1 | 1 | 1 | 300 | 500 | 800 |
| 2 | 0.93945 | 0.94043 | 0.95996 | 309 | 502 | 806 |
| 3 | 0.92773 | 0.92871 | 0.94043 | 311 | 510 | 799 |
| 4 | 0.89941 | 0.90527 | 0.90234 | 332 | 539 | 866 |
| 5 | 0.84570 | 0.85938 | 0.84570 | 338 | 510 | 831 |
| 6 | 0.82520 | 0.81055 | 0.78516 | 324 | 470 | 819 |
As shown in Figure 8, the top and axial cross-sectional views (front view) of the grayscale images of coal samples at different stress states are shown, where the top views are the grayscale images most similar to the first CT scan images obtained from the other scanning stages based on CT image retrieval techniques. According to the principle of CT imaging, different colors in the grayscale images reflect different gray values, and different gray values correspond to different densities of materials, and the darker the color indicates that the gray value and the density of the material are smaller.

The top and front view slices at different scan points. (The darkest areas on the CT image indicate pores and fractures; the white areas indicate high-density minerals; the gray areas between white and black indicate coal matrix areas).
The dynamic evolution of the two-dimensional fractures of the coal sample at different deformation stages can be seen in Figure 8. According to the results of the 1st scan, it can be seen that there are two original microcracks at the 500th layer slice of the coal sample; with the continuous application of axial stress, the coal sample entered the compression-density stage (2nd scan), and the length of the original cracks became shorter, and the width became narrower, indicating that the cracks underwent an obvious closure phenomenon. In the elastic deformation stage (3rd scan), the original cracks at the 500th layer slice of the coal sample completely closed and disappeared, and no cracks appeared in other sections under this stress, and the integrity and uniformity of the coal sample were improved at this time. With the increasing load, after the coal sample started to enter the plastic yielding stage (the 4th scan), the internal damage of the coal sample gradually increased, and a relatively obvious penetrating primary crack appeared at the 200th, 500th, and 800th layers of the coal sample, and some tiny secondary cracks bifurcated at the two ends of the primary crack; meanwhile, a penetrating diagonal primary crack also appeared at the axial section, at the A microcrack also appeared faintly at the upper right of the main crack and parallelled to the main crack. After reaching the stress peak (5th scan), the coal sample was destabilized, and the number of local cracks increased sharply; the cracks in the coal sample expanded and converged, and the cracks gradually became wider. After the peak, the coal sample was in the residual deformation stage (6th scan) at a lower stress level, and the cracks in the internal structure of the coal sample were fully extended and penetrated, and the crack width increased significantly, and the cracks were interwoven and connected with each other, and finally a two-dimensional crack network was formed.
The CT scan image is a pixel-based grayscale image, and the grayscale image shown in Figure 8 is binarized, and then the fracture percentage of the binarized image is calculated. As shown in Figure 9, only two grayscale regions remain in the binarization processed CT image, where the black region is the fracture part and the white region is the coal matrix and mineral part.
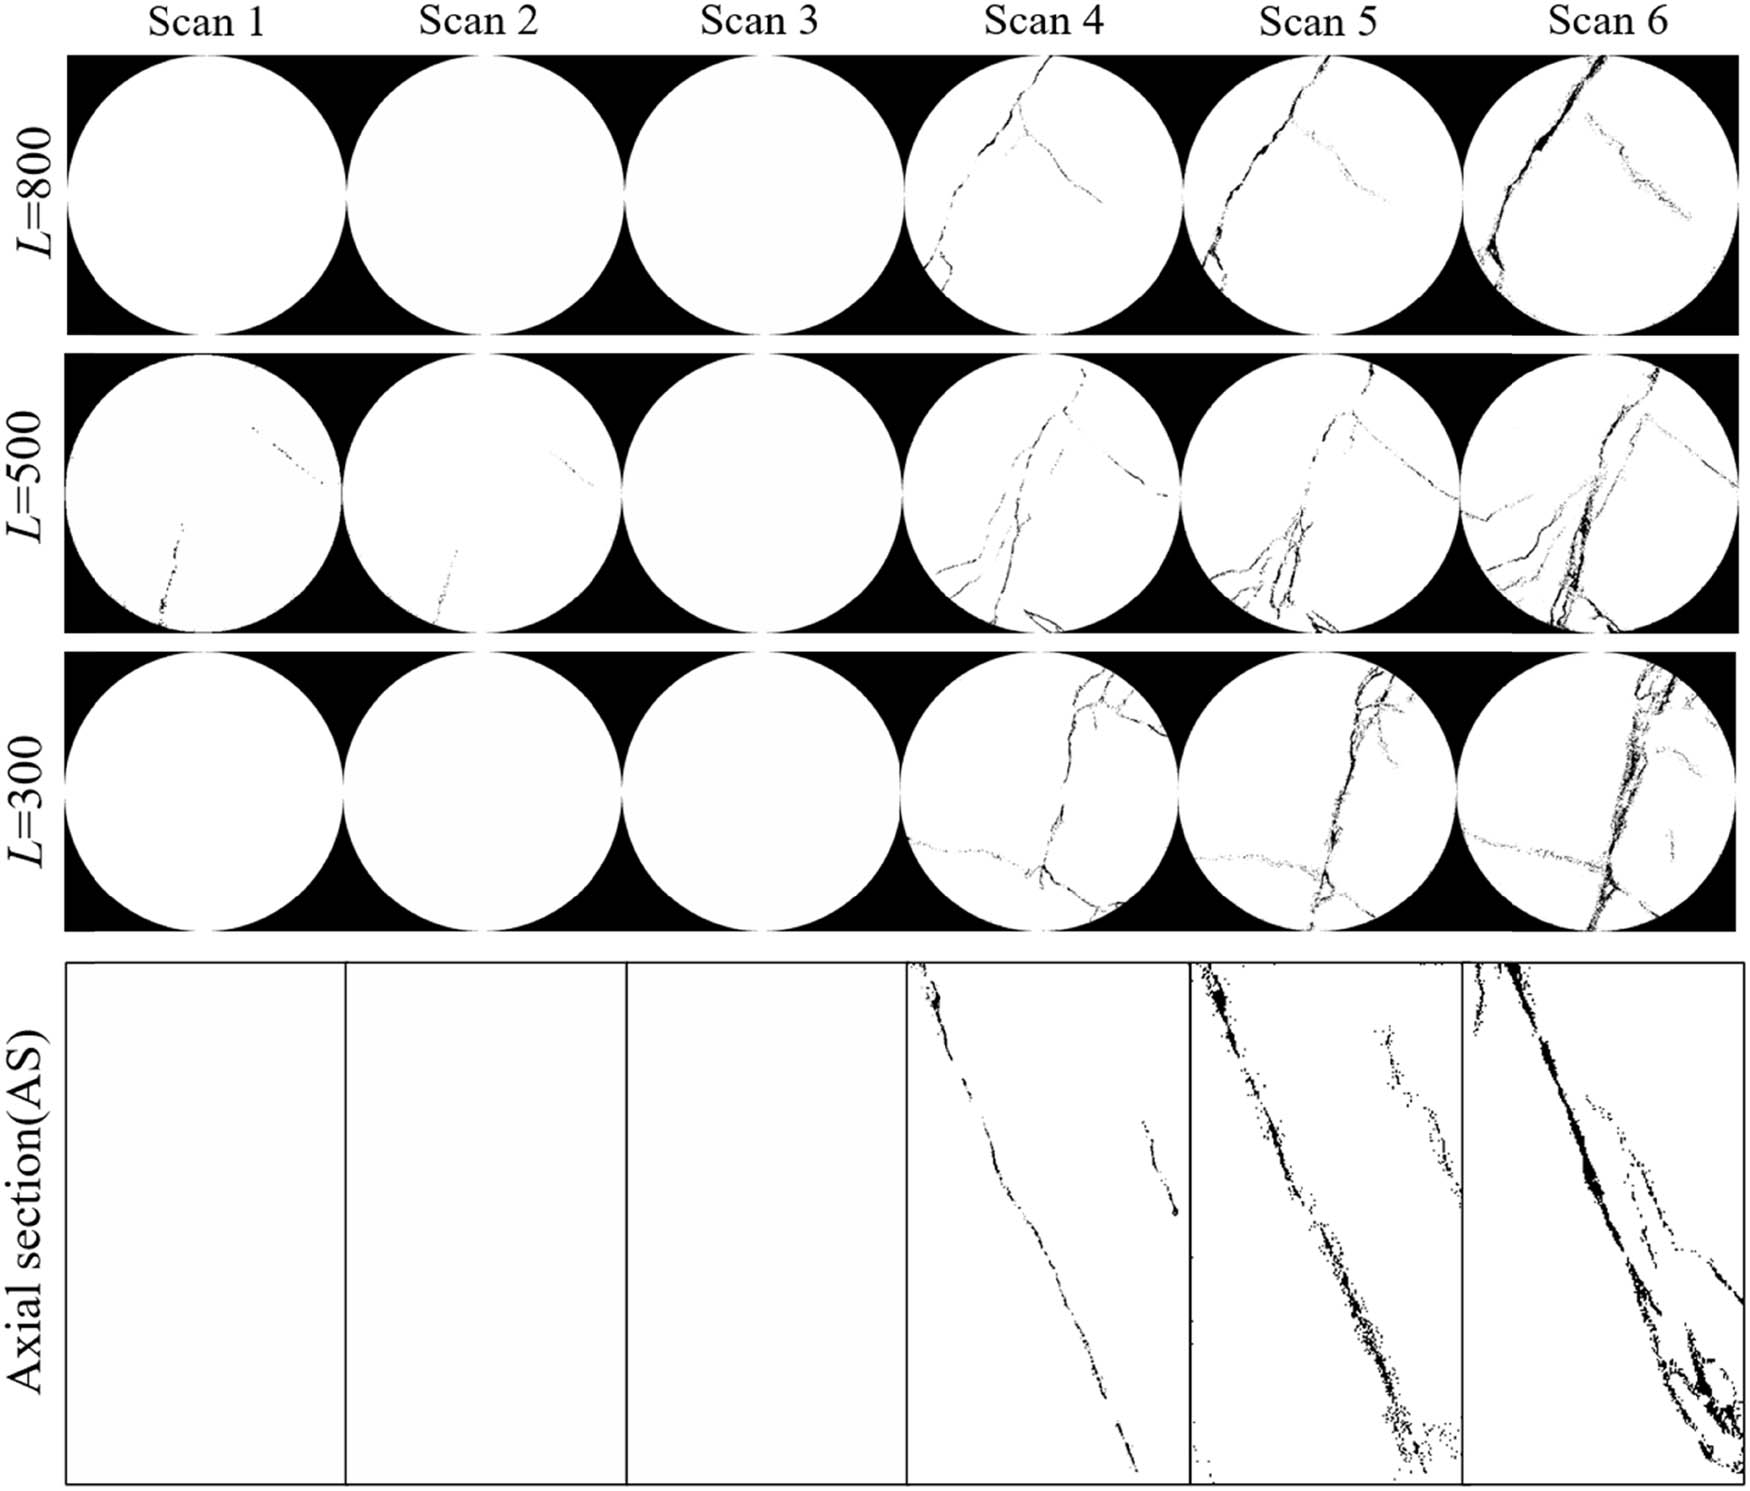
Binarization results of CT scan images at different deformation stages.
The results of two-dimensional fracture percentages are shown in Figure 10, which shows that with the increase of axial load, the number of two-dimensional fractures at different spatial locations all show two stages of change, slow decrease, and rapid increase. Comparing the 6th results longitudinally, the number of two-dimensional fractures in CT images at different spatial locations is different, among which the number of fractures in the axial section is the most, with a fracture percentage share of 3.846%; the number of fractures in the 300th layer is the most, with a fracture percentage share of 3.11%, the number of fractures in the 500th layer is more, with a fissure percentage share of 2.756%; the number of fractures in the 800th layer is the least, with a fracture percentage share of 2.191%. This indicates that the area at the bottom of the coal sample near the loaded indenter is the most damaged, and the top of the sample near the fixed indenter is the least damaged.

The evolution characteristics of two-dimensional fractures.
4.2 Space-time evolution characteristics of the three-dimensional fractures
4.2.1 Three-dimensional fracture network expansion global quantitative analysis
The two-dimensional grayscale image can only reflect the local structural characteristics of coal samples, while the three-dimensional structure map can present the spatial structural characteristics of coal samples in a complete and intuitive way. Therefore, the internal three-dimensional fracture structure of coal samples was extracted and visualized using the software. As shown in Figure 11, the three-dimensional fracture distribution and digital coal mass of coal-containing gas during triaxial compression from the first to the sixth CT scan reconstruction optimization are displayed. Different colors represent fractures of different volumes, with red representing the largest volume, dark green representing a relatively large volume, and blue representing the smallest volume.

Three-dimensional fracture reconstruction map and digital coal core.
From the first scan, the original fractures were distributed inside the coal sample, and the fracture volume was 5.62 mm3; the second to third scans corresponded to the compression-density and elastic deformation stages of the coal sample, and with the increasing axial load, the original cracks inside the coal sample gradually closed and disappeared, and no new cracks sprouted, and the total fracture volume decreased to 0.03 mm3; after entering the plastic yielding stage (4th scan), the internal damage of the coal sample increased continuously, accompanied by the generation of new microcracks, the new fractures developed, expanded, and penetrated rapidly, and formed a lamellar main fracture zone along the diagonal position of the coal sample, resulting in a rising total fracture volume of 93 mm3. When the stress peak was reached (5th scan), the fracture development was more rapid, accompanied by the rapid growth and development of a large number of new cracks; the internal cracks further expanded and widened and penetrated the entire upper and lower ends of the coal sample, the internal damage of the coal sample continued to accumulate, and the fracture volume increased significantly, rising to 290 mm3. After the peak, the stress fell sharply and entered the residual deformation stage (sixth scan); the internal fractures in the coal body further fully expanded and converged, the fracture volume increased significantly, reaching a maximum value of 461.25 mm3, and finally formed a macroscopic shear damage main fracture.
In order to quantitatively describe the complexity and connectivity of the three-dimensional fracture network of gas-bearing coal under triaxial compression. The three-dimensional fracture characteristic parameters such as three-dimensional fracture rate, fracture density, fracture fractal dimension, and Euler number are calculated by Eqs. (2)–(5), respectively, the calculation results are shown in Table 3.
Calculation results of three-dimensional fracture characteristic parameters
| Scanning times | Fracture surface area (mm2) | Fracture rate (%) | Fracture density (mm−1) | Fractal dimension | Euler number |
|---|---|---|---|---|---|
| Scan 1 | 424.99 | 0.02290 | 0.01732 | 2.08367 | −1352 |
| Scan 2 | 54.83 | 0.00297 | 0.00223 | 2.05477 | −181 |
| Scan 3 | 2.14 | 0.00012 | 0.00009 | 2.03514 | −72 |
| Scan 4 | 3998.69 | 0.37892 | 0.16292 | 2.12029 | −31515 |
| Scan 5 | 14341.59 | 1.18157 | 0.58433 | 2.26957 | −102305 |
| Scan 6 | 18852.5 | 1.87930 | 0.76812 | 2.29773 | −116891 |
Figure 12 shows the characteristics of the change of the curve of three-dimensional fracture characteristic parameters of coal samples, and it can be seen that with the increasing axial load and the increasing axial deformation, the three-dimensional fracture characteristic parameters of coal samples all show four different stages of change. The variation laws of three-dimensional fracture rate, fracture surface area, fracture density, and fracture fractal dimension are basically the same, but they are exactly opposite to the variation laws of the Euler number. The first stage: in the light blue area, the fracture rate, fracture surface area, fracture density, and fractal dimension show a slow decreasing trend, while the Euler number shows a slow growing trend, because the original fractures close under the action of compression and density, the fracture network tended to be simpler, which weakens the fracture connectivity; the second stage: in the light yellow area, the fracture rate, fracture surface area, fracture density, and fractal dimension show a slow growing trend, Euler number shows a slow decreasing trend, with the increase of deformation, the original fractures reopened and expanded, new fractures kept sprouting and developing, improving the fracture connectivity; the third stage: in the light gray area, the fracture rate, fracture surface area, fracture density, fractal dimension of fractures suddenly and sharply grow, Euler number sharply decreases, when the axial stress exceeded the yield strength or peak strength, the coal body destabilized and destroyed, the fractures were formed rapidly and extended through in a short time; The fourth stage: In the light red area, the growth rate of fracture rate, fracture surface area, fracture density, fracture fractal dimension slows down, Euler number also decreases, fractures were further dispersed and interwoven, promoting fracture connectivity, fracture volume reached the maximum, forming the final fracture network.
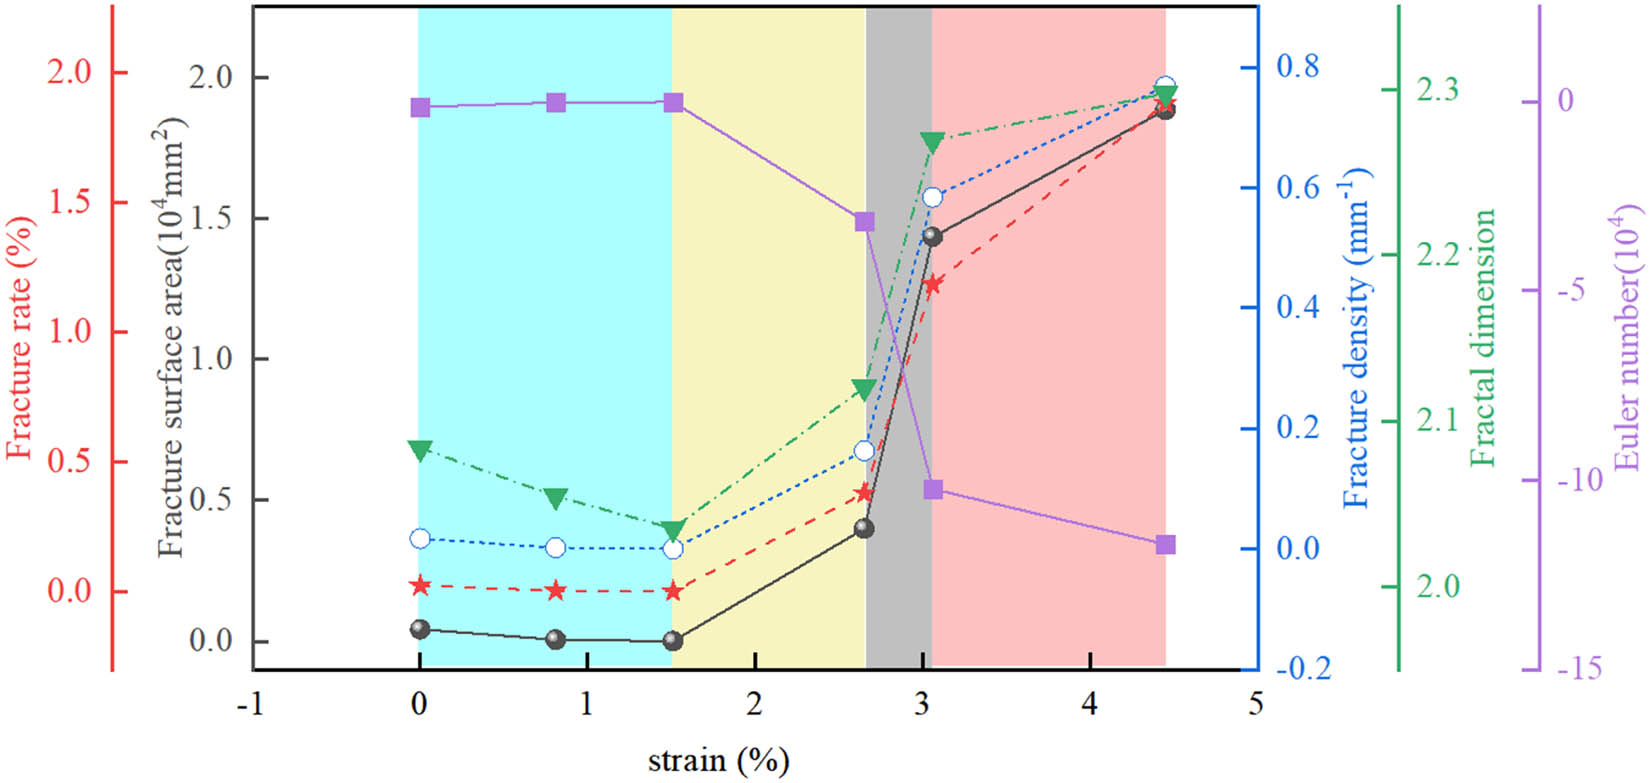
The change curve of three-dimensional fracture characteristic parameters.
4.2.2 Structural evolution characteristics of the three-dimensional fracture network partition
Gas-bearing fracture morphology and characteristics change not only in the temporal dimension but also in the spatial location during triaxial compression damage [51]. In this article, the coal sample was divided into three regions at the top, middle, and bottom, and a ROI with dimensions of 840 × 840 × 300 voxels was selected in each region, respectively, and noted as areas A, B, and C. According to Figure 11, it can be seen that fewer fractures are obtained from the first to third scans, so we only investigate the spatially zoned structure of the fourtth to sixth CT scan results.
Figure 13 shows the fracture morphology of three-dimensional fractures at different scanning stages and different spatial positions. In the horizontal comparison, it can be seen that the lamellar fractures in the same area of the coal sample, the axial load gradually increased with time, the lamellar fractures in the three areas gradually become thicker, the fractures intertwine and penetrate each other, and the fracture network becomes more complex. In the longitudinal comparison, it can be seen that the coal samples have different fracture structure morphology at different spatial locations in the same scanning stage.
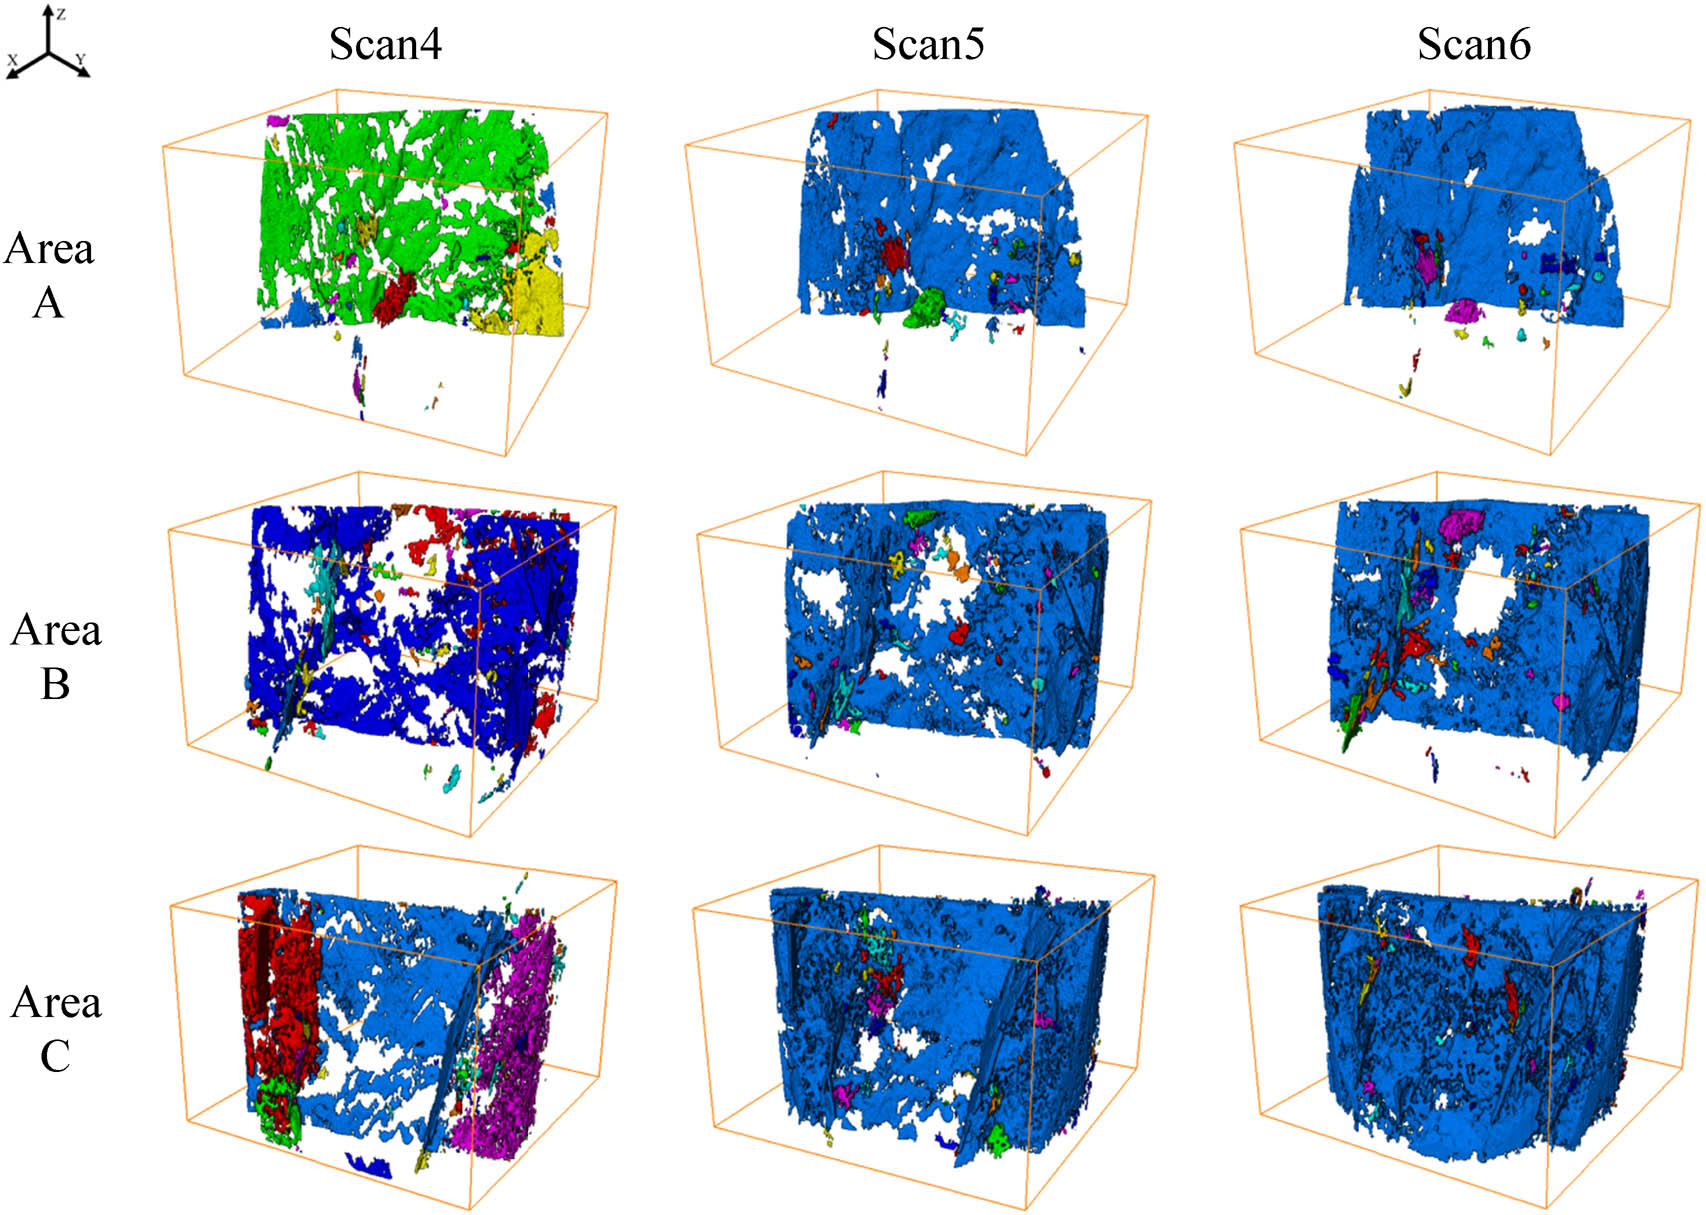
The front display of fracture zoning results.
Using the digital image processing software, the total volume and total surface area of the three-dimensional fractures in different regions were calculated separately. The calculation results are shown in Figure 14, which shows that the total volume and total surface area of three-dimensional fractures in area C are the largest, area B is the second, and area A is the smallest in the same scanning time period; in different scanning time periods, with the increase of external load, the total volume and total surface area of fractures in different spatial areas show the growth trend, among which the growth trend in area C is the most obvious, area B is the second and area A is the slowest. This indicates that when shear damage occurs in gas-bearing coal under triaxial compression, the fractures in area C near the loading indenter develop the fastest, deformation damage is the most serious, and the fractures in area A near the fixed indenter develop relatively slowly.

The evolution curve of the zonal structure of a three-dimensional fracture network.
5 Discussion
From the analysis in the previous section, the rift has a temporal and spatial evolutionary character, both from the two-dimensional plane and from the spatial three-dimensional perspective, and there are three main reasons for this phenomenon:
First, there is a relative lag in stress propagation. Assuming that the coal sample is composed of three parts, areas A, B, and C, under external loads, there are strong interactions between the three regions. The loaded pressure head first causes stress disturbance in area C, disrupting the equilibrium state of area C and causing relative movement (deformation) and pressure difference with the adjacent area B. The existence of the pressure difference forces area B into motion, but due to inertia, the motion of area B lags relatively [52]. External loads propagate through the coal sample in this stress waveform from near too far, thus causing different degrees of damage zones to form inside the coal sample.
Second, the initial defects of the coal sample cause stress concentration phenomena. During the triaxial compression process of coal, microcracks are first generated inside the coal body in a random and dispersed manner. Specifically, when there are initial defects inside the coal body, stress concentration phenomena will be induced, causing microcracks to initially initiate and develop around the defects, and then accumulate, extend, and connect into large cracks, leading to macroscopic unstable failure of the coal body. From the first scanning result in Figure 11, it can be seen that the initial cracks are mainly distributed in area C, exacerbating the uneven distribution of stress inside the coal sample and thus greatly influencing the failure mode of the coal sample.
Third, gas weakens the physical properties of coal bodies [24,53]. There are natural fracture structural defects inside the coal body, and the fracture size is much larger than the diameter and average free range of gas molecules, and under pressure, gas is rapidly transported to the fractures and exerts forces on them. According to the principle of equivalent stress, the average stress of the two acting forces, external body stress σ i , and gas pressure p, jointly determine the destruction of gas-bearing coal [54], and the mathematical expression is
where
With the use of the equivalent effective stress, the circle center and radius of the molar stress circle become
where σ s is the location of the center of the molar stress circle of gas-containing coal, τ s is the radius of the molar stress circle of gas-containing coal, and σ 1 and σ 3 are the maximum and minimum principal stresses of non-gas-containing coal, respectively.
From Eq. (7) and Figure 15, it can be seen that when gas exists inside the coal body, the position of the circle center of the molar stress circle will be shifted to the left by αp, and the size of the molar stress circle does not change. This phenomenon indicates that the presence of gas pressure makes the molar stress circle of gas-bearing coal closer to the shear damage limit of gas-bearing coal, so the presence of gas pressure weakens the mechanical properties of gas-bearing coal to some extent, and the higher the gas pressure is, the greater the decrease is.

The sketch of the influence of gas pressure on coal strength.
In addition, after the coal body reaches the equilibrium state of gas adsorption, the surface free energy of the coal body is [55]
where γ is the surface free energy of coal after gas adsorption, N·m−1;
According to the Griffith formula,
Substituting Eq. (8) into Eq. (9), we can further obtain the relationship between gas pressure and tensile strength of the fracture tip of the coal body as follows:
where σ t is the crack tip tensile strength, Pa; l is the crack length, m; and E is the modulus of elasticity, Pa.
From Eqs. (8) and (10), it can be seen that with the increase of gas pressure, the surface free energy of the coal body and the tensile strength of the fracture tip will decrease. In addition, under the constraint of the surrounding pressure, the free-state gas in the pore fissure will produce a gas wedge effect on the fissure, prompting the coal body to produce expansion stress and reducing the cohesion between the coal matrix, which leads to the gas-bearing coal body more easily destroyed under the joint action of adsorbed state and free state gas, and the greater the gas pressure, the more serious the destruction. Combined with Figure 2, it can be seen that the gas was passed in from the bottom of the coal sample, so a pressure gradient would be formed between different areas of the coal sample, where the gas pressure in area C was the largest, so the degree of damage was the most serious, area B was the second, area A gas pressure was the smallest, so the degree of damage is relatively small. Therefore, it can be shown that the zoning characteristics of gas-bearing coal damage are due to a combination of gas pressure, stress propagation, and initial defects.
6 Conclusions
In this article, the space-time evolution characteristics of fractures in gas-bearing coal under triaxial compression conditions were studied from a planar two-dimensional and spatial three-dimensional perspective, using a loaded coal rock industrial CT scanning system and digital image technology, and the following conclusions were obtained:
The similarity-based image retrieval technique can identify the CT images corresponding to the same level of coal rock samples under different stress states in a series of images, which improves the accuracy of fine-structure evolution analysis of loaded coal rocks. According to the similarity calculation results, it can be seen that the maximum similarity of CT images decreased with the increasing deformation of coal samples.
With the increase of axial load, the number of two-dimensional fractures in the 300th, 500th, and 800th layers all showed a trend of decreasing and then increasing. In particular, the number of fractures in the 300th layer was the highest and the least in the 800th layer after the destruction of coal samples.
The three-dimensional fracture characteristic parameters showed four change phases, among which the three-dimensional fracture rate, fracture surface area, fracture density, and fractal dimension of fracture were basically the same, showing four transformation phases of slow decline, slow growth, sharp growth, and slowing down of growth. The Euler number was exactly opposite to their change patterns, showing four transformation stages of slow growth, slow decline, sharp decline, and deceleration slowdown.
Coal samples showed obvious spatial zonation damage characteristics in the process of loading damage; the fracture in area C near the loading head developed rapidly, causing serious damage. Fracture development in area A near the fixed head was relatively slow. This was the result of gas pressure, stress propagation, and initial defects acting on gas-bearing coal.
Acknowledgments
The authors would like to express their sincere gratitude to the editor and reviewers for their valuable comments, which have greatly improved this article.
-
Funding information: This work was supported by the National Natural Science Foundations of China, the mechanism of gas seepage induced by the fracture expansion in the “U-shaped zone” of the double-prevention drillhole (Grant 52104216); fracture evolution and water-gas coupled permeability mechanism of coal body around extraction borehole (Grant 2021JM-390).
-
Author contributions: The main research idea and manuscript preparation were contributed by Hang Zhang; Tianjun Zhang contributed to the manuscript preparation and performed the correlative experiment. Mingkun Pang and Dengke Wang gave several suggestions from the industrial perspective. Fanchao Zeng assisted in finalizing the research work and manuscript. All authors have accepted responsibility for the entire content of this manuscript and approved its submission.
-
Conflict of interest: The authors state no conflict of interest.
-
Data availability statement: The data that support the findings of this study are available from the corresponding author upon reasonable request.
References
[1] Wang, J. L., S. Mohr, L. Feng, H. Liu, and G. E. Tverberg. Analysis of resource potential for China’s unconventional gas and forecast for its long-term production growth. Energy Policy, Vol. 88, 2016, pp. 389–401.10.1016/j.enpol.2015.10.042Search in Google Scholar
[2] Chen, Y. Z., J. Li, H. W. Lu, and Y. Y. Yang. Impact of unconventional natural gas development on regional water resources and market supply in China from the perspective of game analysis. Energy Policy, Vol. 145, 2020, id. 111750.10.1016/j.enpol.2020.111750Search in Google Scholar
[3] Zhang, X. D., Z. G. Du, and P. P. Li. Physical characteristics of high-rank coal reservoirs in different coal-body structures and the mechanism of coalbed methane production. Science China-Earth Sciences, Vol. 60, 2017, pp. 246–255.10.1007/s11430-016-5178-ySearch in Google Scholar
[4] Zhang, Q. G., S. L. Zhao, W. S. Wang, X. Y. Fan, Y. C. Liang, Z. G. Gang, et al. Mechanical behaviors of coal surrounding horizontal wellbore during drilling process considering the effects of loading rate, pore pressure and temperature. Geomechanics and Geophysics for Geo-Energy and Geo-Resources, Vol. 34, No. 1, 2023, id. 28.10.1007/s40948-023-00561-zSearch in Google Scholar
[5] Zhang, Q. G., X. Y. Fan, Y. C. Liang, M. H. Li, G. Z. Li, T. S. Ma, et al. Mechanical behavior and permeability evolution of reconstituted coal samples under various unloading confining pressures – implications for wellbore stability analysis. Energies, Vol. 10, No. 3, 2017, id. 292.10.3390/en10030292Search in Google Scholar
[6] Wang, G., X. Y. Chu, and X. X. Yang. Numerical simulation of gas flow in artificial fracture coal by three-dimensional reconstruction based on computed tomography. Journal of Natural Gas Science and Engineering, Vol. 34, 2016, pp. 823–831.10.1016/j.jngse.2016.07.039Search in Google Scholar
[7] Qi, L. L., X. Tang, Z. F. Wang, and X. S. Peng. Pore characterization of different types of coal from coal and gas outburst disaster sites using low temperature nitrogen adsorption approach. International Journal of Mining Science and Technology, Vol. 27, No. 2, 2017, pp. 371–377.10.1016/j.ijmst.2017.01.005Search in Google Scholar
[8] Zhou, S. D., D. M. Liu, Y. D. Cai, Y. B. Yao, Y. Che, and Z. H. Liu. Multi-scale fractal characterizations of lignite, subbituminous and high-volatile bituminous coals pores by mercury intrusion porosimetry. Journal of Natural Gas Science and Engineering, Vol. 44, 2017, pp. 338–350.10.1016/j.jngse.2017.04.021Search in Google Scholar
[9] Li, Z. T., D. M. Liu, Y. D. Cai, Y. B. Yao, and H. Wang. Pore structure and compressibility of coal matrix with elevated temperatures by mercury intrusion porosimetry. Energy Exploration & Exploitation, Vol. 33, No. 6, 2015, pp. 809–826.10.1260/0144-5987.33.6.809Search in Google Scholar
[10] Liu, Z. S., D. M. Liu, Y. D. Cai, Y. B. Yao, Z. J. Pan, and Y. F. Zhou. Application of nuclear magnetic resonance (NMR) in coalbed methane and shale reservoirs: A review. International Journal of Coal Geology, Vol. 218, 2020, id. 103261.10.1016/j.coal.2019.103261Search in Google Scholar
[11] Zhao, Y. X., Y. F. Sun, S. M. Liu, K. Wang, and Y. D. Jiang. Pore structure characterization of coal by NMR cryoporometry. Fuel, Vol. 190, 2017, pp. 359–369.10.1016/j.fuel.2016.10.121Search in Google Scholar
[12] Kwiecińska, B., S. Pusz, and B. J. Valentine. Application of electron microscopy TEM and SEM for analysis of coals, organic-rich shales and carbonaceous matter. International Journal of Coal Geology, Vol. 211, 2019, id. 103203.10.1016/j.coal.2019.05.010Search in Google Scholar
[13] Shi, J. H., Z. C. Feng, D. Zhou, X. C. Li, and Q. R. Meng. Analysis of the permeability evolution law of in situ steam pyrolysis of bituminous coal combing with in situ CT technology. Energy, Vol. 45, No. 2, 2023, pp. 6010–6026.10.1080/15567036.2023.2213666Search in Google Scholar
[14] Liu, A., S. M. Liu, K. W. Xia, P. Liu, Y. Yang, and G. Wang. Characterizing Anisotropic Swelling Strains of Coal Using Combined Rosette Strain Gauge and CT-Scans. Rock Mechanics and Rock Engineering, Vol. 56, No. 7, 2023, pp. 5405–5426.10.1007/s00603-023-03348-6Search in Google Scholar
[15] Zhang, T. J., X. Ji, M. K. Pang, L. Zhang, B. Ji, W. Yang, et al. Investigation of the crack evolution characteristics of coal and rock bodies around boreholes during progressive damage based on stress threshold values. Theoretical and Applied Fracture Mechanics, Vol. 125, 2023, id. 103935.10.1016/j.tafmec.2023.103935Search in Google Scholar
[16] Ji, X., T. J. Zhang, B. Ji, L. Zhang, M. K. Pang, H. Y. Pan, et al. Gray characteristics analysis of strain field of coal and rock bodies around boreholes during progressive damage based on digital image. Rock Mechanics and Rock Engineering, Vol. 56, No. 8, 2023, pp. 5607–5620.10.1007/s00603-023-03351-xSearch in Google Scholar
[17] Wang, D. K., P. Zhang, H. Pu, J. P. Wei, S. M. Liu, and C. Yu. Experimental research on cracking process of coal under temperature variation with industrial micro-CT. Chinese Journal of Rock Mechanics and Engineering, Vol. 3710, 2018, pp. 2243–2252.Search in Google Scholar
[18] Guo, Y. T., C. H. Yang, C. G. Jia, J. B. Xu, L. Wang, and D. Li. Research on hydraulic fracturing physical simulation of shale and fracture characterization. Chinese Journal of Rock Mechanics and Engineering, Vol. 33, No. 1, 2014, pp. 52–59.Search in Google Scholar
[19] Mayo, S., M. Josh, Y. Nesterets, L. Esteban, M. Pervukhina, and C. M. Ben. Quantitative micro-porosity characterization using synchrotron micro-CT and xenon K-edge subtraction in sandstones, carbonates, shales and coal. Fuel, Vol. 154, 2015, pp. 167–173.10.1016/j.fuel.2015.03.046Search in Google Scholar
[20] Thiemeyer, N., J. Habersetzer, M. Peinl, G. Zulauf, and J. Hammer. The application of high resolution X-ray computed tomography on naturally deformed rock salt: Multi-scale investigations of the structural inventory. Journal of Structural Geology, Vol. 77, 2015, pp. 92–106.10.1016/j.jsg.2015.05.014Search in Google Scholar
[21] Hao, D. Y., S. H. Tu, C. Zhang, and H. S. Tu. Quantitative characterization and three-dimensional reconstruction of bituminous coal fracture development under rock mechanics testing. Fuel, Vol. 267, 2020, id. 117280.10.1016/j.fuel.2020.117280Search in Google Scholar
[22] Wang, M. F., J. J. Wang, S. Tao, D. Z. Tang, C. C. Wang, and J. Yi. Quantitative characterization of void and demineralization effect in coal based on dual-resolution X-ray computed tomography. Fuel, Vol. 267, 2020, id. 116836.10.1016/j.fuel.2019.116836Search in Google Scholar
[23] Yang, B., L. Xue, and K. Zhang. X-ray micro-computed tomography study of the propagation of cracks in shale during uniaxial compression. Environmental Earth Sciences, Vol. 77, No. 18, 2018, pp. 1–9.10.1007/s12665-018-7843-2Search in Google Scholar
[24] Wang, D. K., H. Zhang, J. P. Wei, Y. Wu, H. Zhang, B. H. Yao, et al. Dynamic evolution characteristics of fractures in gas bearing coal under the influence of gas pressure using industrial CT scanning technology. Journal of China Coal Society, Vol. 46, No. 11, 2021, pp. 3550–3564.Search in Google Scholar
[25] Duan, Y. T., X. Li, J. M. He, S. D. Li, and R. Q. Zhou. Quantitative analysis of meso-damage evolution for shale under in situ uniaxial compression conditions. Environmental Earth Sciences, Vol. 77, No. 4, 2018, pp. 1–9.10.1007/s12665-018-7336-3Search in Google Scholar
[26] Wang, D. K., P. Zhang, J. P. Wei, Y. Wu, and F. C. Zeng. Research on dynamic evolution of 3D fracture structure of loaded coal body based on CT visualization. Journal of China Coal Society, Vol. 44, No. S2, 2019, pp. 574–584.Search in Google Scholar
[27] Li, Y. Y., H. Q. Cui, P. Zhang, D. K. Wang, and J. P. Wei. Three-dimensional visualization and quantitative characterization of coal fracture dynamic evolution under uniaxial and triaxial compression based on μCT scanning. Fuel, Vol. 262, 2020, id. 116568.10.1016/j.fuel.2019.116568Search in Google Scholar
[28] Yang, F., F. Zheng, and H. Q. Liu. Fractal characteristics of shales from a shale gas reservoir in the Sichuan Basin. Fuel, Vol. 115, 2014, pp. 378–384.10.1016/j.fuel.2013.07.040Search in Google Scholar
[29] Wang, G., X. J. Qin, J. N. Shen, Z. Y. Zhang, D. Y. Han, and C. H. Jiang. Quantitative analysis of microscopic structure and gas seepage characteristics of low-rank coal based on CT three-dimensional reconstruction of CT images and fractal theory. Fuel, Vol. 256, 2019, id. 115900.10.1016/j.fuel.2019.115900Search in Google Scholar
[30] Shi, X. H., J. N. Pan, Q. L. Hou, Y. Jin, Z. Z. Wang, Q. H. Niu, et al. Micrometer-scale fractures in coal related to coal rank based on micro-CT scanning and fractal theory. Fuel, Vol. 212, 2018, pp. 162–72.10.1016/j.fuel.2017.09.115Search in Google Scholar
[31] Rahner, M. S., M. Halisch, C. P. Fernandes, and A. Weller. Fractal dimensions of pore spaces in unconventional reservoir rocks using X-ray nano- and micro-computed tomography. Journal of Natural Gas Science and Engineering, Vol. 55, 2018, pp. 298–311.10.1016/j.jngse.2018.05.011Search in Google Scholar
[32] Du, F., K. Wang, G. J. Zhang, Y. Zhang, G. D. Zhang, and G. D. Wang. Damage characteristics of coal under different loading modes based on CT three-dimensional reconstruction. Fuel, Vol. 310, 2022, id. 122304.10.1016/j.fuel.2021.122304Search in Google Scholar
[33] Schluter, S., A. Sheppard, K. Brown, and D. Wildenschild. Image processing of multiphase images obtained via X- ray microtomography: A review. Water Resources Research, Vol. 50, No. 4, 2014, pp. 3615–3639.10.1002/2014WR015256Search in Google Scholar
[34] Voorn, M., U. Exner, and A. Rath. Multiscale Hessian fracture filtering for the enhancement and segmentation of narrow fractures in 3D image data. Computers & Geosciences, Vol. 57, 2013, pp. 44–53.10.1016/j.cageo.2013.03.006Search in Google Scholar
[35] Li, K. X., J. Wang, and D. W. Qi. Research on crack identification and monitoring method of concrete structure based on G-S-G. Journal of Vibration and Shock, Vol. 3911, 2020, pp. 101–108.Search in Google Scholar
[36] Xu, J. M., N. N. Han, and Y. S. Li. Image features of localized deformation of limestone. Chinese Journal of Rock Mechanics and Engineering, Vol. 2910, 2010, pp. 2110–2115.Search in Google Scholar
[37] Wu, Y., D. K. Wang, L. Wang, Z. J. Shang, C. Q. Zhu, J. P. Wei, et al. An analysis of the meso-structural damage evolution of coal using X-ray CT and a gray-scale level co-occurrence matrix method. International Journal of Rock Mechanics and Mining Sciences, Vol. 152, 2022, id. 105062.10.1016/j.ijrmms.2022.105062Search in Google Scholar
[38] Zhu, L., F. N. Dang, Y. Xue, W. H. Ding, and L. Zhang. Analysis of micro-structural damage evolution of concrete through coupled X-ray computed tomography and gray-level co-occurrence matrices method. Construction and Building Materials, Vol. 224, 2019, pp. 534–550.10.1016/j.conbuildmat.2019.07.007Search in Google Scholar
[39] Wu, Y., D. K. Wang, J. P. Wei, B. H. Yao, H. T. Zhang, J. H. Fu, et al. Damage constitutive model of gas-bearing coal using industrial CT scanning technology. Journal of Natural Gas Science and Engineering, Vol. 101, 2022, id. 104543.10.1016/j.jngse.2022.104543Search in Google Scholar
[40] Zhou, H. W., J. C. Zhong, W. G. Ren, X. Y. Wang, and H. Y. Yi. Characterization of pore-fracture networks and their evolution at various measurement scales in coal samples using X-ray μCT and a fractal method. International Journal of Coal Geology, Vol. 189, 2018, pp. 35–49.10.1016/j.coal.2018.02.007Search in Google Scholar
[41] Brink, A. D. Thresholding of digital images using two-dimensional entropies. Pattern Recognition, Vol. 25, No. 8, 1992, pp. 803–808.10.1016/0031-3203(92)90034-GSearch in Google Scholar
[42] Ajam, M., H. Kanaan, L. E. Khansa, and M. Ayache. Identification of Ischemic Stroke by Marker Controlled Watershed Segmentation and Fearture Extraction. International Arab Journal of Information Technology, Vol. 174A, 2016, pp. 671–676.10.34028/iajit/17/4A/12Search in Google Scholar
[43] Peng, R., Y. C. Yang, Y. Ju, and Y. M. Yang. Computation of fractal dimension of rock pores based on gray CT images. Chinese Science Bulletin, Vol. 5631, 2011, pp. 3346–3357.10.1007/s11434-011-4683-9Search in Google Scholar
[44] Tang, L. C., S. Y. Deng, Y. X. Wu, and L. Wen. Duplicate detection algorithm for massive images based on pHash block detection. Journal of Computer Applications, Vol. 39, No. 9, 2019, pp. 2789–2794.Search in Google Scholar
[45] Chun, J., J. Ma, and C. Ying. Improved non-local mean denoising algorithm based on difference hash algorithm. Laser & Optoelectronics Progress, Vol. 57, No. 14, 2020, pp. 79–84.10.3788/LOP57.141007Search in Google Scholar
[46] Monga, V. and B. Evans. Perceptual image hashing via feature points: performance evaluation and tradeoffs. IEEE transactions on Image Processing, Vol. 15, No. 11, 2006, pp. 3452–3465.10.1109/TIP.2006.881948Search in Google Scholar
[47] Fei, M., Z. Ju, X. Zhen, and J. Li. Real-time visual tracking based on improved perceptual hashing. Multimedia Tools and Applications, Vol. 76, No. 3, 2017, pp. 4617–4634.10.1007/s11042-016-3723-5Search in Google Scholar
[48] Wang, D. K., F. C. Zeng, J. P. Wei, H. T. Zhang, Y. Wu, and Q. Wei. Quantitative analysis of fracture dynamic evolution in coal subjected to uniaxial and triaxial compression loads based on industrial CT and fractal theory. Journal of Petroleum Science and Engineering, Vol. 196, 2021, id. 108051.10.1016/j.petrol.2020.108051Search in Google Scholar
[49] Mao, L. T., X. Y. Lian, and L. Hao. The fractal calculation of 3D cracks based on digital volumetric images and its application. Journal of China University of Mining & Technology, Vol. 43, No. 6, 2014, pp. 1134–1139.Search in Google Scholar
[50] Vogel, H. J. and K. Roth. Quantitative morphology and network representation of soil pore structure. Advances in Water Resources, Vol. 24, No. 3, 2001, pp. 233–242.10.1016/S0309-1708(00)00055-5Search in Google Scholar
[51] Ai, T., R. Zhang, J. F. Liu, X. Zhao, and L. Ren. Space-time evolution rules of acoustic emission locations under triaxial compression. Journal Of China Coal Society, Vol. 3612, 2011, pp. 2048–2057.Search in Google Scholar
[52] Yang, Q., Y. B. Yu, W. M. Cheng, X. Zhang, L. Zheng, W. T. Cui, et al. Micro-CT-based temporal and spatial evolution of fractures and pores in loaded coal. Chinese Journal of Rock Mechanics and Engineering, Vol. 41, No. S1, 2022, pp. 2626–2638.Search in Google Scholar
[53] Hu, S. B., E. Y. Wang, X. C. Li, and B. Bai. Effects of gas adsorption on mechanical properties and erosion mechanism of coal. Journal of Natural Gas Science and Engineering, Vol. 30, 2016, pp. 531–538.10.1016/j.jngse.2016.02.039Search in Google Scholar
[54] Lu, P., Z. W. Shen, G. W. Zhu, and E. C. Fang. The effective stress and mechanical deformation and damage characteristics of gas-filled coal. Journal of University of Science and Technology of China, Vol. 31, No. 6, 2001, pp. 686–693.Search in Google Scholar
[55] He, X., E. Wang, and H. Lin. Coal deformation and fracture mechanism under pore gas action. Journal Of China University of Mining & Technology, vol. 25, No. 1, 1996, pp. 6–11.Search in Google Scholar
© 2023 the author(s), published by De Gruyter
This work is licensed under the Creative Commons Attribution 4.0 International License.
Articles in the same Issue
- Review Articles
- Progress in preparation and ablation resistance of ultra-high-temperature ceramics modified C/C composites for extreme environment
- Solar lighting systems applied in photocatalysis to treat pollutants – A review
- Technological advances in three-dimensional skin tissue engineering
- Hybrid magnesium matrix composites: A review of reinforcement philosophies, mechanical and tribological characteristics
- Application prospect of calcium peroxide nanoparticles in biomedical field
- Research progress on basalt fiber-based functionalized composites
- Evaluation of the properties and applications of FRP bars and anchors: A review
- A critical review on mechanical, durability, and microstructural properties of industrial by-product-based geopolymer composites
- Multifunctional engineered cementitious composites modified with nanomaterials and their applications: An overview
- Role of bioglass derivatives in tissue regeneration and repair: A review
- Research progress on properties of cement-based composites incorporating graphene oxide
- Properties of ultra-high performance concrete and conventional concrete with coal bottom ash as aggregate replacement and nanoadditives: A review
- A scientometric review of the literature on the incorporation of steel fibers in ultra-high-performance concrete with research mapping knowledge
- Weldability of high nitrogen steels: A review
- Application of waste recycle tire steel fibers as a construction material in concrete
- Wear properties of graphene-reinforced aluminium metal matrix composite: A review
- Experimental investigations of electrodeposited Zn–Ni, Zn–Co, and Ni–Cr–Co–based novel coatings on AA7075 substrate to ameliorate the mechanical, abrasion, morphological, and corrosion properties for automotive applications
- Research evolution on self-healing asphalt: A scientometric review for knowledge mapping
- Recent developments in the mechanical properties of hybrid fiber metal laminates in the automotive industry: A review
- A review of microscopic characterization and related properties of fiber-incorporated cement-based materials
- Comparison and review of classical and machine learning-based constitutive models for polymers used in aeronautical thermoplastic composites
- Gold nanoparticle-based strategies against SARS-CoV-2: A review
- Poly-ferric sulphate as superior coagulant: A review on preparation methods and properties
- A review on ceramic waste-based concrete: A step toward sustainable concrete
- Modification of the structure and properties of oxide layers on aluminium alloys: A review
- A review of magnetically driven swimming microrobots: Material selection, structure design, control method, and applications
- Polyimide–nickel nanocomposites fabrication, properties, and applications: A review
- Design and analysis of timber-concrete-based civil structures and its applications: A brief review
- Effect of fiber treatment on physical and mechanical properties of natural fiber-reinforced composites: A review
- Blending and functionalisation modification of 3D printed polylactic acid for fused deposition modeling
- A critical review on functionally graded ceramic materials for cutting tools: Current trends and future prospects
- Heme iron as potential iron fortifier for food application – characterization by material techniques
- An overview of the research trends on fiber-reinforced shotcrete for construction applications
- High-entropy alloys: A review of their performance as promising materials for hydrogen and molten salt storage
- Effect of the axial compression ratio on the seismic behavior of resilient concrete walls with concealed column stirrups
- Research Articles
- Effect of fiber orientation and elevated temperature on the mechanical properties of unidirectional continuous kenaf reinforced PLA composites
- Optimizing the ECAP processing parameters of pure Cu through experimental, finite element, and response surface approaches
- Study on the solidification property and mechanism of soft soil based on the industrial waste residue
- Preparation and photocatalytic degradation of Sulfamethoxazole by g-C3N4 nano composite samples
- Impact of thermal modification on color and chemical changes of African padauk, merbau, mahogany, and iroko wood species
- The evaluation of the mechanical properties of glass, kenaf, and honeycomb fiber-reinforced composite
- Evaluation of a novel steel box-soft body combination for bridge protection against ship collision
- Study on the uniaxial compression constitutive relationship of modified yellow mud from minority dwelling in western Sichuan, China
- Ultrasonic longitudinal torsion-assisted biotic bone drilling: An experimental study
- Green synthesis, characterizations, and antibacterial activity of silver nanoparticles from Themeda quadrivalvis, in conjugation with macrolide antibiotics against respiratory pathogens
- Performance analysis of WEDM during the machining of Inconel 690 miniature gear using RSM and ANN modeling approaches
- Biosynthesis of Ag/bentonite, ZnO/bentonite, and Ag/ZnO/bentonite nanocomposites by aqueous leaf extract of Hagenia abyssinica for antibacterial activities
- Eco-friendly MoS2/waste coconut oil nanofluid for machining of magnesium implants
- Silica and kaolin reinforced aluminum matrix composite for heat storage
- Optimal design of glazed hollow bead thermal insulation mortar containing fly ash and slag based on response surface methodology
- Hemp seed oil nanoemulsion with Sapindus saponins as a potential carrier for iron supplement and vitamin D
- A numerical study on thin film flow and heat transfer enhancement for copper nanoparticles dispersed in ethylene glycol
- Research on complex multimodal vibration characteristics of offshore platform
- Applicability of fractal models for characterising pore structure of hybrid basalt–polypropylene fibre-reinforced concrete
- Influence of sodium silicate to precursor ratio on mechanical properties and durability of the metakaolin/fly ash alkali-activated sustainable mortar using manufactured sand
- An experimental study of bending resistance of multi-size PFRC beams
- Characterization, biocompatibility, and optimization of electrospun SF/PCL composite nanofiber films
- Morphological classification method and data-driven estimation of the joint roughness coefficient by consideration of two-order asperity
- Prediction and simulation of mechanical properties of borophene-reinforced epoxy nanocomposites using molecular dynamics and FEA
- Nanoemulsions of essential oils stabilized with saponins exhibiting antibacterial and antioxidative properties
- Fabrication and performance analysis of sustainable municipal solid waste incineration fly ash alkali-activated acoustic barriers
- Electrostatic-spinning construction of HCNTs@Ti3C2T x MXenes hybrid aerogel microspheres for tunable microwave absorption
- Investigation of the mechanical properties, surface quality, and energy efficiency of a fused filament fabrication for PA6
- Experimental study on mechanical properties of coal gangue base geopolymer recycled aggregate concrete reinforced by steel fiber and nano-Al2O3
- Hybrid bio-fiber/bio-ceramic composite materials: Mechanical performance, thermal stability, and morphological analysis
- Experimental study on recycled steel fiber-reinforced concrete under repeated impact
- Effect of rare earth Nd on the microstructural transformation and mechanical properties of 7xxx series aluminum alloys
- Color match evaluation using instrumental method for three single-shade resin composites before and after in-office bleaching
- Exploring temperature-resilient recycled aggregate concrete with waste rubber: An experimental and multi-objective optimization analysis
- Study on aging mechanism of SBS/SBR compound-modified asphalt based on molecular dynamics
- Evolution of the pore structure of pumice aggregate concrete and the effect on compressive strength
- Effect of alkaline treatment time of fibers and microcrystalline cellulose addition on mechanical properties of unsaturated polyester composites reinforced by cantala fibers
- Optimization of eggshell particles to produce eco-friendly green fillers with bamboo reinforcement in organic friction materials
- An effective approach to improve microstructure and tribological properties of cold sprayed Al alloys
- Luminescence and temperature-sensing properties of Li+, Na+, or K+, Tm3+, and Yb3+ co-doped Bi2WO6 phosphors
- Effect of molybdenum tailings aggregate on mechanical properties of engineered cementitious composites and stirrup-confined ECC stub columns
- Experimental study on the seismic performance of short shear walls comprising cold-formed steel and high-strength reinforced concrete with concealed bracing
- Failure criteria and microstructure evolution mechanism of the alkali–silica reaction of concrete
- Mechanical, fracture-deformation, and tribology behavior of fillers-reinforced sisal fiber composites for lightweight automotive applications
- UV aging behavior evolution characterization of HALS-modified asphalt based on micro-morphological features
- Preparation of VO2/graphene/SiC film by water vapor oxidation
- A semi-empirical model for predicting carbonation depth of RAC under two-dimensional conditions
- Comparison of the physical properties of different polyimide nanocomposite films containing organoclays varying in alkyl chain lengths
- Effects of freeze–thaw cycles on micro and meso-structural characteristics and mechanical properties of porous asphalt mixtures
- Flexural performance of a new type of slightly curved arc HRB400 steel bars reinforced one-way concrete slabs
- Alkali-activated binder based on red mud with class F fly ash and ground granulated blast-furnace slag under ambient temperature
- Facile synthesis of g-C3N4 nanosheets for effective degradation of organic pollutants via ball milling
- DEM study on the loading rate effect of marble under different confining pressures
- Conductive and self-cleaning composite membranes from corn husk nanofiber embedded with inorganic fillers (TiO2, CaO, and eggshell) by sol–gel and casting processes for smart membrane applications
- Laser re-melting of modified multimodal Cr3C2–NiCr coatings by HVOF: Effect on the microstructure and anticorrosion properties
- Damage constitutive model of jointed rock mass considering structural features and load effect
- Thermosetting polymer composites: Manufacturing and properties study
- CSG compressive strength prediction based on LSTM and interpretable machine learning
- Axial compression behavior and stress–strain relationship of slurry-wrapping treatment recycled aggregate concrete-filled steel tube short columns
- Space-time evolution characteristics of loaded gas-bearing coal fractures based on industrial μCT
- Dual-biprism-based single-camera high-speed 3D-digital image correlation for deformation measurement on sandwich structures under low velocity impact
- Effects of cold deformation modes on microstructure uniformity and mechanical properties of large 2219 Al–Cu alloy rings
- Basalt fiber as natural reinforcement to improve the performance of ecological grouting slurry for the conservation of earthen sites
- Interaction of micro-fluid structure in a pressure-driven duct flow with a nearby placed current-carrying wire: A numerical investigation
- A simulation modeling methodology considering random multiple shots for shot peening process
- Optimization and characterization of composite modified asphalt with pyrolytic carbon black and chicken feather fiber
- Synthesis, characterization, and application of the novel nanomagnet adsorbent for the removal of Cr(vi) ions
- Multi-perspective structural integrity-based computational investigations on airframe of Gyrodyne-configured multi-rotor UAV through coupled CFD and FEA approaches for various lightweight sandwich composites and alloys
- Influence of PVA fibers on the durability of cementitious composites under the wet–heat–salt coupling environment
- Compressive behavior of BFRP-confined ceramsite concrete: An experimental study and stress–strain model
- Interval models for uncertainty analysis and degradation prediction of the mechanical properties of rubber
- Preparation of PVDF-HFP/CB/Ni nanocomposite films for piezoelectric energy harvesting
- Frost resistance and life prediction of recycled brick aggregate concrete with waste polypropylene fiber
- Synthetic leathers as a possible source of chemicals and odorous substances in indoor environment
- Mechanical properties of seawater volcanic scoria aggregate concrete-filled circular GFRP and stainless steel tubes under axial compression
- Effect of curved anchor impellers on power consumption and hydrodynamic parameters of yield stress fluids (Bingham–Papanastasiou model) in stirred tanks
- All-dielectric tunable zero-refractive index metamaterials based on phase change materials
- Influence of ultrasonication time on the various properties of alkaline-treated mango seed waste filler reinforced PVA biocomposite
- Research on key casting process of high-grade CNC machine tool bed nodular cast iron
- Latest research progress of SiCp/Al composite for electronic packaging
- Special Issue on 3D and 4D Printing of Advanced Functional Materials - Part I
- Molecular dynamics simulation on electrohydrodynamic atomization: Stable dripping mode by pre-load voltage
- Research progress of metal-based additive manufacturing in medical implants