Flexural performance of a new type of slightly curved arc HRB400 steel bars reinforced one-way concrete slabs
-
Mei-Ling Zhuang
 ,
Fangzhi Zhu
,
Fangzhi Zhu

Abstract
In the present study, a new type of slightly curved arc HRB400 steel bars (SCAHSs) was proposed to solve the problem of temperature-induced stress loss in mass concrete structures without cutting off steel bars. The flexural performance of SCAHSs and straight HRB400 steel bars reinforced one-way concrete slabs were first experimentally investigated. Then, the effects of the shape and dimension of SCAHSs on the distribution and width of concrete cracks were analyzed and discussed. Subsequently, the synergistic tensile work characteristics between SCAHSs and concrete were presented. Finally, equations for the bearing capacity and allowable crack widths for SCAHSs in hydraulic massive structures were proposed. The test results indicated that after replacing the straight steel bars in the concrete slab with SCAHSs, the crack width of the concrete slabs increased, with the maximum crack width at the bottom of the concrete slabs increasing by a factor of 1.2–1.4. As the rise-span ratio of SCAHSs increased, the flexural stiffness of SCAHSs reinforced concrete slab decreased slightly, but the deflection increased. The allowable crack widths of SCAHSs reinforced concrete slabs under environment categories I, II, and III were 0.20, 0.17, and 0.12 mm, respectively.
1 Introduction
Mass concrete structures are common in hydraulic and hydropower projects. During construction, the temperature stress in mass concrete is relatively large. At the same time, mass concrete structures are susceptible to large temperature stresses due to the influence of external ambient temperature [1,2], leading to thermal cracks in concrete structures [3]. Therefore, wide slots are set to cast the mass concrete into blocks. The wide slots are backfilled in the later low-temperature season to form a whole. This measure has been proven to be effective in reducing and avoiding temperature cracks and is widely used in engineering [4].
There is usually steel bar passing through the wide slots. As the heat of hydration of the concrete decreases, both the concrete and the straight steel bars on both sides of the wide slot shrink. Due to the confining effect [5,6], the reinforcement will generate higher tensile stresses during construction [7], which reduces the load-bearing of the reinforcement during construction [8]. Lateral concrete also generates tensile stress and is more prone to cracking during construction [9,10]. It is common practice to cut the reinforcement across the wide slot within 24–48 h after the concrete is poured on both sides of the wide slot, and then connect it as a whole when the wide slot is backfilled later in the cold season. Typically, extruded sleeve connections and welded connections are used to connect the reinforcement. Currently, there are three ways to pass the reinforcement through wide slots, such as uncut reinforcement, cut reinforcement followed by extruded sleeve connection, and cut reinforcement followed by welded connection [11]. However, it is difficult to maneuver reinforcement through wide slots using pre-cut and post connections. It is almost impossible to implement when there are many layers of reinforcement crossing a wide slot. Therefore, how to handle reinforcement through wide slots is an urgent challenge in construction. Figure 1 shows a slightly curved arc steel bar (SCASB) without cutting off across a wide slot [12]. The SCASB across wide slot is used to accommodate the temperature deformation of the concrete on both sides of the wide slot by using the expansion and contraction of its slightly curved arc section. Due to the existence of the slightly curved arc section, its axial stiffness is less than that of the straight steel bar thus reducing the restriction on the temperature deformation of the concrete on both sides of the wide slot. But in the slightly curved arc section, stress concentration occurs at the top of the arc and at the backbend point of the SCASB, which is prone to enter into a plastic state.

Diagram of SCASB across wide slot (unit: cm).
Currently, there is no knowledge on the flexural performance of the SCASBs reinforced with concrete slabs. To promote the application of SCASBs in hydraulic and hydropower structures, the flexural performance of a new type of slightly curved arc HRB400 steel bars (SCAHSs) reinforced one-way concrete slabs was investigated. Three sets of SCAHSs reinforced concrete slab specimens and one set of straight HRB400 steel bars reinforced concrete slab specimens were first designed and fabricated. Then, the damage process of the specimens was observed through the flexural tests of the slabs. The crack expansion pattern and damage mechanism of the slabs were analyzed. The effects of the shape and dimension of SCAHSs on the distribution and width of concrete cracks were analyzed and discussed. Later, the synergistic tensile work characteristics between SCAHS and concrete were classified. Finally, equations for calculating the bearing capacity and the allowable crack width of SCAHSs in hydraulic massive structures were presented.
2 Experimental design and loading
2.1 Design and fabrication of reinforced concrete slab specimens
The design details of the two types of SCAHSs across a wide slot are shown in Figure 2. The form of the SCAHSs was 1 big arc + 2 small arc + 2 horizontal sections. The horizontal section length of SCAHSs was 100 mm. The radiuses of their arcs were different. For type I, the wide slot width of SCAHSs was 1.5 m. For Type II, the wide slot width of SCAHSs was 1.2 m. Two batches of one-way concrete slabs were designed and their flexural performance was investigated. The first batch consisted of 12 concrete slabs (specimens of sets A1–A3) and the second batch consisted of 1 slab (specimen of sets A4). The load-bearing reinforcement of the slabs of set A1 was straight HRB400 steel bar. The load-bearing reinforcement of the concrete slab specimens of A2–A4 sets were SCAHSs, which was machined in the shape and size according to the ratio of the reinforcement bars of 1:2 as shown in Figure 2. According to the rise-span of the curved section of SCAHSs, the length of the concrete slabs was taken as 2,400 mm to ensure the confining effect of the reinforcement on the concrete slab. The length-to-width ratio of a concrete slab ranged from 2 to 3. Considering the limitations of the test conditions, the width of the concrete slabs was taken as 900 mm for sets A1–A3 and 800 mm for set A4. The thickness of concrete slabs should be more than 80 mm, so the thickness of the slabs was designed as 200 mm for groups A1–A3 and 150 mm for set A4. The concrete slabs of sets A1–A3 was made of C25 and the concrete slab of set A4 was made of C30. The load-bearing reinforcement and distribution reinforcement were HRB400 steel bars with diameters of 18 and 12 mm, respectively. The design parameters of each one-way concrete slab are shown in Table 1, and the reinforcement diagram is shown in Figure 3. The whole process of fabricating the slabs was done in the component fabrication plant. Photographs of the reinforcement skeleton and formwork are shown in Figure 4. The actual dimensions of the slabs in groups A1–A3 after demolding are illustrated in Table 2. The actual dimensions of A4-a slab were 152 mm × 802 mm × 2,400 mm.

Shapes and dimensions of the SCAHSs in different sets of concrete slabs. (a) Type I for set A2 and (b) type II for sets A3 and A4.
Design parameters for reinforcement in concrete slabs
| Set no. | Specimen no. | Reinforcement type | Load-bearing reinforcement | Number of reinforcements | Distribution of reinforcement | Number of slabs |
|---|---|---|---|---|---|---|
| A1 | A1-a, A1-b, A1-c | Straight steel bars | C18@100 | 8 | C12@100 | 3 |
| A2 | A2-a, A2-b, A2-c | Type I of SCAHSs | C18@100 | 8 | C12@100 | 3 |
| A3 | A3-a, A3-b, A3-c | Type II of SCAHSs | C18@100 | 8 | C12@100 | 3 |
| A4 | A4-a | Type II of SCAHSs | C10@120 | 6 | C10@200 | 1 |
Note: C represents HRB400 steel bar.
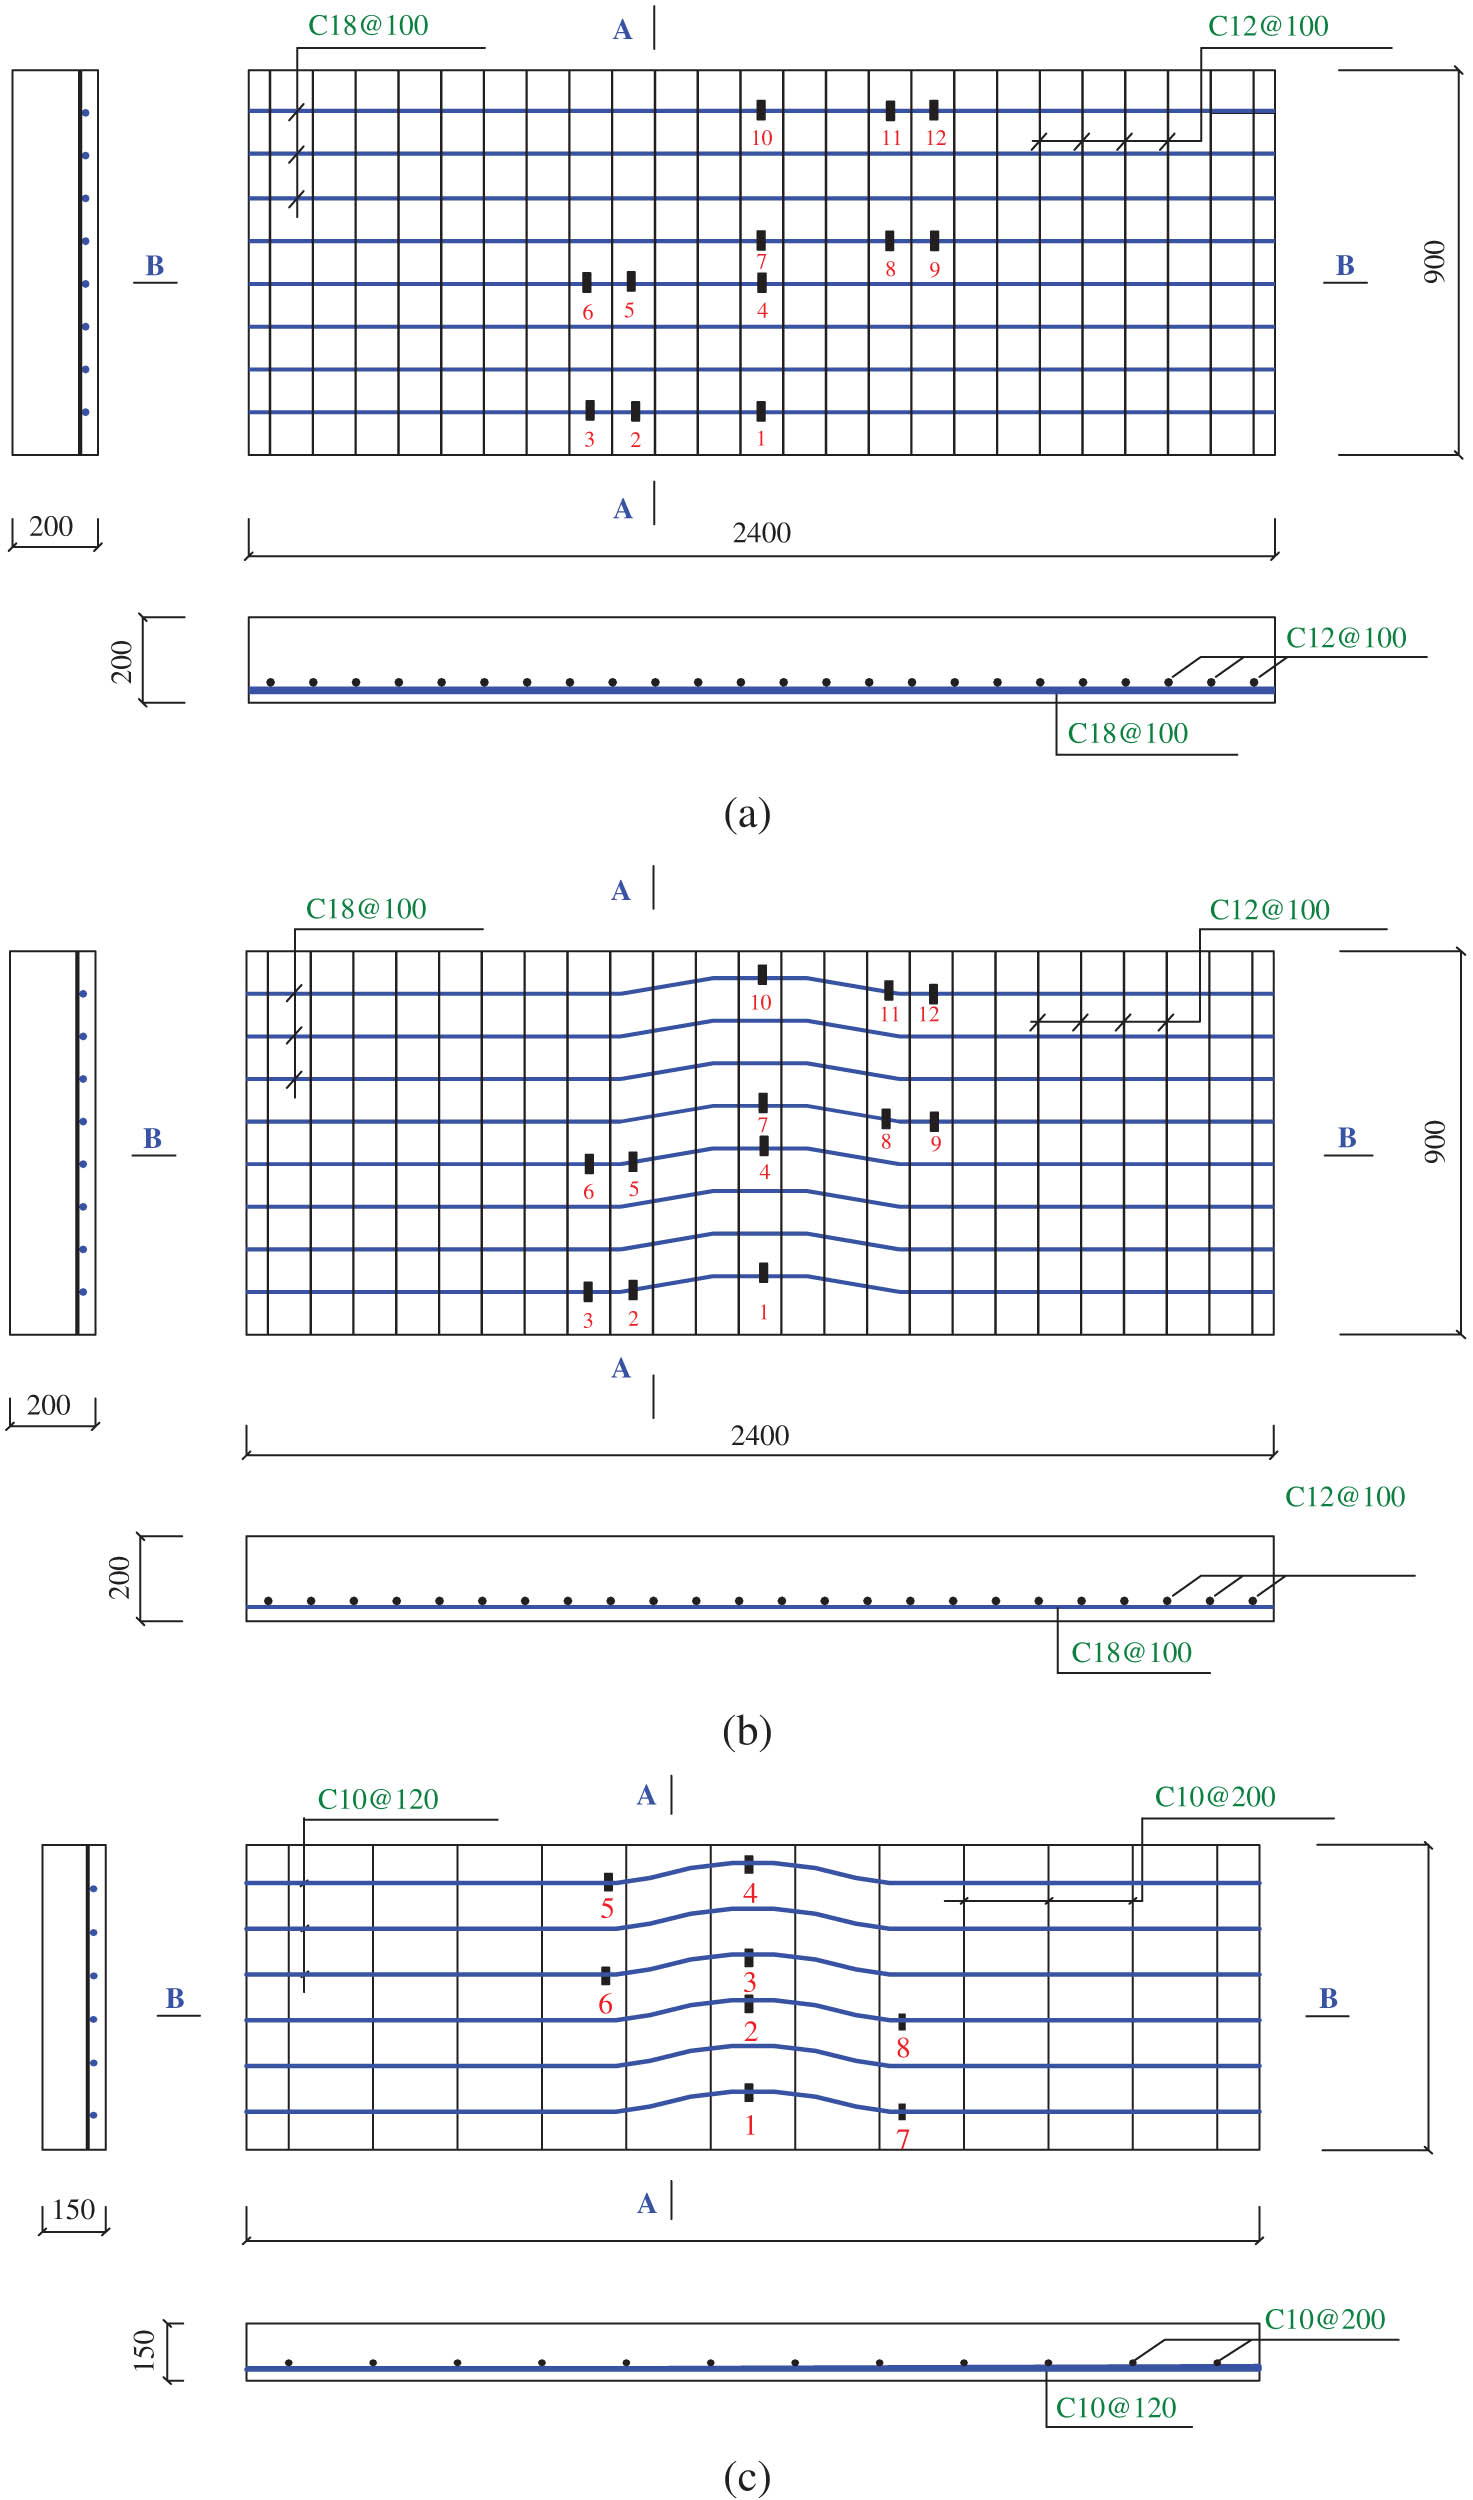
Reinforcement diagram with strain gauge arrangement (“▄” is the position of strain gauges). (a) Slabs of A1, (b) slabs of sets A2 and A3, and (c) slab of set A4.

The formwork of one-way concrete slab specimens. (a) Distribution of straight steel bars and (b) distribution of SCAHSs.
Actual dimensions of concrete slabs of sets A1–A3 (mm3)
| Specimen no. | Actual size (mm3) | Specimen no. | Actual size (mm3) | Specimen no. | Actual size (mm3) |
|---|---|---|---|---|---|
| A1-a | 220 × 910 × 2,403 | A2-a | 217 × 920 × 2,392 | A3-a | 210 × 920 × 2,415 |
| A1-b | 212 × 900 × 2,410 | A2-b | 201 × 910 × 2,402 | A3-b | 200 × 910 × 2,400 |
| A1-c | 205 × 910 × 2,400 | A2-c | 200 × 910 × 2,410 | A3-c | 200 × 905 × 2,415 |
2.2 Material properties
Nine concrete cube specimens with a volume of 150 mm × 150 mm × 150 mm were poured simultaneously with the slab concrete to determine the actual strength of the concrete at the time of testing. The specimens were cured for more than 28 days. The measured compressive strength f cu of C25 and C30 concrete cube specimens are listed in Tables 3 and 4, respectively. The axial compressive strength f c, axial tensile strength f t, and elastic modulus E c of the concrete were calculated according to Eqs (1)–(3). Three HTRB400 steel bar specimens were taken and tested according to the material test standard [13]. The yield strength f y and ultimate strength f u were 497.8 MPa and 594.5 MPa, respectively. The elastic modulus E t of HTRB400 steel bar specimens was 2.0 × 10⁵ MPa.
Strength and elastic modulus of C25 concrete (MPa)
| Measured compressive strength f cu of cube test blocks | f c (MPa) | f t (MPa) | E c | |||||||
|---|---|---|---|---|---|---|---|---|---|---|
| Test block No. | 1 | 2 | 3 | 4 | 5 | 6 | Average | |||
| Strength values | 23.7 | 25.2 | 24.0 | 25.7 | 25.3 | 26.0 | 25.0 | 19.00 | 2.22 | 2.79 × 10⁴ |
Strength and modulus of elasticity of C30 concrete (MPa)
| Measured compressive strength of cube test blocks | f c (MPa) | f t (MPa) | E c (×104) | ||||
|---|---|---|---|---|---|---|---|
| Test block no. | 1 | 2 | 3 | Average | |||
| Strength values | 37.09 | 37.95 | 38.06 | 37.70 | 28.65 | 2.92 | 3.13 |
2.3 Loading and measurement program
The loading method uses two points of symmetric loading. The arc section of SCAHSs was located between the two load points in a pure bending moment state, which ensures that the maximum crack width appeared in the arc section of the reinforcement. The location of the supports and loading points are shown in Figure 5. The test setup is shown in Figure 6. The data collected for the tests were for reinforcement strain, concrete strain, mid-span deflection, and crack distribution and width. The exact locations of the concrete strain gauges are shown in Figure 7. In Figure 7(a), 5 points of concrete strain 1–5 were used to check the assumption of the plain section. In Figure 7(b), 20 points of concrete strain 1–20 were used to check the assumption of the plain section. Strain during the test was automatically collected every 5 s by a static strain gauge system. Deflection was measured by an electronic displacement meter, which was connected to the static strain gauge for loading along with the force transducer and was collected simultaneously with the strain.

Supports and loading point locations.

Photograph of the actual loading.

Concrete strain gauge locations (“▬” is the concrete strain gauge locations). (a) Sets A1–A3 and (b) set A4.
3 Test results and discussion
3.1 Test phenomenon
3.1.1 Damage processes and failure mode
Slab A1-b was taken as an example to illustrate the damage process of the concrete slab of set A1. When loaded to 53.5 kN (approx. 0.127

Damage and cracks in slab A1-b. (a) Front side, (b) rear side, and (c) bottom.
Slab A2-a was taken as an example to illustrate the damage process of the concrete slab of set A2. When loaded to 50.0 kN (0.128

Damage and cracks in slab A2-a. (a) Front side, (b) rear side, and (c) bottom.
Slab A3-a was taken as an example to illustrate the damage process of the concrete slab of set A3. When loaded to 45.5 kN (0.128

Damage and cracks in slab A3-a. (a) Front side, (b) rear side, and (c) bottom.
When loaded to 20 kN (0.235

Damage and cracks in slab A4-a. (a) Front side (convex side of the SCAHS), (b) rear side, (c) bottom, and (d) top.
3.1.2 Crack development pattern and damage mechanism
The cracks of the slabs of set A1 first appeared in the middle of the span, while the cracks of sets A2 and A3 (SCAHS reinforced concrete slabs) first appeared near the point of counter-arc of the curved reinforcement and the concentration force point of action. Cracks in the normal section of slab A1-b were mainly concentrated in the range of 1–2 times the slab thickness and extended outward from the two concentrated force points, i.e., cracks in purely bending sections ranged in length from 2 to 4 times the slab thickness. All the cracks at the bottom of the slab extended more regularly along the direction perpendicular to the span of the slab. Slab A1-a had an asymmetrical force situation due to the uncompacted bar support at one end, so the cracks at the bottom of slab A1-a appeared to be inclined and the number of cracks on the front and rear sides differed greatly.
The number of cracks in the slabs of set A2 and set A1 was basically the same, but the crack distribution of the slabs of set A2 had two characteristics. One was that the correspondence between the cracks on the front and rear sides became worse, and the differences in sparsity and density were more obvious, where the cracks on the concave side of the SCAHSs were sparser and the cracks on the convex side were denser. The second was that the splitting occurred during crack extension in the bottom of the slab, and the rocking decreased when crack expansion increased.
The cracks at the bottom of the slabs of sets A3 (650.0 mm vector span, 54.5 mm vector height) and A2 (500.0 mm vector span, 31.8 mm vector height) were developed significantly in terms of rocking amplitude and bifurcation, and the number of cracks increased. The difference in the number of cracks between the front and rear sides of the same slab increased. This was because the force direction of the SCAHS was at a certain angle to the longitudinal direction of the slab, creating visible cracks in the SCAHS reinforced concrete slab within the curved reinforcement toward the concave and convex bends, and cracks along the SCAHS in the longitudinal direction at the bottom of the slab. The greater the vector height of the SCAHS, the more obvious this phenomenon was. In the case of straight steel bars reinforced concrete slabs, the cracks at the bottom of the slab basically developed along the transverse direction, with relatively straight distribution lines.
The cracking load of slab A4-a was 20 kN. The cracks of slab A4-a first appeared from the position of the anti-arc point of the curved arc reinforcement near the curved reinforcement on the side of the slab, and then gradually expanded to the middle of the slab along the transverse direction. Subsequently, the crack width then increased and the crack height on the front and rear sides increased, and the crack height on the rear side of the slab (the concave side of the SCAHS) was significantly higher than that on the front side (the convex outer side of the SCAHS), when the concrete area in the compression zone was smaller. When the load reached 80 kN holding load, a paracord crack appeared at the starting point in the middle of the curved arc segment of the longitudinal reinforcement. When the load reached the destructive load, two main cracks near the counter-arc point of the side arc reinforcement on the front of the slab gradually formed an inverted eight crack pattern, while the two main cracks near the anti-arc point of the curved arc reinforcement gradually formed a crack pattern of eight; holding the load, these four cracks formed a critical crack leading to damage. After unloading the loading equipment in the upper part of the slab, the critical cracks on the front and rear sides can be observed to penetrate in the upper part, indicating the formation of the damage surface (Figure 12).

Schematic diagram of damage surface of slab.
The mechanism of damage surface formation was complex and was influenced by the following three effects.
Vertical bending effect. Vertical bending moment effect, the upper part of the slab was compressed and the lower part was pulled.
Horizontal additional bending effect. When the slab was loaded, the curved arc reinforcement at the bottom of the slab had a tendency to straighten, the rear side of the slab (the concave side of the SCAHS) was under tension and the front side of the slab was under pressure.
Torsion effect. In the mid-span reinforcement arc section of the slab, the bending of the reinforcement arc caused the reinforcement rate on the rear side of the slab (the concave side of the reinforcement) to be smaller than that on the front side, and the transverse deflection of the rear side of the slab under the load was much larger than that of the front side of the slab, resulting in the tendency of the slab to turn backward. The vertical load applied on the inclined slab surface further increased this inclination, resulting in the torsional effect of backward turning of the slab at the loading point (Figure 12). In the mid-span section, the SCAHS was stretched, causing the concrete at the bottom of the slab to be subjected to horizontal extrusion force in the backward direction, and this horizontal force caused a reverse torsional effect in the middle of the slab.
At the early stage of loading, under the influence of vertical bending effect and horizontal additional bending effect, transverse cracks appeared first at the rear side of the bottom of the slab, and extended upward and forward with the increase in load. The crack direction appears to be more wavering due to the interaction between SCAHS and concrete. The torsion effect had little effect in the early and middle stages of loading. Under the effect of vertical bending, the cracks at the bottom of the slab were through. Under the effect of additional horizontal bending, the cracks on the front side of the slab developed at a height slightly behind the rear side of the slab (Figure 11(a) and (b)). In the later stage of loading, the torsional effect gradually increased and the slab was in tension on the front, rear, and bottom sides and in compression on the top side, with torsional diagonal cracks appearing on the front and rear sides, which were positioned between the mid-span and the loading point. At the bottom, on the other hand, no diagonal cracking occurred due to the bending and pulling transverse cracks that already existed in the crack-through. Under the failure load, the concrete in the top compressed zone reached the ultimate compressive strain and failed (Figure 11d).
3.2 Characteristic loads and load-mid-span deflection curves
3.2.1 Characteristic loads
The cracking load and ultimate load of each slab are listed in Table 5. Comparison of the observed cracking loads indicated that the starting cracking loads of the slabs with SCAHSs of sets A2 and A3 were lower than those of set A1, and the cracking loads of the SCAHS with higher vector heights were also lower. The reason for this was that when SCAHS were placed horizontally, the local reinforcement ratio at the edges of the convex SCAHS slabs was higher, while the local reinforcement ratio at the edges of the concave SCAHS slabs was lower, and the tensile capacity of the SCAHS reinforced slabs was lower than that of the straight reinforcement-reinforced slabs, which led to lower cracking loads in the SCAHS reinforced slabs. The longitudinal reinforcement ratio of the slabs was 1.27% and the effect of reinforcement on the cracking load was about 9%. Therefore, the decrease in cracking load was smaller for slabs reinforced with SCAHSs compared to slabs reinforced with straight reinforcement. Since all the slabs of sets A1–A3 undergo diagonal tensile damage, the ultimate loads of all the slabs were close to each other, except for slab A1-a, which was slightly higher due to the loosening of the support at one end.
Cracking and ultimate loads of each slab (kN)
| Specimen no. | A1 | A2 | A3 | A4 | |||||||||
|---|---|---|---|---|---|---|---|---|---|---|---|---|---|
| A1-a | A1-b | A1-c | Average | A2-a | A2-b | A2-c | Average | A3-a | A3-b | A3-c | Average | A4-a | |
| Cracking load | (60.0) | 53.5 | 50.5 | 52.0 | 50.0 | 43.3 | 47.5 | 46.9 | 45.5 | 42.4 | 48.5 | 45.5 | 20.0 |
| Ultimate load | (335) | 420.0 | 376.0 | 398.0 | 391.0 | 367.0 | 396.0 | 385.0 | 355.0 | 365.0 | 375.0 | 365.0 | 85.0 |
Note: The average load of the slabs of set A1 is the average load of slabs A1-b and A1-c.
3.2.2 Load–mid-span deflection curves
The load–mid-span deflection curves of the slabs are shown in Figure 13. The load–mid-span deflection curves of the three slabs of set A1 were very close to each other in the early stage of loading, and the differences were larger near the time of damage, but they were still within the normal range of material dispersion effect and test error. Slab A1-a had a lower cracking load and lower ultimate load due to the un-compacted support at one end. The patterns of slabs A1-b and A1-c were essentially similar. The load–mid-span deflection curves of the three slabs of sets A2 and A3 had similar shape and ultimate load, but there were some differences in the mid-span deflections for the same load.

Load–mid-span deflection curves. (a) A1–A3, (b) A4.
At the beginning of loading, the load–mid-span deflection curve of the A4-a plate increases linearly, with an inflection point at 20 kN, where the curve converges to the deflection axis. When the load reached between 70 kN and 85 kN, the curve fluctuated up and down, and the deflection continued to increase, but the load bearing capacity of slab A4-a stopped increasing. The cracking load, yield load, and ultimate load of the slab A4-a were 20, 65, and 85 kN, respectively. After yielding of the reinforcement, the stiffness of slab A4-a degraded less compared to the slab with straight steel bars for the same strain increment because the reinforcement was stretched obliquely. When loaded to 75 kN with a mid-span deflection of about 18.5 mm, the reinforcement entered the strengthening phase and thus the load carrying capacity increased. When loaded to 85 kN, the crack with the largest width and the longest extension developed rapidly into a critical crack under the combined effect of the positive stress caused by the bending moment and the local pressure caused by the straightening of the SCAHSs, and the reinforcement through this crack entered the strengthening phase. When the stress of the first SCAHS at the rear side reached the ultimate strength into the descending section, the load carrying capacity decreased leading to damage.
For the same load, the flexural stiffness of the slab reinforced with SCAHSs was smaller and the mid-span deflection was larger compared to the slab reinforced with straight reinforcement. The flexural stiffness of the slab reinforced with SCAHSs decreased as the vector height of the SCAHSs increased. The average mid-span deflection of the slabs of set A3 (650.0 mm vector span and 54.5 mm vector height) was about 23 mm at ultimate load, which was 53% greater than that of the slabs of set A1. This indicated that the slab reinforced with SCAHSs had a better deformation capacity than those reinforced with straight reinforcement when damage occurred in the diagonal section.
3.3 Crack spacing and width
3.3.1 Measured crack spacing
Table 6 presents the measured values of crack spacing for the purely curved section of each slab. As the vector height of the SCAHSs increased, the number of cracks increased and the average crack spacing decreased. Except for slab A1-c, the maximum crack spacing ranged from 162 to 195 mm. The minimum crack spacing for most of the slabs ranged from 50 to 60 mm. Slab A3-b showed a crack spacing of only 25 mm. This was due to an intersection angle between the tangential direction of the SCAHSs and the span direction of the slab, which reinforced the anchorage of the reinforcement along the longitudinal direction. If the vector height of the SCAHSs was greater, the tangential angle of intersection with the longitudinal span of the slab would be greater, the anchoring effect of the reinforcement along the longitudinal direction would be stronger, and the crack spacing would be smaller.
Measured crack spacing in purely curved section of each slab (mm)
| No. | Part | Measured crack spacing S | Average crack spacing S a | ||
|---|---|---|---|---|---|
| A1-a | Front side | 195, 172, 80 | 149 | 132 | — |
| Rear side | 155, 80, 120, 106 | 115 | |||
| A1-b | Front side | 103, 100, 100, 89, 105, 110, 176, 100, 156, 146, 186 | 125 | 124 | 132 |
| Rear side | 84, 125, 100, 110, 150, 136, 144, 55, 190 | 122 | |||
| A1-c | Front side | 180, 212, 110, 262, 90, 232, 100, 110 | 161 | 139 | |
| Rear side | 145, 130, 46, 210, 100, 130, 100, 102, 67, 150, 90 | 116 | |||
| A2-a | Front side | 141, 165, 85, 172, 82, 105, 100, 106, 135, 66 | 116 | 128 | 119 |
| Rear side | 190, 140, 111, 90, 133, 175 | 140 | |||
| A2-b | Front side | 90, 115, 125, 150, 120 | 120 | 122 | |
| Rear side | 170, 132, 102, 95, 103, 145 | 124 | |||
| A2-c | Front side | 97, 88, 135, 162, 131, 65, 60, 160, 147, 66, 75, 100 | 107 | 108 | |
| Rear side | 125, 155, 46, 70, 165, 90, 108, 111, 130, 90, 105 | 109 | |||
| A3-a | Front side | 175, 170, 130, 95, 50, 110, 115, 85, 100, 85 | 112 | 114 | 111 |
| Rear side | 190, 80, 130, 84, 100, 70, 45, 100, 105, 125, 160, 200 | 116 | |||
| A3-b | Front side | 100, 110, 145, 148, 75, 130, 25, 67, 31, 142, 167, 172 | 109 | 103 | |
| Rear side | 95, 110, 128, 115, 120, 87, 55, 103, 60, 77, 95, 95, 115 | 97 | |||
| A3-c | Front side | 133, 165, 25, 185, 106, 180, 58, 98, 155, 167, 97, 152 | 117 | 115 | |
| Rear side | 140, 109, 100, 97, 135, 170, 85, 115, 120, 70, 120, 80 | 112 | |||
| A4-a | Front side | 180, 125, 104, 140, 68, 98, 110, 183 | 109 | 117 | 117 |
| Rear side | 185, 85, 142, 185, 80, 115, 100, 105 | 125 | |||
3.3.2 Comparison of measured crack spacing and calculated crack spacing
In the design specification for hydraulic concrete structures (DL/T5057-2009) [14], the maximum crack width is calculated according to the following equations:
or
where
For bending members, the reinforcement stress
where
In the Design Code for Hydraulic Concrete Structures (SL191-2008) [15], the maximum crack width is calculated according to the following equation:
where
The average crack spacing of the slab reinforced with straight steel bars calculated using Eq. 6(a) in the specification DL/T5057-2009 was 120 mm. Compared with the measured crack spacing in Table 6, the calculated crack spacing was slightly less than the measured spacing of the slabs of sets A1 and A4, greater than that of the slabs of set A3, which was almost the same as the measured spacing of the slabs of set A2.
3.3.3 Variation in crack width with load
As the test was a short-term loading test, the calculated crack widths were net of the effects of long-term loading, i.e., the values calculated by the current code equation divided by an expansion factor of 1.5 for the effects of long-term loading. Comparison of the measured and calculated maximum crack widths of the slabs of sets A1–A3 are listed in Table 7. For the same load, the crack widths of the slabs reinforced with SCAHSs were larger than those of the slabs reinforced with straight reinforcement. The measured maximum crack width of the slab reinforced with SCAHSs increased as the vector height of SCAHSs increased. The measured average maximum crack widths increased to about 1.0–1.3 times for the slabs of set A2 and to about 1.0–1.5 times for the slabs of set A3 compared to the slabs of set A1. For slabs reinforced with straight reinforcement, the maximum crack width calculated using the equations from the code SL191-2008 was slightly larger than the measured average maximum crack width, indicating that the test results were credible. The maximum crack width calculated using the equations in the specification DL/T5057-2009 was smaller than the measured average maximum crack width. The maximum crack width calculated using the equations in the code SL191-2008 was close to the measured maximum crack width of the slabs of set A2 and differed greatly from those of set A3, indicating that the equations for the maximum crack width in code SL191-2008 cannot be directly applied to SCAHSs reinforced concrete slabs.
Comparison of the measured and calculated maximum crack widths of the slabs of sets A1–A3
| Load (kN) | Rebar stress (MPa) | W (mm) | W SL (mm) | W DL (mm) | ||||
|---|---|---|---|---|---|---|---|---|
| A1 | A2 | A2/A1 | A3 | A3/A1 | ||||
| 120 | 152 | 0.10 | 0.10 | 1.00 | 0.10 | 1.00 | 0.11 | 0.05 |
| 140 | 177 | 0.10 | 0.13 | 1.30 | 0.15 | 1.50 | 0.13 | 0.07 |
| 160 | 202 | 0.13 | 0.15 | 1.15 | 0.15 | 1.15 | 0.14 | 0.09 |
| 180 | 227 | 0.13 | 0.15 | 1.15 | 0.18 | 1.38 | 0.16 | 0.11 |
| 200 | 253 | 0.15 | 0.18 | 1.22 | 0.22 | 1.44 | 0.18 | 0.13 |
| 220 | 278 | 0.18 | 0.18 | 1.00 | 0.25 | 1.39 | 0.20 | 0.15 |
| 225 | 284 | 0.20 | 0.22 | 1.10 | 0.25 | 1.25 | 0.21 | 0.16 |
| 240 | 303 | 0.20 | 0.23 | 1.10 | 0.30 | 1.50 | 0.22 | 0.17 |
Note: The average crack width for the slabs of set A1is the average crack widths of slabs A1-b and A1-c; A2/A1 and A3/A1 are the measured average maximum crack width ratios for the slabs of sets A2 and A1 and sets A3 and A1 respectively; W is the average of the measured maximum crack width; W DL is the maximum crack width calculated using the equations in the specification DL/T5057-2009; W SL is the maximum crack width calculated using the equations in the code SL191-2008.
Comparison of the measured and calculated maximum crack widths for the slabs of set A4 are listed in Table 8. If it was assumed that the maximum crack width calculated using the code equations was a true reflection of the test results for the slabs reinforced with straight reinforcement, it can be seen that the maximum crack widths for the slab reinforced with SCAHSs was greater than those for the slab reinforced with straight reinforcement. The ratios of the measured crack width to the crack width calculated using the code SL191-2008 ranged from 0.9 to 1.3.
Comparison of the measured and calculated maximum crack widths of slab A4-a
| Load (kN) | W (mm) | W DL (mm) | W/W DL | WSL (mm) | W/W SL |
|---|---|---|---|---|---|
| 30 | 0.15 | 0.07 | 2.02 | 0.13 | 1.12 |
| 40 | 0.18 | 0.12 | 1.50 | 0.18 | 1.00 |
| 50 | 0.20 | 0.17 | 1.20 | 0.22 | 0.91 |
| 60 | 0.35 | 0.21 | 1.64 | 0.27 | 1.30 |
3.4 Strain distribution along the height of the cross-section
The assumption of the plain section was checked by testing the lateral concrete strains with strain gauges and hand-held strain gauges, respectively. The reason was that when cracks passed through the strain gauge they can cause damage to the gauge resulting in inaccurate test results. Strain gauge measurements were taken before the crack passed through the strain gauge and thereafter by hand held strain gauge. The strain distribution along the height of the cross section at the front side of slabs of sets A1–A3 is described in Figure 14(a)–(c). The strain distribution along the height of the cross section at the rear side of slabs of set A4 is described in Figure 14(d). When the load was small, the strain was linearly distributed along the height of the cross-section; as the load increased and the concrete in the tension zone continued to crack, the strain was not perfectly linearly distributed along the height of the cross section, but can basically be considered to satisfy the assumption of the plain section.
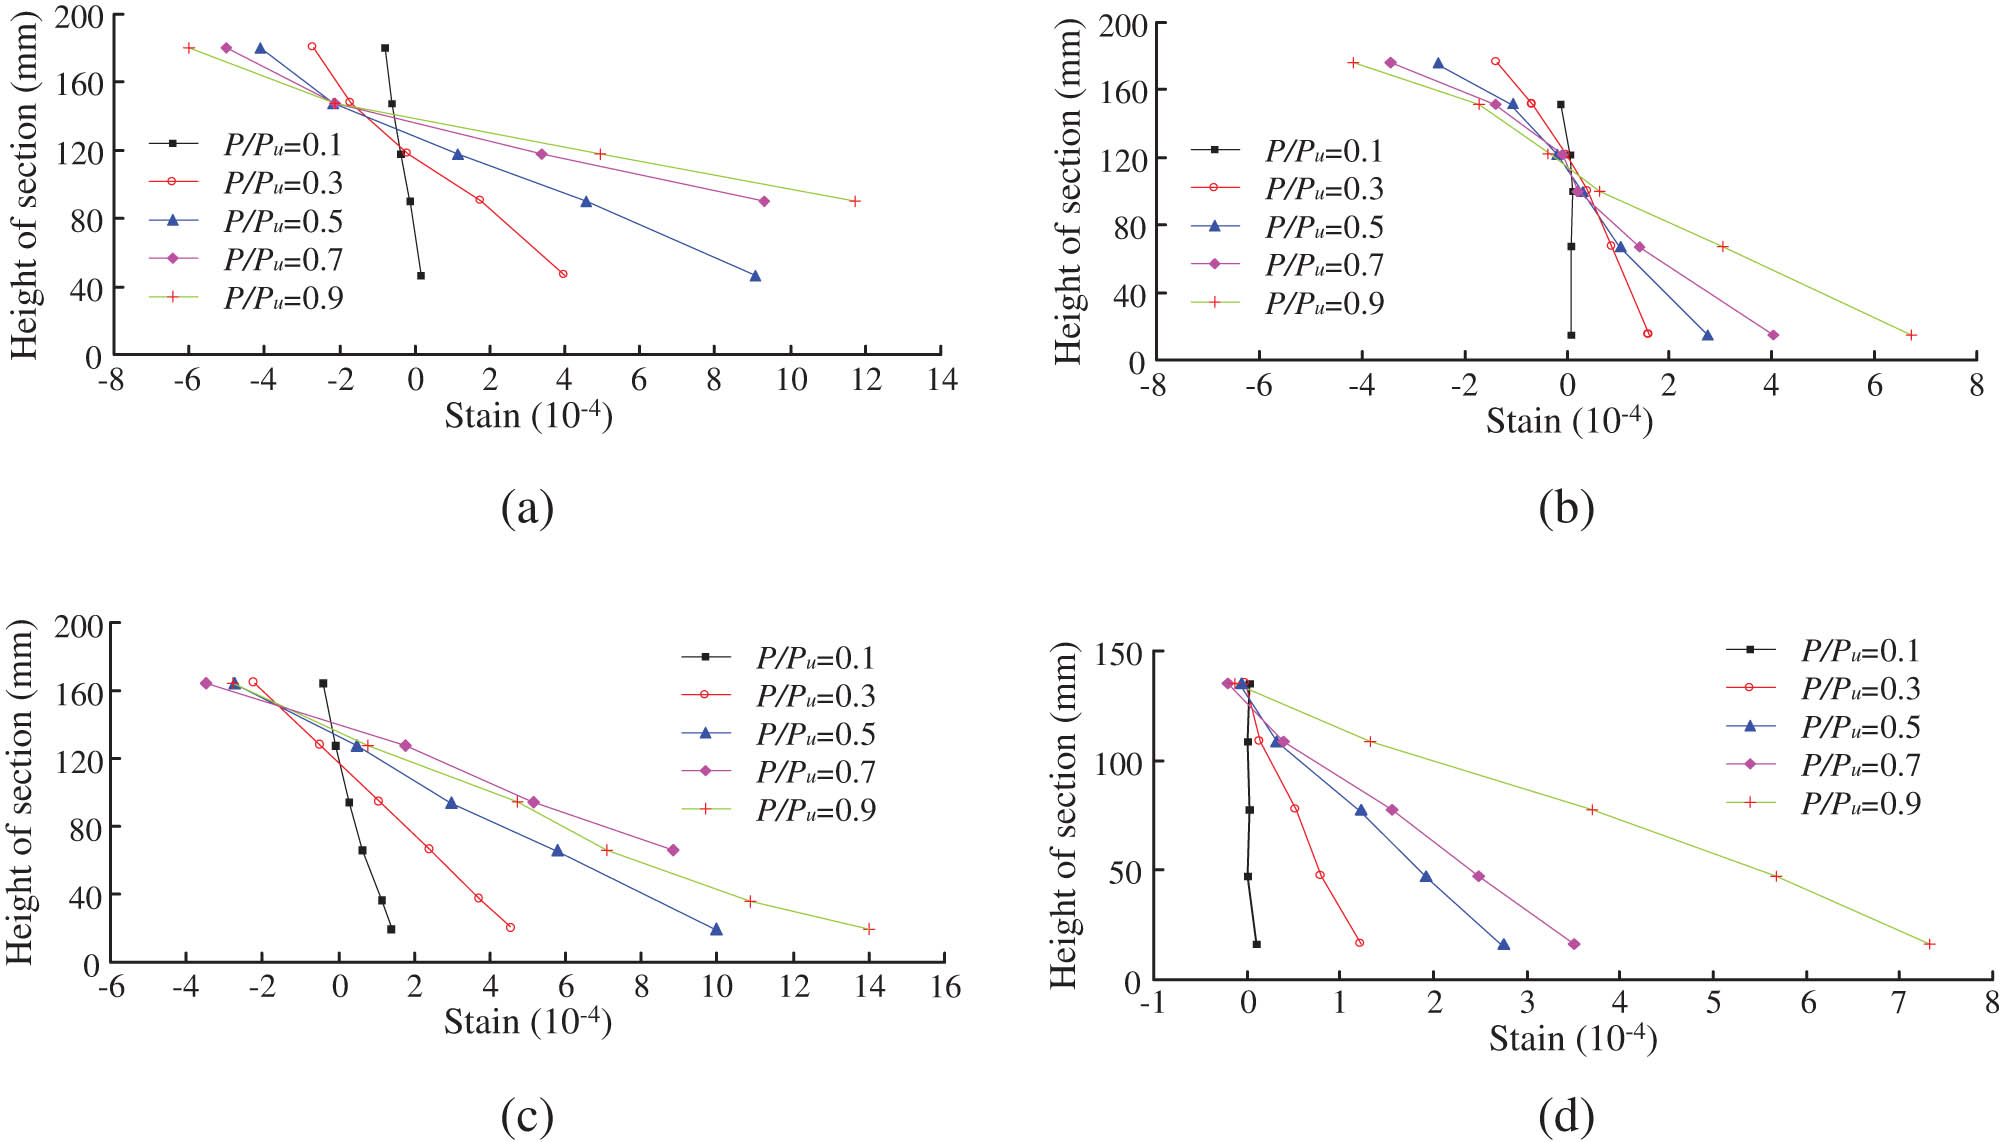
Strain distribution along the height of the cross section. (a) Slab A1-b, (b) slab A2-a, (c) slab A3-a, and (d) slab A4-a.
4 Analysis of the synergistic tensile work of the SCAHS and concrete
When working in conjunction with concrete, the force state and damage characteristics of the SCAHSs were significantly different from those of straight reinforcement. In order to further understand the force performance of the SCAHSs reinforced concrete slabs, a mechanical sketch of the SCAHSs and concrete in synergistic tension was established to analyze their working characteristics.
4.1 Tensile analysis of concrete members with a single SCAHS
The action of a SCAHS in the concrete is described in Figure 15. Let the member be l in length, b and h in section width and height, respectively, and be reinforced with a SCAHS of sagittal height

Schematic diagram of the action of a SCAHS in the concrete.
4.1.1 Additional bending moment
In axially stressed members, assuming equal strains in the section before cracking, the stress distribution in section I–I and any flat straight section II–II where the apex of the arc-shaped section of the reinforcement was located is shown in Figure 16(a). The reinforcement stress
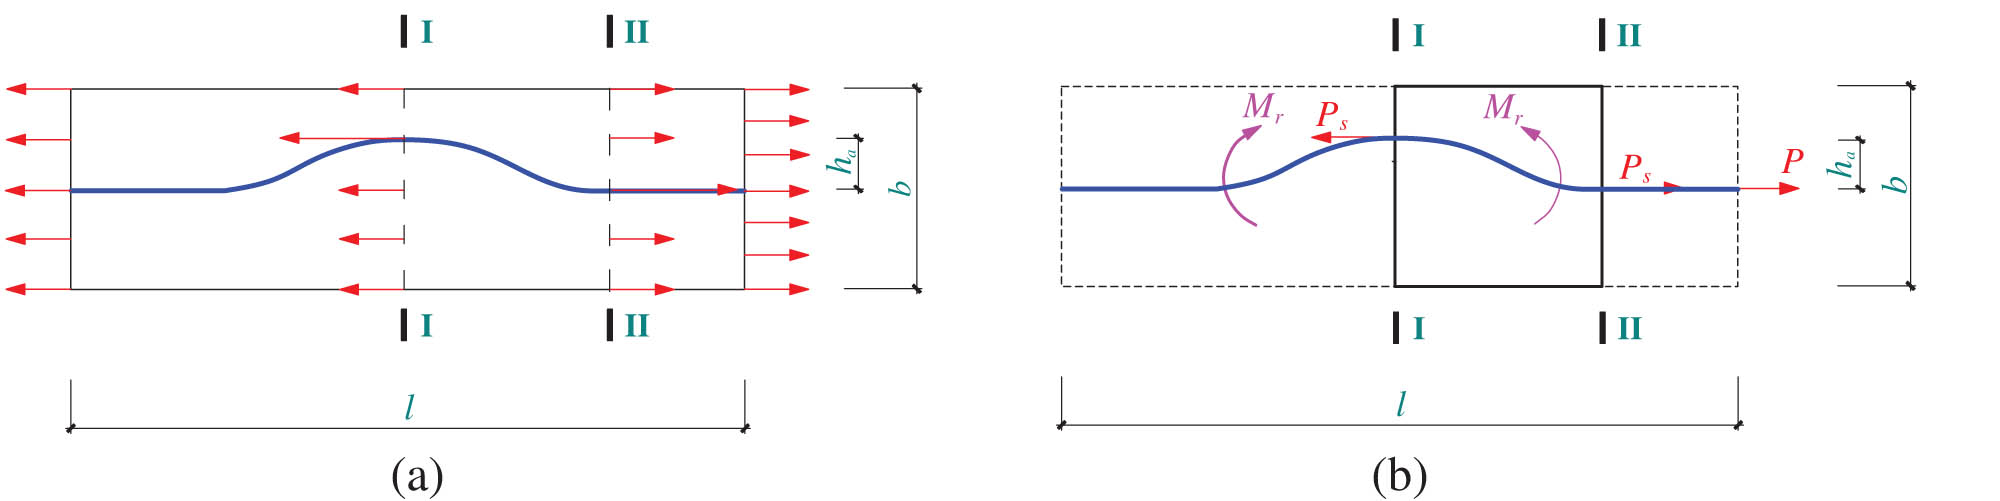
Force state of axially tensioned members with a SCAHS. (a) Axially tensioned members and (b) the curved section of the reinforcing bar.
Let
The part between sections I–I and II–II was analyzed as an isolated body (Figure 16(a)). The concrete stresses at both ends canceled each other out. The two non-coincident reinforcement tensions formed a pair of force couples, generating a bending moment
4.1.2 Cracking loads
4.1.2.1 Cracking load on the section where the arc top of the reinforcement is located
On the lower side of the member, the tensile stress from the axial tension and the tensile stress from the additional bending moment
Let the maximum tensile stress be equal to the standard value of the concrete tensile strength. Then, the cracking load
where
In the derivation of Eq. (14), the effect of the SCAHS was ignored in the calculation of the modulus of the flexural section within the direction of the additional bending moment due to the reinforcement being in the center of the section form and the small reinforcement ratio.
4.1.2.2 Cracking load on an arbitrary section of the SCAHS
As shown in Figure 17, the SCAHS was at an angle to the axial tension between the top of the SCAHS arc and the flat straight section of the SCAHS. The angle of any taken section was

Force analysis of the arc section of the SCAHS.
The maximum tensile stress after considering the superposition of the additional bending moment effect was
The cracking load equation was modified as follows:
As the section was chosen arbitrarily, the same was applied to a straight section of the SCAHS, when
4.1.3 Location of the first crack
Assume that the tensile strength of concrete in each section was the same and the first crack appeared in the section with the lowest cracking load

Sketch of height calculation at any point of the curved section.
Substituting Eq. (20) in Eq. (19), the following equation can be obtained
When
4.2 Tensile analysis of concrete members reinforced with multiple SCAHSs
4.2.1 Additional bending moment and cracking load
When a member reinforced with multiple SCAHSs was subjected to axial tension, additional bending moments need to be superimposed. If the cross-sectional area of a single reinforcing bar was still
As can be seen from the above equation, the internal forces of members reinforced with multiple SCAHS can be directly replaced by
4.2.2 Force characteristics after cracking
Compared to the concrete member reinforced with a single SCAHS, cracks in concrete members reinforced with multiple SCAHSs started at the concave side of the SCAHSs and was rapidly confined as the cracks developed into the first SCAHS, with much smaller additional bending moment effects in the SCAHSs. The section can still be cracked through because the stress from the additional bending moment was still much less than the stress from the axial tension. Similarly, after cracking, there was a tendency for the SCAHSs at the crack to be taut. The stress after taut was basically the same as that of the member reinforced with straight steel bars, but the stress state in the uncracked range of the member was still small eccentric in tension.
5 Load bearing capacity limit state stress analysis and allowable crack widths
5.1 Load carrying capacity limit state stress analysis and load carrying capacity equations
The anti-arc point section
Bringing the parameters of A4 slab (
5.2 Allowable crack widths
In hydraulic structures, curved arc reinforcement was used in mass concrete, which was a non-bar system structure, and the crack width needs to be calculated by finite element method. It was very inconvenient to model curved arc reinforcement when performing finite element analysis. If the allowable crack width of a SCAHSs reinforced concrete member can be converted to the crack width of a straight reinforcement, then hydraulic massive structures can be easily modeled by replacing the SCAHSs with the straight steel bars for finite element calculations.
In this article,
| Load (kN) |
|
Vector height 54.5 mm | Vector height 31.8 mm | ||
|---|---|---|---|---|---|
|
|
|
|
|
||
| 160 | 0.13 | 1.15 | 0.87 | 1.15 | 0.87 |
| 180 | 0.13 | 1.38 | 0.72 | 1.15 | 0.87 |
| 200 | 0.15 | 1.47 | 0.68 | 1.20 | 0.83 |
| 220 | 0.18 | 1.39 | 0.72 | 1.00 | 1.00 |
| 230 | 0.20 | 1.35 | 0.74 | 1.10 | 0.91 |
| 240 | 0.20 | 1.50 | 0.67 | 1.15 | 0.87 |
| 250 | 0.25 | 1.08 | 0.93 | 1.20 | 0.83 |
| 260 | 0.25 | 1.12 | 0.89 | 1.32 | 0.76 |
| 275 | 0.30 | 0.93 | 1.08 | 1.17 | 0.85 |
6 Conclusions
The damage process and mechanism of SCAHSs reinforced concrete slabs were analyzed by testing the flexural performance of straight steel bars and SCAHSs reinforced concrete slabs. The characteristic load, deflection, crack spacing, and crack width were calculated. Combined with the test results, the synergistic tensile work of SCAHS and concrete was analyzed. The equations for the load carrying capacity and allowable crack width of the SCAHSs were given. The main conclusions can be obtained as follows.
After replacing the straight steel bars in concrete slabs with SCAHSs, the cracking load of the concrete slabs did not change much, and the crack width of the concrete slabs increased, with the maximum crack width at the bottom of the concrete slabs increasing by a factor of 1.2–1.4. As the rise-span ratio of SCAHSs increased, the flexural stiffness of SCAHSs reinforced concrete slab decreased slightly, but the deflection increased.
When the concrete slab reinforced with the SCAHS was subjected to bending, the most dangerous cross-section was the section at the anti-arc point of the SCAHS, with maximum crack width and damage occurring near the anti-arc point of the SCAHS. The slabs reinforced with the SCAHSs with small width, strong shear, and weakly bending performed bending and torsional damage pattern, indicating that the horizontal component stresses generated by the curved reinforcement had a greater impact in the later loading stage. The reinforcement entered the strengthening phase when the concrete slab was damaged.
In hydraulic massive structures, the allowable crack widths of SCAHSs reinforced concrete members was converted to those of concrete member reinforced with straight steel bars to facilitate modeling. The allowable crack widths of concrete member reinforced with SCAHSs under environment categories I, II, and III were 0.20, 0.17, and 0.12 mm, respectively.
In the calculation of normal section load capacity, SCAHSs reinforced concrete slabs can be regarded as straight steel bars reinforced concrete slabs with a longitudinal reinforcement area of
Acknowledgments
The authors acknowledge the support by China Scholarship Council; the Natural Science Research Project of Jiangsu Province Colleges and Universities (21KJD560002), China; Suqian Natural Science Foundation Project (K202012), China; Project funded by the research and innovation team of engineering structure seismic tech-nology of Suqian University in 2020, China; Suqian City Guiding Science and Technology Plan Project (Z2020137), China; Research and Innovation Team Project of Suqian College (2021TD04), China; the Fifth Provincial Research Funding Project of “333 High-level Talent Training” in 2020 (BRA2020241), China; The Youth Fund Project of Suqian College (2023XQNA03); Natural science research project of Jiangsu Province higher education institutions, China (23KJA560007); and Jiangsu Civil Architecture Society project, China ((2023) No. 4 Item 9).
-
Funding information: This research has been supported by China Scholarship Council; the Natural Science Research Project of Jiangsu Province Colleges and Universities (21KJD560002), China; Suqian Natural Science Foundation Project (K202012), China; Project funded by the research and innovation team of engineering structure seismic technology of Suqian University in 2020, China; Suqian City Guiding Science and Technology Plan Project (Z2020137), China; Research and Innovation Team Project of Suqian College (2021TD04), China; the Fifth Provincial Research Funding Project of “333 High-level Talent Training” in 2020 (BRA2020241), China; The Youth Fund Project of Suqian College (2023XQNA03); Natural science research project of Jiangsu Province higher education institutions, China (23KJA560007); and Jiangsu Civil Architecture Society project, China ( (2023) No. 4 Item 9).
-
Author contributions: All authors have accepted responsibility for the entire content of this manuscript and approved its submission.
-
Conflict of interest: The authors state no conflict of interest.
-
Data availability statement: All data generated or analyzed during this study are included in this published article.
References
[1] Yang, B. G., P. He, G. Y. Peng, and L. Tong. Temperature-stress coupling mechanism analysis of one-time pouring mass concrete. Thermal Science, Vol. 23, 2019, p. 231.10.2298/TSCI180825231YSuche in Google Scholar
[2] Lu, X. C., B. F. Chen, B. Tian, Y. Li, C. Lv, and B. Xiong. A new method for hydraulic mass concrete temperature control: Design and experiment. Construction and Building Materials, Vol. 302, 2021, id. 124167.10.1016/j.conbuildmat.2021.124167Suche in Google Scholar
[3] Xin, J. D., Y. Liu, G. X. Zhang, Z. Wang, N. Yang, Y. Qiao, et al. Comparison of thermal cracking potential evaluation criteria for mass concrete structures. Materials and Structures, Vol. 54, No. 6, 2021, pp. 243.1–243.15.10.1617/s11527-021-01840-5Suche in Google Scholar
[4] Li, S. H., Z. Y. Wang, L. Y. Yang, X. M. Deng, and Y. Li. Study on the causes and prevention measures of cracks in high crushed concrete dams. Water Resources and Hydropower Technology, Vol. 48, No. 1, 2017, pp. 98–102.Suche in Google Scholar
[5] Chen, P. P. and G. Zhang. Study on the prevention measures and causes of cracks in arch crests of galleries in high concrete dams. Advanced Materials Research, Vol. 3149, 2014, pp. 919–921.10.4028/www.scientific.net/AMR.919-921.813Suche in Google Scholar
[6] Woo, H. M., C. Y. Kim, and J. H. Yeon. Heat of hydration and mechanical properties of mass concrete with high-volume GGBFS replacements. Journal of Thermal Analysis and Calorimetry, Vol. 132, No. 1, 2018, pp. 599–609.10.1007/s10973-017-6914-zSuche in Google Scholar
[7] Liu, X. H., C. B. Zhou, X. L. Chang, and X. Zhou. Simulation of temperature crack expansion process in mass concrete. Geotechnics, Vol. 8, 2010, pp. 2665–2676.Suche in Google Scholar
[8] Jiang, X. P., S. L. Wang, S. X. Duan, and Y. Sun. Analysis of the mechanism of temperature cracks in super-volume concrete and new countermeasures for crack control. Concrete, Vol. 12, 2007, pp. 98–102.Suche in Google Scholar
[9] Gao, F. L. and Y. W. Fang. Temperature cracks controlling technology for the mass concrete in solid sections of lower pylon column. Applied Mechanics and Materials, Vol. 467, 2013, pp. 262–269.10.4028/www.scientific.net/AMM.467.262Suche in Google Scholar
[10] Yan, L., Y. D. Wen, and W. Bo. The finite element analysis of temperature cracking propagation process of pouring mass concrete. Applied Mechanics and Materials, Vol. 302, 2013, pp. 499–501.10.4028/www.scientific.net/AMM.302.499Suche in Google Scholar
[11] Shi, W. and J. P. Hou. Temperature control performance of bulk concrete with phase change temperature control under different conditions. Journal of Construction Materials, Vol. 16, No. 6, 2013, pp. 1063–1066.Suche in Google Scholar
[12] Ma, Y. Z. Study on the contact state of reinforcement and transverse joints in the bottom slab of the upper gatehead of Tingzikou. Master’s Thesis. Hohai University, Nanjing, China, 2014.Suche in Google Scholar
[13] MOHURD (Ministry of Housing and Urban-Rural Development of the People’s Republic of China). Code for design of concrete structures (GB50010-2010), China Architecture & Building Press, Beijing, 2015.Suche in Google Scholar
[14] Power Industry Standards of the People’s Republic of China. Design specification for hydraulic concrete structures (DL/T5057-2009), China Electric Power Press, Beijing, 2009.Suche in Google Scholar
[15] Standard of Mistry of Water Resources of the People Republic of China. Design code for hydraulic concrete structures (SL191-2008), China Water & Power Press, Beijing, 2008.Suche in Google Scholar
© 2023 the author(s), published by De Gruyter
This work is licensed under the Creative Commons Attribution 4.0 International License.
Artikel in diesem Heft
- Review Articles
- Progress in preparation and ablation resistance of ultra-high-temperature ceramics modified C/C composites for extreme environment
- Solar lighting systems applied in photocatalysis to treat pollutants – A review
- Technological advances in three-dimensional skin tissue engineering
- Hybrid magnesium matrix composites: A review of reinforcement philosophies, mechanical and tribological characteristics
- Application prospect of calcium peroxide nanoparticles in biomedical field
- Research progress on basalt fiber-based functionalized composites
- Evaluation of the properties and applications of FRP bars and anchors: A review
- A critical review on mechanical, durability, and microstructural properties of industrial by-product-based geopolymer composites
- Multifunctional engineered cementitious composites modified with nanomaterials and their applications: An overview
- Role of bioglass derivatives in tissue regeneration and repair: A review
- Research progress on properties of cement-based composites incorporating graphene oxide
- Properties of ultra-high performance concrete and conventional concrete with coal bottom ash as aggregate replacement and nanoadditives: A review
- A scientometric review of the literature on the incorporation of steel fibers in ultra-high-performance concrete with research mapping knowledge
- Weldability of high nitrogen steels: A review
- Application of waste recycle tire steel fibers as a construction material in concrete
- Wear properties of graphene-reinforced aluminium metal matrix composite: A review
- Experimental investigations of electrodeposited Zn–Ni, Zn–Co, and Ni–Cr–Co–based novel coatings on AA7075 substrate to ameliorate the mechanical, abrasion, morphological, and corrosion properties for automotive applications
- Research evolution on self-healing asphalt: A scientometric review for knowledge mapping
- Recent developments in the mechanical properties of hybrid fiber metal laminates in the automotive industry: A review
- A review of microscopic characterization and related properties of fiber-incorporated cement-based materials
- Comparison and review of classical and machine learning-based constitutive models for polymers used in aeronautical thermoplastic composites
- Gold nanoparticle-based strategies against SARS-CoV-2: A review
- Poly-ferric sulphate as superior coagulant: A review on preparation methods and properties
- A review on ceramic waste-based concrete: A step toward sustainable concrete
- Modification of the structure and properties of oxide layers on aluminium alloys: A review
- A review of magnetically driven swimming microrobots: Material selection, structure design, control method, and applications
- Polyimide–nickel nanocomposites fabrication, properties, and applications: A review
- Design and analysis of timber-concrete-based civil structures and its applications: A brief review
- Effect of fiber treatment on physical and mechanical properties of natural fiber-reinforced composites: A review
- Blending and functionalisation modification of 3D printed polylactic acid for fused deposition modeling
- A critical review on functionally graded ceramic materials for cutting tools: Current trends and future prospects
- Heme iron as potential iron fortifier for food application – characterization by material techniques
- An overview of the research trends on fiber-reinforced shotcrete for construction applications
- High-entropy alloys: A review of their performance as promising materials for hydrogen and molten salt storage
- Effect of the axial compression ratio on the seismic behavior of resilient concrete walls with concealed column stirrups
- Research Articles
- Effect of fiber orientation and elevated temperature on the mechanical properties of unidirectional continuous kenaf reinforced PLA composites
- Optimizing the ECAP processing parameters of pure Cu through experimental, finite element, and response surface approaches
- Study on the solidification property and mechanism of soft soil based on the industrial waste residue
- Preparation and photocatalytic degradation of Sulfamethoxazole by g-C3N4 nano composite samples
- Impact of thermal modification on color and chemical changes of African padauk, merbau, mahogany, and iroko wood species
- The evaluation of the mechanical properties of glass, kenaf, and honeycomb fiber-reinforced composite
- Evaluation of a novel steel box-soft body combination for bridge protection against ship collision
- Study on the uniaxial compression constitutive relationship of modified yellow mud from minority dwelling in western Sichuan, China
- Ultrasonic longitudinal torsion-assisted biotic bone drilling: An experimental study
- Green synthesis, characterizations, and antibacterial activity of silver nanoparticles from Themeda quadrivalvis, in conjugation with macrolide antibiotics against respiratory pathogens
- Performance analysis of WEDM during the machining of Inconel 690 miniature gear using RSM and ANN modeling approaches
- Biosynthesis of Ag/bentonite, ZnO/bentonite, and Ag/ZnO/bentonite nanocomposites by aqueous leaf extract of Hagenia abyssinica for antibacterial activities
- Eco-friendly MoS2/waste coconut oil nanofluid for machining of magnesium implants
- Silica and kaolin reinforced aluminum matrix composite for heat storage
- Optimal design of glazed hollow bead thermal insulation mortar containing fly ash and slag based on response surface methodology
- Hemp seed oil nanoemulsion with Sapindus saponins as a potential carrier for iron supplement and vitamin D
- A numerical study on thin film flow and heat transfer enhancement for copper nanoparticles dispersed in ethylene glycol
- Research on complex multimodal vibration characteristics of offshore platform
- Applicability of fractal models for characterising pore structure of hybrid basalt–polypropylene fibre-reinforced concrete
- Influence of sodium silicate to precursor ratio on mechanical properties and durability of the metakaolin/fly ash alkali-activated sustainable mortar using manufactured sand
- An experimental study of bending resistance of multi-size PFRC beams
- Characterization, biocompatibility, and optimization of electrospun SF/PCL composite nanofiber films
- Morphological classification method and data-driven estimation of the joint roughness coefficient by consideration of two-order asperity
- Prediction and simulation of mechanical properties of borophene-reinforced epoxy nanocomposites using molecular dynamics and FEA
- Nanoemulsions of essential oils stabilized with saponins exhibiting antibacterial and antioxidative properties
- Fabrication and performance analysis of sustainable municipal solid waste incineration fly ash alkali-activated acoustic barriers
- Electrostatic-spinning construction of HCNTs@Ti3C2T x MXenes hybrid aerogel microspheres for tunable microwave absorption
- Investigation of the mechanical properties, surface quality, and energy efficiency of a fused filament fabrication for PA6
- Experimental study on mechanical properties of coal gangue base geopolymer recycled aggregate concrete reinforced by steel fiber and nano-Al2O3
- Hybrid bio-fiber/bio-ceramic composite materials: Mechanical performance, thermal stability, and morphological analysis
- Experimental study on recycled steel fiber-reinforced concrete under repeated impact
- Effect of rare earth Nd on the microstructural transformation and mechanical properties of 7xxx series aluminum alloys
- Color match evaluation using instrumental method for three single-shade resin composites before and after in-office bleaching
- Exploring temperature-resilient recycled aggregate concrete with waste rubber: An experimental and multi-objective optimization analysis
- Study on aging mechanism of SBS/SBR compound-modified asphalt based on molecular dynamics
- Evolution of the pore structure of pumice aggregate concrete and the effect on compressive strength
- Effect of alkaline treatment time of fibers and microcrystalline cellulose addition on mechanical properties of unsaturated polyester composites reinforced by cantala fibers
- Optimization of eggshell particles to produce eco-friendly green fillers with bamboo reinforcement in organic friction materials
- An effective approach to improve microstructure and tribological properties of cold sprayed Al alloys
- Luminescence and temperature-sensing properties of Li+, Na+, or K+, Tm3+, and Yb3+ co-doped Bi2WO6 phosphors
- Effect of molybdenum tailings aggregate on mechanical properties of engineered cementitious composites and stirrup-confined ECC stub columns
- Experimental study on the seismic performance of short shear walls comprising cold-formed steel and high-strength reinforced concrete with concealed bracing
- Failure criteria and microstructure evolution mechanism of the alkali–silica reaction of concrete
- Mechanical, fracture-deformation, and tribology behavior of fillers-reinforced sisal fiber composites for lightweight automotive applications
- UV aging behavior evolution characterization of HALS-modified asphalt based on micro-morphological features
- Preparation of VO2/graphene/SiC film by water vapor oxidation
- A semi-empirical model for predicting carbonation depth of RAC under two-dimensional conditions
- Comparison of the physical properties of different polyimide nanocomposite films containing organoclays varying in alkyl chain lengths
- Effects of freeze–thaw cycles on micro and meso-structural characteristics and mechanical properties of porous asphalt mixtures
- Flexural performance of a new type of slightly curved arc HRB400 steel bars reinforced one-way concrete slabs
- Alkali-activated binder based on red mud with class F fly ash and ground granulated blast-furnace slag under ambient temperature
- Facile synthesis of g-C3N4 nanosheets for effective degradation of organic pollutants via ball milling
- DEM study on the loading rate effect of marble under different confining pressures
- Conductive and self-cleaning composite membranes from corn husk nanofiber embedded with inorganic fillers (TiO2, CaO, and eggshell) by sol–gel and casting processes for smart membrane applications
- Laser re-melting of modified multimodal Cr3C2–NiCr coatings by HVOF: Effect on the microstructure and anticorrosion properties
- Damage constitutive model of jointed rock mass considering structural features and load effect
- Thermosetting polymer composites: Manufacturing and properties study
- CSG compressive strength prediction based on LSTM and interpretable machine learning
- Axial compression behavior and stress–strain relationship of slurry-wrapping treatment recycled aggregate concrete-filled steel tube short columns
- Space-time evolution characteristics of loaded gas-bearing coal fractures based on industrial μCT
- Dual-biprism-based single-camera high-speed 3D-digital image correlation for deformation measurement on sandwich structures under low velocity impact
- Effects of cold deformation modes on microstructure uniformity and mechanical properties of large 2219 Al–Cu alloy rings
- Basalt fiber as natural reinforcement to improve the performance of ecological grouting slurry for the conservation of earthen sites
- Interaction of micro-fluid structure in a pressure-driven duct flow with a nearby placed current-carrying wire: A numerical investigation
- A simulation modeling methodology considering random multiple shots for shot peening process
- Optimization and characterization of composite modified asphalt with pyrolytic carbon black and chicken feather fiber
- Synthesis, characterization, and application of the novel nanomagnet adsorbent for the removal of Cr(vi) ions
- Multi-perspective structural integrity-based computational investigations on airframe of Gyrodyne-configured multi-rotor UAV through coupled CFD and FEA approaches for various lightweight sandwich composites and alloys
- Influence of PVA fibers on the durability of cementitious composites under the wet–heat–salt coupling environment
- Compressive behavior of BFRP-confined ceramsite concrete: An experimental study and stress–strain model
- Interval models for uncertainty analysis and degradation prediction of the mechanical properties of rubber
- Preparation of PVDF-HFP/CB/Ni nanocomposite films for piezoelectric energy harvesting
- Frost resistance and life prediction of recycled brick aggregate concrete with waste polypropylene fiber
- Synthetic leathers as a possible source of chemicals and odorous substances in indoor environment
- Mechanical properties of seawater volcanic scoria aggregate concrete-filled circular GFRP and stainless steel tubes under axial compression
- Effect of curved anchor impellers on power consumption and hydrodynamic parameters of yield stress fluids (Bingham–Papanastasiou model) in stirred tanks
- All-dielectric tunable zero-refractive index metamaterials based on phase change materials
- Influence of ultrasonication time on the various properties of alkaline-treated mango seed waste filler reinforced PVA biocomposite
- Research on key casting process of high-grade CNC machine tool bed nodular cast iron
- Latest research progress of SiCp/Al composite for electronic packaging
- Special Issue on 3D and 4D Printing of Advanced Functional Materials - Part I
- Molecular dynamics simulation on electrohydrodynamic atomization: Stable dripping mode by pre-load voltage
- Research progress of metal-based additive manufacturing in medical implants