Impact of COVID 19 on the demand for an inventory model under preservation technology and advance payment facility
-
Ali Akbar Shaikh
 ,
Adel Fahad Alrasheedi
,
Adel Fahad Alrasheedi

Abstract
Due to the COVID-19 epidemic, human civilization and the corporate world confront unfathomable risks to their continued existence on the planet. People all over the world are losing employment or seeing their incomes diminish due to the COVID-19 virus influence. As a result, its influence has a direct effect on the purchasing ability of consumers. When a customer’s purchasing capability is diminished, his desire for items decreases. Again, retailers or suppliers of deteriorative goods face a risk in this uncertain environment, since deteriorative products have a limited shelf life. They should have an appropriate business strategy in this circumstance to maintain their commercial profession. Taking all of these factors into account, an inventory model is created that incorporates the COVID-19 influence on consumers’ demand for perishable commodities with preservation capability. Customers are granted a partial trade credit term to enable them to sell the items on time. The proposed model is very intricate and not amenable to an analytical solution. Two numerical cases are explored and solved to demonstrate the proposed model’s practical usefulness. The eigenvalues of that numerical example are determined to demonstrate that the Hessian matrix is positive definite, i.e., to determine the average cost function’s convexity. Finally, we do a post-optimality study to find out how different inventory characteristics affect the best policies.
1 Introduction
Inventory, or stock, refers to goods and materials. Finished, semi-finished, and unfinished goods come under this category. The final aim of inventory is to merchandise, make, or use. We are all dependent in our society, directly or indirectly, on inventory. On the other hand, inventory management is predominantly concerned with the structure and arrangement of stored commodities. Therefore, proper control or management of goods in a store is essential because they deteriorate from time to time. Vegetables, meat, fish, eggs, fruits, grains, medicines, furniture, electronic products, chemicals, and a variety of other products deteriorate or deteriorate over time. Business industries and human civilization are currently in very bad situations due to the COVID-19 pandemic. All countries globally face the impact of the COVID-19 pandemic situation, and they are trying to recover their financial conditions with the help of industries. However, during this period, lots of people lose their jobs. Also, customers are losing their ability to buy the product. From 2020 to 2021, almost all companies and industries are suffering from the devastative negative impact of COVID-19. Almost all countries observe negative gross domestic product growth in their economies. In this uncertain situation, discussing the impact of COVID-19 on market demand and analyzing the appropriate plans or business strategies of manufacturers, suppliers, or retailers will be very helpful to survive the critical situation. In this connection, some important reports are presented here. Paul and Chowdhury [1] planned the recovery of a production supply chain during the COVID-19 pandemic situation. Li et al. [2] implemented a framework and impact assessment in an intelligent manufacturing system during the COVID-19 pandemic. Furthermore, Burgos and Ivanov [3] analyzed digital twin-based impact and resilience in a food supply chain model considering the uncertain and negative situation of the COVID-19 pandemic. Again, Ivanov and Dolgui [4] introduced the operations research method to study the ripple effect in supply chains during the COVID-19 pandemic. After that, Shahed et al. [5] integrated a supply chain disruption risk mitigation model to reduce the COVID-19 pandemic risk. Paul et al. [6] discussed supply chain recovery challenges in COVID-19 situations. During COVED-19, Ivanov [7] generalized four major adaptation strategies for supply chain recovery challenges. Furthermore, Sarkar and Sana [8] analyzed an e-healthcare system for disease prediction. Moheimani et al. [9] assessed the preparedness of hospitals during the COVID-19 pandemic situation using the rough set theory. Again, Moheimani et al. [10] assessed the agility of hospitals in a disaster situation. Recently, Premarathna et al. [11] developed a model related to predicting the number of COVID-19 infected people in a country like Sri Lanka. In inventory management, a few factors, like demand patterns and deterioration rates of perishable items, play very important roles in the optimal policy of the inventory system. Demand for any product depends on various factors like selling price, freshness period, stock level, certain discount offers, service involved in the products, and quality of the items. As usual, for perishable items, the demand for the best or fresh products is always high in the market, so, keeping an eye on the fact cited here, traders follow numerous approaches to take care of their products. Hence, the minimization of deterioration and the maximization of the aliveness of products depend solely on proper care or preservation techniques. In fact, cold storage is set up by the government for the long-term storage of deteriorative products. A number of research works have been developed by several researchers in the area of inventory problems of perishable items under the adaptation of preservation technology. In their research, they have focused on preservation facilities to reduce deterioration. In this connection, Dye and Hseigh [12] investigated an effective preservative facility-based inventory model for the deteriorating item. Then, Dye [13] studied the impact of a preservation-based non-instantaneous decaying purchasing model. After that, Tayal et al. [14] proposed a supply chain system in the two-echelon system for decaying items with the effect of preservation investment. Then, Yang et al. [15] studied the dynamic credit facility and preservation investment. Singh et al. [16] proposed a stock-dependent demand-related inventory model for decaying items with preservation investment. Giri et al. [17] studied a preservation facility-related vendor–buyer chain system model for decaying inventory with a time-dependent rate of deterioration. Mohanty et al. [18] designed a credit facility-related purchasing model for decaying items with preservation facilities. Shaikh et al. [19] developed a time-dependent demand and credit facility-related inventory model for decaying items with preservation facilities. Priyambada et al. [20] studied preservation investment and price- and stock-dependent demand-related purchasing models for decaying items. Wholesalers and retailers always want to attract more customers to purchase their products. In this regard, various offers are provided. The credit system is one of them, and trade credit boosts the purchasing capacity of customers, i.e., services without immediate payment. This policy helps enhance the demand and attract customers. The researcher emphasized credit facility/advance payment with discount facility/all unit discount facility and introduced different types of inventory models. A researcher like Ho [21] developed an integrated policy in an inventory system under the credit facility of the retailers; similarly, Teng et al. [22] studied a non-decreasing demand-linked inventory model under a credit financing facility. Again, Teng et al. [23] developed a credit-linked order quantity-related purchasing model under a two-level credit facility. Similarly, Pal et al. [24] studied a purchasing model related to credit facilities for three different stages. Yadav et al. [25] proposed an inflation-impacted purchasing system in a fuzzy environment and optimized the retailer’s ordering policy. Rameshwari and Uthayakumar [26] investigated a two-level credit facility-related integrated inventory model for decaying items whose demand is dependent on price, and Khan et al. [27] studied an advance payment-linked two-warehouse purchasing model for decaying items. Shaikh et al. [28] designed a stock-dependent demand and partially backlog-related purchasing model for decaying items with a unit price discount. Panda et al. [29] developed a price- and stock-dependent demand-related purchasing model and introduced a credit facility in a two-storage system. Khan et al. [30] established an advance payment and backlog-related inventory model in a two-storage system. Khan et al. [31] discussed the effect of an advance payment on price- and a stock-dependent demand-linked inventory model. Khan et al. [32] designed a purchasing model for decaying items with advance payment and demand that is dependent on the advertisement and selling price. Khan et al. [33] developed an advance payment linked to an order-related purchasing model for decaying items under the capacity constraint of the system. Rahman et al. [34] introduced an advance payment and preservation investment-related inventory model for decaying items whose demand is dependent on price and stock. Das et al. [35] created a partial credit facility-based production with the item’s reliability in mind.
Since the COVID-19 epidemic, human civilization has never faced a worst situation than it does right now. It has a massive effect on daily human life as well as the business world. People are losing their buying capacity due to the financial crisis caused by the COVID-19 pandemic. Therefore, it badly affects the demand for the product. In addition, post-COVID-19 recovery time, its impact continues on or until the stable condition of the world is restored. With this in mind, an inventory model with the COVID-19 influence on demand at a preservation facility is studied. Shortages are allowed partially with customer waiting time. The objective function of the average cost (AC) of the proposed model is highly nonlinear with respect to its decision arguments and thus cannot be solved analytically. From this point of view, MATHEMATICA software is used to solve the proposed model with the help of a numerical example. Pairwise convexity of the objective function is presented for four decision variables to ensure the convexity of the objective function. Thereafter, the Eigenvalue is to be found concerning that numerical example to show that the Hessian matrix is positive-definite. Finally, a post-optimality analysis is conducted to show the impact of different parameters.
1.1 Research questions and the importance of the topic
The corporate world is facing unprecedented dangers to its survival in the present pandemic environment. People are losing employment or seeing their income drop as a result of the COVID-19 virus’s influence. As a result, its influence has a direct effect on the purchasing ability of consumers. When a customer’s purchasing capability is diminished, the customer’s desire for items decreases. Now several pertinent questions emerge, as detailed below:
How can we mathematically represent this situation?
How can we convey demand in the current context?
How to develop an effective business plan for deteriorating goods that exposes merchants to the least amount of business risk possible?
At what pace should preservation technologies be deployed to maximize income generation?
Answers to the aforementioned questions are the main contribution of this manuscript. We derived it in the following section.
1.2 Research gap and contribution
COVID-19 had an impact practically on all nations between 2020 and 2021. At the start of 2020, the majority of nations were fully isolated. Industries have ceased operations as a consequence of the pandemic’s devastating effect. Apart from a few areas (medical, food, etc.), practically all commercial sectors have lost demand for goods as a result of the COVID-19 pandemic condition. Almost all sectors have increased their lockdown durations in response to the catastrophic crises occurring around the world. People are losing their employment as a result of unforeseen circumstances. The purchasing power of the consumers’ demand decreases. Nonetheless, we are moving through the COVID-19 scenarios. Contextualizing these facts following a thorough review of the existing literature (cf. Table 1), a research gap was identified, and namely, no literature existed regarding the combined business strategies of preservation technology and advanced payment policies in the perishable item business in light of the COVID-19 pandemic situation. In this research, we assumed that COVID-19 has a negative effect on consumers’ demand rates, which is a highly nonlinear function of its effects. In addition, to ensure the timely sale of deteriorated products and to entice buyers, the related stores give partial trade credit to their clients. Again, merchants use preservation technologies to slow the decay of deteriorative merchandise. Thus, the manuscript’s significant contributions are summarized as follows:
Existing literature related to the proposed work
| Reputed works | Type of model | Impact of COVID-19 | Customers’ demand | Deterioration | Preservation technology | Credit policy |
|---|---|---|---|---|---|---|
| Jaggi et al. [36] | EOQ1 | × | Constant | Constant | × | × |
| Prasad and Mukherjee [37] | EOQ | × | Stock and time dependent | Time dependent | × | × |
| Mishra et al. [38] | EOQ | × | Price and stock dependent | Preservation investment dependent | √ | × |
| Rameswari and Uthayakumar [39] | EOQ | × | Price dependent | Constant | × | √ |
| Pramanik and Maiti [40] | EOQ | × | Time dependent | Constant | × | √ |
| Shaikh et al. [41] | EOQ | × | Time dependent | Preservation investment dependent | √ | √ |
| Rapolu and Kandpal [42] | EOQ | × | Selling price and advertisement frequency dependent | Time and preservation investment dependent | √ | √ |
| Paul and Chowdhury [1] | Supply chain | √ | Constant | — | × | × |
| Das et al. [43] | Economic production quantity (EPQ) | × | Price, time, and specific absorption rate level dependent | × | × | × |
| Alkahtani et al. [44] | Supply chain | √ | Emergency level of COVID-19 dependent | -- | × | -- |
| Das et al. [45] | EPQ | × | Price, stock, and replacement period dependent | × | × | × |
| Cao et al. [46] | Bi-level | × | × | × | × | × |
| Das et al. [45] | EPQ | × | Price dependent | × | × | × |
| Gao and Cao [47] | Multi-objective | × | × | × | × | × |
| Duary et al. [48] | EOQ | × | Price, time, and frequency of advertisement dependent | Constant deterioration | × | √ |
| Gao et al. [49] | Robust | × | √ | × | × | × |
| This work | EOQ | √ | Influenced by COVID-19 | Preservation investment dependent | √ | √ |
1Economic order quantity.
The COVID-19 pandemic situation had a negative impact on demand.
The applied rate of preservation is an exponential function of preservation investment.
The discount facility was offered to the customers during the COVID-19 pandemic situation to attract more customers.
A rough business strategy for the deteriorative products has been performed, and optimal decisions have been obtained.
2 Problem description, notation, and assumptions
2.1 Problem description
This work develops an inventory model for perishable goods that incorporates the effect of COVID-19 on client demand. Here, the provider invests in preservation technology for the items, lowering the pace of degradation and treating the rate of preservation applied to the products as an exponential function of the preservation cost. In addition, the provider allows consumers to pay the whole purchase price on or before the designated time M . If the customer pays the whole purchase price within that period, the supplier gives a specific percent discount (r percent) on the total purchase price. To take advantage of this sort of deal, the purchaser must have a significant quantity on hand. Occasionally, the buyer has a limited amount of cash on hand, and to use this facility, he or she borrows the cash from the bank at a certain rate of interest. All payments should be made in advance of getting the merchandise. As a result, the discount amount becomes the buyer’s capital, which may be used to place further orders or to return the borrowed sum. The suggested inventory model is based on this principle.
2.2 Notation
To demonstrate the inventory model, the following symbols and assumptions are taken into account.
| Symbols | Units | Description |
|---|---|---|
| I 1(t) | Unit | Stock level during 0 ≤ t ≤ t 1 |
| I 2(t) | Unit | Stock level during t 1 < t ≤ T |
| D 2 | Unit | Original demand of the market |
| D 1 | Unit | Demand during the pandemic of COVID-19 |
| θ | — | Deterioration rate |
| K 0 | $/Order | Ordering cost of a lot |
| c i | $/Unit | Per unit purchase cost |
| c 0 | $/Unit | COVID-19 cost for losing the demand of the item |
| c h | $/Unit/time unit | Carrying cost |
| x | — | COVID-19 influence factor on demand |
| M | Time unit | Offered time period to pay the full amount of purchasing cost |
| c b | $/Unit | Stockout cost |
| c l | $/Unit | Opportunity cost per unit |
| η | Constant | Backlogging rate |
| I e | $/Time unit | Interest rate on loan amount |
| r | % | Percentage of discount offered by the vendor to the buyer |
| S | Units | Initial inventory level |
| R | Units | Highest shortage level at the end of the cycle |
| Q = S + R | Units | Total lot size in a cycle |
| TC(σ, p, t 1,T) | $ | The cost of the system |
| π(σ, p, t 1,T) | $/Time unit | The AC per unit time |
| Decision variables | ||
| t 1 | Time unit | Time point at which inventory level reduces to zero |
| T | Time unit | Cycle length |
| σ | $/unit | Preservation cost per unit |
| x | $/unit | COVID-19’s influence on demand |
2.3 Assumptions
The proposed inventory model is formulated for single deteriorating product with COVID-19-effected demand of the current marketing situation and the demand pattern mathematically represented as D 1 = D 2(1 − cov − 19 f ), where cov − 19 f = {1 − c (x + a)−b } provided a, b < 0 and 0 < c < 1. If the COVID-19 influences disappear, then post-COVID-19 impact is also available, and also if the COVID-19 impact is high, then the demand of the market should be zero, i.e.,
The deterioration rate θ(0 < θ ≪ 1) is constant.
Preservation technology is applied with the rate m (σ) = (1 − e −ασ ).
Supplier offers credit period M to the buyers at which buyer must pay the full purchasing amount of the item. If the buyer pays the full purchasing amount within the time M, then he/she gains r percentage of discount on the total purchasing amount at the time of payment.
Shortages are partially backlogged with backlogging rate
The inventory planning horizon is infinite, and no replacement facility is available for the deteriorated products.
3 Model formulation
Initially, the buyer places an order Q = (S + R) units during the pandemic COVID-19 situation to his/her vendor. It is assumed that the original demand for the product before the pandemic be D
2. Due to COVID-19 influence, the demand reduces to D
1, and the governing differential equations of the customers are satisfied with the rate of D
1. The inventory level gradually declines due to COVID-19 impact on demand and deterioration, and finally, it reaches zero level at time t = t
1. After that, shortages appear and the system and customers wait for the next lot with the rate
with the conditions I 1(0) = S and I 1(t 1) = 0. Solving Eq. (1) and using I 1(t 1) = 0, we obtain
with the conditions I 2(t 1) = 0 and I 2(T) = −R.
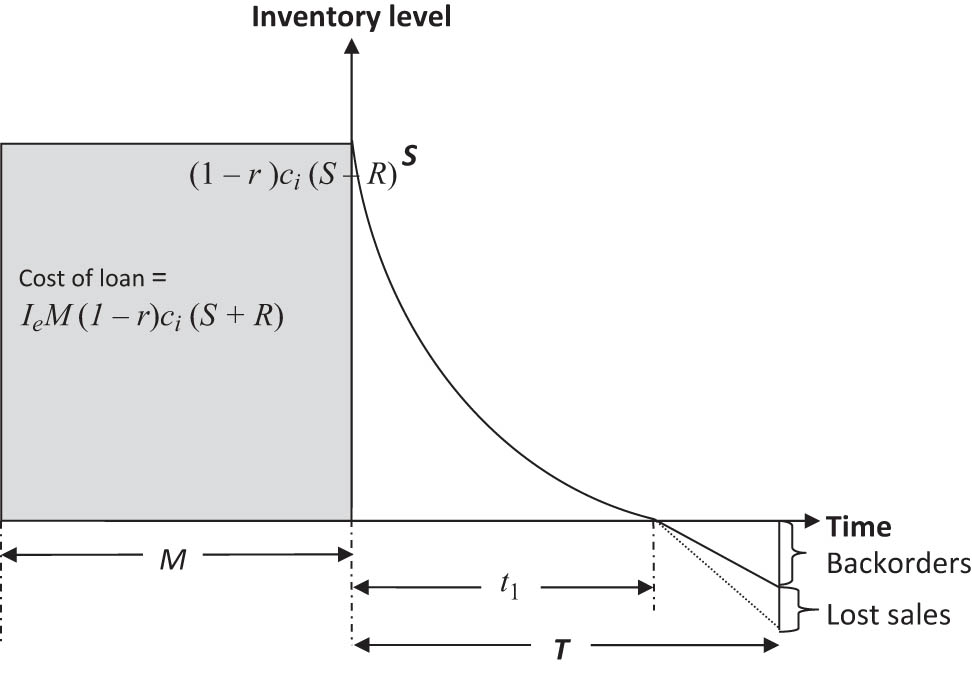
Graphical representation of purchasing model.
Now, using the condition I 1(0) = S, the initial inventory level is given as follows:
From Eq. (3) with I 2(T) = −R, we have
With the help of I 2(t 1) = 0, the maximum shortage level is calculated as
So, the total amount of the product to be placed in order is (S + R) units in a single lot. Based on the amount of the order, the buyer must pay the amount c i (S + R). As per the offer provided by the vendor to his/her retailers, he/she must pay the amount c i (S + R) on the time M in advance. If he/she is able to pay that much amount in advance, then the vendor offers r percent discount on the total purchasing amount. To avail this offer, the buyer must pay the purchasing amount and interest of the loan amount for borrowing from the bank, and those amounts are (1 − r)c i (S + R) and I e M(1 − r)c i (S + R), respectively.
The cost components related to the model are calculated as follows:
Ordering cost: K o .
Purchasing cost (PC): (1 − r) c i (S + R).
Holding cost (HC):
Cost of loan (COL): I e M(1 − r)c i (S + R).
Shortage cost (SC):
Opportunity cost (OC):
Preservation technology cost (PTC) = σT.
COVID-19 cost for reducing demand (C19C) = c 0(D 2 − D 1)T.
Hence, the total cost of the system is given as follows:
Hence, the cost per unit time is
Therefore, the optimization problem corresponding to the model can be written as
Clearly, the objective function (11) is highly nonlinear with four decision variables. Therefore, it cannot be solved analytically. Due to this reason, MATHEMATICA software is used to solve the problem.
4 Numerical illustration
To justify the proposed model, a numerical example is taken into the consideration to solve the proposed model.
Example 1
The values of various input parameters corresponding to the model are given as follows:
The values of the aforementioned parameters are real. However, these values are not collected from any case study in the existing inventory system. For solving this example with respect to the given hypothetical data, MATHEMATICA wolfram 11.1 software is used, and it is coded on a seventh-generation Laptop in Windows 10 environment having an intel core i-3, 2.40 GHz processor. The optimal results are summarized in Table 2.
Optimal results corresponding to Example 1
| Decision variables (AC) | Optimal results |
|---|---|
| Preservation cost (σ) | $11.58/month |
| COVID-19 factor (x) | 2.0035 |
| Time during inventory level reduces to zero (t 1) | 10.4537 months |
| Business period (T) | 10.5037 months |
| AC π(σ, t 1, T, x) | $2140.28/month |
The convexity of AC for Example 1 with respect to decision variables (σ, x, t 1, T) is shown, respectively, in Figures 2–7. These figures are drawn in 3D space with respect to two decision variables, while the third and fourth decision variables are held constant at their optimal values.
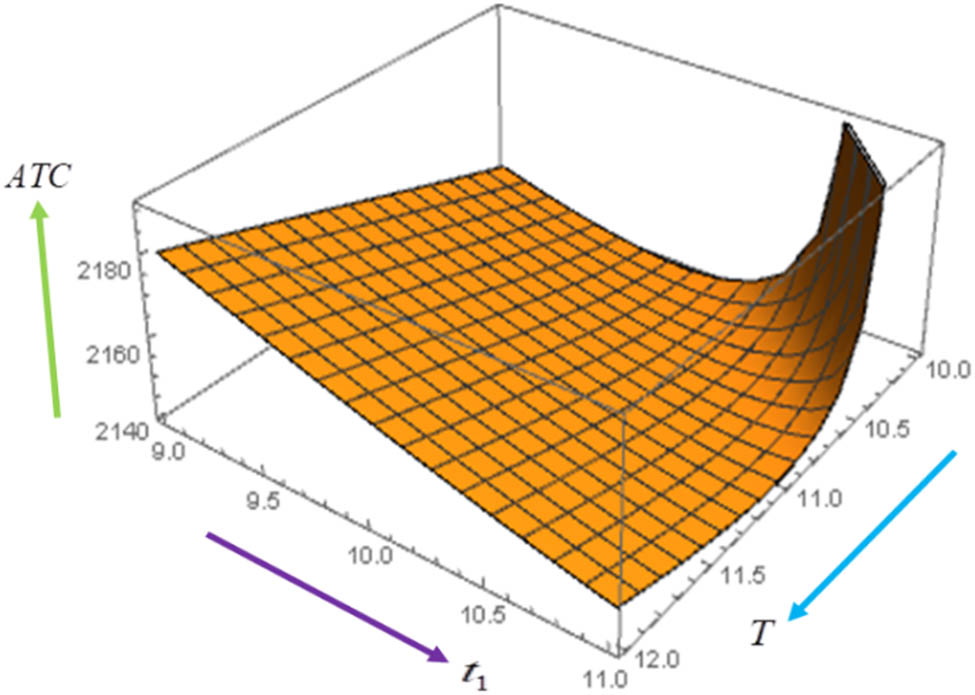
Convexity of AC π(σ, t 1, T, x) with respect to (t 1, T).
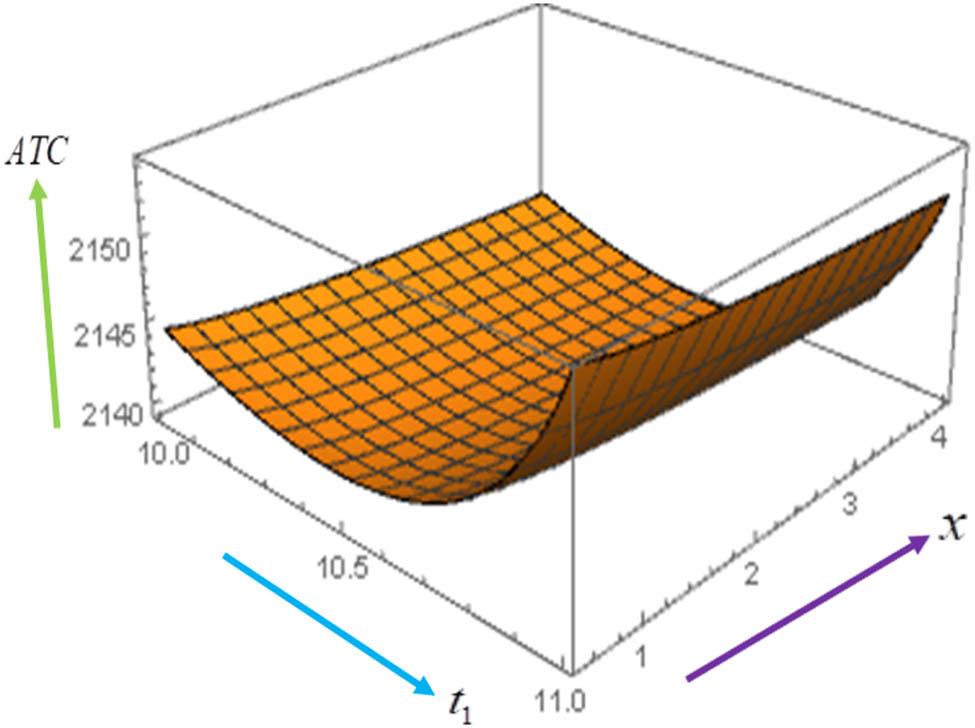
Convexity of AC π(σ, t 1, T, x) with respect to (t 1, x).
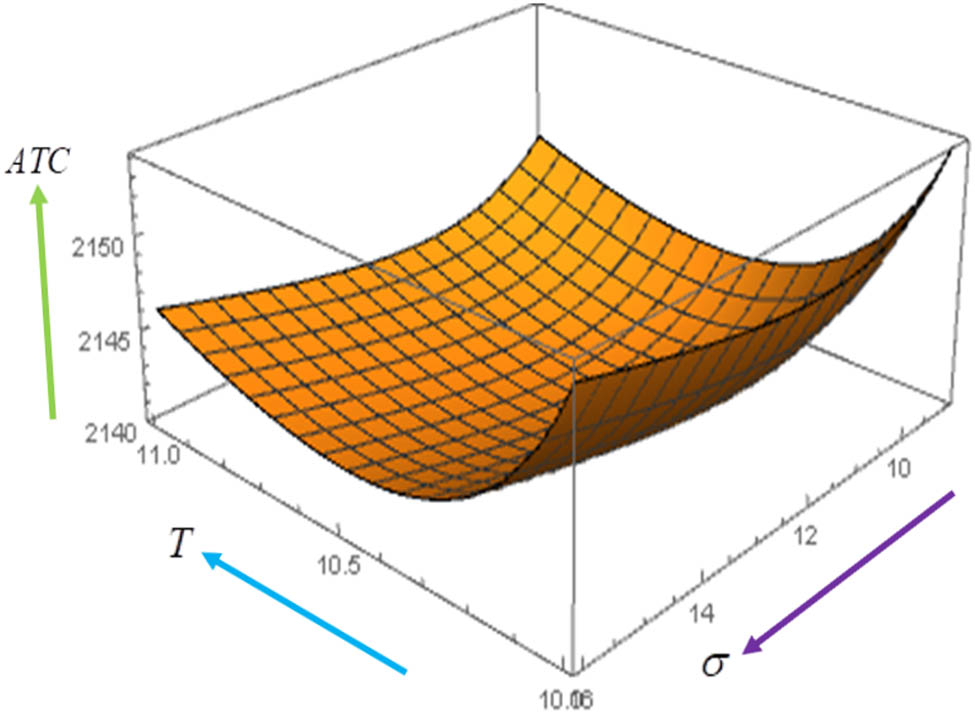
Convexity of AC π(σ, t 1, T, x) with respect to (σ, T).
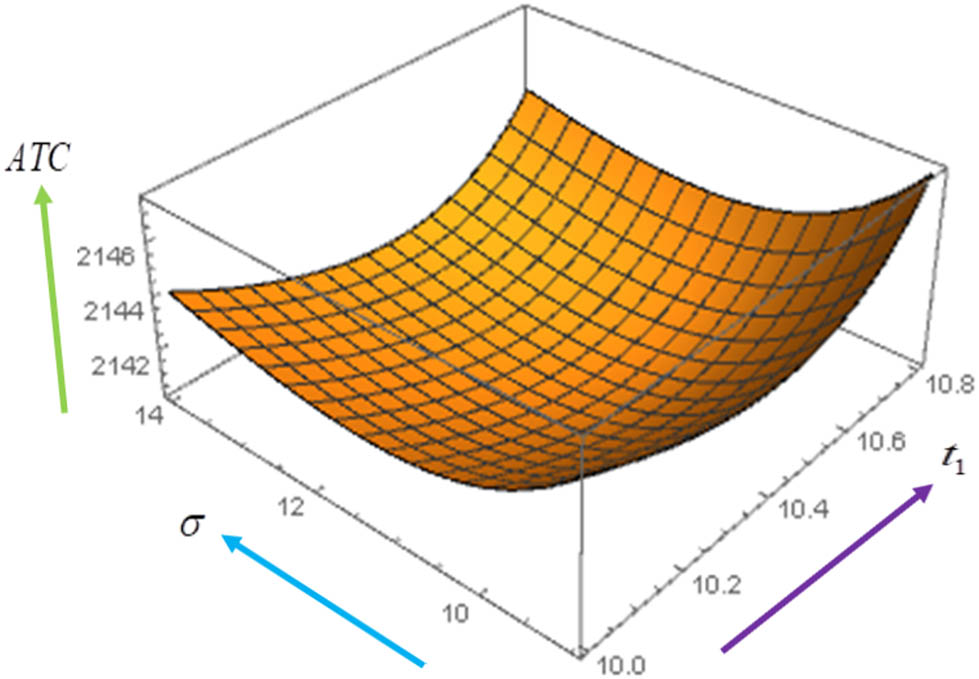
Convexity of AC π(σ, t 1, T, x) with respect to (σ, t 1).
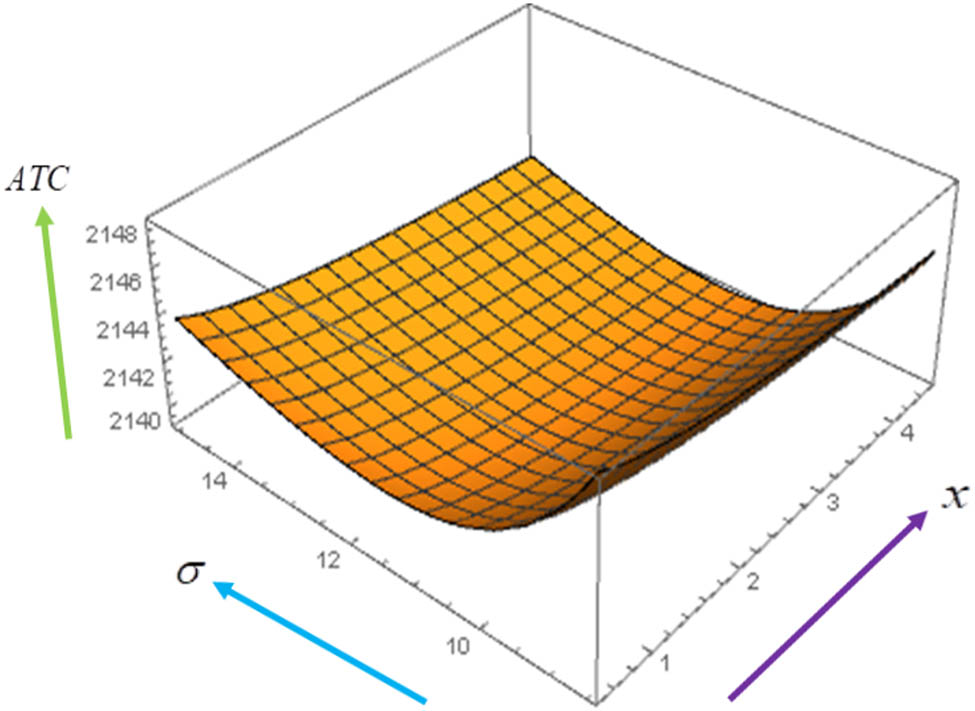
Convexity of AC π(σ, t 1, T, x) with respect to (σ, x).
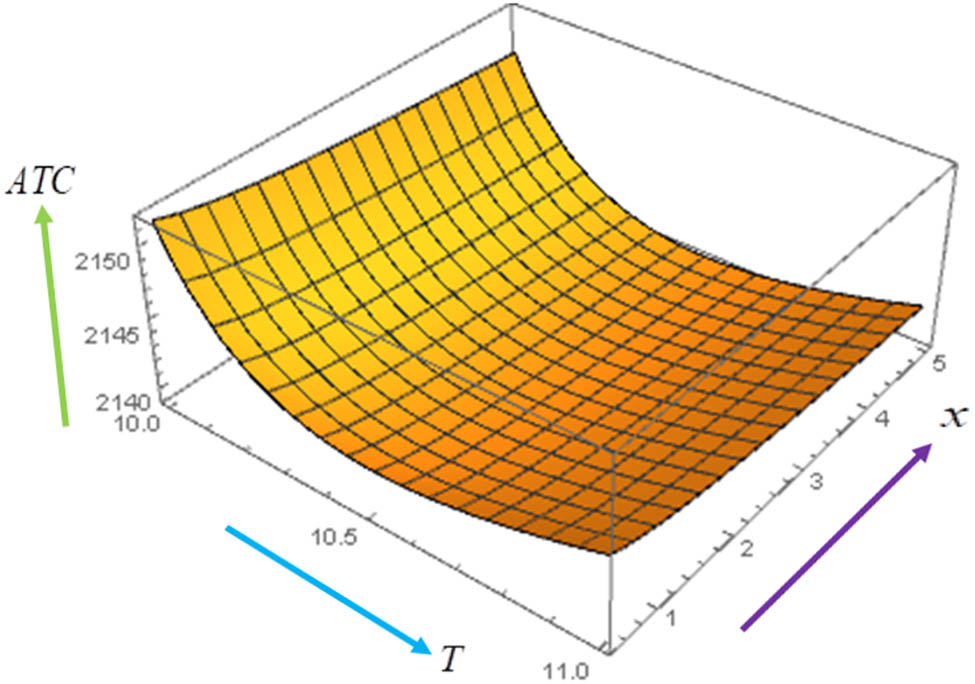
Convexity of AC π(σ, t 1, T, x) with respect to (T, x).
4.1 Observations and discussions
Figure 2 represents that the AC is convex with respect to two continuous variables (t 1, T), and Figure 3 shows that cost per unit is convex with respect to (t 1, x). Similarly, in Figure 4, AC is convex with respect to (σ, T). In Figure 5, AC is convex with respect to (σ, t 1), in Figure 6, AC is convex with respect to (σ, x), and in Figure 7, AC per unit is convex with respect to (x, T). Therefore, the solution obtained in Table 2 is optimal.
For Example 1, the optimal purchase cost is obtained as PC* = $17018.47, HC* = $82.01, COL* = $425.46, total SC is SC* = $1.07, total OC is OC* = $2.42, total PTC is given by * = $121.60, and total extra cost due to COVID-19 is C19C * = $4729.98. Furthermore, the optimal initial stock level of the system for Example 1 is given by S * = 941.13 units and optimal shortages R * = 4.34 units.
Also, the convexity of the AC corresponding to Example 1, i.e., π (σ, t 1, T, x), is acquired by a numerical Hessian matrix. Now, the Hessian matrix H(σ, x, t 1, T) at the optimal values of the decision variables of the system, i.e., at σ = 11.58, x = 2.0035, t 1 = 10.4537, T = 10.5037, is given by
with Eigenvalues λ 1 = 71.5468, λ 2 = 0.6099, λ 3 = 0.3020, and λ 4 = 0.0778, which are all positive. Therefore, the AC is convex with respect to decision variables σ, x, t 1, T, and it gives another guarantee that the solutions obtained in Table 2 are optimal.
In Example 2, no effect of COVID-19 pandemic on customers’ demand is considered. Therefore, this example basically describes the post-pandemic effect of COVID-19 on customers’ purchasing capacity.
Optimal results corresponding to Example 2
| Decision variables (AC) | Optimal results |
|---|---|
| Preservation cost
|
$8.7392/month |
| Time during inventory level reduces to zero
|
10.2745 months |
| Business period
|
10.4959 months |
| AC
|
$1940.28/month |
Example 2
The values of various input parameters corresponding to the model are given as follows:
Then
4.2 Sensitivity experiments
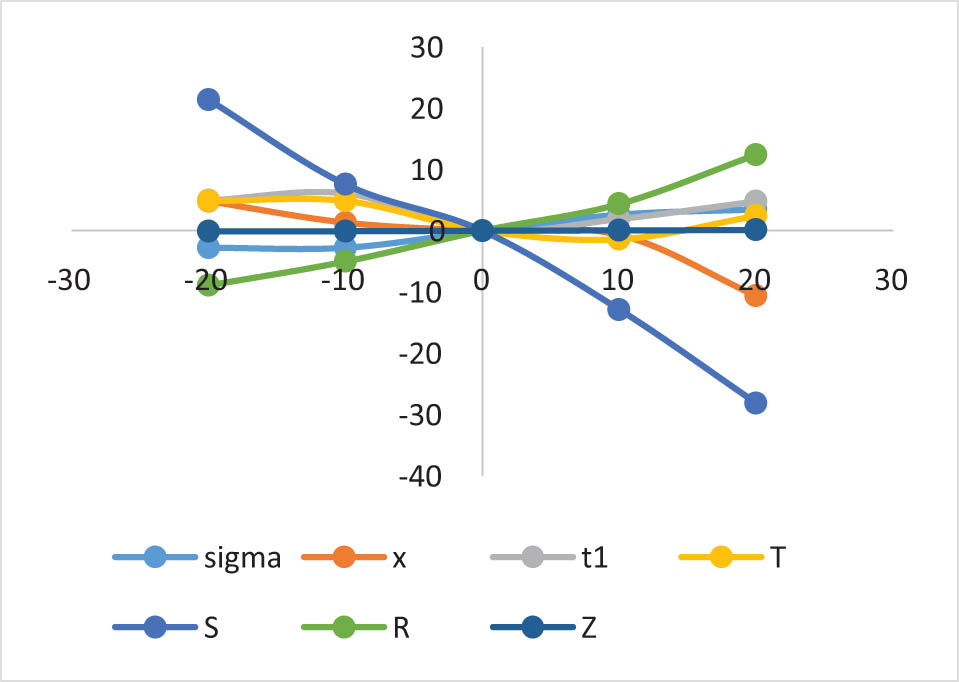
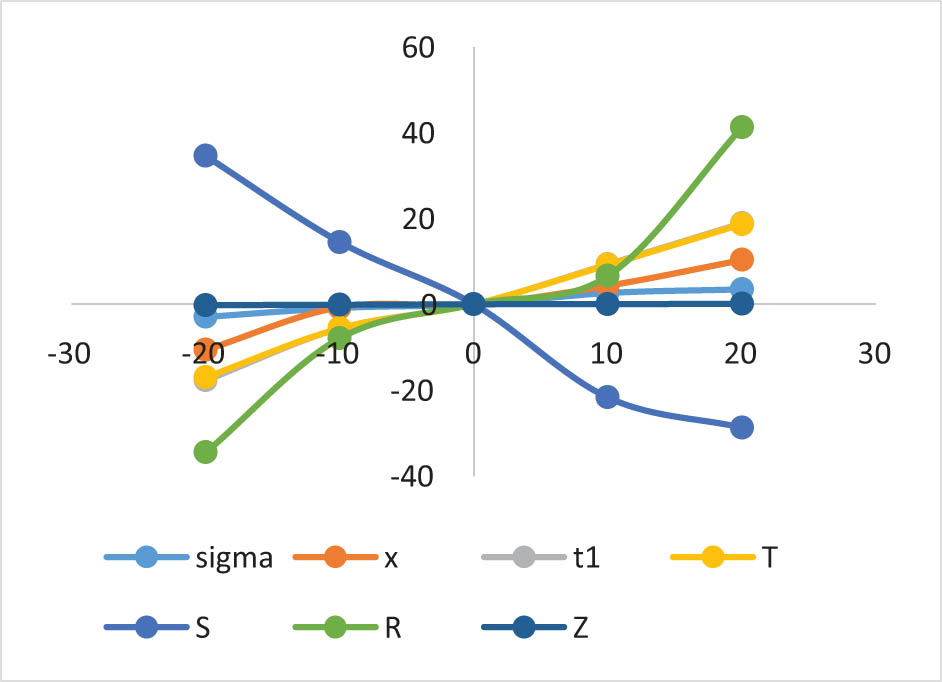
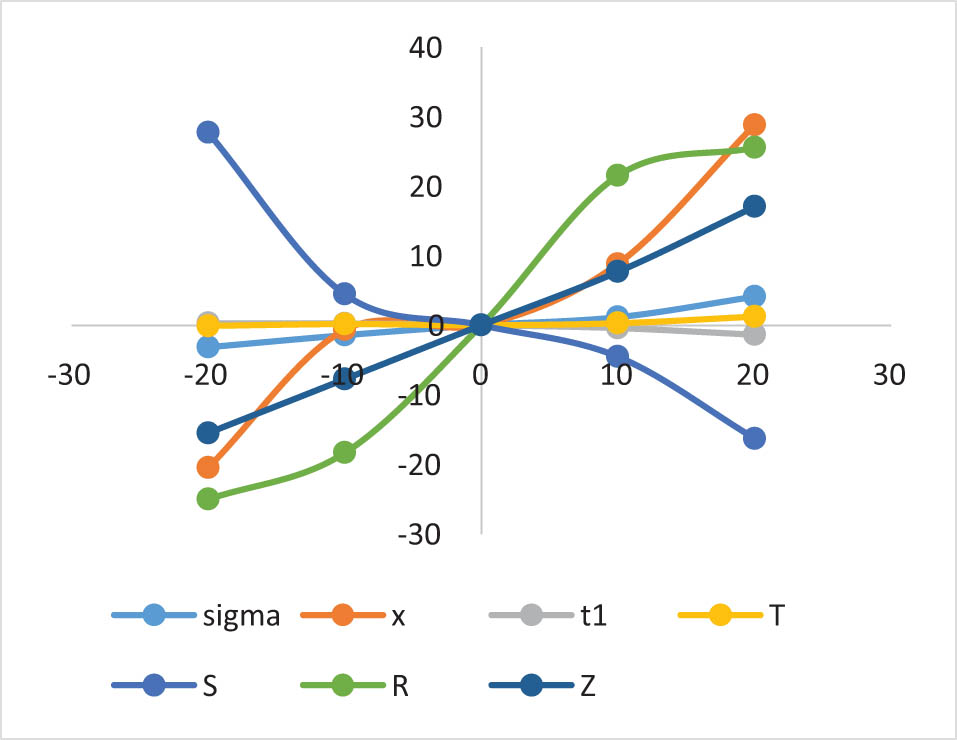
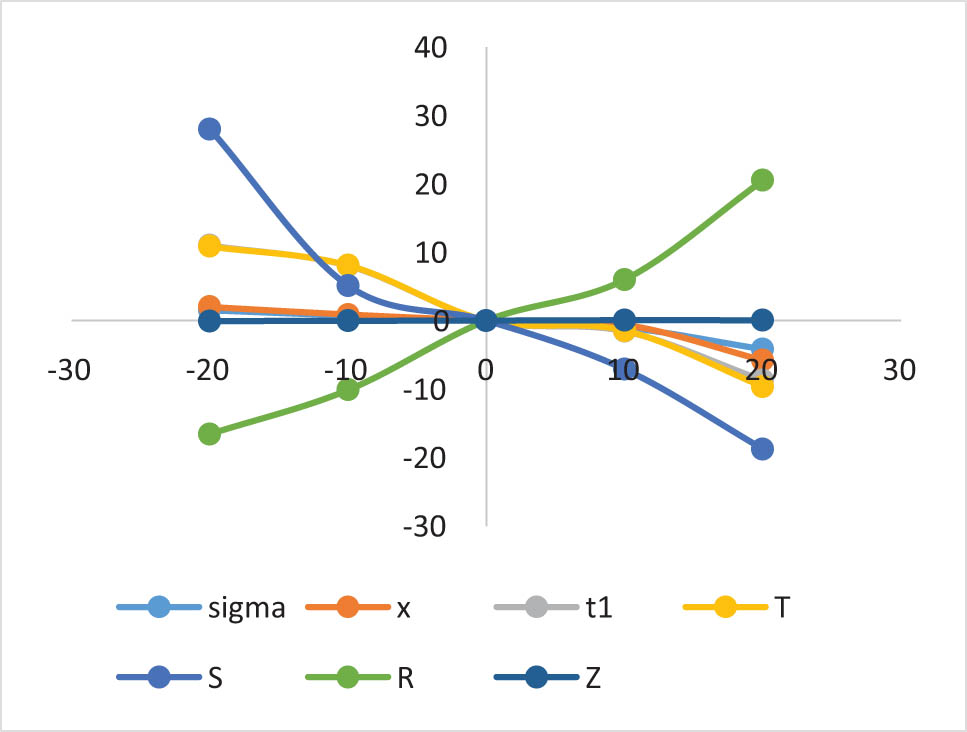
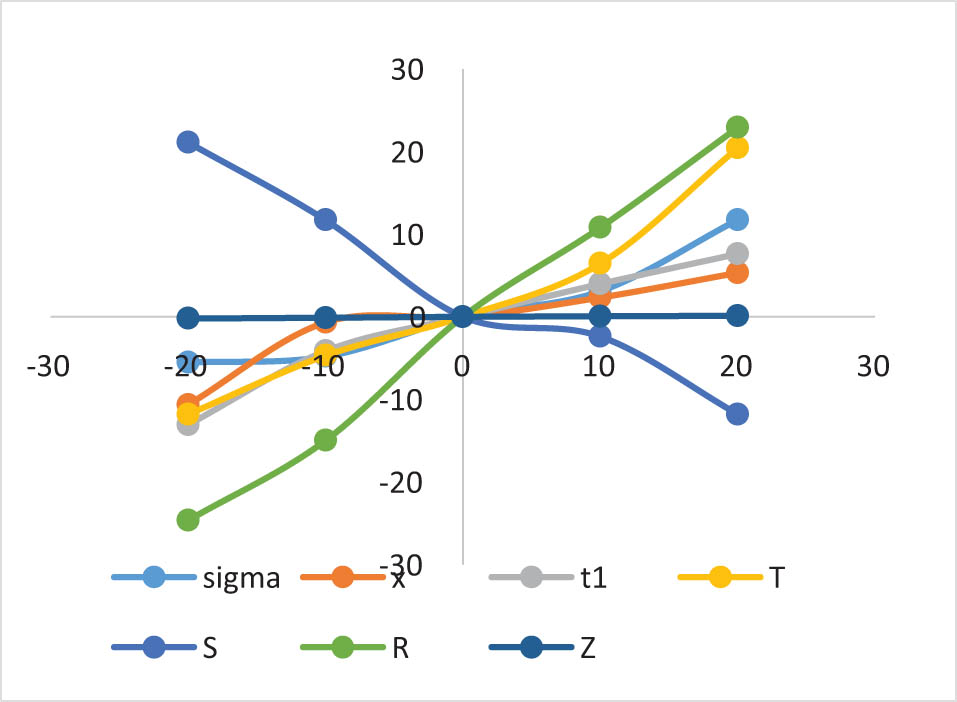
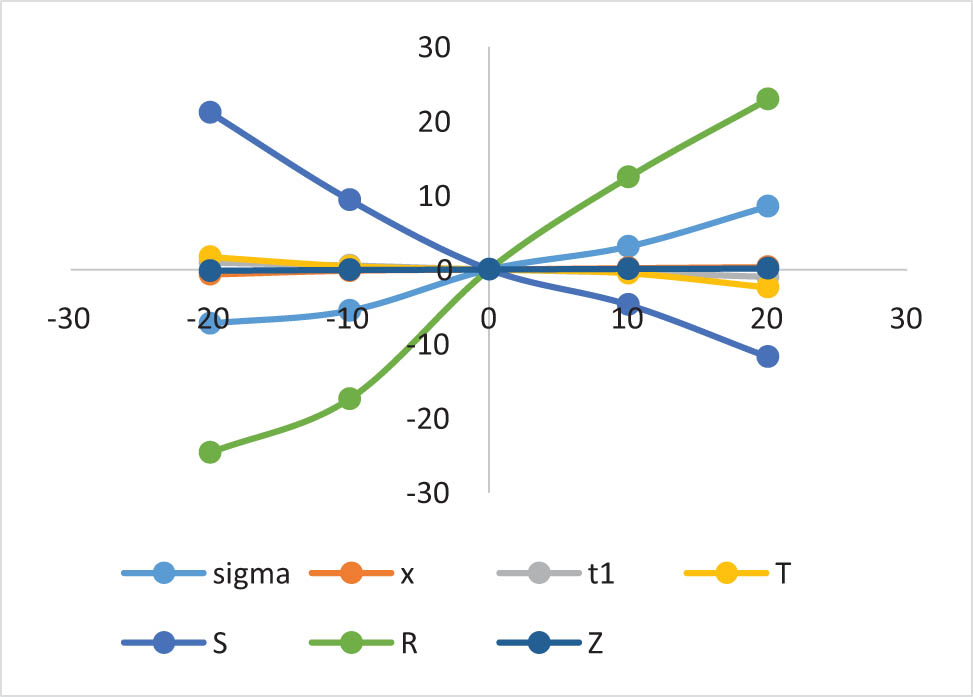
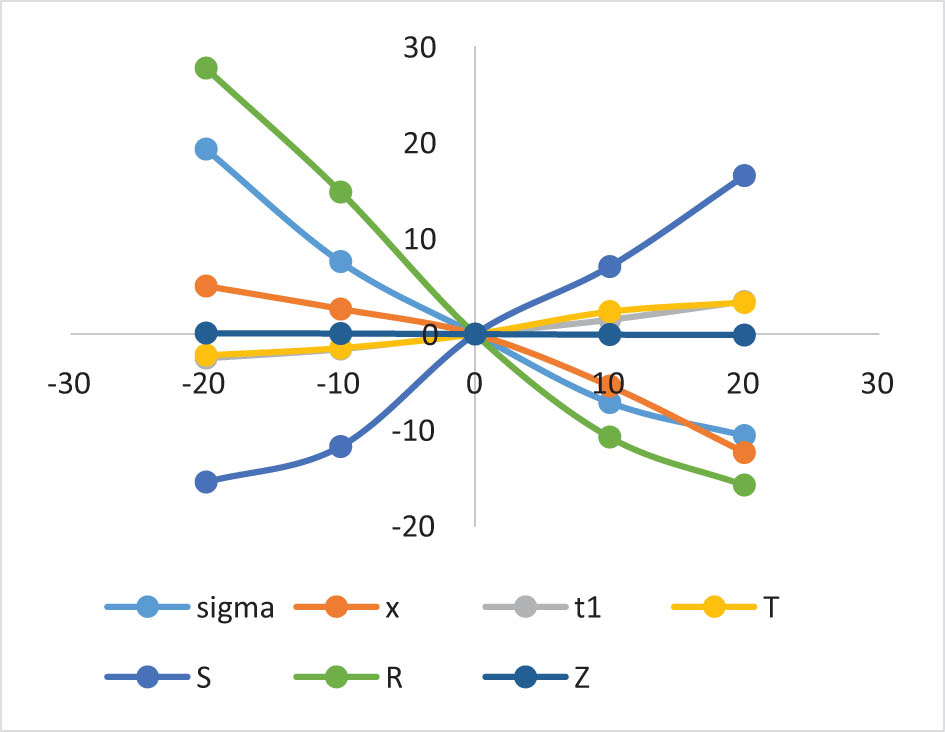
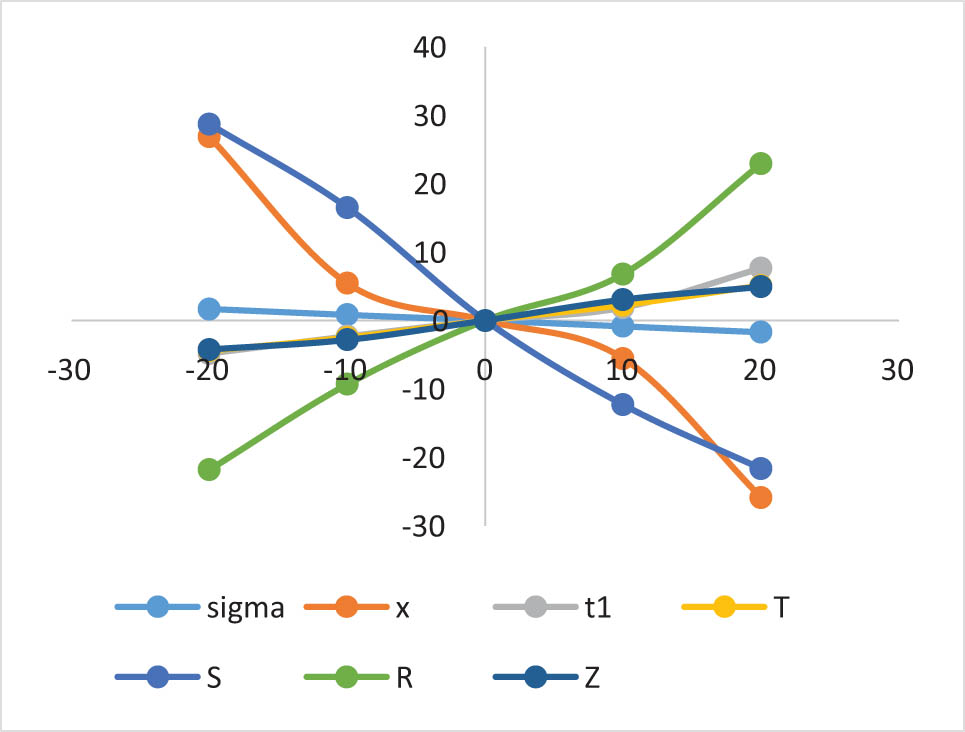
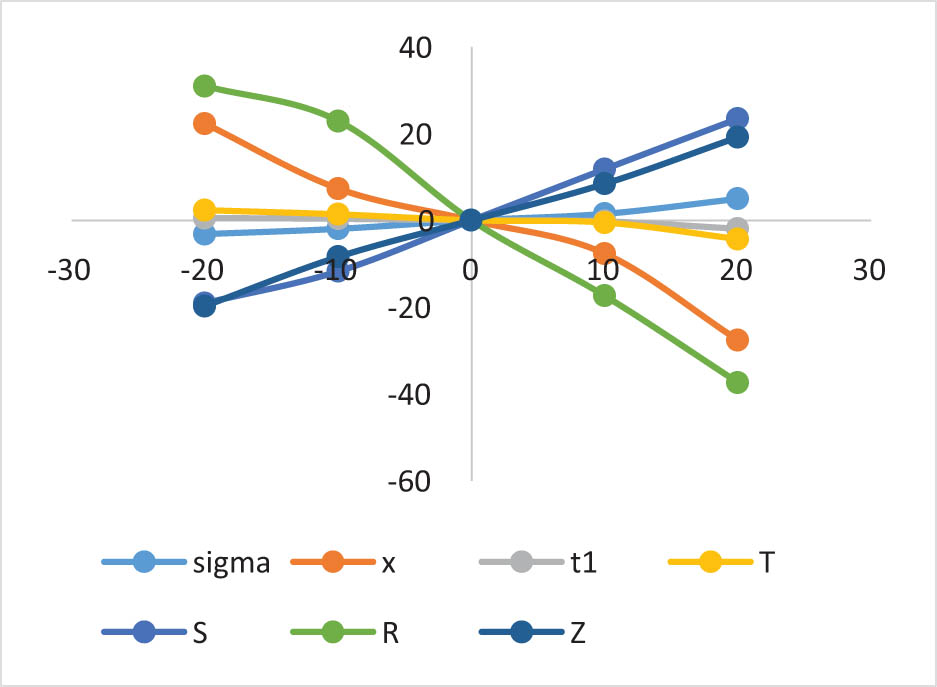
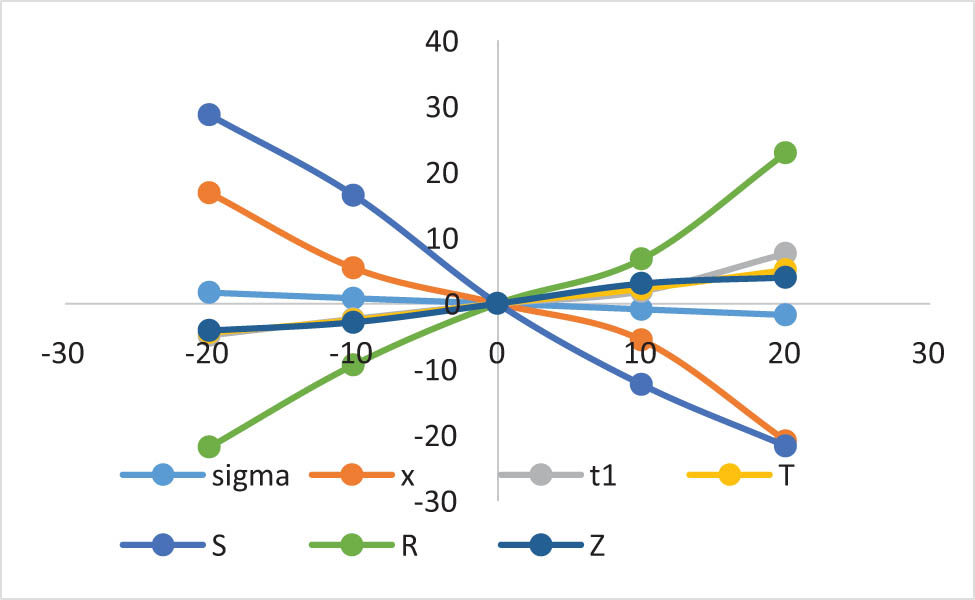
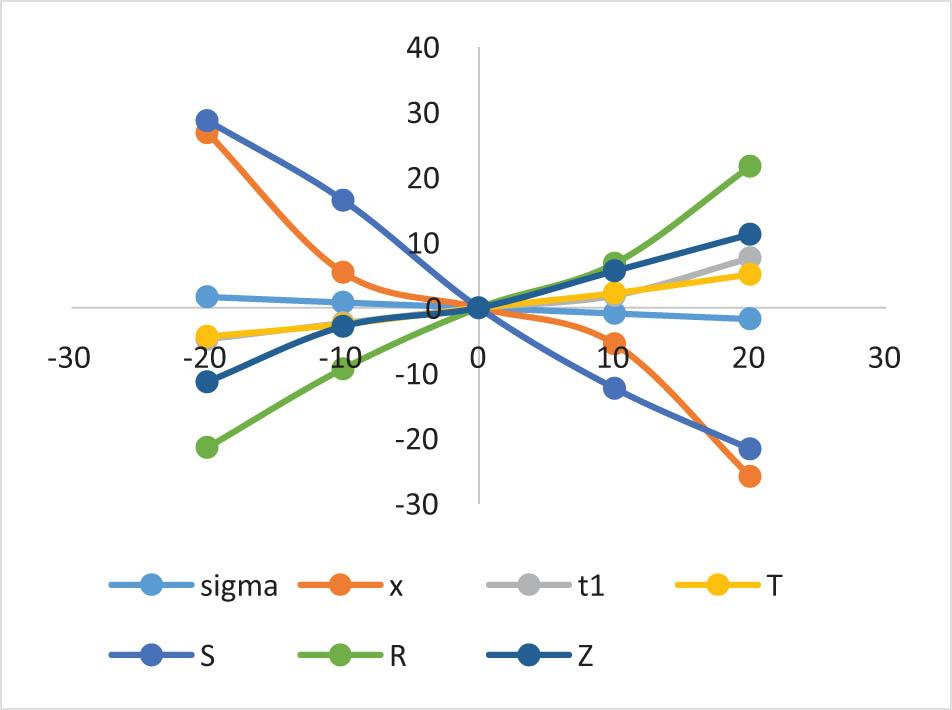
To observe the effect of change of various parameters on the optimal values of preservation cost (σ), COVID-19 influence (x), time duration during inventory level reduced to zero (t 1), business period (T), initial inventory level (S), shortage level (R), and cost per unit (π), post-optimality analyses are studied based on Example 1, and this experiment is performed on the optimal results by changing (i.e., increasing) one system parameter from −20% to 20% at a time and other parameters fixed at their original values. The results obtained from this simulation are given in Figures 8–18, where average profit is denoted by “Z,” preservation cost by “sigma,” COVID-19 factor by “x,” time duration during inventory level reduced to zero by “t 1,” cycle length by “T,” initial stock level by “S,” and shortage level by “R.”
Impact of deterioration rate (θ) on the optimal policy.
Impact of replenishment cost per order (K o ) on the optimal policy.
Impact of PC per unit (c i ) on the optimal policy.
Impact of HC (c h ) on the optimal policy.
Impact of SC (c s ) on the optimal policy.
Impact of SC (c s ) on the optimal policy.
Impact of a 1 on the optimal policy.
Impact of COVID-19 cost (c o ) on the optimal policy.
Impact of initial demand (D 2) on the optimal policy.
Impact of COVID-19 sensitive parameter (c) on the optimal policy.
Impact of b on the optimal policy.
From Figures 8–18, we can observe the following important impact:
Preservation cost (σ) for Example 1 is equally sensitive to the negative changes in the percentage of the parameter a 1, and it is moderately sensitive with respect to SC (c s ), OC (c l ), and the positive changes in the percentage of the parameter a 1. Furthermore, preservation cost (σ) is less sensitive with respect to deterioration rate (θ), and initial demand rate (D 2), whereas it is insensitive with respect to ordering cost per order (K o ), PC per unit (c i ), HC (c h ), COVID-19 cost (c o ), COVID-19 sensitive parameter (c), and the parameter b.
The COVID-19 factor (x) for Example 1 is highly sensitive with respect to PC per unit (c i ), COVID-19 cost (c o ), initial demand rate (D 2), and COVID-19 sensitive parameter (c); it is mostly equally sensitive with respect to the parameter b. Again, the COVID-19 factor (x) is moderately sensitive with respect to the cost of ordering per order (K o ), negative changes in the percentage of SC (c s ), positive changes in the percentage of deterioration rate (θ), and the parameter a 1; it has less impact with respect to positive changes in the percentage of SC (c s ), negative changes in the percentage of deterioration rate (θ), and the parameter a 1; and it is insensitive with respect to HC (c h ) and OC (c i ). Moreover, the parameters c o , D 2, c, a 1, and b have a reverse effect on x, i.e., x decreases if any one of these parameters increases and vice-versa.
The stock-in period (t 1) and cycle length (T) for Example 1 both are moderately sensitive with respect to the cost of ordering per order (K o ), SC (c s ), they are less impact with respect to deterioration rate (θ), HC (c h ), COVID-19 cost (c o ), COVID-19 sensitive parameter (c), parameter b and insensitive with respect to PC per unit (c i ), OC (c l ), initial demand rate (D 2) & the parameter a 1. Furthermore, c h has a reverse effect on both t 1 and T.
The initial stock level (S) for Example 1 is highly impacted with respect to deterioration rate (θ), cost of ordering per order (K o ), parameter b, COVID-19 sensitive parameter (c), initial demand rate (D 2), and the negative changes in the percentage of COVID-19 cost (c o ), PC per unit (c i ), and HC (c h ). Again, the initial inventory level is mostly equally sensitive to the negative changes in the percentage of parameter a 1, SC (c s ), and OC (c l ), and the positive changes in the percentage of purchase cost per unit (c i ), carrying cost (c h ), and COVID-19 cost (c o ). Furthermore, the initial stock level of the purchasing system is moderately sensitive with respect to the positive changes in the percentage of SC (c s ), OC (c l ), and parameter a 1. Moreover, the parameters K o , θ, c o , c h , c i , c l , and c s have a reverse effect on S.
The maximum shortage level (R) of the inventory system for Example 1 is highly impacted with respect to the cost of ordering per order (K o ), SC (c s ), PC per unit (c i ), initial demand rate (D 2), parameter b, COVID-19 sensitive parameter (c), COVID-19 cost (c o ), OC (c l ), and the negative changes in the percentage of parameter a 1. Again, the maximum shortage level of the system is mostly equally sensitive with respect to HC (c h ), positive changes in the percentage of parameter a 1, and moderately sensitive with respect to deterioration rate (θ). Moreover parameter a 1 has a reverse effect on R.
The cost per unit π(σ, t 1, T, x) of the system for Example 1 is equally sensitive with respect to initial demand rate (D 2); moderately sensitive with respect to PC per unit (c i ) and COVID-19 sensitive parameter (c); and it is less sensitive with respect to COVID-19 cost (c o ) and parameter b. Furthermore, average profit is insensitive with respect to the rest of the parameters, i.e., deterioration rate (θ), cost of ordering per order (K o ), HC (c h ), and SC (c s ).
4.3 Managerial insights
From the post-optimality analyses, the following observations may be suggested to the managers/decision-makers of business firms:
As a consequence of the COVID-19 effect, certain unplanned occurrences occur, and demand for the product decreases. As a consequence, merchants must focus on the preservation facility to avoid deterioration and maintain the product’s originality for an extended period of time. Once the COVID-19 scenario has passed, the post-COVID-19 impact is also available in the commercial world. As a consequence, decision-makers evaluate ways to improve the preservation facility while remaining within their financial constraints. This approach may be used for a wide range of perishable foods, including fish, milk products, and fruit.
The total cost has a considerable impact on the influence of the COVID-19 scenario. When demand for a product falls, businesses get less money from its sale. As a consequence, they must store the item for a longer amount of time in their warehouse. It affects the total cost of the system.
The COVID-19 factor has a significant influence on an item’s demand. As a result, in order to prevent a loss, decision-makers must consider the location of the order of the item that has the least influence on their overall cost.
To resurrect demand for the goods, decision-makers could consider discounting, installment payment, credit, and other options to continue their full commercial phase.
5 Concluding remarks, future research, and limitations
This article explores the impact of the COVID-19 pandemic and provides an inventory technique. Demand for the product has reduced as a consequence of COVID-19’s impact. A preservation facility is used to increase the life of a product while preserving its originality. With the pace at which clients wait, shortages are tolerable. The influence of the COVID-19 component is added to the demand function. The associated nonlinear optimization problem includes the four decision variables. As a consequence, developing a closed-form or analytic solution is very difficult. One numerical example is presented to substantiate the proposed study. The convexity of the goal function is also proven pairwise. The hessian matrix is also shown to be positive definite using that example and the MATHEMATICA tool, confirming the objective function’s concavity. Finally, a study of the post-optimality of different system parameters is conducted.
The COVID-19 impact reduces demand for the majority of items. Retailers must prioritize the preservation of deteriorating items to minimize deterioration. As a result, decision-makers consider the feasibility of constructing a more advanced preservation facility within their financial constraints. Retailers could use discounting, financing, and installment plans as a means of increasing demand.
During the uncertain COVID-19 pandemic scenario, the proposed model’s optimality analysis would assist small merchants and suppliers in making sound business decisions. In addition, the proposed model incorporates a post-COVID-19 impact, meaning that this model may potentially demonstrate post-optimality after the COVID-19 pandemic. As a consequence, both economically and scientifically, the present technique will be very beneficial in unveiling novel business ideas in an unpredictable or unexpected environment. Given the amount of discussion in this article, it may seem that this strategy may be employed for items that are in seasons, such as grains and vegetables.
This model may be expanded in numerous ways for future research, such as all unit discounts, credit durations, linear HCs, product green level, and multilevel trade credit. Fractional calculus, fuzzy logic, and interpolated environments may all be used to improve this model.
The influence of COVID-19 on the economic order quantity inventory model is calculated in this study with the following constraints:
The current model is derived from the impact of the COVID-19 situation. However, the time value of money is not incorporated here.
Other facilities, such as all unit discount facilities and delayed payment facilities, are not implemented here.
6 Limitation of the proposed work
The main limitation of this model is that it cannot be solved analytically due to the high nonlinearity of the objective function.
Acknowledgments
The authors are thankful to the editorial and anonymous reviewers for their constructive comments and suggestions. The authors thank the Research Supporting Project Number (RSP-2021/323), King Saud University, Riyadh, Saudi Arabia. A.A.S. would like to acknowledge the Department of Science and Technology, Government of India, for FIST support (SR/FST/MSII/2017/10(C)).
-
Funding information: This work was supported by the Research Supporting Project Number (RSP-2021/323), King Saud University, Riyadh, Saudi Arabia.
-
Author contributions: All authors have accepted responsibility for the entire content of this manuscript and approved its submission.
-
Conflict of interest: The authors state no conflict of interest.
-
Data availability statement: Data sharing is not applicable to this article as no datasets were generated or analysed during the current study.
References
[1] Paul SK, Chowdhury P. A production recovery plan in manufacturing supply chains for a high-demand item during COVID-19. Int J Phys Distrib Logist Manag. 2020;51(2):104–25.10.1108/IJPDLM-04-2020-0127Search in Google Scholar
[2] Li X, Wang B, Liu C, Freiheit T, Epureanu BI. Intelligent manufacturing systems in COVID-19 pandemic and beyond: framework and impact assessment. Chin J Mech Eng. 2020;33(1):1–5.10.1186/s10033-020-00476-wSearch in Google Scholar
[3] Burgos D, Ivanov D. Food retail supply chain resilience and the COVID-19 pandemic: a digital twin-based impact analysis and improvement directions. Transport Res Part E Logist Transport Rev. 2021;152:102412.10.1016/j.tre.2021.102412Search in Google Scholar PubMed PubMed Central
[4] Ivanov D, Dolgui A. OR-methods for coping with the ripple effect in supply chains during COVID-19 pandemic: managerial insights and research implications. Int J Prod Econ. 2021;232:107921.10.1016/j.ijpe.2020.107921Search in Google Scholar PubMed PubMed Central
[5] Shahed KS, Azeem A, Ali SM, Moktadir MA. A supply chain disruption risk mitigation model to manage COVID-19 pandemic risk. Environ Sci Pollut Res. 2021;1–16.10.1007/s11356-020-12289-4Search in Google Scholar PubMed PubMed Central
[6] Paul SK, Chowdhury P, Moktadir MA, Lau KH. Supply chain recovery challenges in the wake of COVID-19 pandemic. J Bus Res. 2021;136:316–29.10.1016/j.jbusres.2021.07.056Search in Google Scholar PubMed PubMed Central
[7] Ivanov D. Supply chain viability and the COVID-19 pandemic: a conceptual and formal generalisation of four major adaptation strategies. Int J Prod Res. 2021;59(12):3535–52.10.1080/00207543.2021.1890852Search in Google Scholar
[8] Sarkar BK, Sana SS. An e-healthcare system for disease prediction using hybrid data mining technique. J Model Manag. 2019;14(3):628–61.10.1108/JM2-05-2018-0069Search in Google Scholar
[9] Moheimani A, Sheikh R, Hosseini SMH, Sana SS. Assessing the agility of hospitals in disaster management: application of interval type-2 fuzzy Flowsort inference system. Soft Comput. 2021;25(5):3955–74.10.1007/s00500-020-05418-1Search in Google Scholar
[10] Moheimani A, Sheikh R, Hosseini SMH, Sana SS. Assessing the preparedness of hospitals facing disasters using the rough set theory: guidelines for more preparedness to cope with the COVID-19. Int J Syst Sci Oper Logist. 2021;1–16.10.1080/23302674.2021.1904301Search in Google Scholar
[11] Premarathna IHK, Srivastava HM, Juman ZAMS, Arjani AA, Uddin MS, Sana SS. Mathematical modeling approach to predict COVID-19 infected people in Sri Lanka; 2022.10.3934/math.2022260Search in Google Scholar
[12] Dye CY, Hseigh TP. An optimal replenishment policy for deteriorating items with effective investment preservation technology. Eur J Oper Res. 2012;218(1):106–12.10.1016/j.ejor.2011.10.016Search in Google Scholar
[13] Dye CY. The effect of preservation technology investment on a non-instantaneous deteriorating inventory model. Omega. 2013;41(5):872–80.10.1016/j.omega.2012.11.002Search in Google Scholar
[14] Tayal S, Singh SR, Sharma R, Chauhan A. Two echelon supply chain model for deteriorating items with effective investment in preservation technology. Int J Math Operat Res. 2014;6(1):84–105.10.1504/IJMOR.2014.057854Search in Google Scholar
[15] Yang CT, Dye CY, Ding JF. Optimal dynamic trade credit and preservation technology allocation for a deteriorating inventory model. Computers Ind Eng. 2015;87:356–69.10.1016/j.cie.2015.05.027Search in Google Scholar
[16] Singh SR, Khurana D, Tayal S. An economic order quantity model for deteriorating products having stock dependent demand with trade credit period and preservation technology. Uncertain Supply Chain Manag. 2016;4(1):29–42.10.5267/j.uscm.2015.8.001Search in Google Scholar
[17] Giri BC, Pal H, Maiti T. A vendor-buyer supply chain model for time-dependent deteriorating item with preservation technology investment. Int J Math Operat Res. 2017;10(4):431–49.10.1504/IJMOR.2017.084158Search in Google Scholar
[18] Mohanty DJ, Kumar RS, Goswami A. Trade-credit modeling for deteriorating item inventory system with preservation technology under random planning horizon. Sādhanā. 2018;43(3):1–17.10.1007/s12046-018-0807-0Search in Google Scholar
[19] Shaikh AA, Das SC, Bhunia AK, Panda GC, Khan MAA. A two-warehouse EOQ model with interval-valued inventory cost and advance payment for deteriorating item under particle swarm optimization. Soft Comput. 2019;23:13531–46.10.1007/s00500-019-03890-ySearch in Google Scholar
[20] Priyambada R, Khanna A, Jaggi CK. An inventory model under price and stock dependent demand for controllable deterioration rate with shortages and preservation technology investment: revisited. OPSEARCH. 2021;58(1):81–202.10.1007/s12597-020-00474-5Search in Google Scholar
[21] Ho CH. The optimal integrated inventory policy with trade credit price-and-credit linked demand under two-level trade credit. Computer Ind Eng. 2011;60(1):117–26.10.1016/j.cie.2010.10.009Search in Google Scholar
[22] Teng JT, Min J, Pan Q. Economic order quantity model with trade credit financing for non-decreasing demand. Omega. 2012;40(3):328–35.10.1016/j.omega.2011.08.001Search in Google Scholar
[23] Teng JT, Yang HL, Chern MS. An inventory model for increasing demand under two levels of trade credit linked to order quantity. Appl Math Model. 2013;37(14–15):7624–32.10.1016/j.apm.2013.02.009Search in Google Scholar
[24] Pal B, Sana SS, Chaudhuri K. Three stage trade credit policy in a three-layer supply chain—a production-inventory model. Int J Syst Sci. 2014;45(9):1844–68.10.1080/00207721.2012.757383Search in Google Scholar
[25] Yadav D, Singh SR, Kumari R. Retailers optimal policy under inflation in fuzzy environment with trade credit. Int J Syst Sci. 2015;46(4):754–62.10.1080/00207721.2013.801094Search in Google Scholar
[26] Rameswari M, Uthayakumar R. An integrated inventory model for deteriorating items with price-dependent demand under two-level trade credit policy. Int J Syst Sci. 2017;1–15.10.1080/23302674.2017.1292432Search in Google Scholar
[27] Khan AA, Shaikh AA, Panda GC, Konstantaras I. Two-warehouse inventory model for deteriorating items with partial backlogging and advance payment scheme. Rairo-Operations Res. 2019a;53(5):1691–708.10.1051/ro/2018093Search in Google Scholar
[28] Shaikh AA, Khan MAA, Panda GC, Konstantaras I. Price discount facility in an EOQ model for deteriorating items with stock-dependent demand and partial backlogging. Int Trans Operat Res. 2019;26(4):1365–95.10.1111/itor.12632Search in Google Scholar
[29] Panda GC, Khan MAA, Shaikh AA. A credit policy approach in a two- warehouse inventory model for deteriorating items with pric-e and stock-dependent demand under partial backlogging. J Ind Eng Int. 2019;15(1):147–70.10.1007/s40092-018-0269-3Search in Google Scholar
[30] Khan MAA, Ahmed S, Babu MS, Sultana N. Optimal lot-size decision for deteriorating items with price-sensitive demand, linearly time-dependent holding cost under all-units discount environment. Int J Syst Sci Oper Logist. 2020a;9(1):61–74.10.1080/23302674.2020.1815892Search in Google Scholar
[31] Khan MAA, Shaikh AA, Konstantaras I, Bhunia AK, Barron LEC. Inventory models for perishable items with advanced payment, linearly time-dependent holding cost and demand dependent on advertisement and selling price. Int J Prod Econ. 2020b;230.10.1016/j.ijpe.2020.107804Search in Google Scholar
[32] Khan AA, Shaikh AA, Panda GC, Konstantaras I, Barrón LEC. The effect of advance payment with discount facility on supply decisions of deteriorating products whose demand is both price and stock dependent. Int Trans Operat Res. 2020d;27(3):1343–67.10.1111/itor.12733Search in Google Scholar
[33] Khan MAA, Shailkh AA, Barron LEC. An inventory model under linked-to-order hybrid partial advance payment, partial credit policy, all-units discount and partial backlogging with capacity constraint. Omega. 2021;103.10.1016/j.omega.2021.102418Search in Google Scholar
[34] Rahman MS, Khan MAA, Halim MA, Nofal TA, Shaikh AA, Mahmoudd EE. Hybrid price and stock dependent inventory model for perishable goods with advance payment related discount facilities under preservation technology. Alex Eng J. 2021;60(3):3455–65.10.1016/j.aej.2021.01.045Search in Google Scholar
[35] Das S, Khan MAA, Mahmoudd EE, Abdel-Hallem AA, Abualnaja KM, Shailkh AA. A production inventory model with partial trade credit policy and reliability. Alex Eng J. 2021;60(1):1325–38.10.1016/j.aej.2020.10.054Search in Google Scholar
[36] Jaggi CK, Tiwari S, Shafi A. Effect of deterioration on two-warehouse inventory model with imperfect quality. Computers Ind Eng. 2015;88:378–85.10.1016/j.cie.2015.07.019Search in Google Scholar
[37] Prasad K, Mukherjee B. Optimal inventory model under stock and time dependent demand for time varying deterioration rate with shortages. Ann Oper Res. 2016;243(1):323–34.10.1007/s10479-014-1759-3Search in Google Scholar
[38] Mishra U, Cárdenas-Barrón LE, Tiwari S, Shaikh AA, Treviño-Garza G. An inventory model under price and stock dependent demand for controllable deterioration rate with shortages and preservation technology investment. Ann Oper Res. 2017;254(1):165–90.10.1007/s10479-017-2419-1Search in Google Scholar
[39] Rameswari M, Uthayakumar R. An integrated inventory model for deteriorating items with price-dependent demand under two-level trade credit policy. Int J Syst Sci Oper Logist. 2018;5(3):253–67.10.1080/23302674.2017.1292432Search in Google Scholar
[40] Pramanik P, Maiti MK. An inventory model for deteriorating items with inflation induced variable demand under two level partial trade credit: A hybrid ABC-GA approach. Eng Appl Artif Intell. 2019;85:194–207.10.1016/j.engappai.2019.06.013Search in Google Scholar
[41] Shaikh AA, Panda GC, Sahu S, Das AK. Economic order quantity model for deteriorating item with preservation technology in time dependent demand with partial backlogging and trade credit. Int J Logist Syst Manag. 2019;32(1):1–24.10.1504/IJLSM.2019.097070Search in Google Scholar
[42] Rapolu CN, Kandpal DH. Joint pricing, advertisement, preservation technology investment and inventory policies for non-instantaneous deteriorating items under trade credit. Opsearch. 2020;57(2):274–300.10.1007/s12597-019-00427-7Search in Google Scholar
[43] Das S, Mondal R, Shaikh AA, Bhunia AK. An application of control theory for imperfect production problem with carbon emission investment policy in interval environment. J Frankl Inst. 2022;359(5):1925–70.10.1016/j.jfranklin.2022.01.035Search in Google Scholar
[44] Alkahtani M, Omair M, Khalid QS, Hussain G, Ahmad I, Pruncu C. A COVID-19 supply chain management strategy based on variable production under uncertain environment conditions. Int J Environ Res Public Health. 2021;18(4):1662.10.3390/ijerph18041662Search in Google Scholar PubMed PubMed Central
[45] Das S, Rahman MS, Shaikh AA, Bhunia AK, Ahmadian A. Theoretical developments and application of variational principle in a production inventory problem with interval uncertainty. Int J Syst Sci Oper Logist. 2022;1–20.10.1080/23302674.2022.2052377Search in Google Scholar
[46] Cao C, Liu Y, Tang O, Gao X. A fuzzy bi-level optimization model for multi-period post-disaster relief distribution in sustainable humanitarian supply chains. Int J Prod Econ. 2021;235:108081.10.1016/j.ijpe.2021.108081Search in Google Scholar
[47] Gao X, Cao C. A novel multi-objective scenario-based optimization model for sustainable reverse logistics supply chain network redesign considering facility reconstruction. J Clean Prod. 2020;270:122405.10.1016/j.jclepro.2020.122405Search in Google Scholar
[48] Duary A, Das S, Arif MG, Abualnaja KM, Khan MAA, Zakarya M, et al. Advance and delay in payments with the price-discount inventory model for deteriorating items under capacity constraint and partially backlogged shortages. Alex Eng J. 2022;61(2):1735–45.10.1016/j.aej.2021.06.070Search in Google Scholar
[49] Gao X, Huang G, Zhao Q, Cao C, Jiang H. Robust optimization model for medical staff rebalancing problem with data contamination during COVID-19 pandemic. Int J Prod Res. 2022;60(5):1737–66.10.1080/00207543.2021.1995793Search in Google Scholar
© 2022 Ali Akbar Shaikh et al., published by De Gruyter
This work is licensed under the Creative Commons Attribution 4.0 International License.
Articles in the same Issue
- Regular Articles
- Test influence of screen thickness on double-N six-light-screen sky screen target
- Analysis on the speed properties of the shock wave in light curtain
- Abundant accurate analytical and semi-analytical solutions of the positive Gardner–Kadomtsev–Petviashvili equation
- Measured distribution of cloud chamber tracks from radioactive decay: A new empirical approach to investigating the quantum measurement problem
- Nuclear radiation detection based on the convolutional neural network under public surveillance scenarios
- Effect of process parameters on density and mechanical behaviour of a selective laser melted 17-4PH stainless steel alloy
- Performance evaluation of self-mixing interferometer with the ceramic type piezoelectric accelerometers
- Effect of geometry error on the non-Newtonian flow in the ceramic microchannel molded by SLA
- Numerical investigation of ozone decomposition by self-excited oscillation cavitation jet
- Modeling electrostatic potential in FDSOI MOSFETS: An approach based on homotopy perturbations
- Modeling analysis of microenvironment of 3D cell mechanics based on machine vision
- Numerical solution for two-dimensional partial differential equations using SM’s method
- Multiple velocity composition in the standard synchronization
- Electroosmotic flow for Eyring fluid with Navier slip boundary condition under high zeta potential in a parallel microchannel
- Soliton solutions of Calogero–Degasperis–Fokas dynamical equation via modified mathematical methods
- Performance evaluation of a high-performance offshore cementing wastes accelerating agent
- Sapphire irradiation by phosphorus as an approach to improve its optical properties
- A physical model for calculating cementing quality based on the XGboost algorithm
- Experimental investigation and numerical analysis of stress concentration distribution at the typical slots for stiffeners
- An analytical model for solute transport from blood to tissue
- Finite-size effects in one-dimensional Bose–Einstein condensation of photons
- Drying kinetics of Pleurotus eryngii slices during hot air drying
- Computer-aided measurement technology for Cu2ZnSnS4 thin-film solar cell characteristics
- QCD phase diagram in a finite volume in the PNJL model
- Study on abundant analytical solutions of the new coupled Konno–Oono equation in the magnetic field
- Experimental analysis of a laser beam propagating in angular turbulence
- Numerical investigation of heat transfer in the nanofluids under the impact of length and radius of carbon nanotubes
- Multiple rogue wave solutions of a generalized (3+1)-dimensional variable-coefficient Kadomtsev--Petviashvili equation
- Optical properties and thermal stability of the H+-implanted Dy3+/Tm3+-codoped GeS2–Ga2S3–PbI2 chalcohalide glass waveguide
- Nonlinear dynamics for different nonautonomous wave structure solutions
- Numerical analysis of bioconvection-MHD flow of Williamson nanofluid with gyrotactic microbes and thermal radiation: New iterative method
- Modeling extreme value data with an upside down bathtub-shaped failure rate model
- Abundant optical soliton structures to the Fokas system arising in monomode optical fibers
- Analysis of the partially ionized kerosene oil-based ternary nanofluid flow over a convectively heated rotating surface
- Multiple-scale analysis of the parametric-driven sine-Gordon equation with phase shifts
- Magnetofluid unsteady electroosmotic flow of Jeffrey fluid at high zeta potential in parallel microchannels
- Effect of plasma-activated water on microbial quality and physicochemical properties of fresh beef
- The finite element modeling of the impacting process of hard particles on pump components
- Analysis of respiratory mechanics models with different kernels
- Extended warranty decision model of failure dependence wind turbine system based on cost-effectiveness analysis
- Breather wave and double-periodic soliton solutions for a (2+1)-dimensional generalized Hirota–Satsuma–Ito equation
- First-principle calculation of electronic structure and optical properties of (P, Ga, P–Ga) doped graphene
- Numerical simulation of nanofluid flow between two parallel disks using 3-stage Lobatto III-A formula
- Optimization method for detection a flying bullet
- Angle error control model of laser profilometer contact measurement
- Numerical study on flue gas–liquid flow with side-entering mixing
- Travelling waves solutions of the KP equation in weakly dispersive media
- Characterization of damage morphology of structural SiO2 film induced by nanosecond pulsed laser
- A study of generalized hypergeometric Matrix functions via two-parameter Mittag–Leffler matrix function
- Study of the length and influencing factors of air plasma ignition time
- Analysis of parametric effects in the wave profile of the variant Boussinesq equation through two analytical approaches
- The nonlinear vibration and dispersive wave systems with extended homoclinic breather wave solutions
- Generalized notion of integral inequalities of variables
- The seasonal variation in the polarization (Ex/Ey) of the characteristic wave in ionosphere plasma
- Impact of COVID 19 on the demand for an inventory model under preservation technology and advance payment facility
- Approximate solution of linear integral equations by Taylor ordering method: Applied mathematical approach
- Exploring the new optical solitons to the time-fractional integrable generalized (2+1)-dimensional nonlinear Schrödinger system via three different methods
- Irreversibility analysis in time-dependent Darcy–Forchheimer flow of viscous fluid with diffusion-thermo and thermo-diffusion effects
- Double diffusion in a combined cavity occupied by a nanofluid and heterogeneous porous media
- NTIM solution of the fractional order parabolic partial differential equations
- Jointly Rayleigh lifetime products in the presence of competing risks model
- Abundant exact solutions of higher-order dispersion variable coefficient KdV equation
- Laser cutting tobacco slice experiment: Effects of cutting power and cutting speed
- Performance evaluation of common-aperture visible and long-wave infrared imaging system based on a comprehensive resolution
- Diesel engine small-sample transfer learning fault diagnosis algorithm based on STFT time–frequency image and hyperparameter autonomous optimization deep convolutional network improved by PSO–GWO–BPNN surrogate model
- Analyses of electrokinetic energy conversion for periodic electromagnetohydrodynamic (EMHD) nanofluid through the rectangular microchannel under the Hall effects
- Propagation properties of cosh-Airy beams in an inhomogeneous medium with Gaussian PT-symmetric potentials
- Dynamics investigation on a Kadomtsev–Petviashvili equation with variable coefficients
- Study on fine characterization and reconstruction modeling of porous media based on spatially-resolved nuclear magnetic resonance technology
- Optimal block replacement policy for two-dimensional products considering imperfect maintenance with improved Salp swarm algorithm
- A hybrid forecasting model based on the group method of data handling and wavelet decomposition for monthly rivers streamflow data sets
- Hybrid pencil beam model based on photon characteristic line algorithm for lung radiotherapy in small fields
- Surface waves on a coated incompressible elastic half-space
- Radiation dose measurement on bone scintigraphy and planning clinical management
- Lie symmetry analysis for generalized short pulse equation
- Spectroscopic characteristics and dissociation of nitrogen trifluoride under external electric fields: Theoretical study
- Cross electromagnetic nanofluid flow examination with infinite shear rate viscosity and melting heat through Skan-Falkner wedge
- Convection heat–mass transfer of generalized Maxwell fluid with radiation effect, exponential heating, and chemical reaction using fractional Caputo–Fabrizio derivatives
- Weak nonlinear analysis of nanofluid convection with g-jitter using the Ginzburg--Landau model
- Strip waveguides in Yb3+-doped silicate glass formed by combination of He+ ion implantation and precise ultrashort pulse laser ablation
- Best selected forecasting models for COVID-19 pandemic
- Research on attenuation motion test at oblique incidence based on double-N six-light-screen system
- Review Articles
- Progress in epitaxial growth of stanene
- Review and validation of photovoltaic solar simulation tools/software based on case study
- Brief Report
- The Debye–Scherrer technique – rapid detection for applications
- Rapid Communication
- Radial oscillations of an electron in a Coulomb attracting field
- Special Issue on Novel Numerical and Analytical Techniques for Fractional Nonlinear Schrodinger Type - Part II
- The exact solutions of the stochastic fractional-space Allen–Cahn equation
- Propagation of some new traveling wave patterns of the double dispersive equation
- A new modified technique to study the dynamics of fractional hyperbolic-telegraph equations
- An orthotropic thermo-viscoelastic infinite medium with a cylindrical cavity of temperature dependent properties via MGT thermoelasticity
- Modeling of hepatitis B epidemic model with fractional operator
- Special Issue on Transport phenomena and thermal analysis in micro/nano-scale structure surfaces - Part III
- Investigation of effective thermal conductivity of SiC foam ceramics with various pore densities
- Nonlocal magneto-thermoelastic infinite half-space due to a periodically varying heat flow under Caputo–Fabrizio fractional derivative heat equation
- The flow and heat transfer characteristics of DPF porous media with different structures based on LBM
- Homotopy analysis method with application to thin-film flow of couple stress fluid through a vertical cylinder
- Special Issue on Advanced Topics on the Modelling and Assessment of Complicated Physical Phenomena - Part II
- Asymptotic analysis of hepatitis B epidemic model using Caputo Fabrizio fractional operator
- Influence of chemical reaction on MHD Newtonian fluid flow on vertical plate in porous medium in conjunction with thermal radiation
- Structure of analytical ion-acoustic solitary wave solutions for the dynamical system of nonlinear wave propagation
- Evaluation of ESBL resistance dynamics in Escherichia coli isolates by mathematical modeling
- On theoretical analysis of nonlinear fractional order partial Benney equations under nonsingular kernel
- The solutions of nonlinear fractional partial differential equations by using a novel technique
- Modelling and graphing the Wi-Fi wave field using the shape function
- Generalized invexity and duality in multiobjective variational problems involving non-singular fractional derivative
- Impact of the convergent geometric profile on boundary layer separation in the supersonic over-expanded nozzle
- Variable stepsize construction of a two-step optimized hybrid block method with relative stability
- Thermal transport with nanoparticles of fractional Oldroyd-B fluid under the effects of magnetic field, radiations, and viscous dissipation: Entropy generation; via finite difference method
- Special Issue on Advanced Energy Materials - Part I
- Voltage regulation and power-saving method of asynchronous motor based on fuzzy control theory
- The structure design of mobile charging piles
- Analysis and modeling of pitaya slices in a heat pump drying system
- Design of pulse laser high-precision ranging algorithm under low signal-to-noise ratio
- Special Issue on Geological Modeling and Geospatial Data Analysis
- Determination of luminescent characteristics of organometallic complex in land and coal mining
- InSAR terrain mapping error sources based on satellite interferometry