Determination of luminescent characteristics of organometallic complex in land and coal mining
-
Chengli Yao
 ,
Hongying Li
,
Hongying Li

Abstract
The traditional measurement methods of luminescent materials have some problems, such as low accuracy and large amount of calculation. Therefore, a new measurement method is proposed in this article. Taking molecular capture as the core, the molecular force field is established. According to the first law of hohber_Kong’s molecules captures molecular dynamics, it extracts dynamic simulation data information and takes this as the input to establish the Markov data analysis model. The molecular dynamics data were input, and the multi-index method was used to describe the characteristics of metal complex luminescent materials. According to the external shape of the material and the tightness of molecular blocks, the dynamic observation index of the current complex can be obtained to determine the characteristics of luminescent materials. The experimental data show that the method in this article has higher accuracy, lower amount of calculation and good overall error adjustment effect. It can effectively determine the characteristics of complex luminescent materials.
1 Introduction
Since industrialization, the predatory exploitation of coal resources has led to serious social and ecological environmental problems. The coal mining damages the vegetation, leading to land subsidence. A large amount of wastewater not only destroys surface water resources, but also pollutes groundwater resources. Coal mining will emit a lot of waste gas and pollute the air. If the land resources, water resources and air in the coal mining area are damaged, the normal living environment of residents around the mining area will be seriously affected. A large number of residents will be relocated as a result, thus affecting social stability [1]. These problems are not the only important problems faced by a region or country. They have become global problem, seriously affecting the ecosystem function of areas based on coal resources [2]. Relevant researches show that the value estimation and analysis of ecosystem functions must be taken as an international major topic [3,4]. Many regions based on coal resources in China once made great achievements in economic construction. With the disruption of ecosystem structure and the degradation of ecosystem function, many areas are falling into the “Resource Curse” [5]. “The 12th Five Year Plan for Coal Industry Development” pointed out that 14 large-scale coal bases of 100 million tons have been established nationwide. The problems of soil erosion and vegetation destruction caused by coal mining in these coal bases were very prominent [6,7,8]. The ground collapse occurred from time to time. Groundwater pollution, air pollution and noise pollution were also prominent [9,10]. For example, the land subsidence area caused by coal mining in the Lianghuai coal base of Anhui province was about 776 km2 in 2016, and the growth rate of land subsidence area from 2017 to 2025 was about 38.5 km2/year. At this rate, the land subsidence area will reach 1,085 km2 by 2,025. The subsidence area of Huainan city caused by coal mining reached 220 km2 in 2013, accounting for 8.5% of the total area [11]. About 311,000 residents are affected to varying degrees. It is predicted that the subsidence area of Huainan city will reach 369 km2 by 2020.
We can see that coal mining has a certain impact on the coal resource mining area, threatening the ecosystem function of the mining area. For a long time, people have not fully realized the ecosystem function of the mining area and the function that the ecosystem can guarantee the natural environment conditions and effectiveness [12,13,14]. Therefore, there is a lack of theoretical education and practical guidance to maintain the stable development of ecosystem function [15,16]. Although there are many research studies on the influence of mineral resources exploitation on the function of regional ecosystem, few people have conducted in-depth research and analysis on how the function of the ecosystem in these relatively fragile regions based on mineral resources is affected by the stress of mineral resources exploitation, without forming a relatively unified concept and a relatively complete theoretical system [17,18]. System dynamics is a quantitative analysis tool. Its principle is to build a nonlinear system model to explore the interaction between different influencing factors and to thus achieve the comprehensive interdisciplinary research on coal mining. How to maintain the ecosystem function and sustainable development of coal mining areas and how to establish effective safety prevention and control strategies have been the major theoretical and practical problems to be solved in the national comprehensive management for the ecological environment in the regions based on a mineral resource [19,20].
The luminescent material of the organometallic complex is an important luminescent material in coal mining, which can perfectly replace the traditional hot-melt complex luminescent materials and improve the environmental protection properties of coal mining [21,22]. Generally, the luminescent materials of organometallic complexes need to meet the following requirements: The selection of luminescent materials must meet fluorescence characteristics with high quantum efficiency and good semiconductor characteristics. In addition, the materials must be easy to form dense amorphous films and not easy to change with time. Meanwhile, it should have good thermal stability, chemical stability and carrier transport function [23]. The application of luminescent materials of organometallic complexes must be based on the perfect measurement results. At present, the polymerized luminescent materials are generally measured by the data of device advantage ratio and wet membrane technology [24,25,26]. In the process of measuring information, if the dissolvent is damaged, the data will be greatly affected. A new method for measuring the property of luminescent material of organometallic complex is put forward. The specific research ideas are as follows:
First, taking molecular capture as the core, the molecular dynamics simulation of organometallic complex luminescent materials in current land coal mining is carried out from the micro point of view. Based on the long-range electrostatic function, long-range induced function, Great Wall dispersion function, and short-range repulsion function, the molecular force field is established.
Second, according to the first law of hohber_Kong’s molecules captures molecular dynamics, extracts dynamic simulation data information, and takes this as the input to establish the Markov data analysis model;
Then, the molecular dynamics data are input, and the multi-index method is used to describe the characteristics of metal complex luminescent materials. According to the external shape of the material and the tightness of the molecular block, the dynamic observation index of the current complex can be obtained to realize the characteristic measurement.
Finally, it summarizes the full text.
2 Materials and methods
The core problem of molecular dynamics simulation for luminescent materials of metal chelates is molecular capture. Due to the difference of elasticity and strength, traditional simulation methods are difficult to support large-scale molecular capture behavior. Therefore, the method of molecular dynamics simulation for luminescent materials of metal chelates is adopted [27,28,29]. First, the molecular force field is constructed and the molecular potential functions are integrated, including the long-range electrostatic function, long-range induction function, long-range dispersion function and short-range repulsion function. Under the action of the molecular force field, the first law of hohber_Kong’s molecules captures molecular dynamics and VERLET algorithm are used to capture molecule. The dynamic constraint is imposed on the captured molecules. This mainly depends on the SHAKE algorithm. According to the constraint results and quantum mechanics formula, the simulation of dynamics is achieved. The process framework is shown in Figure 1.
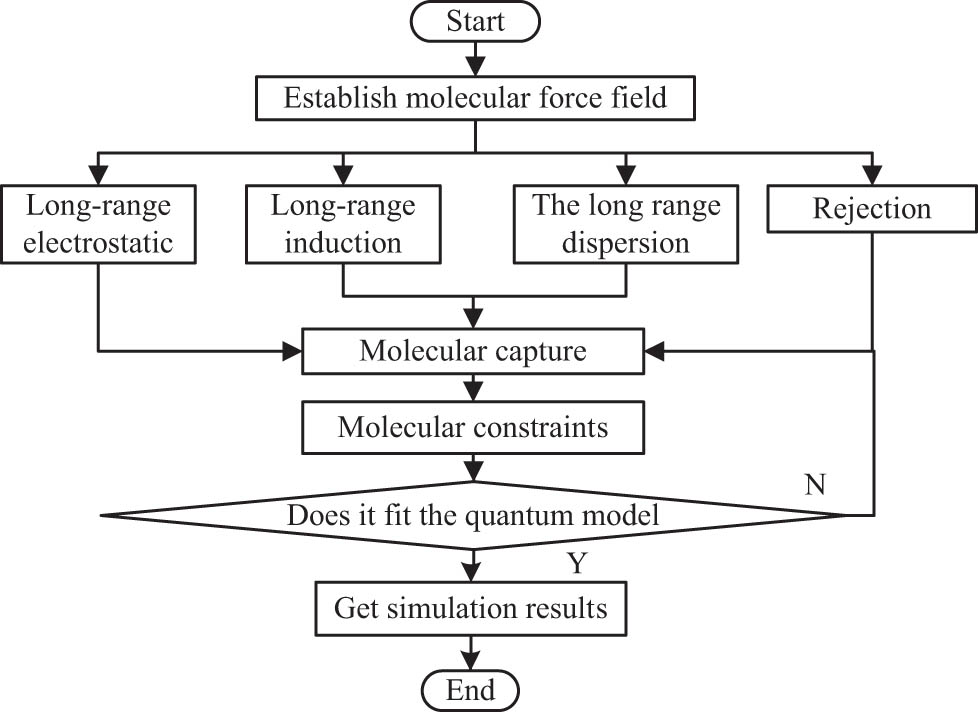
Schematic diagram of molecular field.
2.1 Establishment of molecular force field
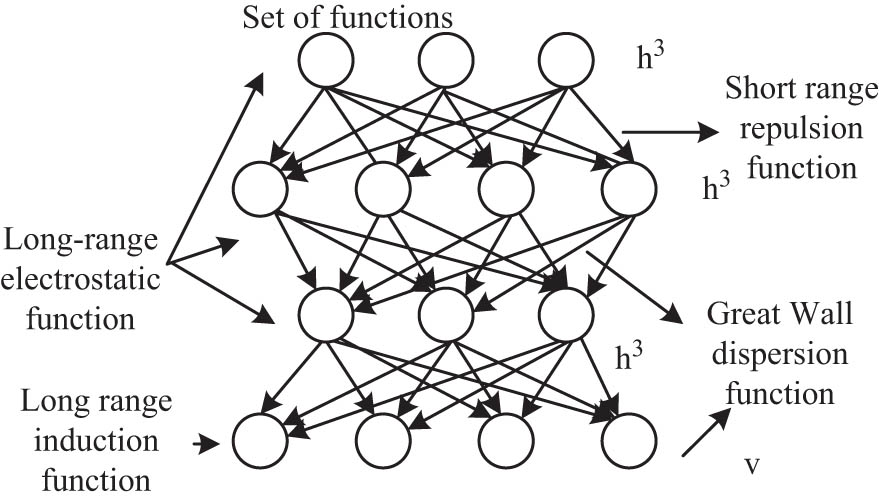
The molecular force field can be regarded as the set of molecular potential functions. The molecular potential function is a functional expression describing the potential energy relationship of molecular interaction. In the process of physical application of coal mining and the process of physical application of luminescent materials, the molecular interaction mainly includes attraction and repulsion. The interaction is generally long-range interaction, including molecular electrostatic force, molecular induction and molecular data dispersion. In addition, the short-term effect is the repulsion interaction. In the expression of molecular potential energy, the molecular potential function of luminescent materials of metal chelates is expressed by a power function, and the short-range function is expressed by an exponential function. Based on the above criteria, the molecular force field is built by long-range electrostatic function, long-range induction function, long-range dispersion function and short-range repulsion function. The schematic diagram is shown in Figure 2.
2.1.1 Long-range electrostatic force field
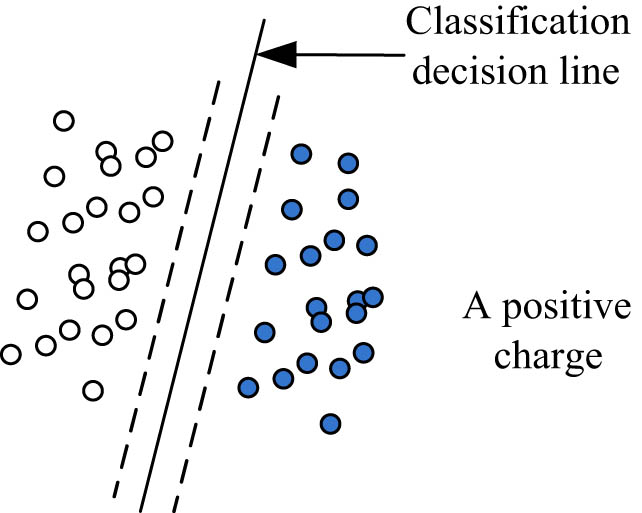
In the actual coal mining process, the interaction of molecules in luminescent materials of metal complexes due to their own charge is called electrostatic action. According to the above analysis, we can confirm that electrostatic action belongs to the long-range action. Because the metal chelates belong to the crystalline molecules, they are also spherical symmetry molecules. The external charge shows the spherical distribution. The positive charges and negative charges are completely overlapped, so this molecule is also called non-polar molecule. When the dipole moment appears in the center of positive charge and negative charge of molecule, some central molecules with many positive and negative charges may appear in the process of physical application of coal mining, such as quadrupole moment, octupole moment, and hexadecapole moment. These molecules can appear as polar molecules. The schematic diagram is shown in Figure 3.
Use of functions.
Molecular field of electrostatic interaction.
Under the long-range electrostatic force field, the electrostatic effect of charge force field in the luminescent material of metal chelates is expressed as follows:
The above formula shows the electrostatic interaction between the molecular charge
In formula (1), the interaction of electric moments of crystal molecules is related to the molecular spatial orientation
In the formula, θ i and θ j are the spatial value between different molecules in the physical application of amorphous coal mining. When the solidification temperature fluctuates, BoltzMANN factor needs to be upgraded by series and integral. According to the above formula, the force field of electrostatic charge is established as follows:
In Eq. (3), under the long-term electrostatic force field, the molecular components of luminescent materials of metal chelates show the suction effect in the process of physical application of coal mining. The value range is negative, which is directly related to the strong and weak distance.
2.1.2 Long-range induced force field
When an external electric field exists in the luminescent materials of metal chelates, the core end of positive charge and negative charge of the molecule will move in different directions. After the polarization process of molecular migration, the induced dipole will be formed under the induced action.
This planning ability of amorphous molecules can be described in terms of polarizability
Eq. (4) shows the inductive interaction field between molecules in the physical application of amorphous coal mining. In the formula,
2.1.3 Long-range chromatic dispersion force field
There are no inert molecules with dipole moment and multipole moment in luminescent materials of metal chelates. Although the molecular charges generated in the application process coincide at the center, the instantaneous charge distribution is not uniform. Therefore, there will be instantaneous dipole and multipole even electrodes during solidification. This statistical plan of instantaneous molecules generally needs to set the mean value to zero. From the macroscopic point of view, there are periodic fluctuations in luminescent materials of metal chelates. When the molecules collide at a short distance, the periodic dispersion fluctuation will form a dipole at the moment, to ensure the inductive effect of its neighboring molecules and produce the molecular attraction [30].
The long-range chromatic dispersion force field is expressed as follows:
In the above formula,
2.1.4 Short-distance repulsive force field
In the process of physical application of luminescent materials of metal chelates, when the molecular distance is reduced to a certain extent and the molecular dispersion force fields are overlapped, an obvious repulsion effect appears. Only when the molecular overlap occurs in the solidification process, the reaction will occur and it decays with the distance index, so it belongs to the short-range effect. As an approximate process, it is necessary to express the short-range repulsion in the form of a power function [31]:
In the formula, the value range of m is between 8 and 16, and the most commonly used data value is 12.
The above four force fields constitute the whole molecular force field of the current metal complex luminescent materials. According to the standard of data formula, the molecular dynamics standard is designed and introduced, including elementary molecular dynamics and restrained molecular dynamics, to capture the molecular mimicry of current metal complex luminescent materials.
2.2 Restrained dynamic capture of molecules
According to the first law of hohber_Kong’s molecules captures molecular dynamics, the microscopic state of ground state molecule will be determined by molecular nuclear skeleton. At this time, the evolution of molecular time is directly proportional to the evolution of geometric structure. According to the laws of nuclear movement and classical mechanics, all data evolution information of ground state molecular system can be obtained by classical mechanics. On this basis, the constraint ability of force field and molecular dynamics data are used to capture the constraint dynamics. The positive order evolution of molecular constraint dynamics is shown in Figure 4.
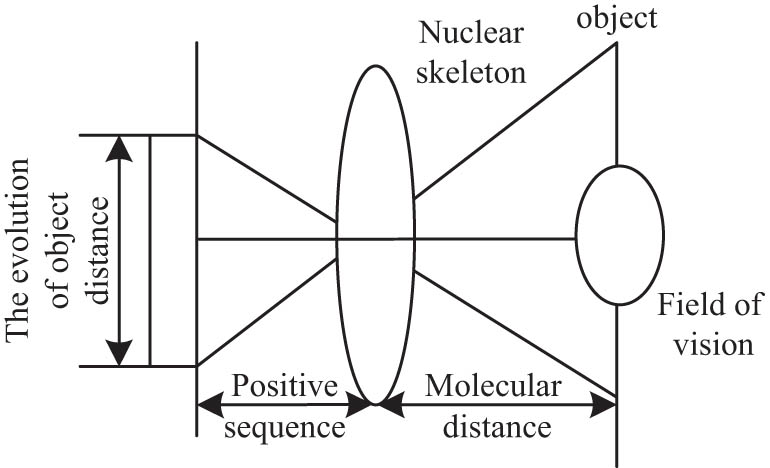
Positive-sequence evolution of molecular constraint dynamics.
Generally, the molecular dynamics simulation includes three steps. The first is to set the calculation system of total potential energy, including the concepts of quantum mechanics. Under a certain allowable accuracy, the “rough” fitting data results are obtained by force field data. Due to the limitation of computer simulation and processing ability, most of molecular dynamics simulation and potential energy calculation are realized by force field data. The second is to calculate the nuclear change skeleton and deduce the time. This part completely depends on the classical mechanical formula. Finally, the potential energy of any dynamics in the current molecular system is calculated to get the basis of material properties and realize the capture of constrained dynamics. This part includes the deduction of time data and the collection of data-specific properties. The following is the core deduction process of binding force capture. For the molecular system of N particles in the luminescent materials of metal chelates, the phase points of the system in the relative space of the molecular force field are as follows:
The classical molecular mechanics data defines that
In formula (8),
Eq. (9) can be regarded as a differential equation, which can solve the relational expression directly by numerical method. The finite difference method is adopted in this design, and the result items are obtained by the time step in the physical application of metal chelates luminescent material. In the process of molecular capture, it is necessary to combine with the molecular position to solve data items. The solidified molecule has a faster vibration frequency. In the commonly used data integration method, the molecular dynamic capture is simulated by VERLET algorithm.
VERLET algorithm is one of the most important and classic algorithms in molecular dynamic capture simulation. Its basic equation is as follows:
Eq. (10) can be regarded as a recursive equation. When the initial condition is fixed, the evolution process of the motion rate of the skeleton extracted by molecular solidification can be obtained by recursive conditions.
The key to VERLET algorithm is practice. The relational expression
This makes the calculation accuracy of speed in the current step only have O(Δt 2). In the capture calculation, for the simulation of the molecular layer of luminescent materials of metal complexes, there is no non-conservative force between molecules, but a fixed conservative system. The molecular dynamics of luminescent materials of metal complexes can be simulated and the molecular capture can be realized by VERLET algorithm and the transformation system.
The capture process is shown in Figure 5.

Capture process.
2.3 Molecular dynamics simulation of distributed luminescent materials
In principle, the time of simulating molecular capture of chelates is long enough, and the capture situation can be extracted. In the actual calculation, it is found that the single capture can only define the past stable molecules, and it is unable to describe the normal molecules, so it is necessary to introduce the molecular dynamics constraint algorithm (SHAKE).
SHAKE algorithm is one of the molecular capture constraint algorithms. This algorithm uses Lagrange undetermined data factors and the molecular projection kernel algorithm to constrain the current capture molecules by the extreme value, which belongs to the implicit algorithm as a whole.
For the N-particle system, there are n linear constraints at time t.
In the formula,
The plus sign is on the right side of the formula. The front end is the binding force and the back end is unrestraint. When the molecule satisfies the constraint criteria,
The molecular formulas after the constraint are converged, and then the quantum mechanical formula is introduced. Quantum mechanics holds that the current solidified molecules can obey the Schrdli formula:
In the formula,
Quantum mechanics needs computational cost, but accurate data calculation and solution often can be used for basic simulation, so it is necessary to adopt PC simulation software. In principle, the above quantum mechanical calculation system can be used to obtain the molecular properties and all the evolution rules of dynamics simulation of metal complex luminescent materials.
3 Analysis of characteristics of electroluminescent materials
3.1 Design of Markov model
In the above process, the molecular dynamics of the power-distribution luminous materials was simulated in current land and coal mining. In order to understand the characteristic of the material, it is necessary to carry out a dynamic analysis. The hidden Markov model (HMM) is chosen as the analytical model.
Essentially, the HMM is an analytical statistical model, including the following data parameters: S is to analyze the data in discrete state, then
O denotes the data symbol set of the current electroluminescent material,
The HMM belongs to a double random process in the analysis and research of material characteristics, including the data random process and Markov chain, as shown in Figure 6.

HMM diagram.
Markov data chain describes the dynamic reaction mechanism of molecular state transition of materials. Generally, it is influenced by the above transition matrix A, the probability distribution in the initial state is
In order to ensure the normal calculation and statistics of the HMM, some parameters such as π, A and B need to be determined. The model is denoted by λ = (A, B, π).
The observation serial number P of the current model may come from the dynamical multi-type state sequence of the electroluminescent material of complex or the state sequence of observation symbol with the same length:
The actual probability of generating sequence P by current model sequence Q is:
If there is an independent data in the current observation data, Eq. (16) can be extended:
Therefore, the parameter
The HMM can determine the current molecular dynamics sequence of electroluminescent material of chelates and estimate the actual probability of new dynamic molecular activities through data analysis. In the land and coal mining activities, it is difficult to get the resource mode, so the corresponding characteristics of the electroluminescent material of chelates cannot be effectively extracted. Macro observation and monitoring is the only way to get the resource mode. Therefore, the current molecular dynamic term of materials is taken as the observation signal of HMM. By continuously collecting the molecular dynamic behavior, we can establish the conventional mode of behavior.
3.2 Realization of material characteristic determination
Using the above Markov model to analyze and summarize the molecular dynamics simulation index of the current luminescent materials of organic metal chelates can extract the measured value of material characteristics. In order to ensure that the material characteristics are consistent with the current application results of land coal mining, the multi-index method is used to describe the characteristics of luminescent materials. According to the external shape of the material and the compactness of the molecular block, the current dynamic observation index of metal chelates can be obtained, including the characterization on the scale and the dimension value of complexity of the molecular edge. Based on the discrete degree of landscape patches on the image, the above data can be used to set up a multi-index set. On this basis, the degree of landscape aggregation can be determined.
The near-circular index of the molecule: SIC i . The closer the shape of the molecular block is, the more circular the overall molecular distribution area is close to the circle, so that the near-circle index is closer to 1. The smaller the index, the more complex the molecular formation. Its formula expression is:
Square index SIS l : The value of this index is generally greater than 1 or equal to 1. The larger the value is, the more complex the molecular block of the current complex is and the greater the degree of polymerization is. Its formula expression is:
Fractal dimension D: This value reflects the complexity of the molecular edge at the current observation scale. The smaller the value is, the stronger the molecular similarity is. Its formula expression is:
Separating degree F l : This index can be expressed as the dispersion degree of spatial distribution under the current aggregation degree of complex luminescent materials. The larger the value is, the higher the molecular dispersion degree is. Its formula is as follows:
In above formulas,
In the actual characteristic exploration, according to the demand of current material application, the characteristic data of material application can be input into the PC during coal mining. Thus, the data result is the final exploration result.
4 Results
After designing the simulation method, we carried out the simulation experiment to test the comprehensive performance of the designed method and extract experimental data. And then, we carried out subsequent development and application of the experimental results. This experiment contains two parts. The first part is to measure the collection and distribution rate of the molecule during the amorphous solidification process of the complex electroluminescent materials. By comparing the molecular collection and distribution rates of organic metal complex electroluminescent materials by different simulation methods, the molecular capture situation is determined. The second part is the supplement for the first part. By determining the effective data of molecular computation, one can judge whether the experimental data in the first part is true and effective, so as to determine the experimental results.
The experimental group selected the traditional dynamic simulation method of temperature control to compare the data. Due to the equipment, this experiment was completed in the laboratory environment through data simulation.
4.1 Comparison of collecting and distributing degrees of amorphous molecular in complex luminescent materials
The mixed amorphous materials are taken as experimental samples for processing, and the main components are shown in Table 1.
Amorphous materials for experiment
| CaO | SiO2 | Al2O3 | MgO |
|---|---|---|---|
| 4.68 | 35.28 | 11.95 | 0.85 |
| TFe | S | F | — |
| 1.17 | 0.51 | 1.38 | — |
In the laboratory environment, we take the same dosage of crystal test sample for solidification. Firstly, we compare two schemes and then record the solidification process of crystalline materials and the collecting and distributing rate of molecules. The results are shown in Figure 7.
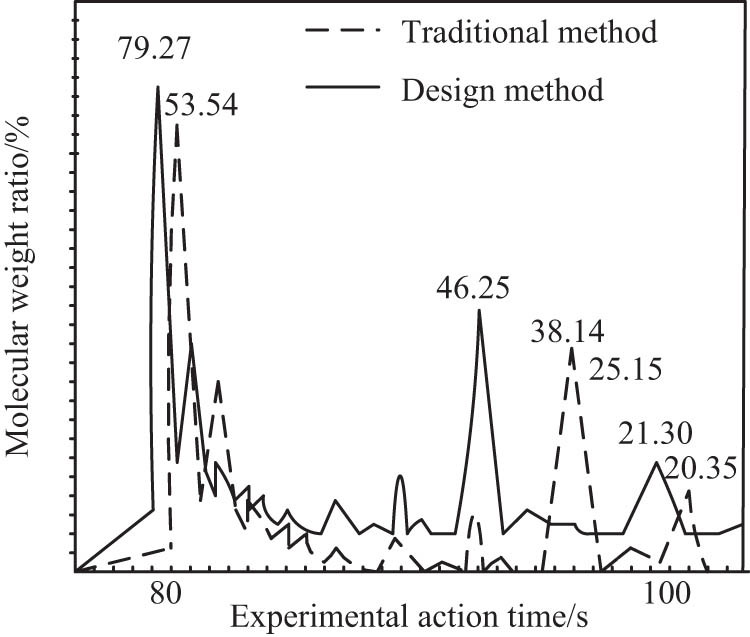
Comparison of distribution rate of amorphous materials.
Figure 7 is a comparison of molecular distribution rates of the current molecular dynamics simulation of the solidification process of complex amorphous materials by the traditional methods and designed methods. The results combine the chemical analysis with X-ray diffraction. The main styles are SiO2, Al2O3, and CaO. In this experiment, three peaks were selected for joint comparison, and their discrete rates were marked. According to the final statistics, using the above dynamic simulation method, the molecular distribution rate of amorphous materials during solidification was increased by 27%.
4.2 Comparison of effective molecule computation
The effective molecule computation is the auxiliary parameter of the above distribution rate, which is mainly used to determine the amount of molecular data included in the comparison of molecular distribution rates. The higher the statistical results of computation, the better the capture effect. Table 2 shows the comparison results of effective molecular computation of the two simulation methods.
Comparison of molecular computation
| Molecular region | Traditional determination | Designed determination |
|---|---|---|
| T1 | 1.73 | 2.09 |
| T2 | 1.97 | 2.25 |
| T3 | 1.28 | 1.85 |
| T4 | 2.05 | 3.25 |
| T5 | 2.15 | 2.95 |
| T6 | 1.25 | 1.60 |
| T7 | 1.05 | 1.85 |
| T8 | 2.12 | 2.80 |
| T9 | 1.95 | 3.01 |
| T10 | 1.80 | 2.08 |
| T11 | 0.92 | 1.52 |
| T12 | 1.17 | 1.92 |
Theoretically, the molecular computation has no direct relation with the current molecular weight. Generally, it is the summary and generalization for the molecular calculation region. The data in Table 2 clearly reflects the molecular computation of the two experimental simulation methods. In 12 target regions, the computation of the traditional simulation method is lower than that of the designed method, and the difference ratio is more than 21%. Thus, the experimental judgment is proved again.
5 Conclusion
In order to determine the properties of luminescent materials of organometallic complexes, a new method was proposed. Establish the molecular force field according to hohber_Kong’s first law of molecules captures the molecular dynamics, extracts the kinetic simulation data information, and uses the multi-exponential method to describe the characteristics of the luminescent materials of metal complexes. According to the external shape of the material and the tightness of the molecular block, the dynamic observation index of the current complex can be obtained to realize the characteristic measurement. The experimental results show that the molecular distribution rate of amorphous materials during solidification is increased by 27%. In 12 target regions, the molecular calculation amount of this method is high, up to 3.25, and the overall error mediation effect is good. It can effectively determine the characteristics of complex luminescent materials.
Although this method has made some progress in the overall error mediation of measuring the characteristics of luminescent materials, the detection process of the characteristics of luminescent materials is complex and time-consuming.
-
Funding information: This work is supported by the Natural Science Foundation of Anhui Province (1808085MB35) and Anhui Province Key Laboratory of Environment-friendly Polymer Materials.
-
Author contributions: All authors have accepted responsibility for the entire content of this manuscript and approved its submission.
-
Conflict of interest: The authors state no conflict of interest.
References
[1] Alexander C, Ekaterina A, Andrey A, Stepan I, Sergei Y. High power single spatial mode superluminescent diodes at 675 nm. Electron Lett. 2017;53(23):1539–40.10.1049/el.2017.2944Search in Google Scholar
[2] Angelo M, Marco B, Nobuhiro Y, Kimizuka N, Fazzi D, Campione M, et al. Highly fluorescent metal-organic-framework nanocomposites for photonic applications. Nano Lett. 2017;18(1):528–34.10.1021/acs.nanolett.7b04536Search in Google Scholar
[3] Einkauf JD, Clark JM, Paulive A, Tanner G, Daniel DL. A general model of sensitized luminescence in lanthanide-based coordination polymers and metal-organic framework materials. Inorg Chem. 2017;56(10):5544.10.1021/acs.inorgchem.6b02838Search in Google Scholar PubMed
[4] Zheng HB, Chen W, Gao H, Wang YY, Guo HY, Guo SQ, et al. Melem: An efficient metal-free luminescent material. J Mater Chem C. 2017;5(41):9–18.10.1039/C7TC02966GSearch in Google Scholar
[5] Liu J, Yang GP, Wu YL, Deng YW, Tan QS, Zhang WY, et al. New luminescent three-dimensional Zn (II)/Cd (II)-based metal-organic frameworks showing high H2 uptake and CO2 selectivity capacity. Cryst Growth Des. 2017;17(4):7–9.10.1021/acs.cgd.7b00042Search in Google Scholar
[6] Dinc Gogus O. 3D discrete analysis of damage evolution of hard rock under tension. Arab J Geosci. 2020;13(14):1.10.1007/s12517-020-05684-1Search in Google Scholar
[7] Eze SO, Onwe-Moses DF, Okoro AU, Aghamelu OP. Organic geochemical characterization of the cenomanian-turonian eze-aku (southern benue trough) and campanian nkporo shales (anambra basin), southeastern Nigeria. Arab J Geosci. 2020;13(14):1866–75.10.1007/s12517-020-05677-0Search in Google Scholar
[8] Hussain A, Kazmi JH. A geospatial approach for telematics analysis: Case study of Misri Shahtelephone exchange service coverage area DHA phase-VI, Karachi, Pakistan. Arab J Geosci. 2020;13(14):656–62.10.1007/s12517-020-05656-5Search in Google Scholar
[9] Fan K, Bao SS, Nie WX, Liao C, Zheng LM. Iridium (III)-based metal-organic frameworks as multiresponsive luminescent sensors for Fe3+, Cr2O72–, and ATP 2 – in aqueous media. Inorgan Chem. 2018;57(3):17–8.10.1021/acs.inorgchem.7b02513Search in Google Scholar PubMed
[10] Stangl J, Dietrich D, Sedykh A, MüllerBuschbaum K. Luminescent metal-organic framework mixed matrix membranes for humidity sensing in real status analysis. J Mater Chem C. 2018;6(34):7–8.10.1039/C8TC01454JSearch in Google Scholar
[11] Maqsood U, Tahir A, Fatima K, Rahman A. Interpreting rescue vehicle patterns using geovisual analytics for spatiotemporal resource allocation. Arab J Geosci. 2020;13(14):660–8.10.1007/s12517-020-05643-wSearch in Google Scholar
[12] Abboud IA, Nofal RAE. Using remote sensing techniques to interpret geomorphological features along the east coast of the Red Sea, at Yanbu, Saudi Arabia. Arab J Geosci. 2020;13(14):652–8.10.1007/s12517-020-05635-wSearch in Google Scholar
[13] Kumar S, Mishra AK. Reduction of blast-induced ground vibration and utilization of explosive energy using low-density explosives for environmentally sensitive areas. Arab J Geosci. 2020;13(14):655–62.10.1007/s12517-020-05645-8Search in Google Scholar
[14] Waheeb AG, Sundoly HEL. Tensile stress and related Th-U-REE mineralizations in the granite of Wadi Ras Abda, North Eastern Desert, Egypt. Arab J Geosci. 2020;13(14):659–66.10.1007/s12517-020-05543-zSearch in Google Scholar
[15] Li LN, Shen SS, Lin RY, Bai Y, Liu HW. Rapid and specific luminescent sensing of Cu (II) Ion with porphyrinic metal-organic framework. Chem Commun. 2017;53(72):7–8.10.1039/C7CC04250GSearch in Google Scholar
[16] Li LN, Shen SS, Su J, Ai WP, Bai Y, Liu HW. Facile one-step solvothermal synthesis of a luminescent europium metal-organic framework for rapid and selective sensing of uranyl ions. Anal Bioanal Chemi. 2019;411(3):15–8.10.1007/s00216-019-01875-2Search in Google Scholar PubMed
[17] Lustig W, Mukherjee S, Rudd N, Desai A, Li J, Ghosh S. Metal-organic frameworks: Functional luminescent and photonic materials for sensing applications. Chem Soc Rev. 2017;46(11):3242.10.1039/C6CS00930ASearch in Google Scholar
[18] Zhang Q, Wang CF, Lv YK. Luminescent switch sensors for the detection of biomolecules based on metal-organic frameworks. Anal. 2018;143(18):17–8.10.1039/C8AN00816GSearch in Google Scholar PubMed
[19] Zhang WQ, Li QY, Cheng JY, Cheng K, Yang XY, Li YW, et al. Ratiometric luminescent detection of organic amines due to the induced lactam-lactim tautomerization of organic linker in a metal-organic framework. Acs Appl Mater Interface. 2017;9(37):31352–6.10.1021/acsami.7b11125Search in Google Scholar PubMed
[20] Chen P, Zeng Q, Guo W, Chen J. The source, enrichment and precipitation of ore-forming elements for porphyry Mo deposit: Evidences from melt inclusions, biotite and fluorite in Dasuji deposit, China. Ore Geol Rev. 2021;135(12):104205–12.10.1016/j.oregeorev.2021.104205Search in Google Scholar
[21] Tong WQ, Liu WN, Cheng JG, Zhang PF, Li GP, Hou L, et al. A new stable luminescent Cd (II) metal-organic framework with fluorescent sensing and selective dye adsorption properties. Dalton Trans. 2018;47(28):14–8.10.1039/C8DT01694ASearch in Google Scholar PubMed
[22] Wu RZ, Yang X, Zhang LW, Zhou PP. Luminescent lanthanide metal-organic frameworks for chemical sensing and toxic anion detection. Dalton Trans. 2017;46(18):9859–67.10.1039/C7DT01790ASearch in Google Scholar PubMed
[23] Cui YJ, Yue D, Huang YK, Zhang J, Wang ZY, Yang D, et al. Photo-induced electron transfer in metal-organic framework: A new approach towards highly sensitive luminescent probe of Fe3. Chem Commun. 2019;55(75):78–5.10.1039/C9CC05019ASearch in Google Scholar
[24] Abdelhalim A, Aboelkhair H, Hamimi Z, Al-Gabali M. Mapping lineament features using GIS approaches: Case study of Neoproterozoic basement rocks in the South-Eastern Desert of Egypt. Arab J Geosci. 2020;13(14):156–68.10.1007/s12517-020-05673-4Search in Google Scholar
[25] Chabuk A, Al-Madhlom Q, Al-Maliki A, Al-Ansari N, Hussain HM, Laue J. Water quality assessment along Tigris River (Iraq) using water quality index (WQI) and GIS software. Arab J Geosci. 2020;13(65):128–32.10.1007/s12517-020-05575-5Search in Google Scholar
[26] Kateb Z, Bouchelkia H, Benmansour A, Belarbi F. Sediment transport modeling by the SWAT model using two scenarios in the watershed of Beni Haroun dam in Algeria. Arab J Geosci. 2020;13(14):654–68.10.1007/s12517-020-05623-0Search in Google Scholar
[27] Alfonso MJFI, Milán DPS, Córdoba JVAI, Colmenero NP. Some improvements on relativistic positioning systems. Appl Math Nonlinear Sci. 2018;3:161–6.10.21042/AMNS.2018.1.00012Search in Google Scholar
[28] Ammar MK, Oda DA. Design of gravity assist trajectory from earth to Jupiter. Appl Math Nonlinear Sci. 2018;3:151–60.10.21042/AMNS.2018.1.00011Search in Google Scholar
[29] Harraga H, Yebdri M. Attractors for a nonautonomous reaction-diffusion equation with delay. Appl Math Nonlinear Sci. 2018;3(1):127–50.10.21042/AMNS.2018.1.00010Search in Google Scholar
[30] Fan C, Li H, Qin Q, He S, Zhong C. Geological conditions and exploration potential of shale gas reservoir in Wufeng and Longmaxi Formation of southeastern Sichuan Basin, China. J Petrol Sci Eng. 2020;191:107138.10.1016/j.petrol.2020.107138Search in Google Scholar
[31] Pandey PK. A new computational algorithm for the solution of second order initial value problems in ordinary differential equations. Appl Math Nonlinear Sci. 2018;3:107138–49.10.21042/AMNS.2018.1.00013Search in Google Scholar
© 2022 Chengli Yao et al., published by De Gruyter
This work is licensed under the Creative Commons Attribution 4.0 International License.
Articles in the same Issue
- Regular Articles
- Test influence of screen thickness on double-N six-light-screen sky screen target
- Analysis on the speed properties of the shock wave in light curtain
- Abundant accurate analytical and semi-analytical solutions of the positive Gardner–Kadomtsev–Petviashvili equation
- Measured distribution of cloud chamber tracks from radioactive decay: A new empirical approach to investigating the quantum measurement problem
- Nuclear radiation detection based on the convolutional neural network under public surveillance scenarios
- Effect of process parameters on density and mechanical behaviour of a selective laser melted 17-4PH stainless steel alloy
- Performance evaluation of self-mixing interferometer with the ceramic type piezoelectric accelerometers
- Effect of geometry error on the non-Newtonian flow in the ceramic microchannel molded by SLA
- Numerical investigation of ozone decomposition by self-excited oscillation cavitation jet
- Modeling electrostatic potential in FDSOI MOSFETS: An approach based on homotopy perturbations
- Modeling analysis of microenvironment of 3D cell mechanics based on machine vision
- Numerical solution for two-dimensional partial differential equations using SM’s method
- Multiple velocity composition in the standard synchronization
- Electroosmotic flow for Eyring fluid with Navier slip boundary condition under high zeta potential in a parallel microchannel
- Soliton solutions of Calogero–Degasperis–Fokas dynamical equation via modified mathematical methods
- Performance evaluation of a high-performance offshore cementing wastes accelerating agent
- Sapphire irradiation by phosphorus as an approach to improve its optical properties
- A physical model for calculating cementing quality based on the XGboost algorithm
- Experimental investigation and numerical analysis of stress concentration distribution at the typical slots for stiffeners
- An analytical model for solute transport from blood to tissue
- Finite-size effects in one-dimensional Bose–Einstein condensation of photons
- Drying kinetics of Pleurotus eryngii slices during hot air drying
- Computer-aided measurement technology for Cu2ZnSnS4 thin-film solar cell characteristics
- QCD phase diagram in a finite volume in the PNJL model
- Study on abundant analytical solutions of the new coupled Konno–Oono equation in the magnetic field
- Experimental analysis of a laser beam propagating in angular turbulence
- Numerical investigation of heat transfer in the nanofluids under the impact of length and radius of carbon nanotubes
- Multiple rogue wave solutions of a generalized (3+1)-dimensional variable-coefficient Kadomtsev--Petviashvili equation
- Optical properties and thermal stability of the H+-implanted Dy3+/Tm3+-codoped GeS2–Ga2S3–PbI2 chalcohalide glass waveguide
- Nonlinear dynamics for different nonautonomous wave structure solutions
- Numerical analysis of bioconvection-MHD flow of Williamson nanofluid with gyrotactic microbes and thermal radiation: New iterative method
- Modeling extreme value data with an upside down bathtub-shaped failure rate model
- Abundant optical soliton structures to the Fokas system arising in monomode optical fibers
- Analysis of the partially ionized kerosene oil-based ternary nanofluid flow over a convectively heated rotating surface
- Multiple-scale analysis of the parametric-driven sine-Gordon equation with phase shifts
- Magnetofluid unsteady electroosmotic flow of Jeffrey fluid at high zeta potential in parallel microchannels
- Effect of plasma-activated water on microbial quality and physicochemical properties of fresh beef
- The finite element modeling of the impacting process of hard particles on pump components
- Analysis of respiratory mechanics models with different kernels
- Extended warranty decision model of failure dependence wind turbine system based on cost-effectiveness analysis
- Breather wave and double-periodic soliton solutions for a (2+1)-dimensional generalized Hirota–Satsuma–Ito equation
- First-principle calculation of electronic structure and optical properties of (P, Ga, P–Ga) doped graphene
- Numerical simulation of nanofluid flow between two parallel disks using 3-stage Lobatto III-A formula
- Optimization method for detection a flying bullet
- Angle error control model of laser profilometer contact measurement
- Numerical study on flue gas–liquid flow with side-entering mixing
- Travelling waves solutions of the KP equation in weakly dispersive media
- Characterization of damage morphology of structural SiO2 film induced by nanosecond pulsed laser
- A study of generalized hypergeometric Matrix functions via two-parameter Mittag–Leffler matrix function
- Study of the length and influencing factors of air plasma ignition time
- Analysis of parametric effects in the wave profile of the variant Boussinesq equation through two analytical approaches
- The nonlinear vibration and dispersive wave systems with extended homoclinic breather wave solutions
- Generalized notion of integral inequalities of variables
- The seasonal variation in the polarization (Ex/Ey) of the characteristic wave in ionosphere plasma
- Impact of COVID 19 on the demand for an inventory model under preservation technology and advance payment facility
- Approximate solution of linear integral equations by Taylor ordering method: Applied mathematical approach
- Exploring the new optical solitons to the time-fractional integrable generalized (2+1)-dimensional nonlinear Schrödinger system via three different methods
- Irreversibility analysis in time-dependent Darcy–Forchheimer flow of viscous fluid with diffusion-thermo and thermo-diffusion effects
- Double diffusion in a combined cavity occupied by a nanofluid and heterogeneous porous media
- NTIM solution of the fractional order parabolic partial differential equations
- Jointly Rayleigh lifetime products in the presence of competing risks model
- Abundant exact solutions of higher-order dispersion variable coefficient KdV equation
- Laser cutting tobacco slice experiment: Effects of cutting power and cutting speed
- Performance evaluation of common-aperture visible and long-wave infrared imaging system based on a comprehensive resolution
- Diesel engine small-sample transfer learning fault diagnosis algorithm based on STFT time–frequency image and hyperparameter autonomous optimization deep convolutional network improved by PSO–GWO–BPNN surrogate model
- Analyses of electrokinetic energy conversion for periodic electromagnetohydrodynamic (EMHD) nanofluid through the rectangular microchannel under the Hall effects
- Propagation properties of cosh-Airy beams in an inhomogeneous medium with Gaussian PT-symmetric potentials
- Dynamics investigation on a Kadomtsev–Petviashvili equation with variable coefficients
- Study on fine characterization and reconstruction modeling of porous media based on spatially-resolved nuclear magnetic resonance technology
- Optimal block replacement policy for two-dimensional products considering imperfect maintenance with improved Salp swarm algorithm
- A hybrid forecasting model based on the group method of data handling and wavelet decomposition for monthly rivers streamflow data sets
- Hybrid pencil beam model based on photon characteristic line algorithm for lung radiotherapy in small fields
- Surface waves on a coated incompressible elastic half-space
- Radiation dose measurement on bone scintigraphy and planning clinical management
- Lie symmetry analysis for generalized short pulse equation
- Spectroscopic characteristics and dissociation of nitrogen trifluoride under external electric fields: Theoretical study
- Cross electromagnetic nanofluid flow examination with infinite shear rate viscosity and melting heat through Skan-Falkner wedge
- Convection heat–mass transfer of generalized Maxwell fluid with radiation effect, exponential heating, and chemical reaction using fractional Caputo–Fabrizio derivatives
- Weak nonlinear analysis of nanofluid convection with g-jitter using the Ginzburg--Landau model
- Strip waveguides in Yb3+-doped silicate glass formed by combination of He+ ion implantation and precise ultrashort pulse laser ablation
- Best selected forecasting models for COVID-19 pandemic
- Research on attenuation motion test at oblique incidence based on double-N six-light-screen system
- Review Articles
- Progress in epitaxial growth of stanene
- Review and validation of photovoltaic solar simulation tools/software based on case study
- Brief Report
- The Debye–Scherrer technique – rapid detection for applications
- Rapid Communication
- Radial oscillations of an electron in a Coulomb attracting field
- Special Issue on Novel Numerical and Analytical Techniques for Fractional Nonlinear Schrodinger Type - Part II
- The exact solutions of the stochastic fractional-space Allen–Cahn equation
- Propagation of some new traveling wave patterns of the double dispersive equation
- A new modified technique to study the dynamics of fractional hyperbolic-telegraph equations
- An orthotropic thermo-viscoelastic infinite medium with a cylindrical cavity of temperature dependent properties via MGT thermoelasticity
- Modeling of hepatitis B epidemic model with fractional operator
- Special Issue on Transport phenomena and thermal analysis in micro/nano-scale structure surfaces - Part III
- Investigation of effective thermal conductivity of SiC foam ceramics with various pore densities
- Nonlocal magneto-thermoelastic infinite half-space due to a periodically varying heat flow under Caputo–Fabrizio fractional derivative heat equation
- The flow and heat transfer characteristics of DPF porous media with different structures based on LBM
- Homotopy analysis method with application to thin-film flow of couple stress fluid through a vertical cylinder
- Special Issue on Advanced Topics on the Modelling and Assessment of Complicated Physical Phenomena - Part II
- Asymptotic analysis of hepatitis B epidemic model using Caputo Fabrizio fractional operator
- Influence of chemical reaction on MHD Newtonian fluid flow on vertical plate in porous medium in conjunction with thermal radiation
- Structure of analytical ion-acoustic solitary wave solutions for the dynamical system of nonlinear wave propagation
- Evaluation of ESBL resistance dynamics in Escherichia coli isolates by mathematical modeling
- On theoretical analysis of nonlinear fractional order partial Benney equations under nonsingular kernel
- The solutions of nonlinear fractional partial differential equations by using a novel technique
- Modelling and graphing the Wi-Fi wave field using the shape function
- Generalized invexity and duality in multiobjective variational problems involving non-singular fractional derivative
- Impact of the convergent geometric profile on boundary layer separation in the supersonic over-expanded nozzle
- Variable stepsize construction of a two-step optimized hybrid block method with relative stability
- Thermal transport with nanoparticles of fractional Oldroyd-B fluid under the effects of magnetic field, radiations, and viscous dissipation: Entropy generation; via finite difference method
- Special Issue on Advanced Energy Materials - Part I
- Voltage regulation and power-saving method of asynchronous motor based on fuzzy control theory
- The structure design of mobile charging piles
- Analysis and modeling of pitaya slices in a heat pump drying system
- Design of pulse laser high-precision ranging algorithm under low signal-to-noise ratio
- Special Issue on Geological Modeling and Geospatial Data Analysis
- Determination of luminescent characteristics of organometallic complex in land and coal mining
- InSAR terrain mapping error sources based on satellite interferometry