Analysis on the speed properties of the shock wave in light curtain
-
 ,
,

Abstract
In this study, we propose an improved measurement method based on light-curtain sensor, and it can obtain the hitting coordinates of supersonic projectile in a larger dispersion area. First, we analyze the speed properties of the shock wave in an effective detection area (also called light curtain in our field), and then find their change rules related to several key factors, including flight speed of the projectile, its attitude, shape, and the temperature in the testing environment. Next we improve a measurement system using wide-angle light-curtain sensor combined with calibration device of the shock speed; especially, this device with three parallel laser beams can effectively measure the shock speed in the light curtain. According to the related structural relation, we derive several computational formulas combined with the shock speed to obtain the hitting position of the measured projectile. Through live ammunition experiments, the results show that the proposed method is feasible and reliable for the supersonic projectile. Besides high accuracy, it also has many advantages, such as fewer sensors, lower requirement for installation, and larger detection area, by comparison with previous measurement systems.
1 Introduction
For various barrel weapons (i.e., pistol, rifle, machine gun, etc.), shooting accuracy is a key performance parameter. In the field, its concept can be usually described as a statistic of deviation from all hitting coordinates to the center of their dispersion. Accordingly, people always expect the hitting coordinates of every projectile to be accurately measured. Nowadays, more advanced weapons (e.g., electromagnetic gun, missile with scram-jet engine, etc.) have longer effective shooting range (i.e., 1,000 m and longer); generally, the projectile speed is beyond five times that of sound. Moreover, this also brings about a large dispersion radius of their projectile holes on the target due to some interference factors, such as jump angle, wind speed, wind direction, air density, air temperature. Obviously, this requires a larger detection area (up to 10 m × 10 m), and high measurement accuracy and reliability. For the supersonic projectile, the measurement of its hitting coordinates thus face more serious challenges due to the above high requirements.
In the past few decades, some measurement methods have been proposed for using in this application. Generally, bullet holes on the wooden (or steel) target plate can be directly measured by high-resolution digital camera [1]. Through image recognition [2], its measurement accuracy can be even up to the pixel level. Unfortunately, some overlapping bullet holes are probably neglected. In addition, the larger the target plate is, the higher the wind drag is. Consequently, this needs more and stronger structural supports. They are usually disposable so this causes a great deal of waste of wood or steel. A photoelectric testing system with intersecting detection areas has several invisible target plates (also called light curtain) [3]. In essence, it forms an effective detection area using some components (i.e., LED array or infrared diode array, light-curtain sensors, photoelectric signal processing module, etc.). Thus, there is no consumption of wood or steel at all. Especially, it cannot only measure the hitting coordinate of the projectile but also its flying velocity, attitude angle, etc.; in addition, this method has almost no limit of the projectile velocity. Unfortunately, its detection area is hard to expand beyond 5 m × 5 m. Besides, a measurement system based on triangular light-curtain sensor combined with intersecting-charge coupled device vertical targets has measurement precision of millimeter-level [4], and yet there is also a similar problem, that is, its detection area is below 5 m × 5 m. Moreover, a measurement system based on laser forms a line laser screen with inverted triangular shape [5]. If a projectile passes through the laser screen, several laser detection sensors can detect its echo signal [6]. On the basis of the temporal and spatial domain detection model [7], the hitting coordinates of the projectile can be obtained. In the system, the laser power is uniformly spread on the line laser screen. To ensure the detection performance for a higher flying projectile, a higher power laser should be used. As a result, this brings about higher cost, increased weight, difficulty in maintenance, etc. According to acoustic characteristic of the shock wave [8], an acoustic sensor-based measurement system and its improved system can also measure the hitting coordinates of supersonic projectile. After a supersonic projectile perpendicularly passes through the detection area, several acoustic sensors can detect the sound pressure from the measured projectile [9]. Due to the difference in arrival time of their acoustic waves, the coordinates of the measured projectile can be calculated by a calculation model [10]. However, it needs more acoustic sensors if the detection area is larger,10 m × 10 m. Unfortunately, this probably brings about a series of problems, such as complex structure, high cost, inconvenience to maintain, and poor reliability. In previous study, we developed a measurement system with the larger light curtain of 10 m × 10 m through multi-lens splicing [11, 12]. However, this system can only measure the flying velocity of the supersonic projectile using two parallel light curtains. In this study, we want to further improve the previous measurement systems and focus mainly on how to effectively measure the hitting coordinates of the supersonic projectile. Moreover, it should also have major advantages of large detection area, high accuracy, and high reliability. Considering the advantages of the other methods, it will be a better choice that the proposed method based on light-curtain can be combined with different methods.
Therefore, we propose an improved measurement method based on light-curtain sensor considering the shock wave effect to obtain the hitting coordinates of a supersonic projectile. First, we describe briefly forming mechanisms of the shock wave caused by the supersonic projectile. Furthermore, we analyze some changing trends of the shock speed affected by several factors (i.e., flight speed of the projectile, shape of the projectile head, and the temperature in the testing environment). Next we mainly use a light-curtain detector and L-shaped LED array to form a rectangle light curtain, which has three sub-detection areas. Besides, we bring forward an effective approach for acquiring the actual shock speed in the light curtain using a calibration device with three parallel lasers. Then, we investigate three calculation models of the hitting coordinates in three different sub-detection areas, respectively. Finally, the feasibility and effectiveness of the proposed method can be verified through live ammunition experiments.
2 Analysis of shock speed in the light curtain
2.1 Formation principle of the shock wave caused by supersonic projectile
Before the study, it is important to note that the mentioned projectiles in the study are all without tail wing, and their head shape can be approximated to a cone. After a supersonic projectile passes through the light curtain, the light-curtain sensor outputs two signals, as shown in Figure 1. Through high-speed photography [13], we can obtain the time when the projectile arrives on the light curtain. Accordingly, the left signal should be generated by the projectile. Through many observations in the measurement, it is found that the time interval between the two signals is proportional to the distance between the sensor and the penetration position in the light curtain.
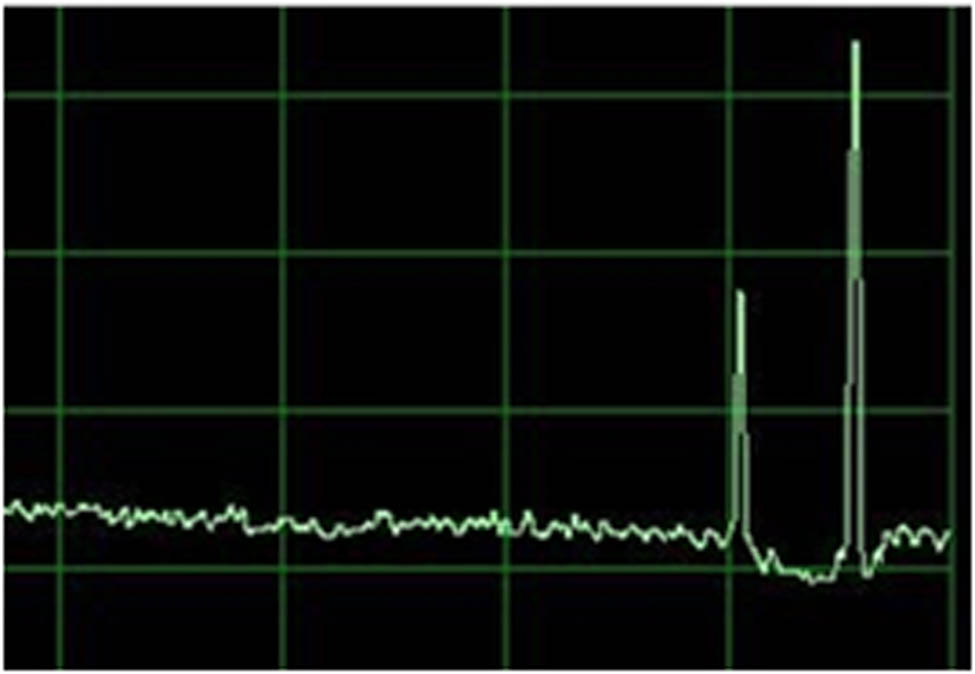
Two output signals on an oscilloscope after a supersonic projectile passes through the light curtain.
After analysis, it is found that the other signal is caused by an acoustics phenomenon called shock wave effect. When a projectile flies with supersonic speed and cone shape head, the air in its front can be compressed and split to form a high-density air layer with cone-like shape (Figure 2). The above physical processes, and the forming principle of the shock wave is described in brief in ref. [8]. Similar to acoustic wave, the shock wave is also a disturbance wave in nature. However, its speed properties are different from that of the acoustic wave. For the supersonic projectile, it leads to an oblique shock wave because its shock front is not perpendicular to the airflow direction; herein the high-density air layer is also called shock front, and the airflow direction is inverse to that of the flight projectile. Therefore, there is an angle between the shock front and the airflow direction defined as the Mach angle which is usually expressed by ref. [8]
with
where α is the Mach angle, v is the flying speed of the supersonic projectile, c is the acoustic speed in the testing environment, Ma is the Mach number, c 0 is the acoustic speed when the temperature is 0°C, t L is the Celsius temperature in the light curtain, and T o is the thermodynamic temperature corresponding to the Celsius temperature of 0°C. In this study, we suppose that c 0 and T o are 331.45 m s−1 and 273.15 K, respectively.
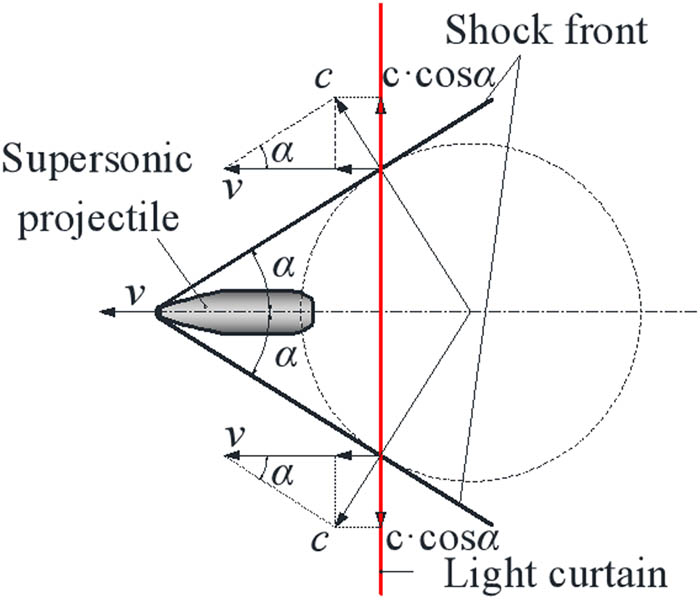
Analytical diagram of the speed property of the shock wave if the projectile flight speed is lower than the critical value.
During the flight of the supersonic projectile, a series of disturbance waves constantly appear on the rear of the supersonic projectile, and they diffuse outwards in the form of the spherical wave. In Figure 2, only a circle is drawn for convenience. Obviously, the shock speed can be decomposed into two different vectors. One of them is orthogonal to the shock front, and the shock speed at the direction is always equal to the acoustic speed in the testing environment. Obviously, this can enlighten us on the idea of how to solve the current problem.
2.2 Changing trends of shock speed in the light curtain determined by key factors
2.2.1 Models of shock speed in the light curtain
Before analysis, we made a series of assumptions as following. The air is stationary and it has the constant heat ratio; especially, the airflow viscosity and thermal conductivity can be neglected. Besides, the measured projectile without tail wing is approximated to a combination of cone and cylinder, and its surface is also smooth. Ideally, the supersonic projectile perpendicularly passes the light curtain.
Therefore, a part of the shock wave in the light curtain spreads out at the center of the projectile’s penetration position. In fact, it is not the acoustic speed but a projection of that on the light curtain, and it is given by
where c L is the shock speed in the light curtain.
According to equation (1), the Mach angle decreases with the increment in the projectile speed. In other words, the conical degree of the high-density air layer also decreases with the increment in the projectile speed.
After the projectile speed increases to a critical value, the Mach angle cannot decrease even if the flight speed increases further. This is because the shock front is limited by the projectile head shape, as shown in Figure 3. Under this condition, the shock wave relatively remains stable. The critical value of the projectile speed is given by
where μ is the half-conical angle of the projectile head.
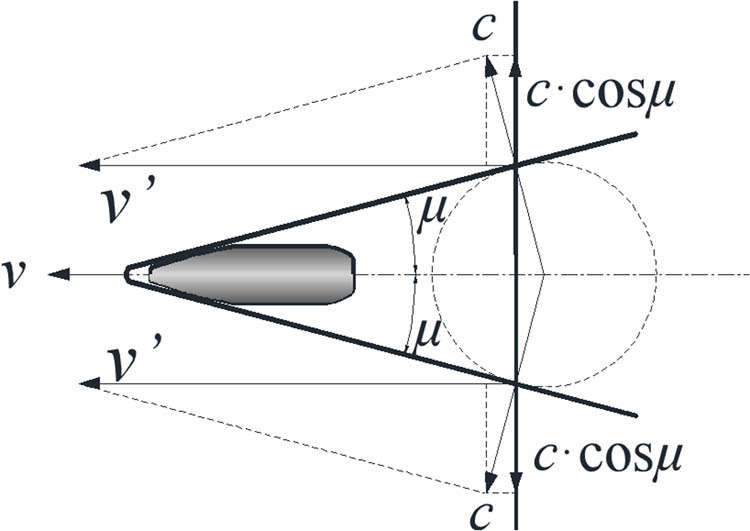
Analytical diagram of the speed property of the shock wave if the projectile flight speed is higher than the critical value.
Moreover, the shock speed in the light curtain is also given by
For a certain projectile, this shock speed in the light curtain is mainly affected by some key factors, which are the flight speed, head shape of the projectile, and the temperature in the light curtain.
2.2.2 Effects of several key factors
Suppose that the half-conical angle of the projectile head is a certain value (i.e., 15°), then we consider the effects of only two factors, which are the projectile speed and the temperature in the testing environment. Variable range of the former is from 150 to 2,150 m s−1, and that of the latter is from −40 to 60°C. Based on equations (1)–(5), we can observe the changing trends of the shock speed in the light curtain dominated by the above two factors, as shown in Figure 4.
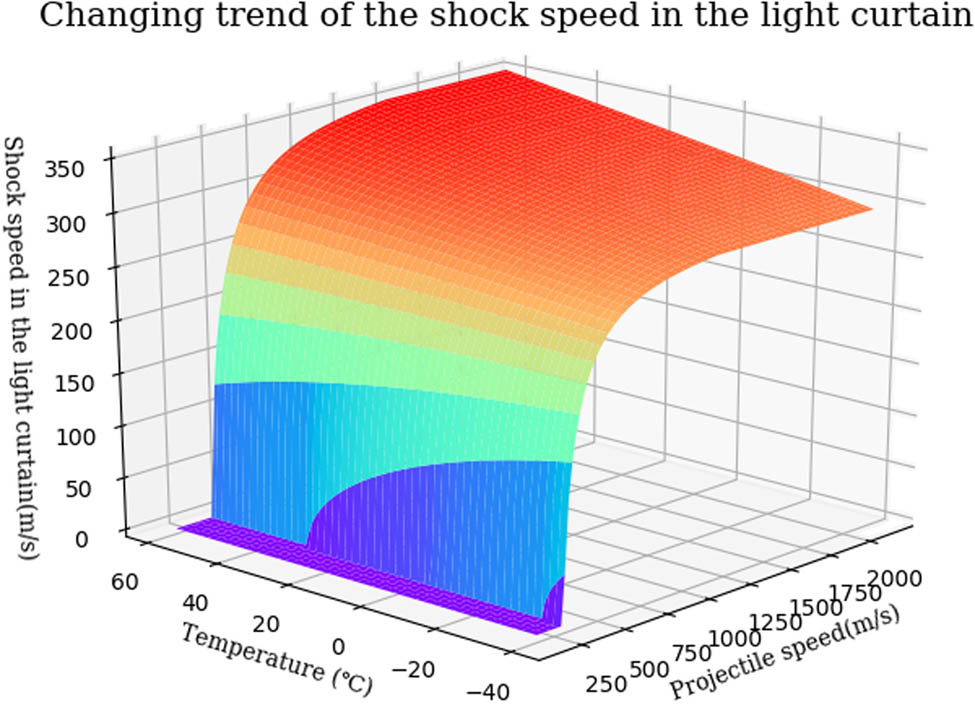
Changing trend of the shock speed in the light curtain affected by the projectile speed and the temperature in the testing environment.
On the one hand, the shock speed in the light curtain increases with the increment in the temperature in the testing environment, and this obeys the physical laws between the acoustic speed and the temperature. On the other hand, the shock speed dramatically increases with the increment of the projectile speed, and yet it begins to slowly increase if the Mach angle is gradually coming close to the conical angle of the projectile head. Finally, it remains basically unchanged. In addition, Figure 4 shows that there is no shock speed in the light curtain if the projectile speed is below the acoustic speed.
In the next analysis, we assume that the temperature in the testing environment is 25°C. In addition, the conical angle and speed of the measured projectile are variable from 0° to 180° and from 150 to 2,150 m s−1, respectively. We analyze the effects of the projectile speed and its head shape. Based on equations (1)–(5), we find the changing trends of the shock speed in the light curtain dominated by these two factors as shown in Figure 5. For the projectile speed, the changing trend of the shock speed in the light curtain is also in accordance with the previous analysis. However, we find that the shock speed in the light curtain increases with the decrease in the conical angle of the projectile head. If the conical angle is 180°, the projectile will become a plane. This leads to the normal shock wave so that the component of the shock wave cannot propagate in the light curtain. If the conical angle of the projectile head is close to 0°, it is approximately deemed to be a straight line. In this case, the shock speed in the light curtain is nearly the acoustic speed.
In the measurement of shooting accuracy, the projectile is desired to perpendicularly pass through the target plate, and this also means that its predicted ballistic trajectory should be perpendicular to the light curtain. Unfortunately, there are generally some deviations between the predicted and actual ballistic trajectory due to some interference factors. To simplify the analysis, we suppose that there is only the pitch angle of the projectile but without the azimuth angle in the following analysis.
Through related geometric transformations, we can obtain two shock speeds with two different directions in the light curtain (Figure 6), and their expressions can be given by
and
where c u and c d are the two shock speeds in the light curtain, c is the acoustic speed in the testing environment, α is the Mach angle, μ is the half-conical angle of the projectile head, and θ is the pitch angle of the projectile.
Changing trend of the shock speed in the light curtain affected by the projectile speed and its head shape.
Analytical diagram of the speed property of the shock wave if the ballistic trajectory is not perpendicular to the light curtain.
Again, we make a series of assumptions as follows. For the measured projectile, its half-conical angle is 15° and the temperature in the testing environment is 25°C. Specially, the range of its pitch angle is from −5° to 5° and that of the projectile speed is from 150 to 2,150 m s−1.
According to equations (4) and (7), we can obtain the maximum relative error of the shock speed caused by the pitch angle, and its expression is given by
where c L is the shock speed in the light curtain if the projectile is without the attitude angle, that is, its trajectory is perpendicular to the light curtain.
In Figure 7, it is shown that the greater the pitch angle is, the larger the maximum relative error of the shock speed is. Only if the pitch angle is zero, the error of the shock speed in the light curtain will vanish. Besides, we also find that the higher speed of the projectile can contribute to decrease in the error of the shock speed in the light curtain.
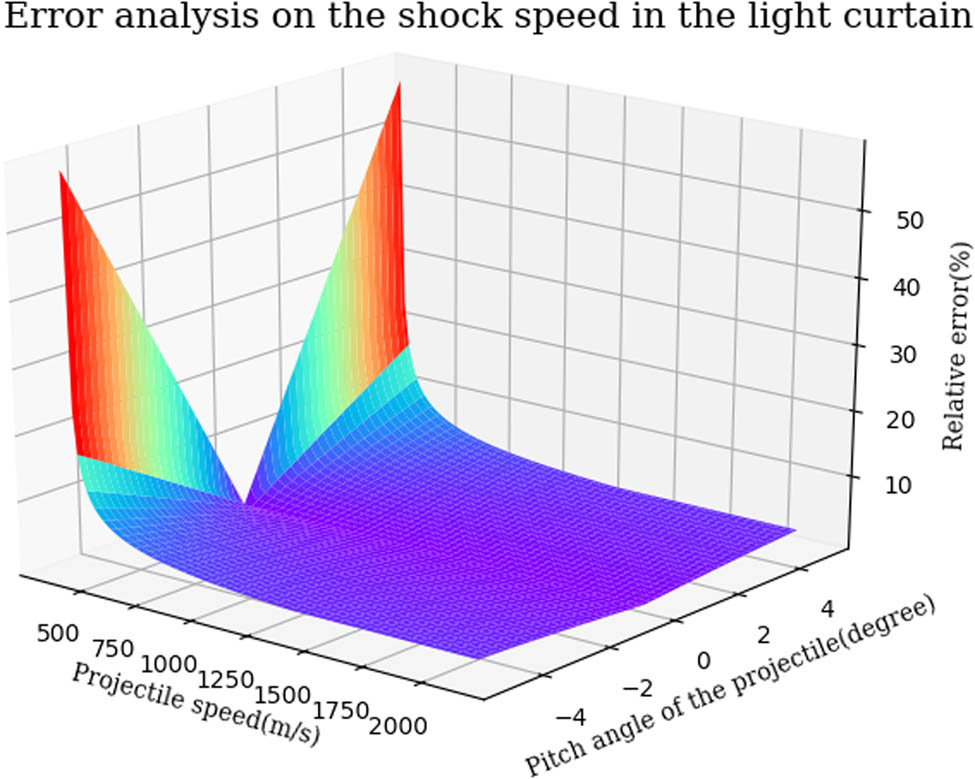
Changing trend of the relative error of the shock speed in the light curtain affected by the projectile speed and the attitude angle of the projectile.
Furthermore, we also want to take into consideration the effect of temperature. Assuming that the range of its pitch angle is from −5° to 5°, and the half-conical angle of the projectile head is 15°, but the projectile speed is constant at 1,750 m s−1, the range of the temperature in the testing environment is from −40 to 60°C. Figure 8 shows that the error of the shock speed in the light curtain is in proportion to the pitch angle. Similarly, pitch angle of 0° is corresponding to non-existence of the error. In addition, the temperature cannot have any influence on the error of the shock speed in the light curtain. In fact, the measured projectile has not only the attitude angle but also the azimuth angle. In the light curtain, inconsistency of the shock speed in different directions will become more serious under this condition. Ideally, the cone of the shock front is circular in the crossing section on the light curtain if the ballistic trajectory of the measured projectile is perpendicular to the light curtain. The shock in the light curtain spreads out at the center of a circle, and the shock speed in each direction is uniform. In fact, it is not impossible that the ballistic trajectory is not absolutely perpendicular to the light curtain. As a result, this leads the cone of the shock front to become elliptical in crossing section on the light curtain. In the light curtain, the shock speed in each direction is not obviously uniform. According to the above analysis, the difference among the shock speed in different directions is bound up with an inclination of the ballistic trajectory. Currently, all advanced barrel weapons have direct aiming device so that the jump angle of their barrel is generally very small and below 1′.
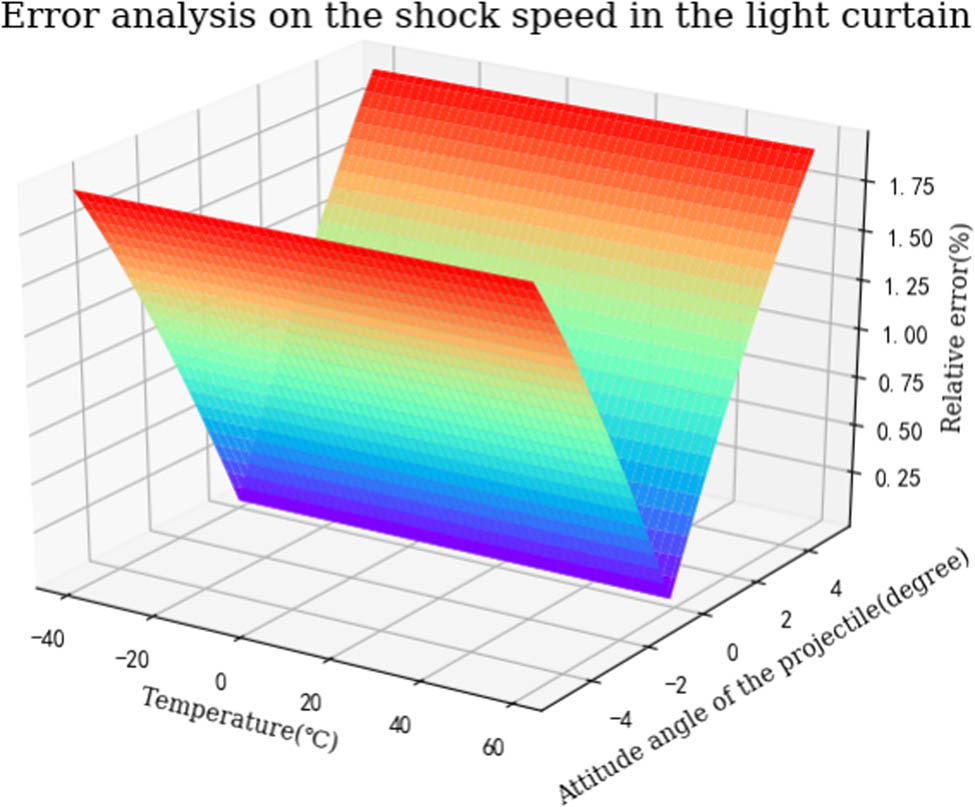
Changing trend of the relative error of the shock speed in the light curtain affected by the attitude angle of the projectile and temperature in the testing environment.
This means that their ballistic trajectory can be deemed to be a straight line in the effective shooting range. To improve the aerodynamics performance, the shape of their projectile head is designed to be very sharp, that is, the half-conical angle is not very large. Crucially, they have higher flight speed beyond five times that of sound. Obviously, these excellent characteristics can effectively reduce the inconsistency of the shock speed in the light curtain caused by the attitude angle of the projectile.
In theory, if the shock speed in the light curtain can be accurately calculated, we use several sensors to correspondingly obtain several time-of-arrival (TOA) parameters of the projectile’s shock wave. Further, location information of this projectile should also be obtained according to structural relation between these sensors. As mentioned above, the shock speed is affected by many factors. Unfortunately, some factors, especially the projectile speed and temperature, are usually variable, random, and unpredictable. This also brings about time-varying shock speed in the light curtain. Consequently, the shock speed in the light curtain cannot be accurately calculated through the formulas proposed in this section. Their function is only to help us to better discover some main changing trend of shock speed in the light curtain. Even in the light curtain with 10 m × 10 m, the spread time of the shock wave also has only dozens of milliseconds. In the very short time, the shock speed is considered to be constant. Therefore, we should develop a calibration device to effectively obtain the real-time shock speed in the light curtain.
3 Measurement method
The proposed measurement system (Figure 9) is chiefly composed of main measurement device, calibration device of the shock speed, data acquisition module, signal and data processing module, display and control module, and so on. In the system, there are two key components, and they are the main measurement device and the calibration device of the shock speed.
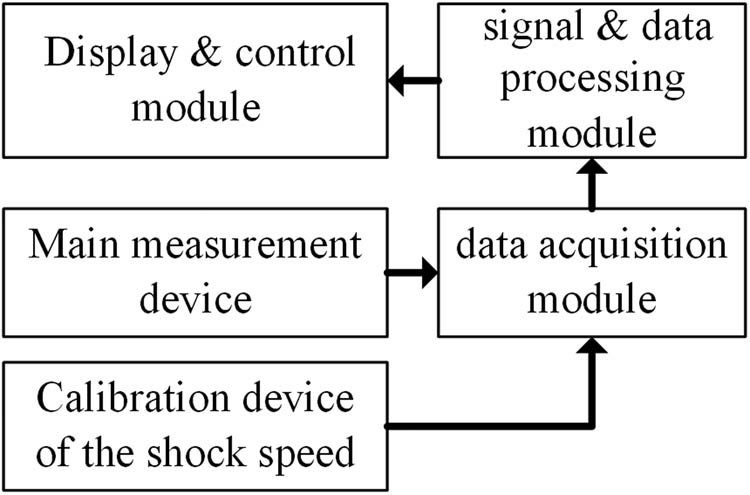
Block schematic of the measurement system.
3.1 Main measurement device
The main measurement device mainly consists of a light curtain sensor and two LED arrays, as shown in Figure 10. Specially, the light curtain sensor has three similar lenses which can form a fan-shaped detection area with the viewing angle of 30° and less thickness (usually, less than 1 mm). Thus, they can be structured to a detection area with the viewing angle of 90° by adopting multi-lens splicing technology [11]. Most importantly, three detection areas must be co-planar through adjustments. In fact, this detection area is separated into three parts (i.e., three sub-detection areas), which are detection areas I, II, and III. Besides, we must use optical filters to avoid interference of light with certain wavelengths.
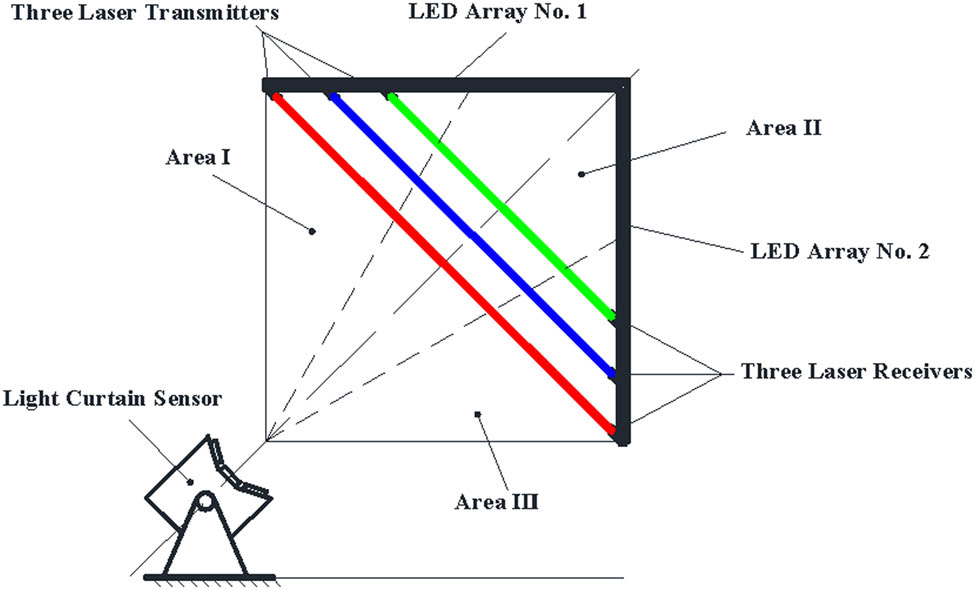
Schematic diagram of the main measurement device.
In fact, the light curtain sensor is a passive photoelectric detection system. Thus, we must provide some artificial light sources (i.e., LED array) for it, and this can form a bright background with reasonable light distribution. Consequently, the light in the detection area can be received by the three lenses of the light curtain sensor. When a flying target passes through the light curtain, the light received by the lens decreases steeply. When a flying projectile with supersonic speed passes through a sub-detection area in the light curtain, three measurement channels in the data acquisition module correspondingly generate several signals, which are a pulse signal of the flying projectile and three pulse signals of the shock wave. The time interval values among these signals are accurately obtained through related estimation methods [14,15,16], and thus we can measure the distance from the penetration position to the lens and the two minimum those from this penetration position to other two sub-detection areas, respectively. However, this must meet some requirements as follows. First, key structural parameters of the three sub-detection areas and other components are all known and calibrated in advance. This problem has been solved in our previous work [17]. Besides, real-time shock speed in the light curtain should also be known. Obviously, this problem is crucial to our study. In Section 3.2, a calibration device is developed to effectively obtain the shock speed in the light curtain.
3.2 Calibration device for the shock speed
In Figure 10, there are three pairs of laser transmitters and receivers, and their function is to calibrate the shock speed in the light curtain. To highlight the three pairs of laser transmitters and receivers, they are plotted in Figure 11. Through installations and adjustments, these three transmitters can emit three parallel laser beams; correspondingly, those three receivers must accurately receive them. Especially, these parallel laser beams should be in the light curtain, and the distance between any two adjacent laser beams must also be equal. Most importantly, their wavelength should be different so that each receiver cannot be jammed by other lasers. In fact, optical filters in the main measurement device are to prevent these three lasers from interfering its detection effect. Moreover, these lasers also have high enough power and continuous emission.
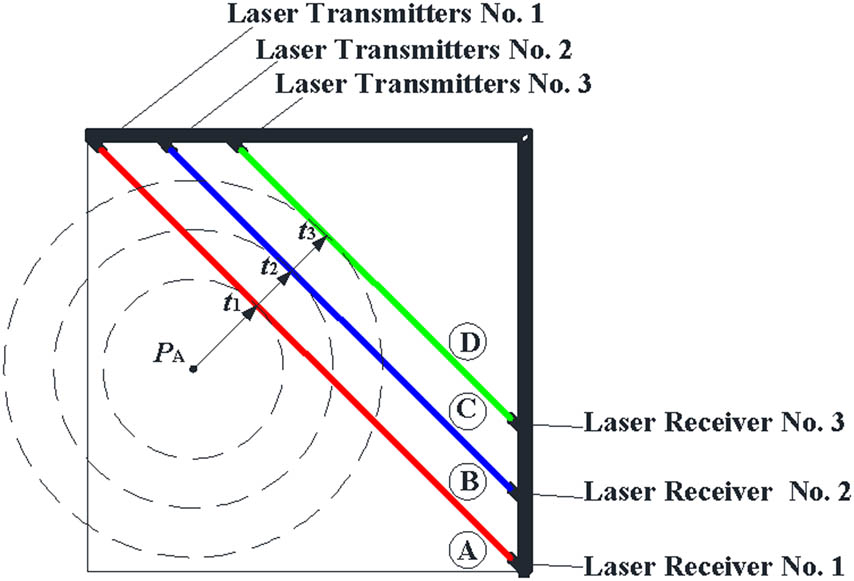
Schematic diagram of the calibration for the shock speed in the light curtain if the penetration position of the supersonic projectile is at the area A.
In theory, transmission characteristic of the laser is also affected by the shock wave from a supersonic projectile in the light curtain. Subsequently, every receiver can detect the change in its corresponding laser. Like the light curtain sensor, the change in the laser beams can also be translated into signals through related processing. Next we use wavelet transform modulus maximum method [18,19] to extract time when the shock wave arrives at the three laser beams. Due to the known distance between these parallel laser beams, we can calculate the shock speed in the light curtain.
We can observe that these three laser beams divide the light curtain into four areas (i.e., areas A, B, C, and D). Assuming that the distance between any two adjacent laser beams is S and t P is the time when the measured projectile passes through the light curtain, and in addition, t 1, t 2, and t 3 are the time when the shock wave arrives at the three laser beams, then we can obtain three expressions given by
and
For better accuracy, final calculation expression is given by
Likewise, the shock speed can also be calculated using equation (12) if the penetration position is in the area D.
Next if the penetration position is in the area B or C, an integrated calculation expression of the shock speed is given by:
with
and
In engineering, there are some small probability events, that is, the penetration position is just in a laser beam. In fact, this has little influence on the above calibrations. Because the shock speed in the light curtain is known after calibrations, we can effectively obtain the hitting coordinates of the measured projectile through some calculation models, and they will be discussed below in more detail in Section 3.3.
3.3 Calculation models
We establish a rectangular coordinate system, and its original point is O, which is the common focus of the three lenses (Figure 12). Ideally, the field angles of α I, α II, and α III are all 30°. The boundary between the areas I and II is O–M, and that of the areas II and III is O–N.
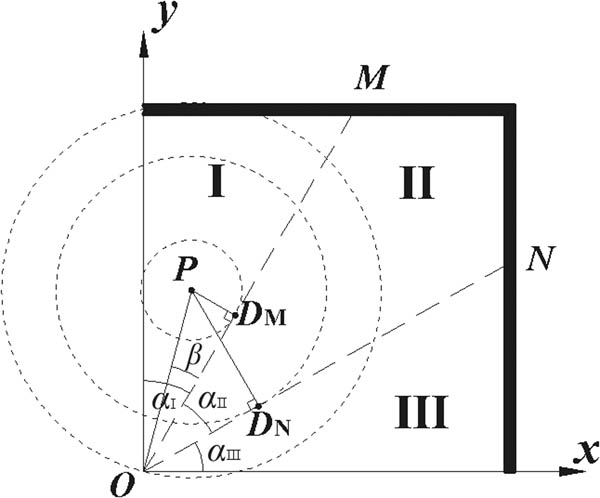
Schematic diagram of the calculation model under the condition that the penetration position is in the area I.
As seen in Figure 12, a supersonic projectile passes through the area I in the light curtain, and its penetration position is called P. First, the shock front arrives at a point, which is defined as DM, in the boundary between the areas I and II. Next the shock front arrives at another point, which is defined as DN, in the boundary between the areas II and III. Finally, the shock front arrives at the point of O. Through, wavelet transform modulus maximum method [18,19], we can obtain three TOA parameters (i.e., t P, t M, and t N) corresponding to the three points of P, DM, and DN.
In a right triangle of ΔPODM, an angle of ∠PODM is defined as β, and the distance between P and DM is defined as PDM, which can be obtained by
where PO is the distance between P and O and c is the shock speed in the light curtain.
Through observation, an angle of ∠PODN should be
In a right triangle of ΔPODN, PDN is the distance between P and D N and can be obtained by
Substituting equation (17) in equation (18) can produce
According to equations (16) and (19), we can give a proportional relation between them, and it is expressed by
Next cot β in equation (20) can be directly solved, and its expression is
Through transformation of the inverse trigonometric function, we can thus obtain the angle of β, which is given by
Finally, we can obtain the calculation model of the P penetration position based on 2–dimensional (2D) coordinates and they are
and
Likewise, for the other two cases, we can also give their calculation models.
If the penetration position is in the area II, its calculation formula can be expressed by
with
and
If the penetration position is in the area III, its calculation formula can be expressed by
with
and
Due to randomness of the penetration position, it may be on the boundary between any two areas, and then the shock front arrives on the other boundary. Under the condition, its calculation model will become simpler because of considering only one right triangle in area II. Accordingly, their calculation models can be given as follows.
and
if the penetration position is on the boundary of O–M.
Besides,
and
if the penetration position is on the boundary of O–N.
According to some time sequence differences among output signals of the data acquisition module, an appropriate calculation model can thus be determined to obtain the hitting coordinates of the measured flying projectile. In engineering, the calibration of the shock speed in the light curtain and calculation of the hitting coordinates should be immediately performed in the signal and data processing module. Finally, the calculation results are presented on the display and control module. Therefore, the proposed measurement system has the characteristic of higher real-time, reliability and accuracy.
4 Experiments and discussion
To test the validity of the improved measurement system based on light-curtain sensor, three measurement systems, including a wooden target and a measurement system based on acoustic sensor arrays and the proposed system, are established in an indoor shooting gallery with the cross-section of 10 m × 10 m. According to related technical standards [20], live ammunition experiments cannot be permitted under the terrible weather conditions. Thanks to the indoor shooting gallery, it can maintain a relatively stable environmental conditions, such as temperature (i.e., 20 ± 2°C), humidity (i.e., 65 ± 5%), and atmosphere.
Figure 13 shows a sectional view of the experimental setup in the indoor shooting gallery. It can be observed that a wooden target is installed on the vertical wall at the end of the indoor shooting gallery. Especially, the wooden target, the detection area of the acoustic sensor arrays, and the light curtain should be in parallel, and their interval distances are all 1 m. Besides, a launch device based on electromagnetism is aimed at the center of the wooden target, and its presupposition ballistic trajectory, which is at a height of 5 m from the ground, must also be perpendicular to the wooden target. The distance from the gunpoint to the wooden target is approximately 500 m, and this distance is also within the effective firing range. Ideally, the flying trajectory of the projectile can thus be considered to be a straight line. Through digital image processing, we can measure the coordinate values of bullet holes on the wooden target, and the measurement error is not beyond 1 mm.
Sectional view of the experiment setup in the indoor shooting gallery.
Assuming that the measurement results from the wooden target is the reference value or truth-value, we can also obtain two other sets of measurement results, which are from the improved system based on light-curtain sensor and acoustic sensor arrays. Generally, the measurement error of the acoustic system is less than 5 mm. For the launch device, the flying speed of its projectile is supersonic in its effective shooting range (generally, beyond 2,000 m). In addition, the projectile is fired through electronic control, and thus this can avoid some effects from hand operation. Therefore, for experimental results, we mainly take two factors into consideration, and they are the projectile speed and the projectile head shape.
4.1 Different speeds of the flying projectiles
In the first set of experiments, we use some projectiles with the same caliber and head shape (i.e., the conical angle of 40 degrees). Through accurately adjusting current, 4 different speeds of the projectiles can be obtained, and they are respectively 1.5, 2, 3, and 5 times as large as that of sound in the indoor shooting gallery at the temperature of 20 ± 2°C. Under every condition of the projectile speed, we fire 100 projectiles and then record their coordinate values by adopting the three measurement systems (i.e., wooden target based on image processing, sound microphone array, and the improved system based on light-curtain sensor), as shown in Figure 14.
Schematic diagram of the first set of measurement results of bullet holes through the three system: (a) the wooden target based on image processing, (b) the sound microphone array, and (c) the proposed system.
We can observe that the dispersion radius of bullet holes cannot be larger than 5 m. Accordingly, the maximum jump angle of the weapon under test can be calculated, and it is 0.49°. According to the changing trend of the relative error of the shock speed in Section 2, the maximum relative error of the shock speed is only 0.15% if the attitude angle is 0.49°. Thus, this influencing factor can also be negligible.
Compared with the reference value, a set of measurement error data of the sound microphone array and the improved system based on light-curtain sensor can be obtained if the projectile speed is five times the speed of sound, as shown in Figure 14. Note that the dotted lines represent mean value, or they can also be seen as systematic error. Generally, the systematic error is mainly caused by structural assembly and electrical characters. However, the systematic error can be effectively compensated using some method [21]. Therefore, we adopt the standard deviation between measured data and ideal data to evaluate the measurement performance. In Tables 1–4, key performance judgments (i.e., mean value, standard deviation, and maximum deviation) of the two systems are listed and compared under different conditions of projectile speed, that is, 5, 3, 2, and 1.5 times the speed of sound.
Key performance judgments of the two measurement systems under the condition of projectile speed 5 times that of sound
| Type | Coordinates | Mean value (mm) | Standard deviation (mm) | Maximum deviation (mm) |
|---|---|---|---|---|
| Sound microphone array | x | 0.6411 | 0.6411 | 2.5132 |
| y | −0.8339 | 0.3839 | 1.9999 | |
| Light-curtain sensor | x | 0.5803 | 0.6001 | 1.9299 |
| y | −0.2268 | 0.8644 | 2.5005 |
Key performance judgments of the two measurement systems under the condition of projectile speed 3 times that of sound
| Type | Coordinates | Mean value (mm) | Standard deviation (mm) | Maximum deviation (mm) |
|---|---|---|---|---|
| Sound microphone array | x | 0.8524 | 1.0596 | 2.8754 |
| y | 0.8450 | 1.4522 | 4.275 | |
| Light-curtain sensor | x | 0.9065 | 1.1555 | 3.8530 |
| y | 1.0861 | 1.4021 | 4.4657 |
Key performance judgments of the two measurement systems under the condition of projectile speed 2 times that of sound
| Type | Coordinates | Mean value (mm) | Standard deviation (mm) | Maximum deviation (mm) |
|---|---|---|---|---|
| Sound microphone array | x | 0.8040 | 3.3118 | 8.8581 |
| y | 0.9587 | 2.9563 | 8.4903 | |
| Light-curtain sensor | x | 0.2044 | 3.4425 | 7.9602 |
| y | 1.1454 | 2.8533 | 9.0676 |
Key performance judgments of the two measurement systems under the condition of projectile speed 1.5 times that of sound
| Type | Coordinates | Mean value (mm) | Standard deviation (mm) | Maximum deviation (mm) |
|---|---|---|---|---|
| Sound microphone array | x | 1.3832 | 3.9723 | 12.8651 |
| y | 2.6196 | 5.1043 | 16.4207 | |
| Light-curtain sensor | x | 1.9007 | 4.6260 | 12.2584 |
| y | 1.1884 | 3.0373 | 8.9684 |
From the above tables, we can conclude that with the increase in projectile speed, both the systems have better measurement results. Specifically speaking, their standard deviations also became smaller. However, we find that their measurement performance is no longer significantly improved even if the speed of the projectile is higher. On the contrary, when the projectile speed is slightly higher than that of sound, the measurement error is larger. Especially, when the projectile speed is very close to the sound speed, both these systems lost many measurement results. Obviously, these results are basically in line with the law that is analyzed and discussed in Section 2. Therefore, the two systems are better applied in the measurement of the hitting coordinates of some hypersonic targets.
4.2 Different shapes of the projectile head
In the second set of experiments, we used projectiles with the same caliber, but with different head shapes (i.e., the conical angle). Their conical angles are 45°, 90°, and 120°. In addition, we properly adjusted the current of the launch device in such a way that the flying speed of the measured projectile can be up to three times that of sound in the effective shooting range. Moreover, the indoor temperature of the shooting gallery was still at 20 ± 2°C. Similar to the first experiment, under the condition of every head shape, we fired 100 projectiles and then recorded their coordinate values.
In Tables 2, 5, and 6, the main performance judgments (i.e., mean value, standard deviation, and maximum deviation) of the two systems under conditions of the conical angles of 45°, 90°, and 120°, are given, respectively. From the above tables, the measurement performance (especially, their standard deviations) of the two systems basically holds steady under the conditions of three conical angles. Obviously, the conical angle of the projectile head does not almost affect the measurement performance of the two systems. Therefore, the improved measurement system has wide adaptability of projectiles with different conical angle.
Key performance judgments of the two measurement systems under the condition of the conical angle of 90°
| Type | Coordinates | Mean value/(mm) | Standard deviation/(mm) | Maximum deviation/(mm) |
|---|---|---|---|---|
| Sound microphone array | X | 0.2507 | 1.1530 | 2.8498 |
| Y | 0.4190 | 1.3890 | 3.9010 | |
| Light-curtain sensor | X | 0.9768 | 1.2369 | 3.9066 |
| Y | 1.1991 | 1.5210 | 3.8213 |
Key performance judgments of the two measurement systems under the condition of the conical angle of 120°
| Type | Coordinates | Mean value/(mm) | Standard deviation/(mm) | Maximum deviation/(mm) |
|---|---|---|---|---|
| Sound microphone array | X | 0.5589 | 1.2421 | 3.5856 |
| Y | 0.7612 | 1.5991 | 4.8640 | |
| Light-curtain sensor | X | 0.8340 | 1.2846 | 3.6198 |
| Y | 1.1541 | 1.6235 | 6.0077 |
In fact, the two measurement systems are both based on the similar principle. That is, they use acoustics sensor array or light-curtain sensor to measure several TOA parameters, and then the hitting coordinates of the supersonic projectile in their detection area can be obtained according to their computation model. However, the acoustics system has dozens of acoustic sensors in order to form a large detection area of 10 m × 10 m. Furthermore, there is also the higher requirement for installation accuracy of the acoustic sensors. For the proposed measurement system, we only adopt a light-curtain sensor and three pairs of laser transmitters and receivers. The large detection area (i.e., light curtain) with 10 m × 10 m can be formed; most importantly, its measurement accuracy is also close to that of the acoustics system and it can also up to mm-level.
5 Conclusion
In this study, we investigated an improved measurement method based on light-curtain sensor to effectively obtain the hitting coordinates of supersonic projectile in a large detection area. For this study, it contains the following contributions as below. First, the speed properties of the shock wave in the light curtain based on several key factors (i.e., flight speed of the projectile, its attitude, shape, and the temperature in the testing environment) are obtained after detailed analysis. Second, we developed a design scheme of the improved measurement system. Specially, the main measurement device and the calibration device of the shock speed are two key parts of the system. In fact, the former is wide-angled light-curtain sensor to effectively detect the measured projectile and its shock wave, and the latter can measure real-time speed of the shock wave in the light curtain using three parallel laser beams. Third, according to related geometric principles, some calculation models are, respectively, built to obtain the hitting coordinates of the measured projectile in the light curtain. Finally, we perform the live ammunition experiments under the conditions of two main factors, and they demonstrate that the measurement error of the improved system is always less than 5 mm, and its measurement performance is closer to that of the system based on acoustic sensor arrays. Besides the larger detection area, the improved measurement system also has many merits, including fewer sensors, lower cost, simpler and easier installation, and so on. In future research, we will focus on several problems, including the measurement of flight attitude of the supersonic projectile and multi-target detection. If the above problems are all solved, the measurement performance of the system will be further improved.
-
Funding information: The authors would like to acknowledge the Natural Science Foundation of Shaanxi Province of China (Grant No. 2019JM-601) and in part by the Scientific Research Programming Project of Shaanxi Provincial Education Department (Grant No. 20JK0692) and the Foundation of Xi’an Key Laboratory of Intelligence (No. 2019220514SYS020CG042).
-
Author contributions: All authors have accepted responsibility for the entire content of this manuscript and approved its submission.
-
Conflict of interest: The authors state no conflict of interest.
References
[1] Decker R, Duca M, Spickert FS. Measurement of bullet impact conditions using automated in-flight photography system. Def Technol. 2017;13(4):288–94. 10.1016/j.dt.2017.04.004.Search in Google Scholar
[2] Lin YC, Miaou SG, Lin YC, Chen SL. An automatic scoring system for air pistol shooting competition based on image recognition of target sheets. ICCE-TW 2015. Proceedings of 2015 IEEE International Conference on Consumer Electronics - Taiwan; 2015 June 6–8. Taipei, China. New York: IEEE; 2015. p. 140–1.10.1109/ICCE-TW.2015.7216821Search in Google Scholar
[3] Tian H, Jiao MX, Ni JP. Measurement model and algorithm for measuring flight parameter of parabolic trajectory by six-light-screen array. Optik. 2015;126(24):5877–80. 10.1016/j.ijleo.2015.08.264.Search in Google Scholar
[4] Li H, Ni JP, Yang XD, Wu ZC. Analysis of the structure and properties of triangular composite light-screen targets. Open Phys. 2021;19(1):583–9. 10.1016/j.ijleo.2015.08.264.Search in Google Scholar
[5] Li HS, Zhang XQ, Zhang XW, Guo QM. A line laser detection screen design and projectile echo power calculation in detection screen area. Def Technol. 2021;17(6):1135–42, 10.1016/j.dt.2021.06.007.Search in Google Scholar
[6] Zhang XQ, Li HS, Zhang SS. Design and analysis of laser photoelectric detection sensor. Microw Opt Technol Lett. 2021;63(12):3092–9. 10.1002/mop.33011.Search in Google Scholar
[7] Zhang XQ, Li HS, Gao JC. Temporal and spatial domain detection model and method of infrared photoelectric detection target. Appl Opt. 2021;60(24):7437–45. 10.1364/AO.427671.Search in Google Scholar PubMed
[8] Yang MJ, Li ZF, Zhu YJ, Zhang EL, Wang J, Shi XF, et al. Shock Waves and Shock Interactions in Hypersonic Flow. Beijing: Nation Defense Industry Press; 2019.Search in Google Scholar
[9] Kam WL. Curvilinear trajectory estimation of a supersonic bullet using ballistic shock wave arrivals at asynchronous acoustic sensor nodes. J Acoust Soc Am. 2017;141(6):4543–55. 10.1121/1.4985442.Search in Google Scholar PubMed
[10] Zhang XW, Li HS. Calculation model of projectile explosion position by using acousto-optic combination mechanism. IEEE Access. 2021;9:126058–64. 10.1109/ACCESS.2021.3109918.Search in Google Scholar
[11] Tian H, Yuan Y, Chen D. Improvement of the detection sensitivity uniformity of an indoor light screen array measurement system with large field of view angle using multi-lens splicing. Optik. 2018;181:971–7. 10.1016/j.ijleo.2018.12.150.Search in Google Scholar
[12] Tian H, Yuan Y. Analysis and amendment on the sensitivity of large target area light screen. Infrared Laser Eng. 2018;47(6):108–13. 10.3788/IRLA201847.0617004.Search in Google Scholar
[13] Buckner D, Esperance DL. Digital synchro ballistic schlieren camera for high-speed photography of bullets and rocket sleds. Opt Eng. 2013;52(8):083105-1-8. 10.1117/1.OE.52.8.083105.Search in Google Scholar
[14] Ni JP, Tian H. A study on method of acquiring moment of which a projectile going through a light screen. Opt Tech. 2008;32(1):141–4.Search in Google Scholar
[15] Dong H, Ni JP, Wang TL. Research of the information detect acquire method which the projectile flying the target based on sky screen target. Nucl Electron Detect Technol. 2008;29(4):844–8. 10.1007/978-0-387-74660-9_12.Search in Google Scholar
[16] Tian H, Ni JP, Jiao MX. Moment acquisition algorithm of a projectile passing through a trapezoidal screen. Acta Photonica Sin. 2014;43(12):114–8. 10.3788/gzxb20144312.1212001.Search in Google Scholar
[17] Chen D, Ni JP. Calibration and equalization for the measurement channels of a photoelectric testing system with intersecting detection areas. IEEE Access. 2021;9:17520–9. 10.1109/ACCESS.2021.3054389.Search in Google Scholar
[18] Li HS, Lei ZY, Wang ZM, Gao JC. Research on objection information extraction arithmetic in photo-electric detection target based on wavelet analysis method. Prz Elektrotechniczn. 2012;88(9):157–61.Search in Google Scholar
[19] Li HS, Lei ZY. Time calculation method based on wavelet analysis in vertical target measurement system. Infrared Laser Eng. 2011;40(9):1774–8. 10.3969/j.issn.1007-2276.2011.09.036.Search in Google Scholar
[20] Zhang YP, Ma YJ. Test Methods of Cartridge–Part 18: Firing Accuracy and Dispersion Test, China Military Standard GJB 3196.18A-2005. Beijing: China Standard Press; 2006.Search in Google Scholar
[21] Chen R, Chen D, Ji BW, Ni JP. Inversion method of the key structure parameters of light screen array measurement system using genetic algorithm. Optik. 2020;206:164064. 10.1016/j.ijleo.2019.164064.Search in Google Scholar
© 2022 Ding Chen et al., published by De Gruyter
This work is licensed under the Creative Commons Attribution 4.0 International License.
Articles in the same Issue
- Regular Articles
- Test influence of screen thickness on double-N six-light-screen sky screen target
- Analysis on the speed properties of the shock wave in light curtain
- Abundant accurate analytical and semi-analytical solutions of the positive Gardner–Kadomtsev–Petviashvili equation
- Measured distribution of cloud chamber tracks from radioactive decay: A new empirical approach to investigating the quantum measurement problem
- Nuclear radiation detection based on the convolutional neural network under public surveillance scenarios
- Effect of process parameters on density and mechanical behaviour of a selective laser melted 17-4PH stainless steel alloy
- Performance evaluation of self-mixing interferometer with the ceramic type piezoelectric accelerometers
- Effect of geometry error on the non-Newtonian flow in the ceramic microchannel molded by SLA
- Numerical investigation of ozone decomposition by self-excited oscillation cavitation jet
- Modeling electrostatic potential in FDSOI MOSFETS: An approach based on homotopy perturbations
- Modeling analysis of microenvironment of 3D cell mechanics based on machine vision
- Numerical solution for two-dimensional partial differential equations using SM’s method
- Multiple velocity composition in the standard synchronization
- Electroosmotic flow for Eyring fluid with Navier slip boundary condition under high zeta potential in a parallel microchannel
- Soliton solutions of Calogero–Degasperis–Fokas dynamical equation via modified mathematical methods
- Performance evaluation of a high-performance offshore cementing wastes accelerating agent
- Sapphire irradiation by phosphorus as an approach to improve its optical properties
- A physical model for calculating cementing quality based on the XGboost algorithm
- Experimental investigation and numerical analysis of stress concentration distribution at the typical slots for stiffeners
- An analytical model for solute transport from blood to tissue
- Finite-size effects in one-dimensional Bose–Einstein condensation of photons
- Drying kinetics of Pleurotus eryngii slices during hot air drying
- Computer-aided measurement technology for Cu2ZnSnS4 thin-film solar cell characteristics
- QCD phase diagram in a finite volume in the PNJL model
- Study on abundant analytical solutions of the new coupled Konno–Oono equation in the magnetic field
- Experimental analysis of a laser beam propagating in angular turbulence
- Numerical investigation of heat transfer in the nanofluids under the impact of length and radius of carbon nanotubes
- Multiple rogue wave solutions of a generalized (3+1)-dimensional variable-coefficient Kadomtsev--Petviashvili equation
- Optical properties and thermal stability of the H+-implanted Dy3+/Tm3+-codoped GeS2–Ga2S3–PbI2 chalcohalide glass waveguide
- Nonlinear dynamics for different nonautonomous wave structure solutions
- Numerical analysis of bioconvection-MHD flow of Williamson nanofluid with gyrotactic microbes and thermal radiation: New iterative method
- Modeling extreme value data with an upside down bathtub-shaped failure rate model
- Abundant optical soliton structures to the Fokas system arising in monomode optical fibers
- Analysis of the partially ionized kerosene oil-based ternary nanofluid flow over a convectively heated rotating surface
- Multiple-scale analysis of the parametric-driven sine-Gordon equation with phase shifts
- Magnetofluid unsteady electroosmotic flow of Jeffrey fluid at high zeta potential in parallel microchannels
- Effect of plasma-activated water on microbial quality and physicochemical properties of fresh beef
- The finite element modeling of the impacting process of hard particles on pump components
- Analysis of respiratory mechanics models with different kernels
- Extended warranty decision model of failure dependence wind turbine system based on cost-effectiveness analysis
- Breather wave and double-periodic soliton solutions for a (2+1)-dimensional generalized Hirota–Satsuma–Ito equation
- First-principle calculation of electronic structure and optical properties of (P, Ga, P–Ga) doped graphene
- Numerical simulation of nanofluid flow between two parallel disks using 3-stage Lobatto III-A formula
- Optimization method for detection a flying bullet
- Angle error control model of laser profilometer contact measurement
- Numerical study on flue gas–liquid flow with side-entering mixing
- Travelling waves solutions of the KP equation in weakly dispersive media
- Characterization of damage morphology of structural SiO2 film induced by nanosecond pulsed laser
- A study of generalized hypergeometric Matrix functions via two-parameter Mittag–Leffler matrix function
- Study of the length and influencing factors of air plasma ignition time
- Analysis of parametric effects in the wave profile of the variant Boussinesq equation through two analytical approaches
- The nonlinear vibration and dispersive wave systems with extended homoclinic breather wave solutions
- Generalized notion of integral inequalities of variables
- The seasonal variation in the polarization (Ex/Ey) of the characteristic wave in ionosphere plasma
- Impact of COVID 19 on the demand for an inventory model under preservation technology and advance payment facility
- Approximate solution of linear integral equations by Taylor ordering method: Applied mathematical approach
- Exploring the new optical solitons to the time-fractional integrable generalized (2+1)-dimensional nonlinear Schrödinger system via three different methods
- Irreversibility analysis in time-dependent Darcy–Forchheimer flow of viscous fluid with diffusion-thermo and thermo-diffusion effects
- Double diffusion in a combined cavity occupied by a nanofluid and heterogeneous porous media
- NTIM solution of the fractional order parabolic partial differential equations
- Jointly Rayleigh lifetime products in the presence of competing risks model
- Abundant exact solutions of higher-order dispersion variable coefficient KdV equation
- Laser cutting tobacco slice experiment: Effects of cutting power and cutting speed
- Performance evaluation of common-aperture visible and long-wave infrared imaging system based on a comprehensive resolution
- Diesel engine small-sample transfer learning fault diagnosis algorithm based on STFT time–frequency image and hyperparameter autonomous optimization deep convolutional network improved by PSO–GWO–BPNN surrogate model
- Analyses of electrokinetic energy conversion for periodic electromagnetohydrodynamic (EMHD) nanofluid through the rectangular microchannel under the Hall effects
- Propagation properties of cosh-Airy beams in an inhomogeneous medium with Gaussian PT-symmetric potentials
- Dynamics investigation on a Kadomtsev–Petviashvili equation with variable coefficients
- Study on fine characterization and reconstruction modeling of porous media based on spatially-resolved nuclear magnetic resonance technology
- Optimal block replacement policy for two-dimensional products considering imperfect maintenance with improved Salp swarm algorithm
- A hybrid forecasting model based on the group method of data handling and wavelet decomposition for monthly rivers streamflow data sets
- Hybrid pencil beam model based on photon characteristic line algorithm for lung radiotherapy in small fields
- Surface waves on a coated incompressible elastic half-space
- Radiation dose measurement on bone scintigraphy and planning clinical management
- Lie symmetry analysis for generalized short pulse equation
- Spectroscopic characteristics and dissociation of nitrogen trifluoride under external electric fields: Theoretical study
- Cross electromagnetic nanofluid flow examination with infinite shear rate viscosity and melting heat through Skan-Falkner wedge
- Convection heat–mass transfer of generalized Maxwell fluid with radiation effect, exponential heating, and chemical reaction using fractional Caputo–Fabrizio derivatives
- Weak nonlinear analysis of nanofluid convection with g-jitter using the Ginzburg--Landau model
- Strip waveguides in Yb3+-doped silicate glass formed by combination of He+ ion implantation and precise ultrashort pulse laser ablation
- Best selected forecasting models for COVID-19 pandemic
- Research on attenuation motion test at oblique incidence based on double-N six-light-screen system
- Review Articles
- Progress in epitaxial growth of stanene
- Review and validation of photovoltaic solar simulation tools/software based on case study
- Brief Report
- The Debye–Scherrer technique – rapid detection for applications
- Rapid Communication
- Radial oscillations of an electron in a Coulomb attracting field
- Special Issue on Novel Numerical and Analytical Techniques for Fractional Nonlinear Schrodinger Type - Part II
- The exact solutions of the stochastic fractional-space Allen–Cahn equation
- Propagation of some new traveling wave patterns of the double dispersive equation
- A new modified technique to study the dynamics of fractional hyperbolic-telegraph equations
- An orthotropic thermo-viscoelastic infinite medium with a cylindrical cavity of temperature dependent properties via MGT thermoelasticity
- Modeling of hepatitis B epidemic model with fractional operator
- Special Issue on Transport phenomena and thermal analysis in micro/nano-scale structure surfaces - Part III
- Investigation of effective thermal conductivity of SiC foam ceramics with various pore densities
- Nonlocal magneto-thermoelastic infinite half-space due to a periodically varying heat flow under Caputo–Fabrizio fractional derivative heat equation
- The flow and heat transfer characteristics of DPF porous media with different structures based on LBM
- Homotopy analysis method with application to thin-film flow of couple stress fluid through a vertical cylinder
- Special Issue on Advanced Topics on the Modelling and Assessment of Complicated Physical Phenomena - Part II
- Asymptotic analysis of hepatitis B epidemic model using Caputo Fabrizio fractional operator
- Influence of chemical reaction on MHD Newtonian fluid flow on vertical plate in porous medium in conjunction with thermal radiation
- Structure of analytical ion-acoustic solitary wave solutions for the dynamical system of nonlinear wave propagation
- Evaluation of ESBL resistance dynamics in Escherichia coli isolates by mathematical modeling
- On theoretical analysis of nonlinear fractional order partial Benney equations under nonsingular kernel
- The solutions of nonlinear fractional partial differential equations by using a novel technique
- Modelling and graphing the Wi-Fi wave field using the shape function
- Generalized invexity and duality in multiobjective variational problems involving non-singular fractional derivative
- Impact of the convergent geometric profile on boundary layer separation in the supersonic over-expanded nozzle
- Variable stepsize construction of a two-step optimized hybrid block method with relative stability
- Thermal transport with nanoparticles of fractional Oldroyd-B fluid under the effects of magnetic field, radiations, and viscous dissipation: Entropy generation; via finite difference method
- Special Issue on Advanced Energy Materials - Part I
- Voltage regulation and power-saving method of asynchronous motor based on fuzzy control theory
- The structure design of mobile charging piles
- Analysis and modeling of pitaya slices in a heat pump drying system
- Design of pulse laser high-precision ranging algorithm under low signal-to-noise ratio
- Special Issue on Geological Modeling and Geospatial Data Analysis
- Determination of luminescent characteristics of organometallic complex in land and coal mining
- InSAR terrain mapping error sources based on satellite interferometry