Computer-aided measurement technology for Cu2ZnSnS4 thin-film solar cell characteristics
-
Qian Li
 ,
Yu Hao
,
Yu Hao

Abstract
Currently, there are more perfect theoretical basis and operation methods for the research of the Cu2ZnSnS4 (CZTS) solar cell characteristics, but the experimental process is tedious. In this article, to measure the characteristics of the CZTS solar cells more accurately and quickly, the computer-aided measurement method was used. During testing the characteristics of solar cells, the results were collected and analyzed by using LabCoder and Origin software. By designing experiments and using software to record data and complete solar cell characterization tests in one step, the number of artificial changes in resistance during testing is reduced. In the experiments, the data can be obtained in real time by using experimental results of computer-aided measurement technology, which can significantly improve the experimental efficiency. Through computer real-time monitoring, the maximum output power of as-prepared solar cells is P m = 1.62 W, and the calculated filling factor remains at 86%. It means that computer-aided measurement technology is suitable for the experiment of CZTS solar cell characteristics.
1 Introduction
In the twenty-first century, solar energy is considered as one of the most perfected new energy for developing a resource-efficient society [1,2,3,4]. Solar cells come into being and have emerged as a key part of the new solar energy sector. Among solar cells, thin-film solar cells have been the focus of many researchers due to their high-photovoltaic conversion efficiency and low cost. The most important parameter of thin-film solar cells is the photovoltaic conversion efficiency, which is affected by the properties of the coating material [5,6,7].
In recent years, the majority of thin-film solar cells use semiconductor material as a surface coating [8]. Nevertheless, semiconductor materials are expensive and will endanger the health of production personnel [9,10,11]. On contrary, Cu2ZnSnS4 (CZTS) possesses the advantage of being low cost and nonpolluting, as well as an excellent bandgap (1.4–1.5 eV) and absorption coefficient (104 cm−2) [12]. It is obtained by replacing iron with tin and zinc based on CuFeS2 [13,14,15].
So far, different methods are used to analyze and research the characteristic of CZTS solar cells. The most common method is to illuminate the photovoltaic device with a Xenon lamp and collect data of solar cells through the electronic load [16,17,18]. Li et al. prepared a CZTS thin-film solar cell, which was based on oxygen-containing precursors. It was tested using a solar simulator (NEWPORT) as the light source and a KEITHLEY 2400 digital source meter [19]. Similarly, Long et al. formed CZTS films by the sol–gel method following sulfurization. The characteristics of the CZTS thin-film solar cell were recorded by a KEITHLEY 2400 source meter under an illumination intensity of 100 mW cm−2 [20]. By using MP-3005D as the power source, Panahi-Kalamuei et al. [21] tested the efficiency of synthesized solar cell devices and changed the irradiation power to achieve a filling factor of 65%.
However, in the research of CZTS solar cell characteristics, the processing of experimental data is time-consuming. During the experiment, the output power associated with the resistance cannot be adjusted in time, and the data from the electronic load need to be calculated and analyzed by manual work [22,23,24]. To research the characteristics of solar cells more accurately and speed up the experimental process, computer-aided measurement technology is introduced into the experimental process.
In this article, based on the photovoltaic effect, the experiments were designed to test the characteristics of CZTS solar cells. The experimental data were collected by LabCorder software and analyzed in real time by Origin. By connecting LabCorder software to the resistor and setting its logic for processing data, the experimental data can be obtained by simply adjusting the resistor during the experiment. It optimized the traditional experimental process of adjusting the resistance value and recording the data several times. The important variables, such as output current, output voltage, and fill factor value of CZTS solar cells, were obtained through the experiment by Origin. All results are processed by computer, thus reducing the human work and saving a lot of time. Finally, the characteristics of the solar cell were intuitively explored by analyzing the data obtained from the solar energy conversion test, and the difference between the actual power of the solar cell and the theoretical power was investigated.
2 Experiment of CZTS solar cell characteristics
2.1 Experimental principle of CZTS solar cell characteristics
The experimental principle of testing solar cell characteristics used in this study is based on the photovoltaic effect. It can be explained that the p–n structure of the semiconductor will change when the solar cell receives natural light, in which the electronic potential field is produced at both ends during the electrons transporting from the P-end to the N-end. After being irradiated by natural light, the electrons can be transported continuously, thus generating the potential energy of the electric power to output and storing this part of electric energy. In the experiment of CZTS solar cell characteristics, it is necessary to obtain the important parameters of output current, output voltage, the filling value FF of the solar cell, and so on [25].
Moreover, the electrons are transported from the P-end to the N-end when the solar cell is irradiated by natural light so that a current flowing from the N-end to the P-end is generated in the solar cell, which is labeled as I 1. At the same time, a forward current opposite to the photovoltaic current will be generated, in the process of the photovoltaic current generation, so this current is marked as I 2. Consequently, the photovoltaic output I is defined as the difference between the two kinds of current. The specific calculation equation of current I is as follows:
where I 0 is the reverse saturation current generated by natural light irradiation, and V D is the actual pn junction voltage. I 1 is the photovoltaic current, whose value is directly proportional to the intensity of light, and its photoelectric conversion efficiency is affected by the material characteristics and the actual structure of solar cells. n is called a characteristic coefficient, which is determined by the pn structure characteristics, and its value is the theoretical value, usually in 1–2 [26,27]. T is the standard thermodynamic temperature, Q is the electron charge generated by lighting, and k B is the Boltzmann constant.
Under special circumstances, if the series resistance of solar cells can be neglected, the V D can be expressed as the actual voltage V of the solar cell. Then, the actual equation is shown as follows:
In the case of the solar cell-forming loop, the cell will generate a short circuit, the voltage will turn to 0, and the output current is the actual current. According to Eq. (2), the short-circuit current I k can be expressed as follows:
Moreover, the current generated by the amount of photovoltaic is equal to that of the actual current in the case of a short circuit. And its value depends on light intensity and photoelectric conversion efficiency [28]. Therefore, calculating the current generated by photovoltaics is an ideal method to obtain the limit state current.
When the output end of the solar cell is opened and the circuit is cut off, no current is generated in the circuit, so the actual current I generated by the solar cell is 0 [29]. In this case, the obtained voltage is defined as open-circuit voltage V 0, which can be expressed as follows:
Generally, there is an extra load resistance R existed in the solar cell, whose value varies from 0 to infinity. It is indicated that the existence of load R will affect the output power of solar energy [30,31]. Ideally, the output power of the solar cell is deemed as the maximum power when the load R is at the optimal value, which is marked as P m. The equation is as follows:
The I m and V m in the equation are the output current and the output voltage in the limit state, respectively, whose product represents the optimal output power P m. The value obtained by dividing the product of voltage and cutoff current in an open circuit by the optimal output power P m is the fill factor, which is marked as FF. The related equation is as follows:
The fill factor FF is an important parameter for measuring the characteristics of solar cells, especially the conversion efficiency of solar cells. The larger the value of FF, the higher the corresponding output power, and vice versa. Therefore, the value of FF is the main basis for judging the characteristics of solar cells at present [32]. It is confirmed that the value of FF will be affected by various factors, such as light intensity, structure and conversion efficiency of coating material ideal coefficient, and resistance value [33,34]. In addition, it can be found from the equation that the short-circuit current I 0, open circuit voltage V k, optimal current I m, and optimum voltage V m are the other main factors that affect the value of the filling factor. Therefore, based on these values, an experiment on the characteristics of CZTS solar cell is designed, and the conclusion of solar energy characteristics research is drawn.
2.2 Experimental contents of CZTS solar cell characteristics
The solar cell characteristic instruments commonly used in experiments include an ammeter, voltmeter, and test load. More precise instruments should be used as far as possible in the experiment, and ordinary ammeters and voltmeters can be used instead of a digital multimeter. While the load is replaced by an adjustable precision resistor, the accuracy of the test results can be improved. Furthermore, the adjustable resistor can be precisely adjusted to the required resistance value for the test, while providing more accurate data in the experiment and eliminating the problems caused by load changes. The concrete schematic diagram is shown in Figure 1.

Theoretical experimental method for solar cell characteristics.
In the experiment of solar cell characteristic measurement, it is necessary to put the solar cell under natural light with a certain intensity and then record the corresponding current and voltage values when the load value changes from small to large or from large to small, to find the best load value, as well as the best current value and voltage value. However, due to the tedious operation process and the need for multiple adjustments to obtain the best value, this manual calculation method is quite time-consuming. On the contrary, by collecting data and using computers for statistical analysis, the calculation results can directly reflect the required data, greatly reducing the workload.
3 Computer-aided measurement technology is applied to the experiment of CZTS solar cell characteristics
Origin is a kind of computer data processing software that specializes in dealing with such measurement problems. In the experiment of CZTS solar cell characteristics by computer-aided measurement, data collection is carried out in conjunction with LabCorder software, by which the data can be collected and input into the computer in real time. After dynamic processing of data, it can accurately reflect the characteristics of the solar cell. LabCorder data acquisition system has multiple functions. It integrates an experimental data collector, calculator, and data analysis system and can process data after collecting data, and then output results, which is a professional instrument designed for this kind of experiment.
In the function of LabCorder, the input analog signal was in the range of −5 to 5 V, and the amplitude of the input signal can be adjusted and changed with a multilevel signal amplification utility, to ensure the accuracy of the signal conversion function.
In the process of the experiment, the fixed light intensity was used to simulate the natural light, and the halogen tungsten lamp holder was used. The power of the lamp was 300 W. Taking two fixed values as references, the output voltage of the solar cell was detected, and the resistance values were all 100 Ω. In the process of exploring the load current, a precision adjustable varistor was used as the regulating source. The fixed value resistor and the adjustable varistor were, respectively, connected to the one and two input channels in the LabCorder data collector. At the same time, to adjust the output current, the resistor with large resistance was accessed on the mainline, for limiting the too large current, preventing burning equipment. The large resistance resistor adopted the line resistance with a maximum of 420 Ω. But this was not enough to load current for fine adjustment, and it was necessary to add a resistor with small resistance, a line resistance whose maximum resistance was 56 Ω based on the large resistance resistor to fine tune the current. After this circuit was completed, testing of the CZTS solar cell can be started. The specific circuit is shown in Figure 2.
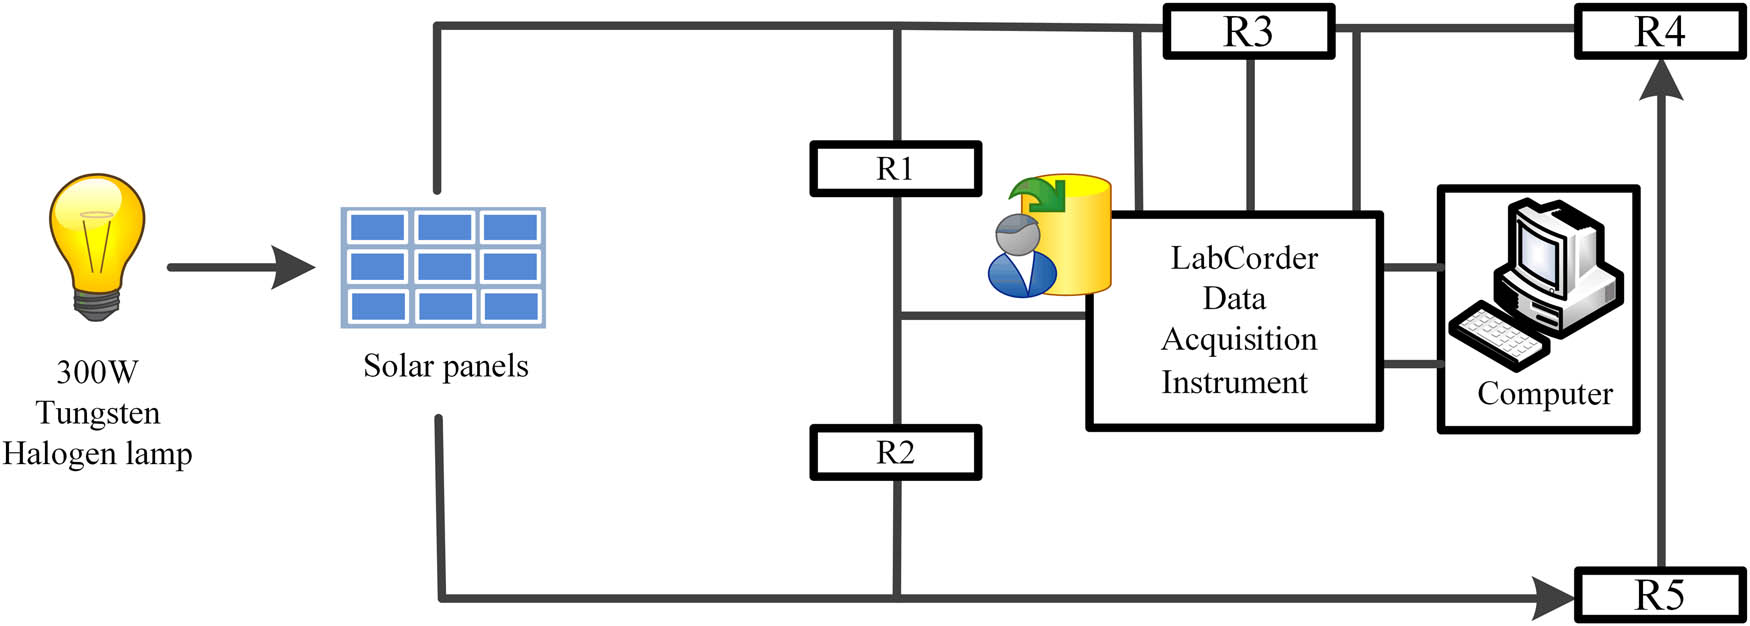
Data acquisition circuit of CZTS solar cell.
In Figure 2, R1 and R2 were the 100-Ω resistors with a fixed value, R3 was the adjustable precision resistance box, R4 was a line resistance with a maximum of 56 Ω, and R5 was the line resistance with a maximum of 420 Ω. After the circuit was closed, the lamp source was turned on, and the lamp source angle was adjusted so that the voltage value of the segment R2 was between 4.5 and 4.9 V. Before the adjustment of light source angle, resistance R4 and R5 were adjusted to 0 Ω, after the adjustment of light source angle, the adjustable precision resistance box was to adjust so that the voltage value of segment R3 was less than 5 V. Then, the magnification of the LabCorder data acquisition instrument was adjusted, and the output value was more obvious.
After LabCorder data collector was adjusted, the next step was to input LabCorder data to process logic. The overall change function was set in the relationship between y and x, where the y end interface took the segment R3 interface, and the x end interface took the segment R2 interface. After both ends of the set were complete, the device was switched on, and then, R4 and R5 were pulled from the minimum to the maximum at a steady speed. From the change of resistance value, the small-to-large change curve can be obtained. This process can simulate the dynamic voltage changes of solar cells under fixed light intensity and obtain the change curve at the output end of the LabCorder interface.
The data from the x and y end interface collected by LabCorder can be input into Origin data processing software after simple logic processing, and the exact data changes can be obtained from the data. After the fine processing, the data can be transformed into the current value and voltage value generated by the CZTS solar cell, so that the curve can be accurately drawn and the change in the characteristics of the solar cell can be found. After actual calculation, the specific data changes are shown in Figure 3.

P–R influence table for CZTS solar cell.
Based on Figure 3, the power changes under specific conditions can be seen more intuitively. First, when the line is in a short circuit state, the load voltage is 0 and the generated short circuit I k = 0.19 A at this time. At the same time, when the line is cut off, the load current is 0, and the open-circuit voltage is V 0 = 9.92 V. According to the data shown in the table, the trend of overall power under dynamic load discovery is obtained, and then, the optimal power point of CZTS solar cell characteristic curve is found. In the trend curve of the chart, it can identify the highest powerpoint. When at the highest point, the load resistance is 51.3 Ω, then the output power of the solar cell is P m = 1.62 W. According to the numerical point of P m, the corresponding current and voltage conditions can be found, and the following conclusions can be drawn: I m = 0.19 A, U m = 8.532 V. Finally, according to Eq (6), the value of filling factor FF = 0.860 is obtained.
4 Result analysis
After monitoring the characteristics of the CZTS solar cell, the FF value of the solar cell is 0.860, which indicates that the photoelectric conversion efficiency of the solar cell is excellent. In the course of the experiment to explore the solar cell characteristics, the computer is used as a tool to assist measurement, making the process more scientific and standardized, and the data are more accurate, which can withstand scrutiny theory [35]. Through the use of computer data acquisition and data processing systems, data acquisition work will be carried out more smoothly. It can collect more data, and the accuracy of the data can be fully guaranteed. After connecting to the data processing system, the overall experimental process will be clearer. In this process, the data feedback is fast, and the real-time data are accelerated with the experimental progress, which accelerates the experimental process and greatly reduces the experimental steps. In the previous experiment, the instrument is adjusted according to the experimental principle [36]. The result is calculated according to the change of the previous experiment. Meanwhile, the process of the conclusion is simplified and the computer is responsible for all the results, thus reducing human work and saving a lot of time.
5 Conclusions
The computer-aided measurement technology was used in the investigation of the characteristics of CZTS solar cells, and the obtained data are analyzed by Origin software. The main parameters of the CZTS solar cell, such as the generated short circuit (I k = 0.19 A), open-circuit voltage (V 0 = 9.92 V), peak current (I m = 0.19 A), peak voltage (U m = 8.532 V), and peak power (P m = 1.62 W), were obtained quickly and accurately with the aid of computer technology. The analysis and research on the characteristics of CZTS solar cells by computer-aided measurement technology can make the experimental process more efficient and accurate. During the experiment, the FF value (FF = 0.860) of the CZTS solar cell needs to be obtained by calculation. The method of getting FF values can be more convenient and faster by editing the formula in Origin.
-
Funding information: This work was supported by the National Natural Science Foundation of China (No. 51504181 and No. 51674186), Shanxi Natural Science Foundation (No. 2020JQ-679), Shanxi Key Laboratory project (No. 20JS064), Key laboratory project of Xi’an (No. 2019219914SYS014CG036), and Innovation and entrepreneurship training program of Xi’an University of architecture and technology in 2021 (Modification mechanism of Cr3+ doped LiNi0.5Mn1.5O4 materials) and also supported by the 16th batch of undergraduate scientific research and training program of Xi’an University of architecture and technology in 2021: Modification mechanism of Cr3+-doped LiNi0.5Mn1.5O4 materials, Modification mechanism of Co3+-doped LiNi0.5Mn1.5O4 materials.
-
Author contributions: All authors have accepted responsibility for the entire content of this manuscript and approved its submission.
-
Conflict of interest: The authors state no conflict of interest.
-
Data availability statement: All data included in this study are available upon request by contact with the corresponding author.
References
[1] Devadiga D, Selvakumar M, Shetty P, Santosh MS. Recent progress in dye sensitized solar cell materials and photo-supercapacitors: A review. J Power Sources. 2021;493:493. 10.1016/j.jpowsour.2021.229698.Search in Google Scholar
[2] Al-Shahri OA, Ismail FB, Hannan MA, Lipu MSH, Al-Shetwi AQ, Begum RA, et al. Solar photovoltaic energy optimization methods, challenges and issues: A comprehensive review. J Clean Prod. 2021;284:125465–505. 10.1016/j.jclepro.2020.125465.Search in Google Scholar
[3] Ajayan J, Nirmal D, Mohankumar P, Saravanan M, Jagadesh M, Arivazhagan L. A review of photovoltaic performance of organic/inorganic solar cells for future renewable and sustainable energy technologies. Superlattices Microstruct. 2020;143:143. 10.1016/j.spmi.2020.106549.Search in Google Scholar
[4] Singh A, Baredar P. Techno-economic assessment of a solar PV, fuel cell, and biomass gasifier hybrid energy system. Energy Rep. 2016;2:254–60. 10.1016/j.egyr.2016.10.001.Search in Google Scholar
[5] Broderick LZ, Albert BR, Pearson BS, Kimerling LC, Michel J. Design for energy: Modeling of spectrum, temperature and device structure dependences of solar cell energy production. Sol Energy Mater Sol Cell. 2015;136:48–63. 10.1016/j.solmat.2014.12.034.Search in Google Scholar
[6] Cannavale A, Ierardi L, Hörantner M, Eperon GE, Snaith HJ, Ayr U, et al. Improving energy and visual performance in offices using building integrated perovskite-based solar cells: A case study in Southern Italy. Appl Energy. 2017;205:834–46. 10.1016/j.apenergy.2017.08.112.Search in Google Scholar
[7] Liu H, Aberle AG, Buonassisi T, Peters IM. On the methodology of energy yield assessment for one-Sun tandem solar cells. Sol Energy. 2016;135:598–604. 10.1016/j.solener.2016.06.028.Search in Google Scholar
[8] Cannavale A, Hörantner M, Eperon GE, Snaith HJ, Fiorito F, Ayr U, et al. Building integration of semitransparent perovskite-based solar cells: Energy performance and visual comfort assessment. Appl Energy. 2017;194:94–107. 10.1016/j.apenergy.2017.03.011.Search in Google Scholar
[9] Plass CT, Ritzer M, Schöppe P, Schönherr S, Zapf M, Hafermann M, et al. In-operando nanoscale x-ray analysis revealing the local electrical properties of rubidium-enriched grain boundaries in Cu(In,Ga)Se2 solar cells. ACS Appl Mater Interfaces. 2020;12(51):57117–23. 10.1021/acsami.0c17849.Search in Google Scholar PubMed
[10] Amiri O, Salavati-Niasari M, Sabet M, Ghanbari D. Synthesis and characterization of CuInS2 microsphere under controlled reaction conditions and its application in low-cost solar cells. Mat Sci Semicon Proc. 2013;16(6):1485–94. 10.1016/j.mssp.2013.04.026.Search in Google Scholar
[11] Mousavi-Kamazani M, Salavati-Niasari M, Hosseinpour-Mashkani S, Goudarzi M. Synthesis and characterization of CuInS2 quantum dot in the presence of novel precursors and its application in dyes solar cells. Mater Lett. 2015;145:99–103. 10.1016/j.matlet.2015.01.076.Search in Google Scholar
[12] Sun R, Zhuang D, Zhao M, Zhang N, Xie M, Wei Y, et al. Phases formation of Cu2ZnSnS4 thin films by sulfurizing stacked precursors by sputtering from Cu-Zn and Cu-Sn targets. Thin Solid Films. 2019;690:137561–70. 10.1016/j.tsf.2019.137561.Search in Google Scholar
[13] Zhu J, Maza WA, Morris AJ. Light-harvesting and energy transfer in ruthenium(II)-polypyridyl doped zirconium(IV) metal-organic frameworks: A look toward solar cell applications. J Photochem Photobiol A. 2017;344:64–77. 10.1016/j.jphotochem.2017.04.025.Search in Google Scholar
[14] Routray SR, Lenka TR. Performance analysis of nanodisk and core/shell/shell-nanowire type III-Nitride heterojunction solar cell for efficient energy harvesting. Superlattices Microstruct. 2017;111:776–82. 10.1016/j.spmi.2017.07.038.Search in Google Scholar
[15] Altowairqi Y, Alsubaie A, Stroh KP, Perez-Marin IG, Bowen L, Szablewski M, et al. The effect of annealing conditions: temperature, time, ramping rate and atmosphere on nanocrystal Cu2ZnSnS4 (CZTS) thin film solar cell properties. Mater Today: Proc. 2019;18:473–86. 10.1016/j.matpr.2019.06.234.Search in Google Scholar
[16] Mir N, Salavati-Niasari M. Photovoltaic properties of corresponding dye sensitized solar cells: Effect of active sites of growth controller on TiO2 nanostructures. Sol Energy. 2013;86(11):3397–404. 10.1016/j.solener.2012.08.016.Search in Google Scholar
[17] Mousavi-Kamazani M, Salavati-Niasari M, Sadeghinia M. Facile hydrothermal synthesis, formation mechanism and solar cell application of CuInS2 nanoparticles using novel starting reagents. Mater Lett. 2015;142:145–9. 10.1016/j.matlet.2014.12.014.Search in Google Scholar
[18] Amiri O, Salavati-Niasari M, Farangi M. Enhancement of dye-sensitized solar cells performance by core shell Ag@organic (organic = 2-nitroaniline, PVA, 4-choloroaniline and PVP): Effects of shell type on photocurrent. Electrochim Acta. 2015;153:90–6. 10.1016/j.electacta.2014.11.195.Search in Google Scholar
[19] Li X, Wang S, Liao H, Yang S, Li X, Wang T, et al. The preparation of Cu2ZnSnS4 thin film solar cell based on oxygen containing precursor. J Mater Sci Mater Electron. 2020;31(21):19309–17. 10.1007/s10854-020-04465-6.Search in Google Scholar
[20] Long B, Cheng S, Ye D, Yue C, Liao J. Mechanistic aspects of preheating effects of precursors on characteristics of Cu2ZnSnS4 (CZTS) thin films and solar cells. Mater Res Bull. 2019;115:182–90. 10.1016/j.materresbull.2019.03.027.Search in Google Scholar
[21] Panahi-Kalamuei M, Salavati-Niasari M, Hosseinpour-Mashkani S. Facile microwave synthesis, characterization, and solar cell application of selenium nanoparticles. J Alloy Compd. 2014;617:627–32. 10.1016/j.jallcom.2014.07.174.Search in Google Scholar
[22] Mir N, Salavati-Niasari M. Preparation of TiO2 nanoparticles by using tripodal tetraamine ligands as complexing agent via two-step sol–gel method and their application in dye-sensitized solar cells. 2013;48(4):1660–7. 10.1016/j.materresbull.2013.01.006.Search in Google Scholar
[23] Amiri A, Salavati-Niasari M, Farangi M, Mazaheri M, Bagheri S. Stable Plasmonic-Improved dye sensitized solar cells by silver nanoparticles between titanium dioxide layers. Electrochim Acta. 2015;152:101–7. 10.1016/j.electacta.2014.11.105.Search in Google Scholar
[24] Teymourinia H, Salavati-Niasari M, Amiri O, Farangi M. Facile synthesis of graphene quantum dots from corn powder and their application as down conversion effect in quantum dot-dye-sensitized solar cell. J Mol Liq. 2018;251:267–72. 10.1016/j.molliq.2017.12.059.Search in Google Scholar
[25] Dong P, Rodrigues M-TF, Zhang J, Borges RS, Kalaga K, Reddy ALM, et al. A flexible solar cell/supercapacitor integrated energy device. Nano Energy. 2017;42:181–6. 10.1016/j.nanoen.2017.10.035.Search in Google Scholar
[26] Andenæs E, Jelle BP, Ramlo K, Kolås T, Selj J, Foss SE. The influence of snow and ice coverage on the energy generation from photovoltaic solar cells. Sol Energy. 2018;159:318–28. 10.1016/j.solener.2017.10.078.Search in Google Scholar
[27] Jiao X, Chen R, Zhu X, Liao Q, Ye D, Zhang B, et al. A microfluidic all-vanadium photoelectrochemical cell for solar energy storage. Electrochim Acta. 2017;258:842–9. 10.1016/j.electacta.2017.11.134.Search in Google Scholar
[28] Huang TJ, Zhang L, Shi D, Qi G, Gong H. Dual use of Cu2ZnSnS4 in solar cells and energy storage devices. Sol Energy Mater Sol Cell. 2018;180:328–33. 10.1016/j.solmat.2017.07.003.Search in Google Scholar
[29] Duan J, Duan Y, Zhao Y, Wang Y, Tang Q, He B. Bifunctional polyaniline electrode tailored hybridized solar cells for energy harvesting from sun and rain. J Energy Chem. 2018;27(3):742–7. 10.1016/j.jechem.2017.10.017.Search in Google Scholar
[30] Khalate SA, Kate RS, Deokate RJ. A review on energy economics and the recent research and development in energy and the Cu2ZnSnS4 (CZTS) solar cells: A focus towards efficiency. Sol Energy. 2018;169:616–33. 10.1016/j.solener.2018.05.036.Search in Google Scholar
[31] Paul G, Chatterjee S, Pal AJ. Heterovalent doping and energy level tuning in Ag2S thin-films through solution approach: pn-Junction solar cells. Sol Energy Mater Sol Cell. 2018;182:339–47. 10.1016/j.solmat.2018.03.022.Search in Google Scholar
[32] Tang Q, Duan Y, He B, Chen H. Platinum alloy tailored all-weather solar cells for energy harvesting from sun and rain. Angew Chem Int Ed Engl. 2016;55(46):14412–6. 10.1002/anie.201608584.Search in Google Scholar
[33] Fan B, Zhong W, Jiang X-F, Yin Q, Ying L, Huang F, et al. Improved performance of ternary polymer solar cells based on a nonfullerene electron cascade acceptor. Adv Energy Mater. 2017;7(11):1602127.1–1602127.9. 10.1002/aenm.201602127.Search in Google Scholar
[34] Duan J, Hu T, Zhao Y, He B, Tang Q. Carbon-electrode-tailored all-inorganic perovskite solar cells to harvest solar and water-vapor energy. Angew Chem Int Ed Engl. 2018;57(20):5746–9. 10.1002/anie.201801837.Search in Google Scholar
[35] Cai J, Li P, Xu C, Huang W. Study on solar cell testing system and its parameter matching optimization. Guangxue Jingmi Gongcheng/Optics Precis Eng. 2007;15(4):517–21. 10.1016/S1001-6058(07)60030-4.Search in Google Scholar
[36] Smestad G, Bignozzi C, Argazzi R. Testing of dye sensitized TiO2 solar cells I: Experimental photocurrent output and conversion efficiencies. Sol Energy Mater Sol Cell. 1994;32(3):259–72. 10.1016/0927-0248(94)90263-1.Search in Google Scholar
© 2022 Qian Li et al., published by De Gruyter
This work is licensed under the Creative Commons Attribution 4.0 International License.
Articles in the same Issue
- Regular Articles
- Test influence of screen thickness on double-N six-light-screen sky screen target
- Analysis on the speed properties of the shock wave in light curtain
- Abundant accurate analytical and semi-analytical solutions of the positive Gardner–Kadomtsev–Petviashvili equation
- Measured distribution of cloud chamber tracks from radioactive decay: A new empirical approach to investigating the quantum measurement problem
- Nuclear radiation detection based on the convolutional neural network under public surveillance scenarios
- Effect of process parameters on density and mechanical behaviour of a selective laser melted 17-4PH stainless steel alloy
- Performance evaluation of self-mixing interferometer with the ceramic type piezoelectric accelerometers
- Effect of geometry error on the non-Newtonian flow in the ceramic microchannel molded by SLA
- Numerical investigation of ozone decomposition by self-excited oscillation cavitation jet
- Modeling electrostatic potential in FDSOI MOSFETS: An approach based on homotopy perturbations
- Modeling analysis of microenvironment of 3D cell mechanics based on machine vision
- Numerical solution for two-dimensional partial differential equations using SM’s method
- Multiple velocity composition in the standard synchronization
- Electroosmotic flow for Eyring fluid with Navier slip boundary condition under high zeta potential in a parallel microchannel
- Soliton solutions of Calogero–Degasperis–Fokas dynamical equation via modified mathematical methods
- Performance evaluation of a high-performance offshore cementing wastes accelerating agent
- Sapphire irradiation by phosphorus as an approach to improve its optical properties
- A physical model for calculating cementing quality based on the XGboost algorithm
- Experimental investigation and numerical analysis of stress concentration distribution at the typical slots for stiffeners
- An analytical model for solute transport from blood to tissue
- Finite-size effects in one-dimensional Bose–Einstein condensation of photons
- Drying kinetics of Pleurotus eryngii slices during hot air drying
- Computer-aided measurement technology for Cu2ZnSnS4 thin-film solar cell characteristics
- QCD phase diagram in a finite volume in the PNJL model
- Study on abundant analytical solutions of the new coupled Konno–Oono equation in the magnetic field
- Experimental analysis of a laser beam propagating in angular turbulence
- Numerical investigation of heat transfer in the nanofluids under the impact of length and radius of carbon nanotubes
- Multiple rogue wave solutions of a generalized (3+1)-dimensional variable-coefficient Kadomtsev--Petviashvili equation
- Optical properties and thermal stability of the H+-implanted Dy3+/Tm3+-codoped GeS2–Ga2S3–PbI2 chalcohalide glass waveguide
- Nonlinear dynamics for different nonautonomous wave structure solutions
- Numerical analysis of bioconvection-MHD flow of Williamson nanofluid with gyrotactic microbes and thermal radiation: New iterative method
- Modeling extreme value data with an upside down bathtub-shaped failure rate model
- Abundant optical soliton structures to the Fokas system arising in monomode optical fibers
- Analysis of the partially ionized kerosene oil-based ternary nanofluid flow over a convectively heated rotating surface
- Multiple-scale analysis of the parametric-driven sine-Gordon equation with phase shifts
- Magnetofluid unsteady electroosmotic flow of Jeffrey fluid at high zeta potential in parallel microchannels
- Effect of plasma-activated water on microbial quality and physicochemical properties of fresh beef
- The finite element modeling of the impacting process of hard particles on pump components
- Analysis of respiratory mechanics models with different kernels
- Extended warranty decision model of failure dependence wind turbine system based on cost-effectiveness analysis
- Breather wave and double-periodic soliton solutions for a (2+1)-dimensional generalized Hirota–Satsuma–Ito equation
- First-principle calculation of electronic structure and optical properties of (P, Ga, P–Ga) doped graphene
- Numerical simulation of nanofluid flow between two parallel disks using 3-stage Lobatto III-A formula
- Optimization method for detection a flying bullet
- Angle error control model of laser profilometer contact measurement
- Numerical study on flue gas–liquid flow with side-entering mixing
- Travelling waves solutions of the KP equation in weakly dispersive media
- Characterization of damage morphology of structural SiO2 film induced by nanosecond pulsed laser
- A study of generalized hypergeometric Matrix functions via two-parameter Mittag–Leffler matrix function
- Study of the length and influencing factors of air plasma ignition time
- Analysis of parametric effects in the wave profile of the variant Boussinesq equation through two analytical approaches
- The nonlinear vibration and dispersive wave systems with extended homoclinic breather wave solutions
- Generalized notion of integral inequalities of variables
- The seasonal variation in the polarization (Ex/Ey) of the characteristic wave in ionosphere plasma
- Impact of COVID 19 on the demand for an inventory model under preservation technology and advance payment facility
- Approximate solution of linear integral equations by Taylor ordering method: Applied mathematical approach
- Exploring the new optical solitons to the time-fractional integrable generalized (2+1)-dimensional nonlinear Schrödinger system via three different methods
- Irreversibility analysis in time-dependent Darcy–Forchheimer flow of viscous fluid with diffusion-thermo and thermo-diffusion effects
- Double diffusion in a combined cavity occupied by a nanofluid and heterogeneous porous media
- NTIM solution of the fractional order parabolic partial differential equations
- Jointly Rayleigh lifetime products in the presence of competing risks model
- Abundant exact solutions of higher-order dispersion variable coefficient KdV equation
- Laser cutting tobacco slice experiment: Effects of cutting power and cutting speed
- Performance evaluation of common-aperture visible and long-wave infrared imaging system based on a comprehensive resolution
- Diesel engine small-sample transfer learning fault diagnosis algorithm based on STFT time–frequency image and hyperparameter autonomous optimization deep convolutional network improved by PSO–GWO–BPNN surrogate model
- Analyses of electrokinetic energy conversion for periodic electromagnetohydrodynamic (EMHD) nanofluid through the rectangular microchannel under the Hall effects
- Propagation properties of cosh-Airy beams in an inhomogeneous medium with Gaussian PT-symmetric potentials
- Dynamics investigation on a Kadomtsev–Petviashvili equation with variable coefficients
- Study on fine characterization and reconstruction modeling of porous media based on spatially-resolved nuclear magnetic resonance technology
- Optimal block replacement policy for two-dimensional products considering imperfect maintenance with improved Salp swarm algorithm
- A hybrid forecasting model based on the group method of data handling and wavelet decomposition for monthly rivers streamflow data sets
- Hybrid pencil beam model based on photon characteristic line algorithm for lung radiotherapy in small fields
- Surface waves on a coated incompressible elastic half-space
- Radiation dose measurement on bone scintigraphy and planning clinical management
- Lie symmetry analysis for generalized short pulse equation
- Spectroscopic characteristics and dissociation of nitrogen trifluoride under external electric fields: Theoretical study
- Cross electromagnetic nanofluid flow examination with infinite shear rate viscosity and melting heat through Skan-Falkner wedge
- Convection heat–mass transfer of generalized Maxwell fluid with radiation effect, exponential heating, and chemical reaction using fractional Caputo–Fabrizio derivatives
- Weak nonlinear analysis of nanofluid convection with g-jitter using the Ginzburg--Landau model
- Strip waveguides in Yb3+-doped silicate glass formed by combination of He+ ion implantation and precise ultrashort pulse laser ablation
- Best selected forecasting models for COVID-19 pandemic
- Research on attenuation motion test at oblique incidence based on double-N six-light-screen system
- Review Articles
- Progress in epitaxial growth of stanene
- Review and validation of photovoltaic solar simulation tools/software based on case study
- Brief Report
- The Debye–Scherrer technique – rapid detection for applications
- Rapid Communication
- Radial oscillations of an electron in a Coulomb attracting field
- Special Issue on Novel Numerical and Analytical Techniques for Fractional Nonlinear Schrodinger Type - Part II
- The exact solutions of the stochastic fractional-space Allen–Cahn equation
- Propagation of some new traveling wave patterns of the double dispersive equation
- A new modified technique to study the dynamics of fractional hyperbolic-telegraph equations
- An orthotropic thermo-viscoelastic infinite medium with a cylindrical cavity of temperature dependent properties via MGT thermoelasticity
- Modeling of hepatitis B epidemic model with fractional operator
- Special Issue on Transport phenomena and thermal analysis in micro/nano-scale structure surfaces - Part III
- Investigation of effective thermal conductivity of SiC foam ceramics with various pore densities
- Nonlocal magneto-thermoelastic infinite half-space due to a periodically varying heat flow under Caputo–Fabrizio fractional derivative heat equation
- The flow and heat transfer characteristics of DPF porous media with different structures based on LBM
- Homotopy analysis method with application to thin-film flow of couple stress fluid through a vertical cylinder
- Special Issue on Advanced Topics on the Modelling and Assessment of Complicated Physical Phenomena - Part II
- Asymptotic analysis of hepatitis B epidemic model using Caputo Fabrizio fractional operator
- Influence of chemical reaction on MHD Newtonian fluid flow on vertical plate in porous medium in conjunction with thermal radiation
- Structure of analytical ion-acoustic solitary wave solutions for the dynamical system of nonlinear wave propagation
- Evaluation of ESBL resistance dynamics in Escherichia coli isolates by mathematical modeling
- On theoretical analysis of nonlinear fractional order partial Benney equations under nonsingular kernel
- The solutions of nonlinear fractional partial differential equations by using a novel technique
- Modelling and graphing the Wi-Fi wave field using the shape function
- Generalized invexity and duality in multiobjective variational problems involving non-singular fractional derivative
- Impact of the convergent geometric profile on boundary layer separation in the supersonic over-expanded nozzle
- Variable stepsize construction of a two-step optimized hybrid block method with relative stability
- Thermal transport with nanoparticles of fractional Oldroyd-B fluid under the effects of magnetic field, radiations, and viscous dissipation: Entropy generation; via finite difference method
- Special Issue on Advanced Energy Materials - Part I
- Voltage regulation and power-saving method of asynchronous motor based on fuzzy control theory
- The structure design of mobile charging piles
- Analysis and modeling of pitaya slices in a heat pump drying system
- Design of pulse laser high-precision ranging algorithm under low signal-to-noise ratio
- Special Issue on Geological Modeling and Geospatial Data Analysis
- Determination of luminescent characteristics of organometallic complex in land and coal mining
- InSAR terrain mapping error sources based on satellite interferometry