Performance evaluation of self-mixing interferometer with the ceramic type piezoelectric accelerometers
-
 ,
,

Abstract
In this article, reconstructed displacement from the self-mixing signal is compared with the displacement obtained by the ceramic shear mode design piezoelectric accelerometer. Piezoelectric accelerometers are widely accepted due to the low output noise and wide frequency range, but nevertheless it is not contact-free. Self-mixing interferometric signals due to the vibrating target on which an accelerometer is attached are acquired by an external silicon type photodetector. The laser light hits directly the accelerometer as a target which is driven by the sum of two different sinusoidal frequencies of 150 and 300 Hz with different voltage levels.
1 Introduction
Self-mixing interferometry (SMI) has considerable impact in the area of optical metrological sensing with many interesting applications at the cost of minimal elementary optical setup [1,2]. The major observable parameters are the displacement, velocity, absolute distance, and vibration frequencies. The principles of self-mixing occurring in the laser cavity have been well understood and extensively studied in the literature [3,4,5,6,7,8]. Because of the high efficiency of light coupling out of the laser cavity of the semiconductor laser diodes, even in the case of weakly reflected light coming from the target, self-mixing effect is particularly strong due to its active gain medium and low reflection coefficients of lasing cavity. Reflected laser light couples back into the laser cavity where it interacts with the original laser light source. This causes a fluctuation in the laser power which can be detected by the photodetectors that is located on the opposite side of the laser cavity other than primary output. Semiconductor laser diode feedback was first modeled by Lang and Kobayashi [9] in 1980, where the electric fields are used to explain the modulation. This model explained only the weak to moderate optical feedback into the single mode laser diode. The dimensionless feedback parameter that depends on the amount of laser light reflected into the lasing cavity was introduced by this model as following [9].
where κ is the coupling coefficient that depends on reflectivity of the exit laser facet and the reflectivity of the target, τ in and τ are the internal and external cavity round trip time for the laser light, and α is the linewidth enhancement factor. The C parameter, depending on the level of feedback, is important in terms of understanding the different feedback regimes that the laser is operating. Due to the interaction between the target and laser light, the output power of laser light becomes modulated (P f) which can be directly obtained by the Lang and Kobayashi equation,
where m is the modulation index,
In this study, we compared the performance of ceramic shear-based piezoelectric accelerometer with the obtained self-mixing interferometric signals as a result of vibrations of sum of two frequencies. In order to retrieve the real target movement, solid state accelerometers were used to compensate the undesirable vibrations which degrade the self-mixing signals [10]. The advantage of used accelerometer is its broadband resolution of 0.001 m/s2 (RMS) in the range from 1 to 10 kHz. In the present work, construction of displacement was performed in the moderate feedback regime in which self-mixing was saw-tooth like interferometric signal.
Basic resolution of displacement for SMI is half of the wavelength of the laser. However, phase unwrapping method (PUM) was often used to improve the resolution much better than half wavelength of the laser [11,12]. Proposed by Zabit et al. [12], adaptive transition detection algorithm based on phase unwrapped differentiates from weak to strong self-mixing regimes and automatically detects the optimized threshold level so that it can detect all self-mixing signals independent from the feedback. The standard procedure for phase unwrapping has been used that is explained in Section 2.
Previous similar SMI setups are listed in Table 1 [10,11,12,13]. We have used the ceramic type sensing element of accelerometers which has a resolution of 0.0001g (RMS) (where g is the acceleration of gravity) over very broad range from 1 to 10 kHz for the first time. Also, Si photodetector has been used in our system which is more advanced than built-in detector in the laser. Besides, spectral noise performance of ceramic accelerometer is better than most of the solid state type accelerometers and it is given as 3 µg/
Comparison of previous and current work
| Previous work | Contribution | Our contribution |
|---|---|---|
| Usman Zabit et al. [10,12] | Parasitic vibrations have been eliminated by using a self-mixing displacement sensor that senses the parasitic vibrations transmitted to the SM sensor by using a solid state accelerometer based on a microelectromechanical system | Self-mixing interferometer with ceramic shear-based piezoelectric accelerometer with the SMI has been used |
| Bernal et al. [13] | The inherent error as well as the robustness of a previously published displacement retrieval technique called the PUM is analyzed. This analysis, based on a detailed study of laser feedback phase behavior, results in a new algorithm that removes the PUM inherent error while maintaining its robustness | PUM has been applied with ceramic accelerometer which has better resolution than most of the solid state type accelerometers |
2 Experimental method
2.1 Experimental setup
In the SMI, the common setup is based on the use of built-in monitor photodetector. When not available, one needs to setup with an external photodetector. In this case, using an external photodetector gives us an opportunity to choose suitable properties such as the bandwidth and quantum efficiencies. Moreover, it is shown that using a balanced detection setup with an external and internal photodetector gives an improved signal-to-noise ratio and enhanced self-mixing signal [13].
In the experiment, commercial laser diode of 808 nm (LD-808-100A, Thorlabs) was positioned 30 cm away from the target and the current and temperature of laser diode was controlled by the ITC-4005, Thorlabs. The collimated laser beam emitted by the laser diode is directed toward the accelerometer after passing through the neutral density (ND) filter. The ND filter functions as both beam splitter and feedback controller. Beam splitter splits the beam into two orthogonal directions of which one goes to the detector and the other goes to the target. Because it is continuously variable, amount of optical feedback can be controlled by moving it manually on its micro stage to the region where it is darker or lighter. The optimum position is decided by tracing and observing the self-mixing signal. Accelerometer (triaxial ICP accelerometer, model no. 356A16, PCB Piezotronics) was attached to the shaker firmly that is controlled by the computer via Acra KAM-500 Data Acquisition Systems. Spectral noise performance of the accelerometer at 300 Hz is given as 3 µg/Hz1/2, its sensitivity is given as 100 mV/g and its broadband (1–10,000 Hz) resolution is 0.0001 g (RMS), where g is the acceleration due to gravitational force. SMI signal was collected by the data acquisition module (NI, USB-6363) and the shaker was driven with the same module at the desired frequencies. The optical feedback was controlled by simply moving the ND filter manually which changes the optical power along the optical path. The calibration of accelerometer was checked by the calibration exciter (Type 4294, Brüel&Kjaer) that drives the accelerometer with oscillation of angular frequency of w = 1,000 rad/s which corresponds to 10 m/s2 (RMS) acceleration. Figure 1 shows our optical setup with drawing and the real pictures.

The experimental setup of the semiconductor SMI with an external photodiode. On the right figure, numbers from 1 to 8 correspond to the laser diode, the ND filter, Si photodiode, accelerometer, shaker, ITC-4005, ACRA KAM-500 data acquisition system for accelerometer, and notebook for LabVIEW control, respectively.
For all experiments, the acceleration data whose sampling frequency was set to 4 kHz was acquired by another computer. We could not obtain the SMI signal and the acceleration data simultaneously because of hardware difficulty of the accelerometer. Accelerometer has its own old-fashioned data acquisition system which is impossible to integrate it to our LabVIEW environment for self-mixing. But the figures are plotted as they are synchronized. However, we obtained synchronously the self-mixing signal and sinusoidal signal that drive the shaker and are all controlled by the NI DAQ card.
For the reconstructed displacement from the self-mixing signal, PUM has been used to extract the phase from P f(t) that allows displacements with a resolution of almost λ/20 [14]. Figure 2 shows the block diagram of the reconstruction method implemented in Matlab.

Schematic block diagram of PUM applied to the self-mixing signal for the reconstructed displacements.
3 Results and discussion
In the first case, the shaker was driven with a 300 Hz and 35 mV sinusoidal oscillation. For this single frequency oscillation, in order to find the displacement, we can make use of the accelerometer data that gives peak-to-peak a pp = (1.43 ± 0.01) × g m/s2 where g is taken to be 9.81 m/s2. Then, we can find the peak-to-peak displacement by using the following formula,
where f is 300 Hz. This gives approximately 3,900 ± 25 nm. When sum of two frequencies are given to the shaker, then Eq. (3) becomes
Self-mixing signal and phase unwrapping of the first case is shown in Figure 3. As can be seen, self-mixing signal resembles saw-tooth, so the C-parameter can be expected to be between 1 and 2. The red dotted curve represents the target motion under the driving frequency (Hz) and amplitude (mV). It was added to the graphs just to see the motion of target and their values are scaled to the graphs.

Case 1: 300 Hz, 35 mV sinusoidal signal. From top to down: self-mixing signal, differentiation of power, and unwrapped phase. Red dotted curve represents the target motion generated by the NI-6363 and their values were scaled to the graphs.
Top and bottom of Figure 4 are the reconstructed displacements and the second integral of the middle data which is the acceleration data. As seen, the motion is exactly sinusoidal with a driven frequency of 300 Hz. Similar graphs are plotted for the second and third cases which are sum of 150 Hz, 10 mV and 300 Hz, 5 mV, and the sum of 150 Hz, 15 mV and 300 Hz, 10 mV, respectively.

Case 1: 300 Hz, 35 mV sinusoidal signal. From top to down: reconstructed displacement using the phase unwrapped algorithm, acceleration data, and second integral of acceleration.
Figures 5–8 are the second and third cases, where we drive the target with two different frequencies and amplitudes. Self-mixing signal changes from the first case as the self-mixing signal is denser at rising edge of the driving signal than that of falling edges which can be clearly seen at the top of Figures 5 and 7.

Case 2: sum of 150 Hz, 15 mV and 300 Hz, 10 mV. From top to down: self-mixing signal, differentiation of power, and unwrapped phase. Red dotted curve represents the target motion generated by the NI-6363 and their values were scaled to the graphs.

Case 2: sum of 150 Hz, 15 mV and 300 Hz, 10 mV. From top to down: reconstructed displacement using the phase unwrapped algorithm, acceleration data, and second integral of acceleration. The acceleration data in the middle were acquired by the piezoelectric (ceramic shear) based accelerometer.

Case 3: sum of 150 Hz, 10 mV and 300 Hz, 5 mV. From top to down: self-mixing signal, differentiation of power, and unwrapped phase. Red dotted curve represents the target motion generated by the NI-6363 and their values were scaled to the graphs.

Case 3: sum of 150 Hz, 10 mV and 300 Hz, 5 mV. From top to down: reconstructed displacement using the phase unwrapped algorithm, acceleration data, and second integral of acceleration. The acceleration data in the middle were acquired by the piezoelectric (ceramic shear) based accelerometer.
In order to get the displacement from the accelerometer data, we just integrate twice by using trapezoid rule. Before and after the first integral, we have chosen the Butterworth filter in Matlab since it is maximally flat with minimal ripple. This filtering must be applied otherwise integral constant becomes time dependent after the second integral and this gives erroneous result.
All these figures present very good results as summarized in Table 2. If we take the theoretical result as references (last column in the table) which was obtained by the peak-to-peak fluctuation of the raw accelerometer data, reconstructed displacements from both self-mixing and accelerometer signal are very close to the theoretical results. By taking the FFT of the reconstructed displacements from the self-mixing signal, we get Figure 9, which shows good agreement with driven the oscillation frequencies. The signal at 150 Hz appears to be more dominant than that at 300 Hz because of its higher driven amplitude.
Comparisons of all three cases
| Sine driven oscillation | Reconstructed displacement (nm) | Integral displacement (nm) | Difference between wavelengths (nm) | Raw accelerometer value (m/s2) | Displacement formula result (Eqs. [3] and [4]) (nm) |
|---|---|---|---|---|---|
| 300 Hz, 35 mV | 3,870 ± 35 | 3,805 ± 45 | 65 ± 30 | 14.06 ± 0.12 | 3,900 ± 25 |
| 150 Hz, 15 mV + 300 Hz, 10 mV | 8,550 ± 35 | 8,615 ± 25 | 65 ± 20 | 10.56 ± 0.07 | 8,466 ± 50 |
| 150 Hz, 10 mV + 300 Hz, 5 mV | 5,660 ± 30 | 5,650 ± 20 | 10 ± 15 | 6.56 ± 0.06 | 5,652 ± 48 |
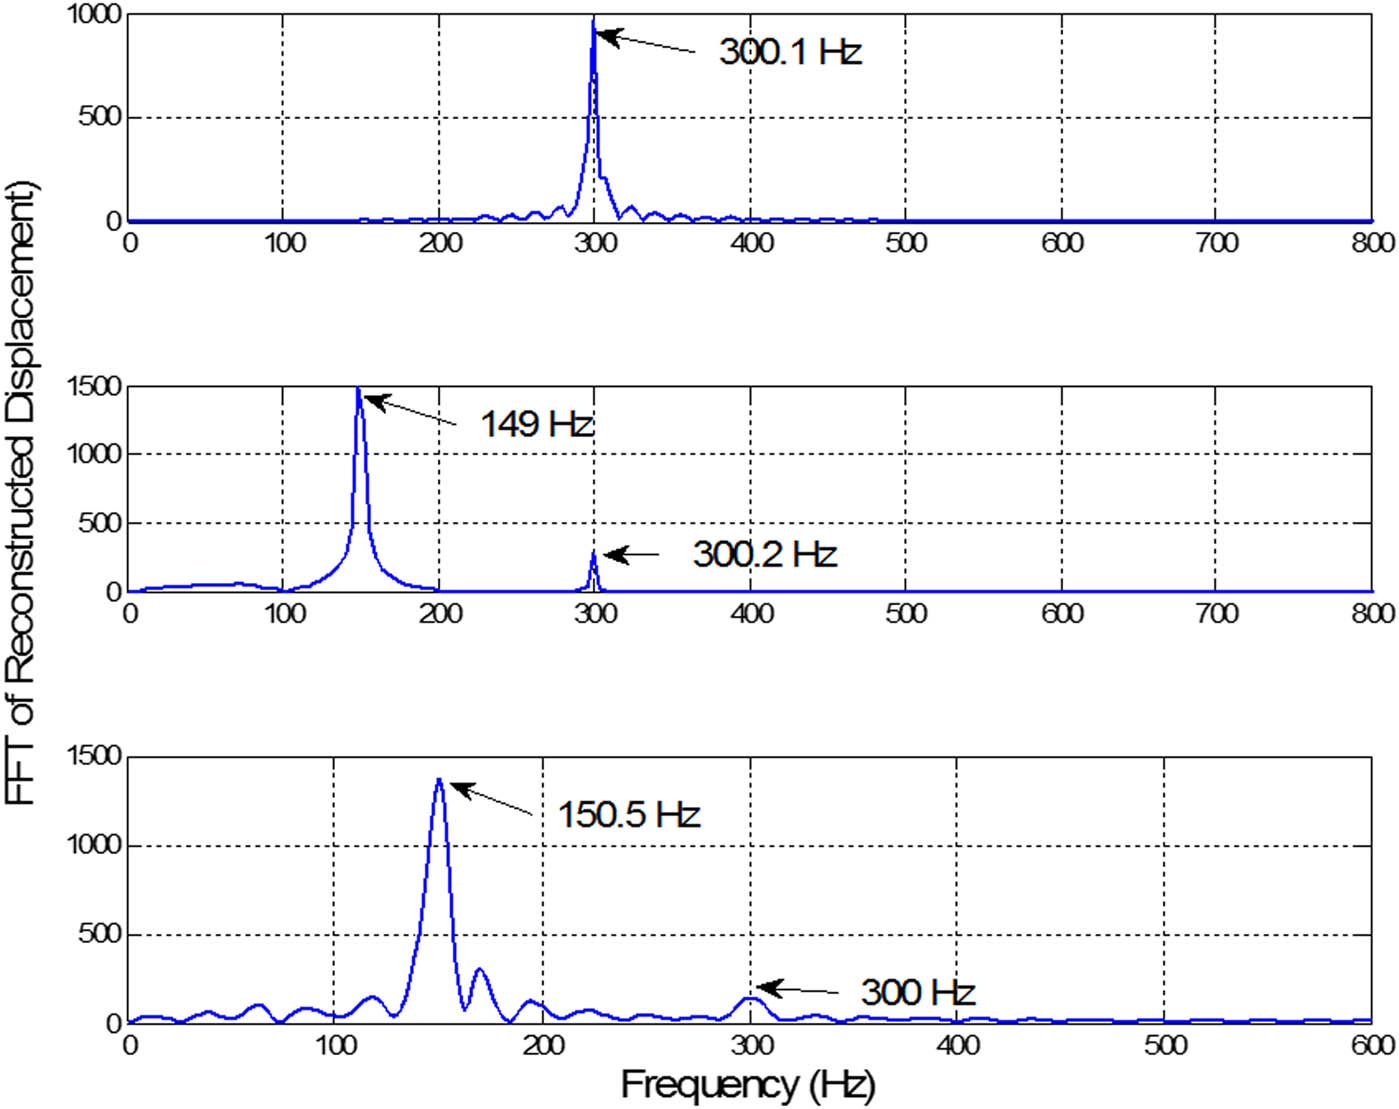
Fast fourier transform (FFT) results of constructed displacements for three cases.
4 Conclusion
In summary, we make a comparative study to obtain displacements of vibrating target by using two different ways, one of which is with ceramic-based piezoelectric accelerometer as a reference and the other is SMI. Butterworth filtering technique must be used to get correct displacement from the raw accelerometer data. Self-mixing interferometric method has given very good results with a proximity of 10, 30, and 90 nm results when compared to the theoretical results. Differences between the two methods are also in good agreement to each other which are 65 and 10 nm. When the error in the data is considered, differences can go up to approximately 100 nm at most.
Acknowledgements
The authors gratefully thank Prof. Dr Reşat Ozgur Doruk for guidance through preparation.
-
Funding information: This work was financially supported by Ankara Haci Bayram Veli University Scientific Research Project (Project Number: 01/2021-05) and Gazi University Scientific Research Project (Project Number: 18/2015-03).
-
Author contributions: All authors have accepted responsibility for the entire content of this manuscript and approved its submission.
-
Conflict of interest: The authors state no conflict of interest.
References
[1] Giuliani G, Norgia M, Donati S, Bosch T. Laser diode self-mixing technique for sensing applications. J Opt A Pure Appl Opt. 2002;4:283–94. 10.1088/1464-4258/4/6/371.Search in Google Scholar
[2] Tambosso T, Horng RH, Donati S. Curvature of substrates is measured by means of a self-mixing scheme. IEEE Photonics Technol Lett. 2014;26:2170–2. 10.1109/LPT.2014.2349958.Search in Google Scholar
[3] Reza Atashkhooei EER, Miquet RC, Moreira A, Quotb S, Royo J. Perchoux, optical feedback flowmetry: impact of particle concentration on the signal processing method. IEEE Sens J. 2018;18:4.10.1109/JSEN.2017.2781902Search in Google Scholar
[4] Donati S, Martini G, Hwang S-K. Measurement of ambient vibration by self-mixing interferometry and its application to intrusion detection. Opt Eng. 2018;57(5):051508.10.1117/1.OE.57.5.051508Search in Google Scholar
[5] Candan C, Tiken M, Orhan E, Berberoglu H. Determination of balance degree of spinning gyro disk by using optical feedback interferometry. Proc. SPIE 10695, optical instrument science, technology, and applications. Frankfurt, Germany: SPIE European Optical Design Conference; 2018. p. 106950X.Search in Google Scholar
[6] Wang WM, Boyle WJO, Grattan KTV, Palmer AW. Self-mixing interference in a diode laser: experimental observations and theoretical analysis. Appl Opt. 1993;32:1551. 10.1364/AO.32.001551.Search in Google Scholar PubMed
[7] Li K, Cavedo F, Pesatori A, Zhao C, Norgia M. Balanced detection for self-mixing interferometry. Optics Letters. 2017;42(2):283–5. 10.1364/OL.42.000283.Search in Google Scholar PubMed
[8] Bes C, Plantier G, Bosch T. Displacement measurements using a self-mixing laser diode under moderate feedback. IEEE Trans Instrum Meas. 2006;55:1101–5. 10.1109/TIM.2006.876544.Search in Google Scholar
[9] Lang R, Kobayashi K. External optical feedback effects on semiconductor injection laser properties. IEEE J Quantum Electron. 1980;16:347–55. 10.1109/JQE.1980.1070479.Search in Google Scholar
[10] Zabit U, Bernal OD, Bosch T, Bony F. MEMS accelerometer embedded in a self-mixing displacement sensor for parasitic vibration compensation. Optics Letters. 2011;36(5):612–4.10.1364/OL.36.000612Search in Google Scholar PubMed
[11] Wang WM, Grattan KTV, Palmer AW, Boyle WJO. Self-mixing interference inside a single-mode diode laser for optical sensing applications. J Light Technol. 1994;12:1577–87. 10.1109/50.320940.Search in Google Scholar
[12] Zabit U, Bosch T, Bony F. Adaptive transition detection algorithm for a self-mixing displacement sensor. IEEE Sens J. 2009;9:1879–86. 10.1109/JSEN.2009.2031496.Search in Google Scholar
[13] Bernal OD, Zabit U, Bosch T. Study of laser feedback phase under self-mixing leading to improved phase unwrapping for vibration sensing. IEEE Sens J. 2013;13:4962–71. 10.1109/JSEN.2013.2276106.Search in Google Scholar
[14] Donati S. Developing self-mixing interferometry for instrumentation and measurements. Laser Photonics Rev. 2012;6:393–417. 10.1002/lpor.201100002.Search in Google Scholar
© 2022 Halil Berberoğlu et al., published by De Gruyter
This work is licensed under the Creative Commons Attribution 4.0 International License.
Articles in the same Issue
- Regular Articles
- Test influence of screen thickness on double-N six-light-screen sky screen target
- Analysis on the speed properties of the shock wave in light curtain
- Abundant accurate analytical and semi-analytical solutions of the positive Gardner–Kadomtsev–Petviashvili equation
- Measured distribution of cloud chamber tracks from radioactive decay: A new empirical approach to investigating the quantum measurement problem
- Nuclear radiation detection based on the convolutional neural network under public surveillance scenarios
- Effect of process parameters on density and mechanical behaviour of a selective laser melted 17-4PH stainless steel alloy
- Performance evaluation of self-mixing interferometer with the ceramic type piezoelectric accelerometers
- Effect of geometry error on the non-Newtonian flow in the ceramic microchannel molded by SLA
- Numerical investigation of ozone decomposition by self-excited oscillation cavitation jet
- Modeling electrostatic potential in FDSOI MOSFETS: An approach based on homotopy perturbations
- Modeling analysis of microenvironment of 3D cell mechanics based on machine vision
- Numerical solution for two-dimensional partial differential equations using SM’s method
- Multiple velocity composition in the standard synchronization
- Electroosmotic flow for Eyring fluid with Navier slip boundary condition under high zeta potential in a parallel microchannel
- Soliton solutions of Calogero–Degasperis–Fokas dynamical equation via modified mathematical methods
- Performance evaluation of a high-performance offshore cementing wastes accelerating agent
- Sapphire irradiation by phosphorus as an approach to improve its optical properties
- A physical model for calculating cementing quality based on the XGboost algorithm
- Experimental investigation and numerical analysis of stress concentration distribution at the typical slots for stiffeners
- An analytical model for solute transport from blood to tissue
- Finite-size effects in one-dimensional Bose–Einstein condensation of photons
- Drying kinetics of Pleurotus eryngii slices during hot air drying
- Computer-aided measurement technology for Cu2ZnSnS4 thin-film solar cell characteristics
- QCD phase diagram in a finite volume in the PNJL model
- Study on abundant analytical solutions of the new coupled Konno–Oono equation in the magnetic field
- Experimental analysis of a laser beam propagating in angular turbulence
- Numerical investigation of heat transfer in the nanofluids under the impact of length and radius of carbon nanotubes
- Multiple rogue wave solutions of a generalized (3+1)-dimensional variable-coefficient Kadomtsev--Petviashvili equation
- Optical properties and thermal stability of the H+-implanted Dy3+/Tm3+-codoped GeS2–Ga2S3–PbI2 chalcohalide glass waveguide
- Nonlinear dynamics for different nonautonomous wave structure solutions
- Numerical analysis of bioconvection-MHD flow of Williamson nanofluid with gyrotactic microbes and thermal radiation: New iterative method
- Modeling extreme value data with an upside down bathtub-shaped failure rate model
- Abundant optical soliton structures to the Fokas system arising in monomode optical fibers
- Analysis of the partially ionized kerosene oil-based ternary nanofluid flow over a convectively heated rotating surface
- Multiple-scale analysis of the parametric-driven sine-Gordon equation with phase shifts
- Magnetofluid unsteady electroosmotic flow of Jeffrey fluid at high zeta potential in parallel microchannels
- Effect of plasma-activated water on microbial quality and physicochemical properties of fresh beef
- The finite element modeling of the impacting process of hard particles on pump components
- Analysis of respiratory mechanics models with different kernels
- Extended warranty decision model of failure dependence wind turbine system based on cost-effectiveness analysis
- Breather wave and double-periodic soliton solutions for a (2+1)-dimensional generalized Hirota–Satsuma–Ito equation
- First-principle calculation of electronic structure and optical properties of (P, Ga, P–Ga) doped graphene
- Numerical simulation of nanofluid flow between two parallel disks using 3-stage Lobatto III-A formula
- Optimization method for detection a flying bullet
- Angle error control model of laser profilometer contact measurement
- Numerical study on flue gas–liquid flow with side-entering mixing
- Travelling waves solutions of the KP equation in weakly dispersive media
- Characterization of damage morphology of structural SiO2 film induced by nanosecond pulsed laser
- A study of generalized hypergeometric Matrix functions via two-parameter Mittag–Leffler matrix function
- Study of the length and influencing factors of air plasma ignition time
- Analysis of parametric effects in the wave profile of the variant Boussinesq equation through two analytical approaches
- The nonlinear vibration and dispersive wave systems with extended homoclinic breather wave solutions
- Generalized notion of integral inequalities of variables
- The seasonal variation in the polarization (Ex/Ey) of the characteristic wave in ionosphere plasma
- Impact of COVID 19 on the demand for an inventory model under preservation technology and advance payment facility
- Approximate solution of linear integral equations by Taylor ordering method: Applied mathematical approach
- Exploring the new optical solitons to the time-fractional integrable generalized (2+1)-dimensional nonlinear Schrödinger system via three different methods
- Irreversibility analysis in time-dependent Darcy–Forchheimer flow of viscous fluid with diffusion-thermo and thermo-diffusion effects
- Double diffusion in a combined cavity occupied by a nanofluid and heterogeneous porous media
- NTIM solution of the fractional order parabolic partial differential equations
- Jointly Rayleigh lifetime products in the presence of competing risks model
- Abundant exact solutions of higher-order dispersion variable coefficient KdV equation
- Laser cutting tobacco slice experiment: Effects of cutting power and cutting speed
- Performance evaluation of common-aperture visible and long-wave infrared imaging system based on a comprehensive resolution
- Diesel engine small-sample transfer learning fault diagnosis algorithm based on STFT time–frequency image and hyperparameter autonomous optimization deep convolutional network improved by PSO–GWO–BPNN surrogate model
- Analyses of electrokinetic energy conversion for periodic electromagnetohydrodynamic (EMHD) nanofluid through the rectangular microchannel under the Hall effects
- Propagation properties of cosh-Airy beams in an inhomogeneous medium with Gaussian PT-symmetric potentials
- Dynamics investigation on a Kadomtsev–Petviashvili equation with variable coefficients
- Study on fine characterization and reconstruction modeling of porous media based on spatially-resolved nuclear magnetic resonance technology
- Optimal block replacement policy for two-dimensional products considering imperfect maintenance with improved Salp swarm algorithm
- A hybrid forecasting model based on the group method of data handling and wavelet decomposition for monthly rivers streamflow data sets
- Hybrid pencil beam model based on photon characteristic line algorithm for lung radiotherapy in small fields
- Surface waves on a coated incompressible elastic half-space
- Radiation dose measurement on bone scintigraphy and planning clinical management
- Lie symmetry analysis for generalized short pulse equation
- Spectroscopic characteristics and dissociation of nitrogen trifluoride under external electric fields: Theoretical study
- Cross electromagnetic nanofluid flow examination with infinite shear rate viscosity and melting heat through Skan-Falkner wedge
- Convection heat–mass transfer of generalized Maxwell fluid with radiation effect, exponential heating, and chemical reaction using fractional Caputo–Fabrizio derivatives
- Weak nonlinear analysis of nanofluid convection with g-jitter using the Ginzburg--Landau model
- Strip waveguides in Yb3+-doped silicate glass formed by combination of He+ ion implantation and precise ultrashort pulse laser ablation
- Best selected forecasting models for COVID-19 pandemic
- Research on attenuation motion test at oblique incidence based on double-N six-light-screen system
- Review Articles
- Progress in epitaxial growth of stanene
- Review and validation of photovoltaic solar simulation tools/software based on case study
- Brief Report
- The Debye–Scherrer technique – rapid detection for applications
- Rapid Communication
- Radial oscillations of an electron in a Coulomb attracting field
- Special Issue on Novel Numerical and Analytical Techniques for Fractional Nonlinear Schrodinger Type - Part II
- The exact solutions of the stochastic fractional-space Allen–Cahn equation
- Propagation of some new traveling wave patterns of the double dispersive equation
- A new modified technique to study the dynamics of fractional hyperbolic-telegraph equations
- An orthotropic thermo-viscoelastic infinite medium with a cylindrical cavity of temperature dependent properties via MGT thermoelasticity
- Modeling of hepatitis B epidemic model with fractional operator
- Special Issue on Transport phenomena and thermal analysis in micro/nano-scale structure surfaces - Part III
- Investigation of effective thermal conductivity of SiC foam ceramics with various pore densities
- Nonlocal magneto-thermoelastic infinite half-space due to a periodically varying heat flow under Caputo–Fabrizio fractional derivative heat equation
- The flow and heat transfer characteristics of DPF porous media with different structures based on LBM
- Homotopy analysis method with application to thin-film flow of couple stress fluid through a vertical cylinder
- Special Issue on Advanced Topics on the Modelling and Assessment of Complicated Physical Phenomena - Part II
- Asymptotic analysis of hepatitis B epidemic model using Caputo Fabrizio fractional operator
- Influence of chemical reaction on MHD Newtonian fluid flow on vertical plate in porous medium in conjunction with thermal radiation
- Structure of analytical ion-acoustic solitary wave solutions for the dynamical system of nonlinear wave propagation
- Evaluation of ESBL resistance dynamics in Escherichia coli isolates by mathematical modeling
- On theoretical analysis of nonlinear fractional order partial Benney equations under nonsingular kernel
- The solutions of nonlinear fractional partial differential equations by using a novel technique
- Modelling and graphing the Wi-Fi wave field using the shape function
- Generalized invexity and duality in multiobjective variational problems involving non-singular fractional derivative
- Impact of the convergent geometric profile on boundary layer separation in the supersonic over-expanded nozzle
- Variable stepsize construction of a two-step optimized hybrid block method with relative stability
- Thermal transport with nanoparticles of fractional Oldroyd-B fluid under the effects of magnetic field, radiations, and viscous dissipation: Entropy generation; via finite difference method
- Special Issue on Advanced Energy Materials - Part I
- Voltage regulation and power-saving method of asynchronous motor based on fuzzy control theory
- The structure design of mobile charging piles
- Analysis and modeling of pitaya slices in a heat pump drying system
- Design of pulse laser high-precision ranging algorithm under low signal-to-noise ratio
- Special Issue on Geological Modeling and Geospatial Data Analysis
- Determination of luminescent characteristics of organometallic complex in land and coal mining
- InSAR terrain mapping error sources based on satellite interferometry