Evaluation of ESBL resistance dynamics in Escherichia coli isolates by mathematical modeling
-
Ulas Hurdoganoglu
 ,
Bilgen Kaymakamzade
,
Bilgen Kaymakamzade
 ,
Evren Hincal
,
Evren Hincal

Abstract
Antibiotic resistance is becoming one of the threats to global health. This crisis has been attributed to the over-the-counter and overuse of antibiotics leading bacteria to gain the ability to resist and survive even in the presence of antimicrobial agents. Escherichia coli (E. coli) is one of the major gram-negative bacteria that are the representative indicators of antibiotic resistance. One of the mechanisms of gaining antibiotic resistance is the ability of E. coli to gain the production of extended-spectrum beta-lactamases (ESBL). In this study, Near East University Hospital data from 2016 to 2019 were used to study the dynamics of ESBL-producing (
1 Introduction
Microorganisms in the Enterobacteriaceae family are the most frequently isolated gram-negative bacteria group from clinical specimens. One example is Escherichia coli (E. coli), which is a member of the human intestinal normal flora but can also be the cause of infections like urinary tract infections, hemolytic uremic syndrome, pneumonia, sepsis, meningitis, diarrhea, etc. [1].
In the last decade, bacteria developing resistance to available antibiotics has become a global threat worldwide. One of the biggest reasons for this is the inappropriate and over-the-counter use of antibiotics. Resistance development in gram-negative bacteria against beta-lactam antibiotics is due to the widespread inappropriate use of new beta-lactam antibiotics. Bacteria acquire resistance by gaining the property of producing the beta-lactamase enzyme. These enzymes destroy the antibacterial effect by breaking the amide bonds in the beta-lactam ring of beta-lactam antibiotics [2,3].
One of the most important resistance mechanisms against beta-lactam group antibiotics is the production of extended-spectrum beta-lactamase (ESBL). ESBL-producing Enterobacteriaceae isolates are common human pathogens that pose serious problems for individual and public health [4]. Infections originating from ESBL producing E. coli strains can lead to long-term hospitalization, high treatment costs, and high mortality rates [5,6].
The first choice of antibacterial agent in the treatment of ESBL producing gram-negative bacterial infections is the carbapenem antibiotic group. Similar to beta-lactam group antibiotic, resistance development in the carbapenem antibiotic group is seen frequently due to the widespread and inappropriate use of carbapenems [7]. Carbapenem-resistant Enterobacteriaceae isolates can also be resistant to many other antibiotics and are considered virulent pathogens. Therefore, serious measures must be taken to prevent the spread of these microorganisms [8].
The distribution of microorganisms that cause infectious diseases and their resistance to antibiotics have changed over the years. For this reason, changes in the causative microorganism and antibiotic resistance status should be constantly monitored by each laboratory to guide the application of empirical treatment [9].
Mathematical modeling is often used to analyze the dynamics of infectious diseases such as influenza, childhood infections, HIV, or vector-borne infections. It has been a widely used technique in recent years for the generation of heath policies as well as supporting the control strategies development of infectious diseases [10,11]. Also, simulations applied in a mathematical model are used to forecast ongoing epidemic spread within the studied population [12]. In addition, with the emergence of coronavirus disease 2019 (COVID-19) pandemic, many studies have successfully used mathematical modeling to control and develop country-based health policies [12,13]. The applied mathematical models generally aim to predict the recurrence, spread, and mortality rates of the disease and to explain their causes [14,15].
In this study, culture samples of patients who were admitted to the Near East University (NEU) Hospital between 2016 and 2019 were evaluated. A mathematical model was created with the data determined and obtained retrospectively. The mathematical model used in this study is
The very important threshold quantity of the mathematical model is the basic reproduction number denoted as R 0 which is an epidemiologic metric used to analyze the dynamics of infectious diseases. The R 0 is generally reported as a single numeric value and the magnitude of R 0 value is indicative of a potential size of an outbreak or epidemic within the studied population. Interpretations of the R 0 value are made as follows: if the value is equal to or above 1 an outbreak is expected to continue. On the other hand, if R 0 value is below 1, an outbreak is expected to end [17,18].
The created SI type of mathematical model within this study aimed to analyze the antibiotic resistance patterns of E. coli infections and the rate of encountering non-ESBL and ESBL producing E. coli infections. This study also aims to reveal the emergence rates of E. coli strains in patients from the cumulative data of patients visiting NEU Hospital from 2016 to 2019.
Before starting this study, research related to mathematical modeling in the literature was examined. It has been seen that mathematical models are used in the analysis of HIV (human immunodeficiency virus) dynamics [11], in different fields for many purposes during the COVID-19 pandemic [19], in the follow-up of parasitic infections like Hookworm infection [20], in modeling the measles epidemic [21], and in studies related to the investigation of immunological tumor dynamics in cancer patients [22]. In addition, this study was aimed because there are almost no modeling studies on bacteria and antibiotic resistance. The absence of any modeling studies on E. coli and antibiotic resistance patterns in Northern Cyprus is one of the main reasons for planning this study.
There are very few articles in the literature about following or predicting the bacteria that cause common diseases and the resistance patterns they develop with mathematical modeling. Our article is especially important in terms of following up E. coli infections taking precautions by monitoring resistance strains, and therefore, reducing mortality and morbidity rates. The main goals of this study were to: (i) emphasize the inappropriate use of antibiotics, which is the main reason for the development of resistance in bacteria, (ii) evaluate the status of ESBL producer E. coli strains in the future, (iii) make assumptions by discussing the increasing problem of antibiotics, and (iv) estimate the ways to combat these problems and to increase the success rates in the treatment of patients infected with E. coli.
The remainder of the article proceeds as follows. In Section 2, collection of E. coli data and applied models are described. In Section 3, the values of the model in numerical simulation and sensitivity analysis of the dynamics of resistant E. coli strains are explained in the light of the data obtained as a result of the modeling. In the last sections, a discussion of the results and concluding remarks are presented.
2 Experimental procedures
2.1 Collection of data
E. coli strains detected in patients who visited the NEU Hospital between 2016 and 2019 were taken from the Nucleus data system in the hospital with their associated pre-determined parameters. These parameters included age, gender, and culture samples (urine, blood, aspirate, etc.). Also, the parameters included the departments where these samples arrived from such as internal medicine, intensive care, etc. Furthermore, the strains of E. coli were grouped into ESBL negative and ESBL producing E. coli strains according to their antibiotic resistance profile. In this study, to simplify the flow of the text, ESBL producing E. coli strains are referred to as
2.2 Identification of strains and antimicrobial susceptibility tests
The samples taken from the relevant services and polyclinics of the NEU Hospital during the study period were delivered to the microbiology laboratory. The delivered samples were cultured on blood agar and eosin methylene blue (EMB) agar. These media were kept in an incubator at 35°C for 24–48 h depending on the growth status.
For the samples with gram-negative bacterial growth, McFarland bacterial suspensions in the range of 0.50–0.63 MFU were prepared based on the manufacturer’s recommendations. These prepared suspensions were loaded into the Biomerieux VITEK® 2 Compact (bioMerieux, Inc. Durham, USA) device for identification of the bacterial species and analysis of antimicrobial susceptibility tests. VITEK® 2 GN (bioMerieux, Inc. Durham, USA) cards were used to identify the gram-negative bacterial species. The antimicrobial resistance of the detected bacteria was determined by the type of sample (urine, sputum, etc.) by using VITEK® 2 AST-N327 (bioMerieux, Inc. Durham, USA), VITEK® 2 AST-N325 (bioMerieux, Inc. Durham, USA), and VITEK® 2 AST-N326 (bioMerieux, Inc. Durham, USA) cards.
2.3 Application of obtained data to the mathematical model
The study used SI type of mathematical model. Basic reproduction numbers for E. coli non-ESBL and ESBL producing infections were calculated and represented as
In the constructed model, populations within the hospital were grouped into three mutually exclusive ways: The susceptible
Within the created model, the rate of admission to the hospital with infected
Descriptions and the values of the parameters within the mathematical model
| Parameters | Descriptions | Values |
|---|---|---|
| S | Susceptible to E. coli | 17,579 |
| E − | ESBL negative E. coli | 1,279 |
|
|
ESBL positive E. coli | 601 |
|
|
Carbapenems | 518 |
|
|
Piperacillin-tazobactam | 472 |
|
|
The number of hospital admissions | 67.064 |
|
|
The fraction of patients admitted with
|
0.5099 |
|
|
The fraction of patients admitted with
|
0.0239 |
|
|
The probability that a person takes drug one and be resistant to the drug | 0.7 |
|
|
The transmission rate of a susceptibility patient infected with
|
0.00000045 |
|
|
The transmission rate of susceptible to ESBL+ E. coli | 0.00000052 |
|
|
Removed from
|
0.007819 |
|
|
Transmission rate from
|
000655 |
|
|
Rate of individuals that can be treated with K | 0.000861897 |
| p | Rate of individuals that can be treated with T | 0.000078536 |
|
|
Transmission rate from
|
0.00218 |
|
|
Natural death | 0.0002 |
The most often used treatment options for
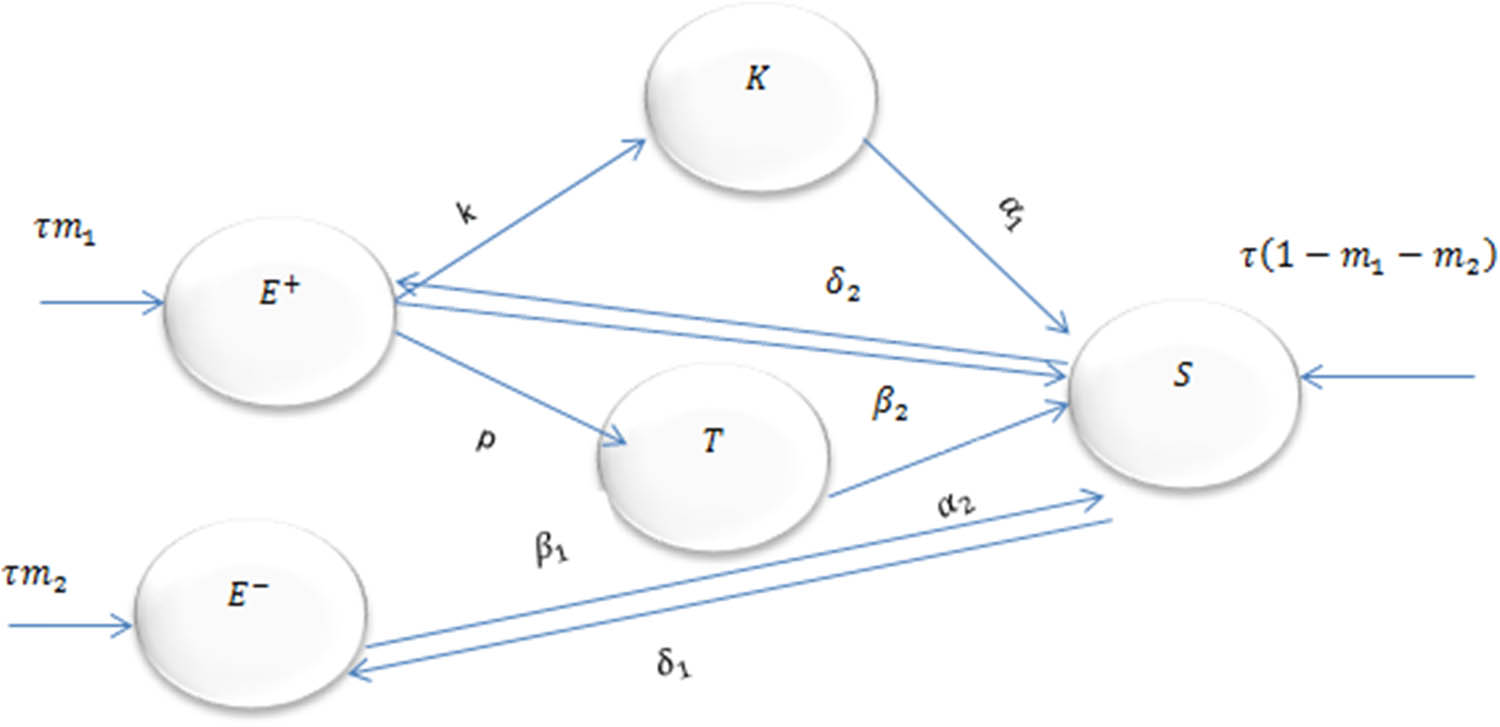
The flowchart representing compartments and their interaction with
It is assumed that the individual with ESBL+ can be treated with
2.4 Stability of disease-free equilibrium (DFE) point and basic reproduction ratio
With equalizing to zero of each equation in the system (2) and with the assumption
By using the next-generation matrix method,
Then,
Then, parameters represented in Table 1 were integrated into equations. (3) and (4) and the below values of
Theorem 1
For model (2), the disease-free equilibrium was locally asymptotically stable when
Proof
The Jacobian matrix at the DFE point of the model (2):□
The eigenvalues of the Jacobian matrix were:
The
Sensitivity analysis of
Local sensitivity analyses were applied in order to highlight the sensitivity of some key associated parameters to the value of
This was performed to analyze the sensitivity of
Then, computation of the normalized local sensitivity was performed which indicates that
By using the
Using the above definition (5), the model was computed by the following indices for the output
3 Results
In this model, the patients who were diagnosed from 2016 to 2019 solely with E. coli strains were used to study E. coli infections and estimate the simulations on the antibiotic resistance analysis. Based on the collected data, sensitivity analysis was applied to each of the parameters indicated in Table 1 within the model. The parameters in Table 1 were integrated into Eqs. (6–17) and the sensitivity analysis for each parameter in
Sensitivity analysis of
| Sensitivity | Sensitivity values |
|---|---|
|
|
1 |
|
|
1 |
|
|
–0.9599 |
|
|
–0.98545 |
|
|
–0.01095 |
|
|
–1.0036 |
|
|
1 |
|
|
1 |
|
|
–0.87212 |
|
|
–0.87745 |
|
|
–0.09817 |
|
|
–0.01046 |
For
Furthermore, dynamics of the E. coli
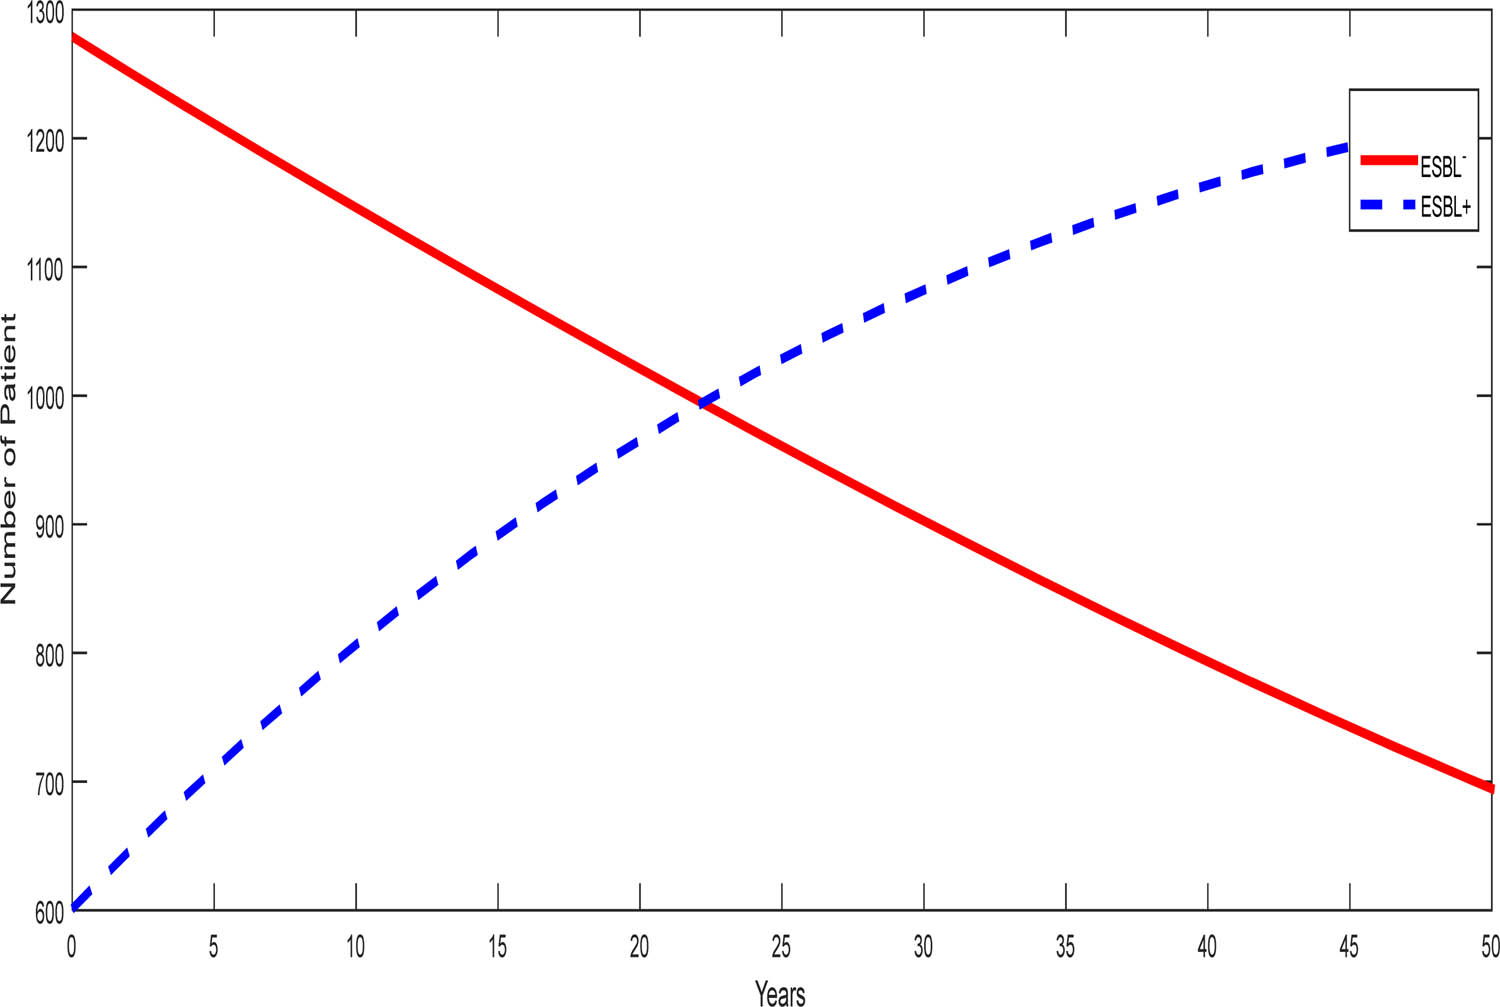
Dynamics of
With the present data, non-ESBL E. coli (
3.1 Sensitivity analysis of
R
0
within the model for
E
S
B
L
+
E. coli patients
From here, the rest of the study has emphasized the
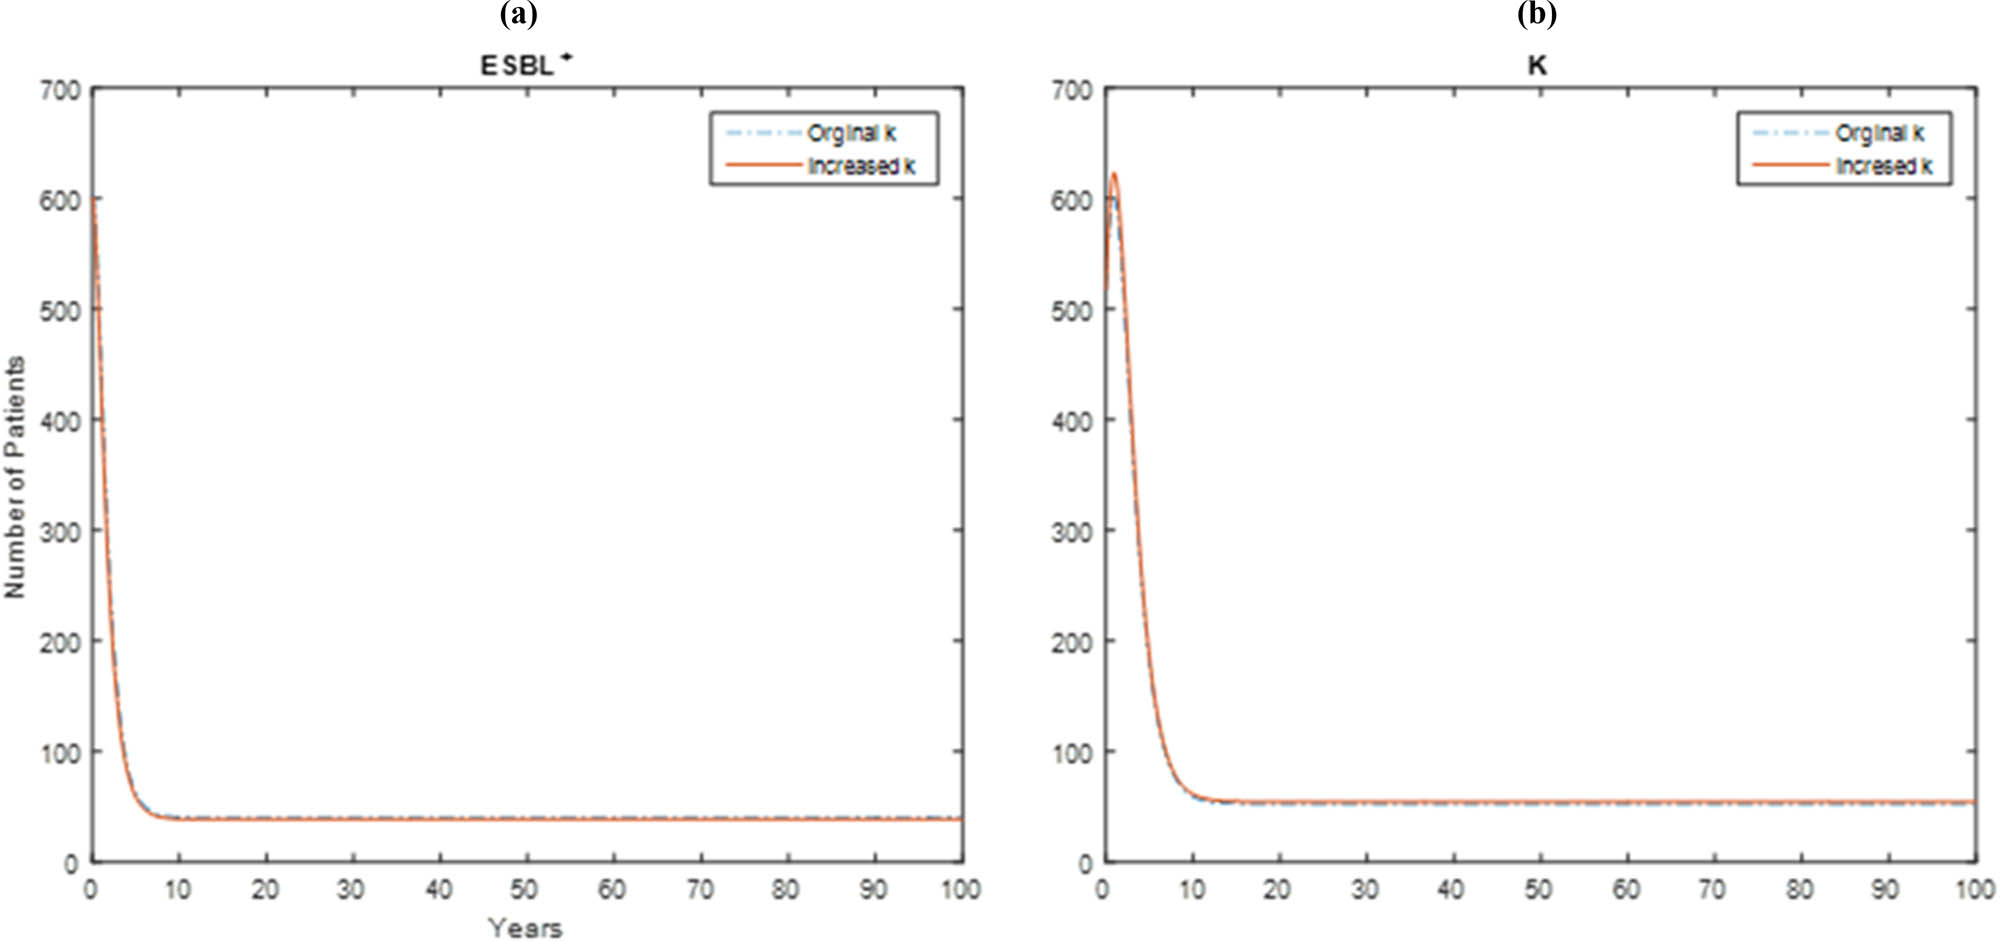
The parameter represents the carbapenemase treatment. Figure 3a represents the original data and Figure 3b represents the 10% increase in carbapenemase treatment to the original data. In this way, the model sensitivity could be analyzed. According to our application, when
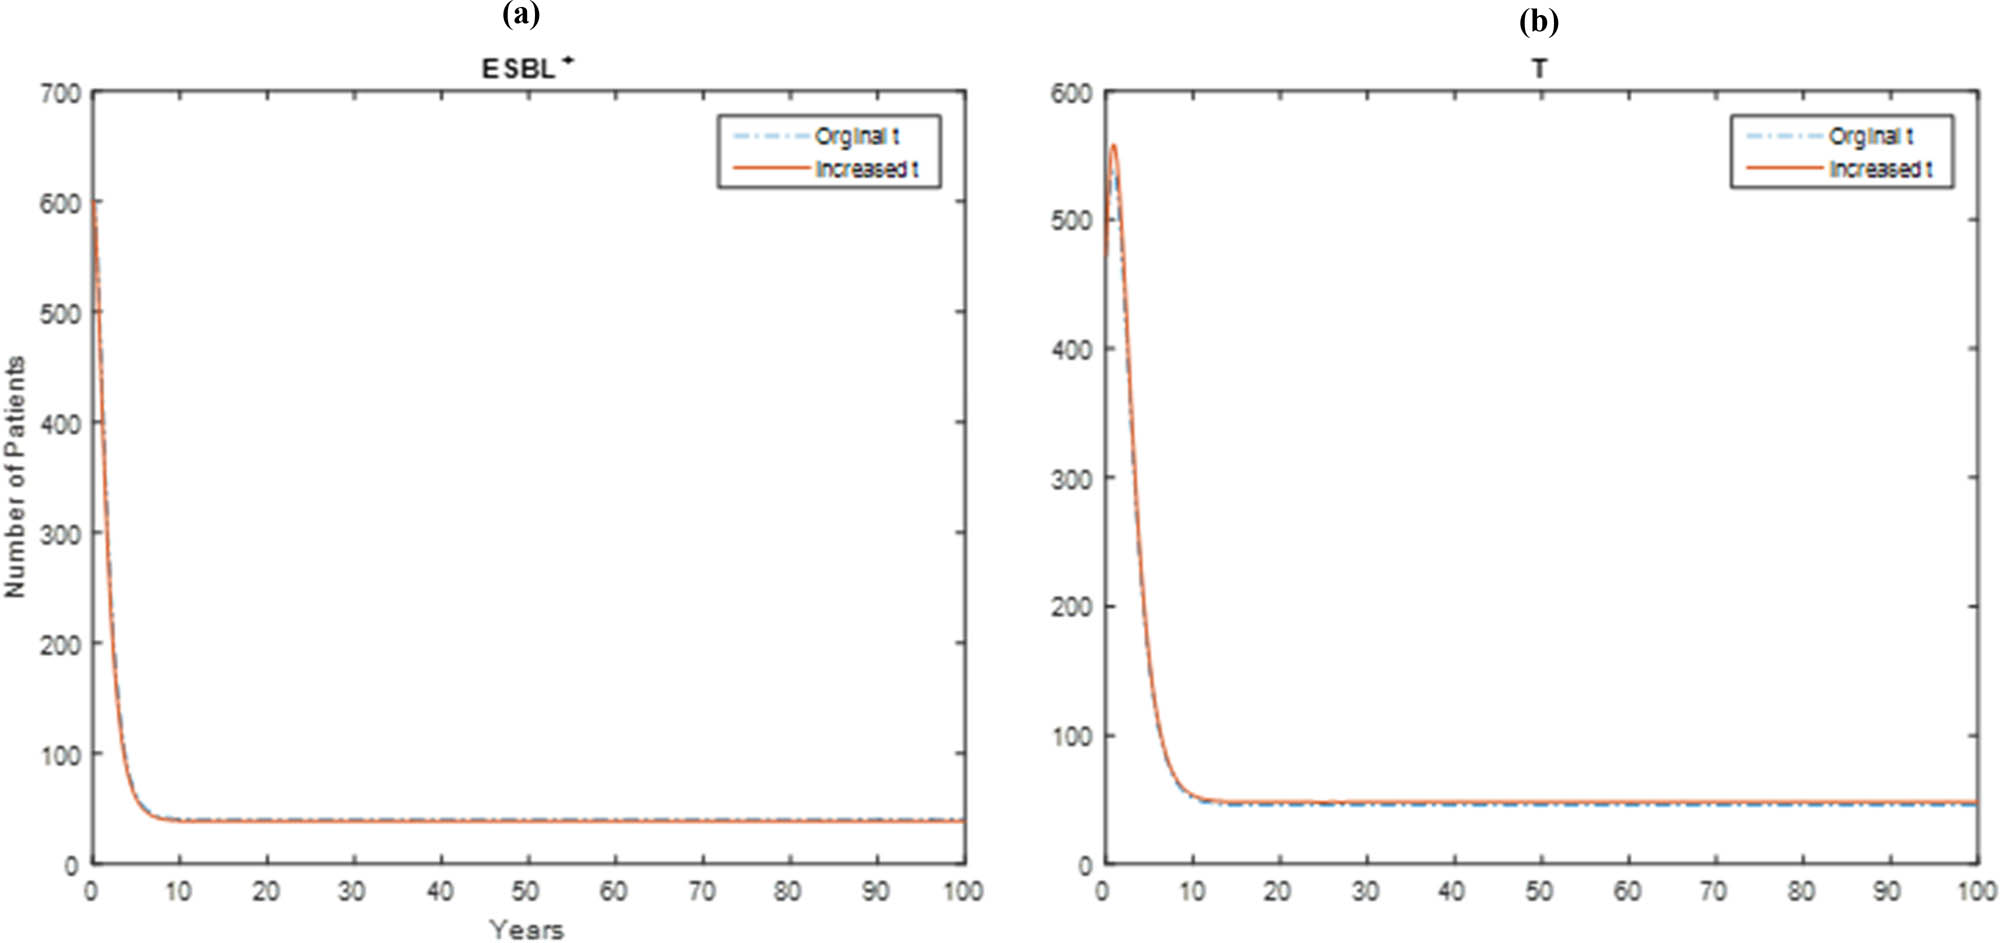
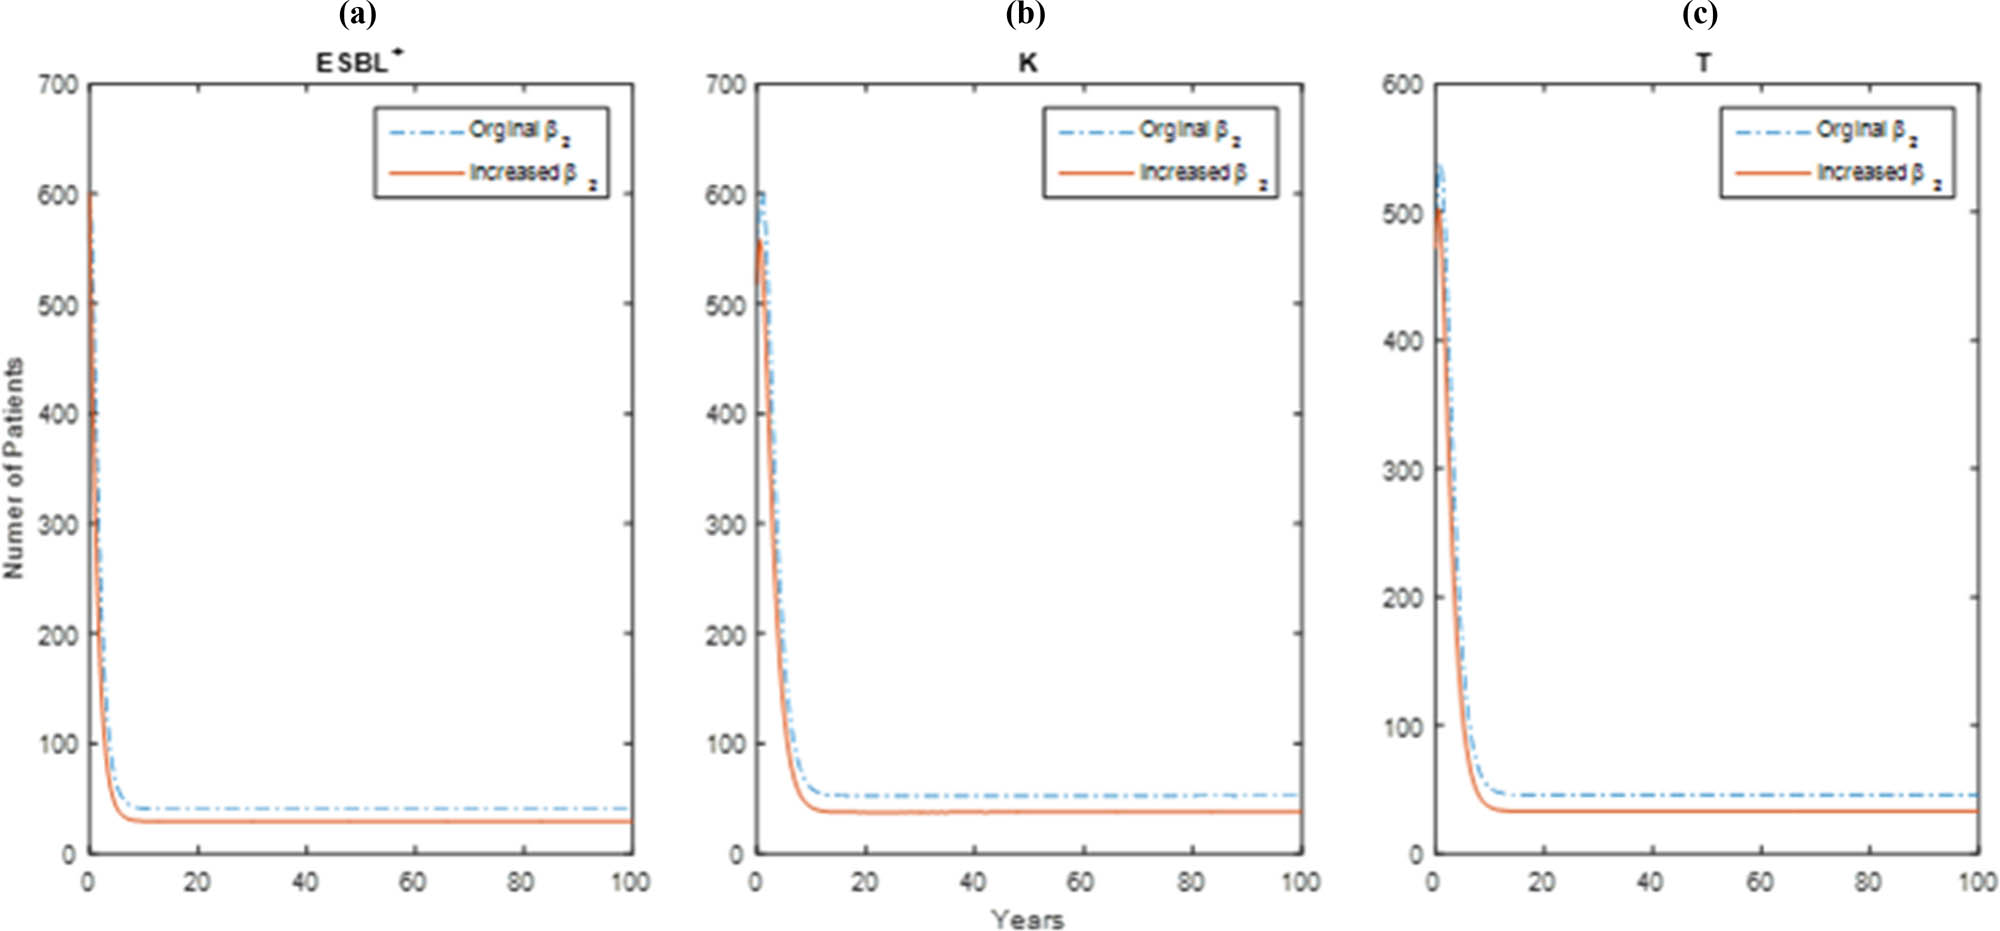
The parameter
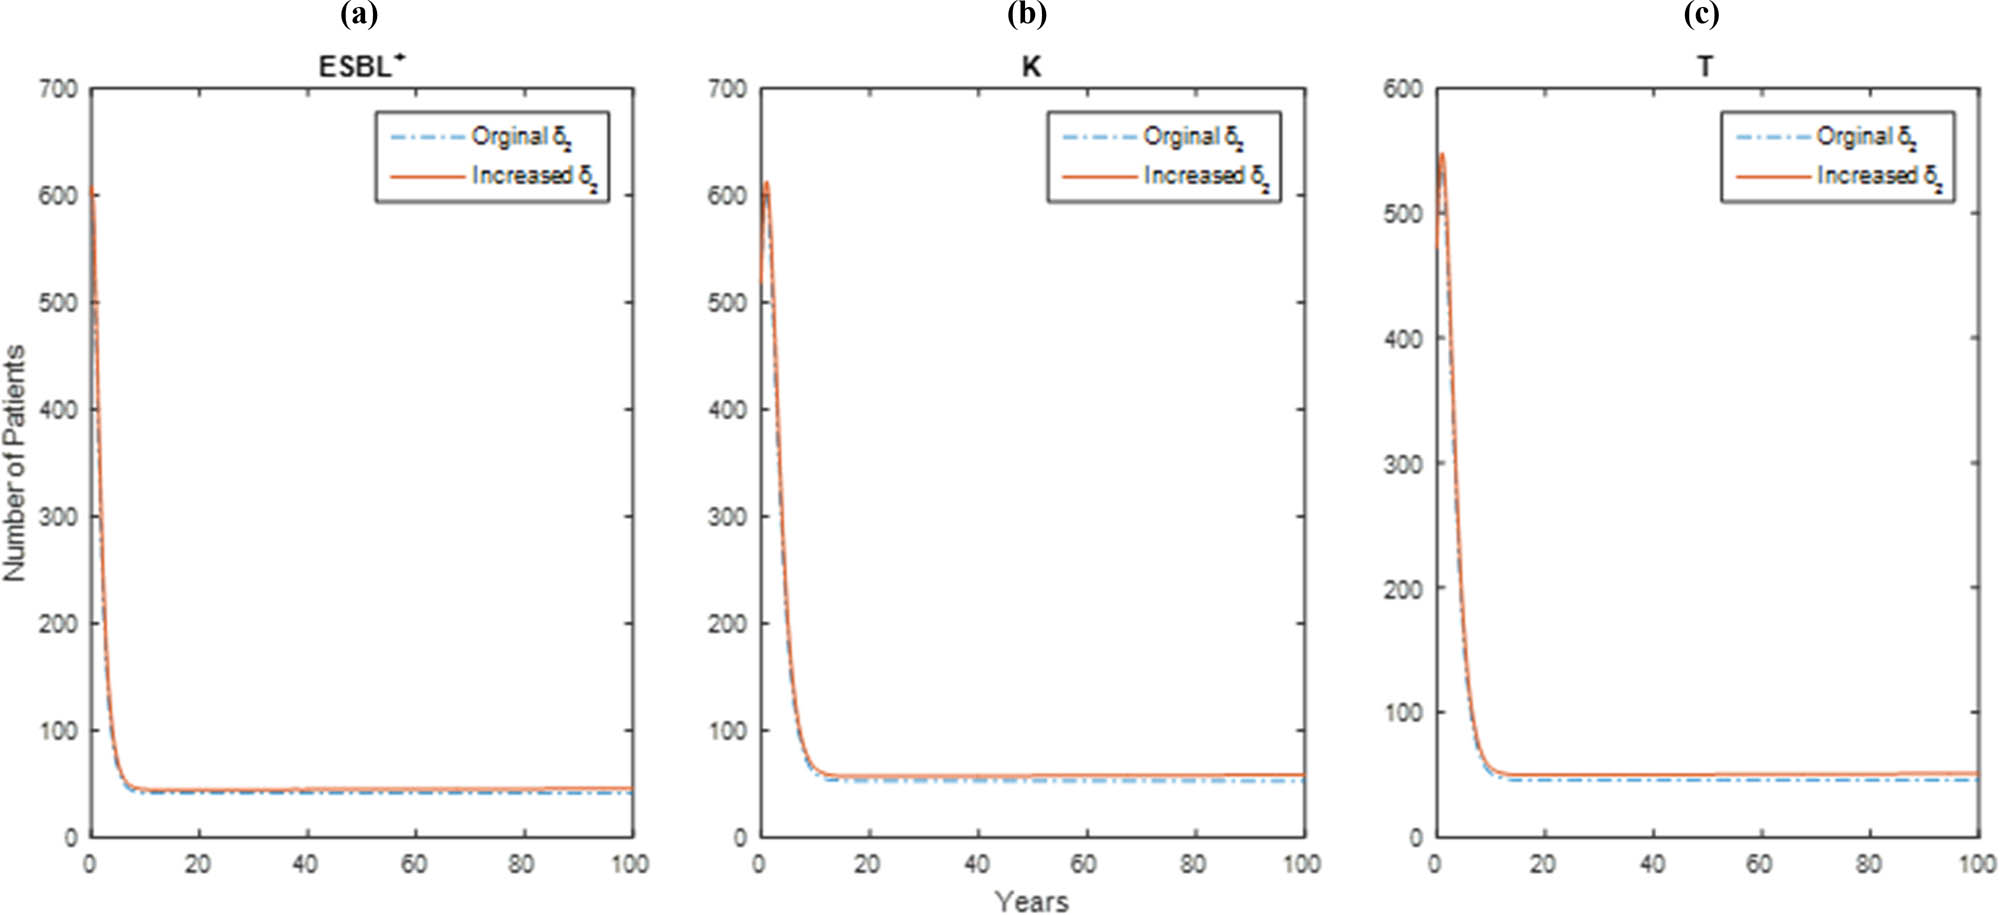
The parameter
The parameter
In the model
In the model,
4 Discussion
This study aimed to investigate the near future possibility of the development of antibiotic resistance to E. coli producing ESBL infections (ESBL+). To carry out this analysis
Moreover, local sensitivity analysis was carried out to evaluate the impact of each parameter used in the model to study the impact on
For this study,
This study was conducted using a total of 17,579 hospital admissions to NEU Hospital in the period between January 2016 and December 2019. Amongst the 17,579 hospital admissions, it was found that 1,871 E. coli infections related to hospital admissions occurred in the study period. According to the analysis of the E. coli infection, 1,270 were found to be
By using the
Furthermore, simulation analysis was performed using the mathematical model and data for NEU hospital for the study period. The dynamics of
From the simulation results, the increasing pattern predicted in the
Another study carried out in 2014 in Cyprus, also emphasized the arising problem of
Furthermore, sensitivity analysis was used to determine which parameters affect the
Impact of the variation in
Impact of the variation in
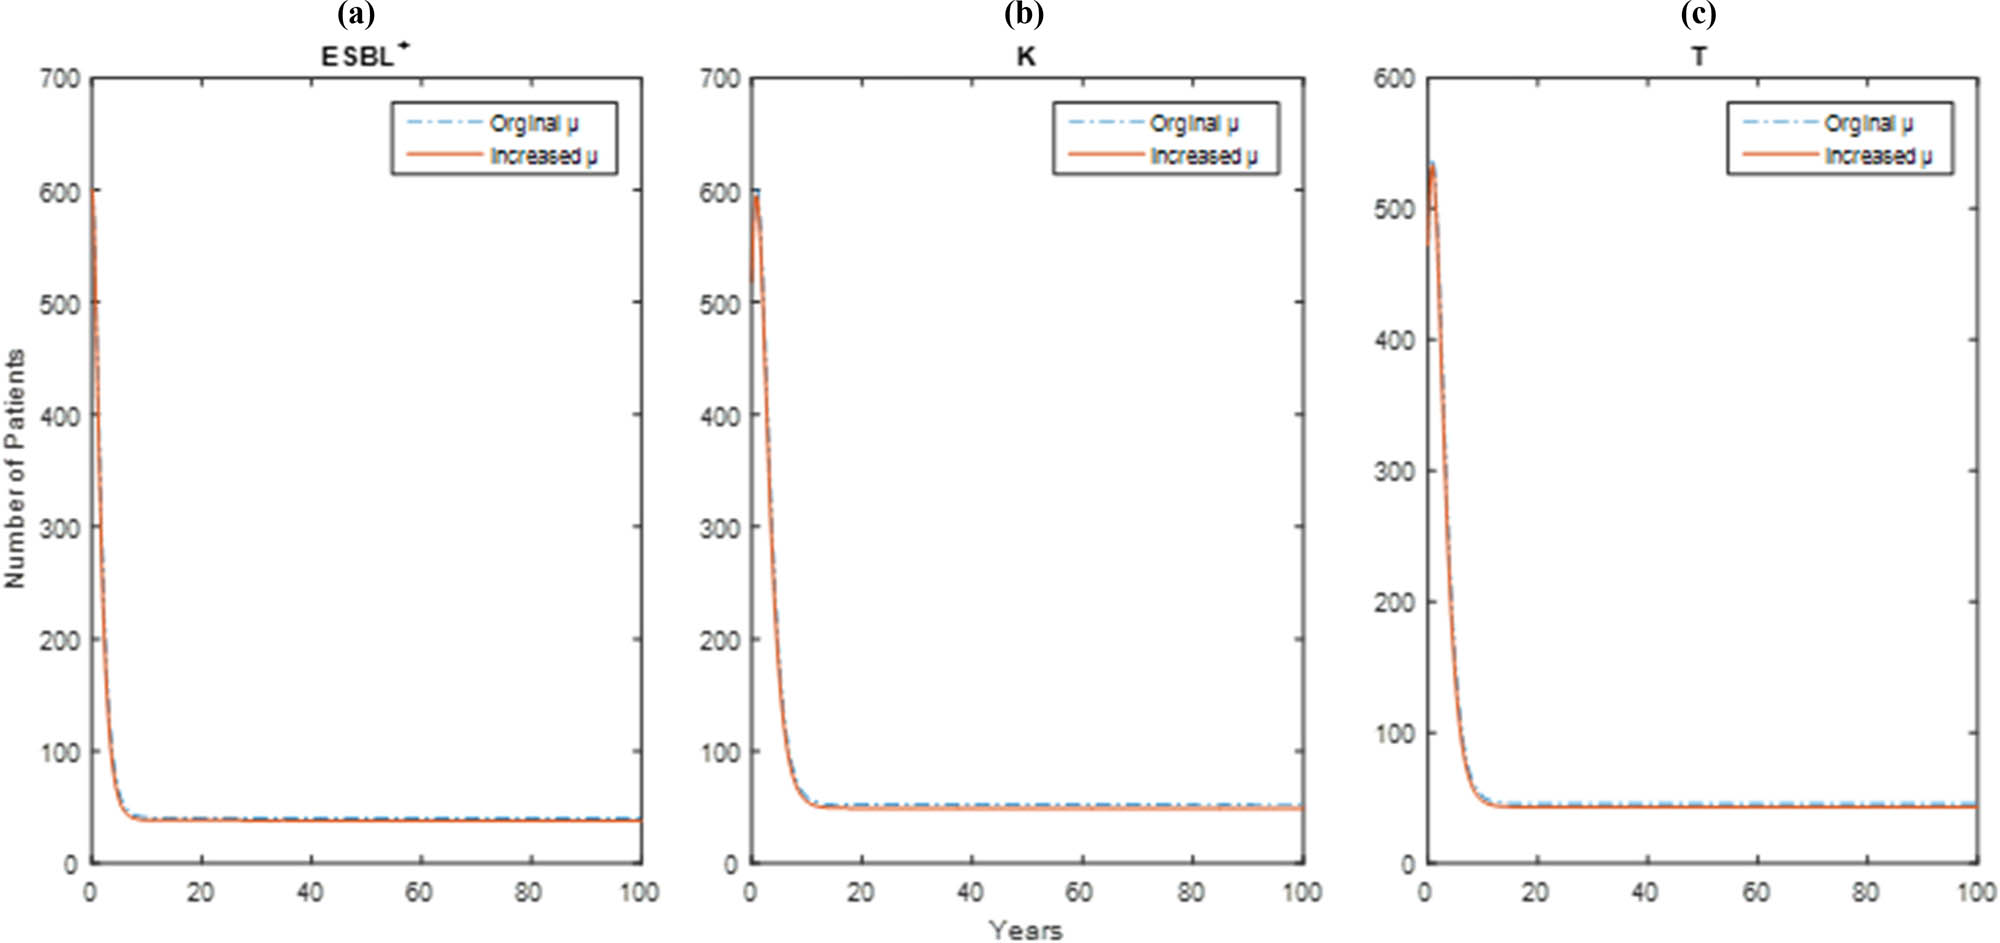
On the other hand, increasing the death rate

Impact of the variation in
Impact of the variation in
Impact of the variation in
Impact of the variation in
5 Conclusion
In conclusion,
The use of over-the-counter antibiotics should be prevented all over the world. Deterrent measures should be strengthened by law to prevent the sale of antibiotics without a prescription. The problems that may be caused by unconscious antibiotic use in the following years should be tried to be shown to people through such studies. In addition, the effective and active functioning of the infection control committee in each hospital and the timely training of all personnel is an important step in slowing down the rate of all infections. This study shows us that when all these are not done, increasing antibiotic resistance will continue to be a major public health problem affecting the whole world.
Selling antibiotics without a prescription may cause bacterial resistance, such as ESBL or carbapenem, in the community. However, it is clear that the spread of resistant bacteria within the hospitals, significantly increases mortality and morbidity rates in patients. For these reasons, effective surveillance studies should be conducted which will provide us with information about these types of infections and give clues for the precautions to be taken in the future. The acceptance and implementation of the concept of “one health” in all countries has an important place among the measures that can be taken. In recent years, the use of mathematical models in health fields gives us the chance to obtain more precise information and to prevent or take early precautions against infections caused by resistant bacteria.
-
Funding information: The authors state no funding involved.
-
Author contributions: All authors have accepted responsibility for the entire content of this manuscript and approved its submission.
-
Conflict of interest: The authors state no conflict of interest.
References
[1] Duman Y, Güçlüer N, Serindağ A, Tekerekoğlu MS. Antimicrobial susceptibility of E. coli strains and presence of extended-spectrum beta lactamase. Fırat Tıp Derg. 2010;15:197–200.Suche in Google Scholar
[2] Akova M. Alarm: there are extended-spectrum beta-lactamases (ESBL)! ANKEM Derg. 2004;18:98–103.Suche in Google Scholar
[3] Taşova Y. Management of gram-negative enteric bacteria infections. ANKEM Derg. 2011;25:34–44.Suche in Google Scholar
[4] Aydemir Ö, Terzi HA, Şahin Özözen E, Köroğlu M, Altındiş M. Piperacillin/Tazobactam in-vitro activity in Escherichia coli and Klebsiella pneumonia strains with extended spectrum beta-lactamase production. OTJHS. 2019;4:118–27. 10.26453/otjhs.487008.Suche in Google Scholar
[5] Yılmaz FF, Ermertcan Ş. Investigation of fluoroquinolones resistance in Escherichia coli strains isolated from urinary tract infections. Turkish J Infect. 2005;19:429–33.Suche in Google Scholar
[6] Moubareck C, Daoud Z, Hakimé NI, Hamzé M, Mangeney N, Matta, et al. Countrywide spread of community- and hospital-acquired extended-spectrum β-Lactamase (CTX-M-15)-producing Enterobacteriaceae in Lebanon. J Clin Microbiol. 2005;43:3309–13. 10.1128/JCM.43.7.3309-3313.2005.Suche in Google Scholar PubMed PubMed Central
[7] Alpay Y, Yavuz MT, Aslan T, Büyükzengin B. Can oral antibiotics be an alternative to carbapenems in the treatment of non-complicated urinary tract infections caused by extended-spectrum beta-lactamase positive Escherichia coli? ANKEM Derg. 2017;31:85–91. 10.5222/ankem.2017.085.Suche in Google Scholar
[8] Bayraktar B, Pelit S, Bulut ME, Aktaş E. Trend in antibiotic resistance of extended-spectrum beta-lactamase-producing Escherichia coli and Klebsiella pneumoniae bloodstream infections. Med Bull Sisli Etfal Hosp. 2019;53:70–5. 10.14744/SEMB.2018.60352.Suche in Google Scholar PubMed PubMed Central
[9] Temiz H, Özbek E, Gür Vural D, Özekinci T. Evaluation of antimicrobial resistance rates of Klebsiella isolates. Türk Mikrobiyol Cem Derg. 2015;45:68–74. 10.5222/TMCD.2015.068.Suche in Google Scholar
[10] Zaman G, Jung IH, Torres DFM, Zeb A. Mathematical modeling and control of infectious diseases. Comput Math Methods Med. 2017;2017:7149154. 10.1155/2017/7149154.Suche in Google Scholar PubMed PubMed Central
[11] Sultanoğlu N. Analysis of HIV epidemic in cyprus using a mathematical model. Erciyes Med J. 2021;44(1):63–7. 10.14744/etd.2021.32855.Suche in Google Scholar
[12] Siettos CI, Russo L. Mathematical modeling of infectious disease dynamics. Virulence. 2013;4:295–306. 10.4161/viru.24041.Suche in Google Scholar PubMed PubMed Central
[13] Sultanoglu N, Gokbulut N, Sanlidag T, Hincal E, Kaymakamzade B, Sayan M. A binomial model approach: Comparing the Ro Values of SARS-CoV-2 rRT-PCR Data from Laboratories across Northern Cyprus. CMES. 2021;128:717–29. 10.32604/cmes.2021.016297.Suche in Google Scholar
[14] Çetin E, Kiremitci B, Yurt İD. Mathematical Epidemiology: Pandemic A/H1N1 Case. Istanb Univ J Sch Bus Adm. 2009;38:197–209.Suche in Google Scholar
[15] Işık N, Kaya A. Mathematical models and herd immunization for spreading and controlling of infectious diseases. Atatürk Üniv Vet Bil Derg. 2020;15:301–7. 10.17094/ataunivbd.715371.Suche in Google Scholar
[16] Fernandez-Martinez JL, Fernandez-Muniz Z, Cernea A, Kloczkowski A. Predictive mathematical models of the short-term and long-term growth of the COVID-19 pandemic. Comput Math Methods Med. 2021;2021:5556433. 10.1155/2021/5556433.Suche in Google Scholar PubMed PubMed Central
[17] van den Driessche P. Reproduction numbers of infectious disease models. Infect Dis Model. 2017;2:288–303. 10.1016/j.idm.2017.06.002.Suche in Google Scholar PubMed PubMed Central
[18] Delamater PL, Street EJ, Leslie TF, Yang YT, Jacobsen KH. The complexity of the basic reproduction number (Ro). Emerg Infect Dis. 2019;25:1–4. 10.3201/eid2501.171901.Suche in Google Scholar PubMed PubMed Central
[19] Baleanu D, Hassan Abadi M, Jajarmi A, Zarghami Vahid K, Nieto JJ. A new comparative study on the general fractional model of COVID-19 with isolation and quarantine effects. Alex Eng J. 2022;61:4779–91. 10.1016/j.aej.2021.10.030.Suche in Google Scholar
[20] Mustapha UT, Qureshi S, Yusuf A, Hincal E. Fractional modeling for the spread of Hookworm infection under Caputo operator. Chaos Solitons Fractals. 2020;137:109878. 10.1016/j.chaos.2020.109878.Suche in Google Scholar
[21] Qureshi S, Jan R. Modeling of measles epidemic with optimized fractional order under Caputo differential operator. Chaos Solitons Fractals. 2021;145:110766. 10.1016/j.chaos.2021.110766.Suche in Google Scholar
[22] Jajarmi A, Baleanu D, Zarghami Vahid K, Mobayen S. A general fractional formulation and tracking control for immunogenic tumor dynamics. Math Methods Appl Sci. 2022;45:667–80. 10.1002/mma.7804.Suche in Google Scholar
[23] Bagkur C, Guler E, Kaymakamzade B, Hincal E, Suer K. Near future perspective of ESBL-Producing Klebsiella pneumoniae strains using mathematical modeling. CMES. 2022;130:111–32. 10.32604/cmes.2022.016957.Suche in Google Scholar
[24] TRNC State Planning Organization. Turkish Republic of Northern Cyprus Statistical Year Book 2018 Prime Ministry State Planning Organization Statistics and Research Department; 2018. http://www.devplan.org/Eco-sos/Book/SEG-2018.pdf (Accessed: 14 December 2021).Suche in Google Scholar
[25] Cantas L, Suer K, Guler E, Imir T. High emergence of ESBL-producing E. coli Cystitis: time to get smarter in Cyprus. Front Microbiol. 2016;6:1446. 10.3389/fmicb.2015.01446.Suche in Google Scholar PubMed PubMed Central
© 2022 Ulas Hurdoganoglu et al., published by De Gruyter
This work is licensed under the Creative Commons Attribution 4.0 International License.
Artikel in diesem Heft
- Regular Articles
- Test influence of screen thickness on double-N six-light-screen sky screen target
- Analysis on the speed properties of the shock wave in light curtain
- Abundant accurate analytical and semi-analytical solutions of the positive Gardner–Kadomtsev–Petviashvili equation
- Measured distribution of cloud chamber tracks from radioactive decay: A new empirical approach to investigating the quantum measurement problem
- Nuclear radiation detection based on the convolutional neural network under public surveillance scenarios
- Effect of process parameters on density and mechanical behaviour of a selective laser melted 17-4PH stainless steel alloy
- Performance evaluation of self-mixing interferometer with the ceramic type piezoelectric accelerometers
- Effect of geometry error on the non-Newtonian flow in the ceramic microchannel molded by SLA
- Numerical investigation of ozone decomposition by self-excited oscillation cavitation jet
- Modeling electrostatic potential in FDSOI MOSFETS: An approach based on homotopy perturbations
- Modeling analysis of microenvironment of 3D cell mechanics based on machine vision
- Numerical solution for two-dimensional partial differential equations using SM’s method
- Multiple velocity composition in the standard synchronization
- Electroosmotic flow for Eyring fluid with Navier slip boundary condition under high zeta potential in a parallel microchannel
- Soliton solutions of Calogero–Degasperis–Fokas dynamical equation via modified mathematical methods
- Performance evaluation of a high-performance offshore cementing wastes accelerating agent
- Sapphire irradiation by phosphorus as an approach to improve its optical properties
- A physical model for calculating cementing quality based on the XGboost algorithm
- Experimental investigation and numerical analysis of stress concentration distribution at the typical slots for stiffeners
- An analytical model for solute transport from blood to tissue
- Finite-size effects in one-dimensional Bose–Einstein condensation of photons
- Drying kinetics of Pleurotus eryngii slices during hot air drying
- Computer-aided measurement technology for Cu2ZnSnS4 thin-film solar cell characteristics
- QCD phase diagram in a finite volume in the PNJL model
- Study on abundant analytical solutions of the new coupled Konno–Oono equation in the magnetic field
- Experimental analysis of a laser beam propagating in angular turbulence
- Numerical investigation of heat transfer in the nanofluids under the impact of length and radius of carbon nanotubes
- Multiple rogue wave solutions of a generalized (3+1)-dimensional variable-coefficient Kadomtsev--Petviashvili equation
- Optical properties and thermal stability of the H+-implanted Dy3+/Tm3+-codoped GeS2–Ga2S3–PbI2 chalcohalide glass waveguide
- Nonlinear dynamics for different nonautonomous wave structure solutions
- Numerical analysis of bioconvection-MHD flow of Williamson nanofluid with gyrotactic microbes and thermal radiation: New iterative method
- Modeling extreme value data with an upside down bathtub-shaped failure rate model
- Abundant optical soliton structures to the Fokas system arising in monomode optical fibers
- Analysis of the partially ionized kerosene oil-based ternary nanofluid flow over a convectively heated rotating surface
- Multiple-scale analysis of the parametric-driven sine-Gordon equation with phase shifts
- Magnetofluid unsteady electroosmotic flow of Jeffrey fluid at high zeta potential in parallel microchannels
- Effect of plasma-activated water on microbial quality and physicochemical properties of fresh beef
- The finite element modeling of the impacting process of hard particles on pump components
- Analysis of respiratory mechanics models with different kernels
- Extended warranty decision model of failure dependence wind turbine system based on cost-effectiveness analysis
- Breather wave and double-periodic soliton solutions for a (2+1)-dimensional generalized Hirota–Satsuma–Ito equation
- First-principle calculation of electronic structure and optical properties of (P, Ga, P–Ga) doped graphene
- Numerical simulation of nanofluid flow between two parallel disks using 3-stage Lobatto III-A formula
- Optimization method for detection a flying bullet
- Angle error control model of laser profilometer contact measurement
- Numerical study on flue gas–liquid flow with side-entering mixing
- Travelling waves solutions of the KP equation in weakly dispersive media
- Characterization of damage morphology of structural SiO2 film induced by nanosecond pulsed laser
- A study of generalized hypergeometric Matrix functions via two-parameter Mittag–Leffler matrix function
- Study of the length and influencing factors of air plasma ignition time
- Analysis of parametric effects in the wave profile of the variant Boussinesq equation through two analytical approaches
- The nonlinear vibration and dispersive wave systems with extended homoclinic breather wave solutions
- Generalized notion of integral inequalities of variables
- The seasonal variation in the polarization (Ex/Ey) of the characteristic wave in ionosphere plasma
- Impact of COVID 19 on the demand for an inventory model under preservation technology and advance payment facility
- Approximate solution of linear integral equations by Taylor ordering method: Applied mathematical approach
- Exploring the new optical solitons to the time-fractional integrable generalized (2+1)-dimensional nonlinear Schrödinger system via three different methods
- Irreversibility analysis in time-dependent Darcy–Forchheimer flow of viscous fluid with diffusion-thermo and thermo-diffusion effects
- Double diffusion in a combined cavity occupied by a nanofluid and heterogeneous porous media
- NTIM solution of the fractional order parabolic partial differential equations
- Jointly Rayleigh lifetime products in the presence of competing risks model
- Abundant exact solutions of higher-order dispersion variable coefficient KdV equation
- Laser cutting tobacco slice experiment: Effects of cutting power and cutting speed
- Performance evaluation of common-aperture visible and long-wave infrared imaging system based on a comprehensive resolution
- Diesel engine small-sample transfer learning fault diagnosis algorithm based on STFT time–frequency image and hyperparameter autonomous optimization deep convolutional network improved by PSO–GWO–BPNN surrogate model
- Analyses of electrokinetic energy conversion for periodic electromagnetohydrodynamic (EMHD) nanofluid through the rectangular microchannel under the Hall effects
- Propagation properties of cosh-Airy beams in an inhomogeneous medium with Gaussian PT-symmetric potentials
- Dynamics investigation on a Kadomtsev–Petviashvili equation with variable coefficients
- Study on fine characterization and reconstruction modeling of porous media based on spatially-resolved nuclear magnetic resonance technology
- Optimal block replacement policy for two-dimensional products considering imperfect maintenance with improved Salp swarm algorithm
- A hybrid forecasting model based on the group method of data handling and wavelet decomposition for monthly rivers streamflow data sets
- Hybrid pencil beam model based on photon characteristic line algorithm for lung radiotherapy in small fields
- Surface waves on a coated incompressible elastic half-space
- Radiation dose measurement on bone scintigraphy and planning clinical management
- Lie symmetry analysis for generalized short pulse equation
- Spectroscopic characteristics and dissociation of nitrogen trifluoride under external electric fields: Theoretical study
- Cross electromagnetic nanofluid flow examination with infinite shear rate viscosity and melting heat through Skan-Falkner wedge
- Convection heat–mass transfer of generalized Maxwell fluid with radiation effect, exponential heating, and chemical reaction using fractional Caputo–Fabrizio derivatives
- Weak nonlinear analysis of nanofluid convection with g-jitter using the Ginzburg--Landau model
- Strip waveguides in Yb3+-doped silicate glass formed by combination of He+ ion implantation and precise ultrashort pulse laser ablation
- Best selected forecasting models for COVID-19 pandemic
- Research on attenuation motion test at oblique incidence based on double-N six-light-screen system
- Review Articles
- Progress in epitaxial growth of stanene
- Review and validation of photovoltaic solar simulation tools/software based on case study
- Brief Report
- The Debye–Scherrer technique – rapid detection for applications
- Rapid Communication
- Radial oscillations of an electron in a Coulomb attracting field
- Special Issue on Novel Numerical and Analytical Techniques for Fractional Nonlinear Schrodinger Type - Part II
- The exact solutions of the stochastic fractional-space Allen–Cahn equation
- Propagation of some new traveling wave patterns of the double dispersive equation
- A new modified technique to study the dynamics of fractional hyperbolic-telegraph equations
- An orthotropic thermo-viscoelastic infinite medium with a cylindrical cavity of temperature dependent properties via MGT thermoelasticity
- Modeling of hepatitis B epidemic model with fractional operator
- Special Issue on Transport phenomena and thermal analysis in micro/nano-scale structure surfaces - Part III
- Investigation of effective thermal conductivity of SiC foam ceramics with various pore densities
- Nonlocal magneto-thermoelastic infinite half-space due to a periodically varying heat flow under Caputo–Fabrizio fractional derivative heat equation
- The flow and heat transfer characteristics of DPF porous media with different structures based on LBM
- Homotopy analysis method with application to thin-film flow of couple stress fluid through a vertical cylinder
- Special Issue on Advanced Topics on the Modelling and Assessment of Complicated Physical Phenomena - Part II
- Asymptotic analysis of hepatitis B epidemic model using Caputo Fabrizio fractional operator
- Influence of chemical reaction on MHD Newtonian fluid flow on vertical plate in porous medium in conjunction with thermal radiation
- Structure of analytical ion-acoustic solitary wave solutions for the dynamical system of nonlinear wave propagation
- Evaluation of ESBL resistance dynamics in Escherichia coli isolates by mathematical modeling
- On theoretical analysis of nonlinear fractional order partial Benney equations under nonsingular kernel
- The solutions of nonlinear fractional partial differential equations by using a novel technique
- Modelling and graphing the Wi-Fi wave field using the shape function
- Generalized invexity and duality in multiobjective variational problems involving non-singular fractional derivative
- Impact of the convergent geometric profile on boundary layer separation in the supersonic over-expanded nozzle
- Variable stepsize construction of a two-step optimized hybrid block method with relative stability
- Thermal transport with nanoparticles of fractional Oldroyd-B fluid under the effects of magnetic field, radiations, and viscous dissipation: Entropy generation; via finite difference method
- Special Issue on Advanced Energy Materials - Part I
- Voltage regulation and power-saving method of asynchronous motor based on fuzzy control theory
- The structure design of mobile charging piles
- Analysis and modeling of pitaya slices in a heat pump drying system
- Design of pulse laser high-precision ranging algorithm under low signal-to-noise ratio
- Special Issue on Geological Modeling and Geospatial Data Analysis
- Determination of luminescent characteristics of organometallic complex in land and coal mining
- InSAR terrain mapping error sources based on satellite interferometry