Characterisation of carbonate lake sediments as a potential filler for polymer composites
-
Grzegorz Borkowski


Abstract
The purpose of the study was to determine whether lake sediments could be a potential raw material for the plastics industry. The examined samples were obtained in a complex process of sediment collection from Lake Swarzędzkie located in the region of Wielkopolska, Poland, followed by granulometric analysis by sieving and quartz grain shape analysis, with preparation of geotechnical sheets. The works involved the examination of physico-chemical characteristics of carbonate lake sediments and the analysis of impact of the sediments’ depth extraction on their chemical composition and physico-chemical properties. The lake sediment consists mainly of calcium carbonate (CaCO3) and can be a potential filler for plastics. Tests were carried out to determine chemical composition of the sediments and their thermal stability. The thermogravimetric analysis showed the three stages of the thermal decomposition. Sediments in deeper layers of the lake are characterised by the presence of not only CaCO3 and silica, but also other chemical compounds, including aluminosilicates. In addition, as the depth increases, the average size of sediment particles changes, with the main fraction particle size being the smallest for the material from the 6–12 m depth. Additionally, carbon content systematically decreases with increasing depth.
1 Introduction
The global market of polymeric materials is a reflection of the economic situation of countries. The size and demand of the economy for polymeric materials and their annual consumption per capita are the parameters for assessing the level of development of a country, and thus the standard of living of an average citizen. The increase in consumption and the demand for polymer plastics results in the growing amount of their wastes, which pollute natural environment. Both prevention and reuse (closed-loop economy) play an important role in waste management. Each recovery process should assume minimal energy consumption for initial preparation of the waste material and final processing, the largest possible scale of the processing of waste raw material, full use of the obtained products as chemical raw materials or energy carriers, and eliminating or limiting the use of additional substances [1].
Currently, there is a trend in the polymer market regarding the use of natural fillers, which at the same time can improve some physicochemical properties of polymers (e.g. higher mechanical strength, thermal stability, etc.), while reducing production costs. Due to the limited resources of crude oil on which polymers are based, many research groups work on biodegradable materials that could replace partially some synthetic materials [2]. In the literature, there are known examples for testing natural materials as potential fillers, e.g. isotactic polypropylene composites filled with sedimentary hybrid natural filler – Opoka rock [3]. Examples of fillers obtained from various parts of plants are also known as bark, pulp, trifles, stems, and cereal straw [4]. Another example of a mineral filler is calcium carbonate (CaCO3), which is 5% of the Earth’s crust. Global demand on CaCO3 is associated with its application in paper coating or use in the plastics industry. The use of CaCO3 depends on its properties, i.e. specific surface area, morphology, and particle size. Of the three crystalline varieties (calcite, aragonite, and vaterite), calcite is the most thermodynamically stable form for any applications [5]. Leong et al. in their work presented the influence of carbonate fillers (CaCO3) and talc on the degradation of polypropylene composites in the natural environment [6]. Other articles describe the effect of carbonate fillers (CaCO3) in polypropylene components used in cars, which can improve mechanical properties [5] and wear resistance [7]. The works of Gao et al. [8,9] show that CaCO3 nanofillers can be used to improve polyurethane strength. Microscopic CaCO3 filler particles improve rheological properties and thermal stability of thermoplastic polyurethane, also contributing to the cost reduction of the composite [10]. Basilia et al. [11] studied the mechanical properties of poly(vinyl chloride) with the addition of micro- and nanoparticles of CaCO3. The improved properties of the composites included increased tensile strength and higher Shore’s hardness. Avella et al. [12] showed that CaCO3 nanoparticles (calcite and aragonite) increase the temperature of nylon 6 glass transition.
In a previous work, we introduced preliminary polylactide composite case study (mechanical and structural properties). The obtained polylactide/carbonate lake sediment composites were characterised by higher mass flow rate and higher surface hydrophobicity in comparison to unmodified polylactide [13]. The review paper [14] also presents the influence of carbonate compounds (CaCO3) on the properties of polymer composites.
The use of natural fillers in polymer processing is a part of green, low-emission, and sustainable industry and is associated with a so-called “circular economy.” The closed-loop economy, otherwise known as the circular economy, is an economic model in which resources circulate in a closed system. The closed loop of circulation reduces waste, extends the life cycle of products, and reduces greenhouse gas emissions [15]. In this work, we describe the use of lake sediments in polymers, which is in line with the principles of the closed-loop economy, due to the fact that it is a widely available, environmentally friendly material, does not use large amounts of energy for preparation, and is characterised by reduced pressure on the environment.
Lake sediments contain two mineral ingredients (non-carbonate and carbonate) in various proportions, and an organic ingredient. The non-carbonate mineral component includes terrigenous elements and those of biogenic origin. The organic component contains elements of plant and animal origin, products of their metabolism and decomposition, as well as those formed during diagenesis [16]. Mineral matter in the lake comes from chemical denudation products delivered with ground and surface waters, and mechanical denudation products, mainly derived from erosion processes [17]. In lakes of the temperate zone, natural deposit processes dominate at the present time, which according to Borówka [18] include the following:
Terrigenous sedimentation of allochthonous mineral matter supplied by water and air;
Biogenic sedimentation, including shells of molluscs and diatoms;
Chemogenic sedimentation of crystalline and amorphous substances (CaCO3, Fe, Al hydroxides, Fe sulphides, and Fe phosphates);
Adsorption of ions dissolved in water by substances deposited at the bottom (clay minerals, diatom shells, and amorphous organic matter).
According to Młynarczyk and Nowaczyk [19], at the end of the Weichselian glaciation, the ice tunnel ceiling collapsed, filling the troughs eroded by meltwater and the moraine material it carried. The ice which remained in depressions was covered with a layer of clastic deposits that slowed down its melting process and consequently contributed to its preservation. After the climate warmed up, blocks of dead ice were melting slowly, which allowed plant life to develop on them; when it died away, it made up a layer of turf or detritus gyttja with thickness from several millimetres to several centimetres. This layer is often found at the bottom of glacial troughs in Poland [20,21,22]. One of the interesting water bodies is Lake Swarzędzkie, which is situated in western Poland, in the Wielkopolsko-Kujawskie Lake District. It is a shallow, eutrophicated water body with the area of approx. 0.94 km2, with the river Cybina flowing through it. The predominant sediment in Lake Swarzędzkie is calcareous gyttja with varying carbonate content. This sediment fills most of the lake basin. In the lake sediments, the predominant component is gyttja with a CaCO3 content of more than 80%, called lake chalk, lying in the southern part of the water body under a 2–3 m turf layer. The colour and consistency of the gyttja and lake chalk changes with the depth. The deeper the sediment, the darker its colour, and the lower its water content. In lakes, the surface layer of sediment is usually hydrated at about 80–95%. Hydration decreases with depth due to sediment compaction and reaches 65% at the depth of 5 m [23]. The bed of the lake basin, in the collected samples of the sediment cores, is made up from fine-grained sand with addition of fine dust.
Sedimentation in the water body started approx. 12,000 years ago in the Older Dryas. The sediment sample collected at the depth of 13.5 m was dated with the C-14 method for 11840 ± 60 BP. This is a value corresponding to the beginning of operation of the lakes in the area of the Wielkopolsko-Kujawskie Lake District that have already been described [20,24,25,26,27]. The beginning of the deposition of biogenic sediments in glacial troughs and kettle holes is synchronised with the beginning of melting of buried ice blocks [20]. Another example of a glacial lake is Lake Lęborskie, which began to form around 2,000 years ago. Sediments filling the glacial Lake Lęborskie, the so-called “clays of Lębork” [28,29,30], are an example of a sedimental record of a vast glaciated lake formed at a verge of the ice sheet. The composition of these sediments is typical for mudrocks and characterised by little vertical and lateral diversity, which suggests a steady flow of sediments from the beginning of the water body’s formation. The chemical composition of Lake Lęborskie is considerably less diverse and has lower levels of specific elements than the sediments deposited at the bottom of lakes located in the region of Wielkopolska [31].
Sedimentation rates may indicate the intensity of sediment accumulation in different areas of the lake. For Lake Swarzędzkie, the sedimentation rate was calculated arithmetically, dividing the estimated age of dated sediments by their thickness. The results thus calculated were compared with the sedimentation rate of the Kórnicko-Zaniemyska Trough [25] and Lake Zbąszyńskie [27] and are presented in Table 1.
Rate of accumulation of sediments in Lake Swarzędzkie, Lake Zbąszyńskie, and in the lakes of the Kórnicko-Zaniemyska Trough
| Period | Accumulation rate (mm·year−1) | ||
|---|---|---|---|
| Lake Swarzędzkie | Lake Zbąszyńskie | Lakes of the Kórnicko-Zaniemyska trough | |
| Allerød | 1.3 | 1.7 | 1.2 |
| Younger Dryas | |||
| Holocene | |||
Calculations of the sedimentation rate indicate that the average rate of accumulation of the bottom material in Lake Swarzędzkie was 1.3 mm·year−1, which is the result comparable to data from other lakes in the Wielkopolsko-Kujawskie Lake District.
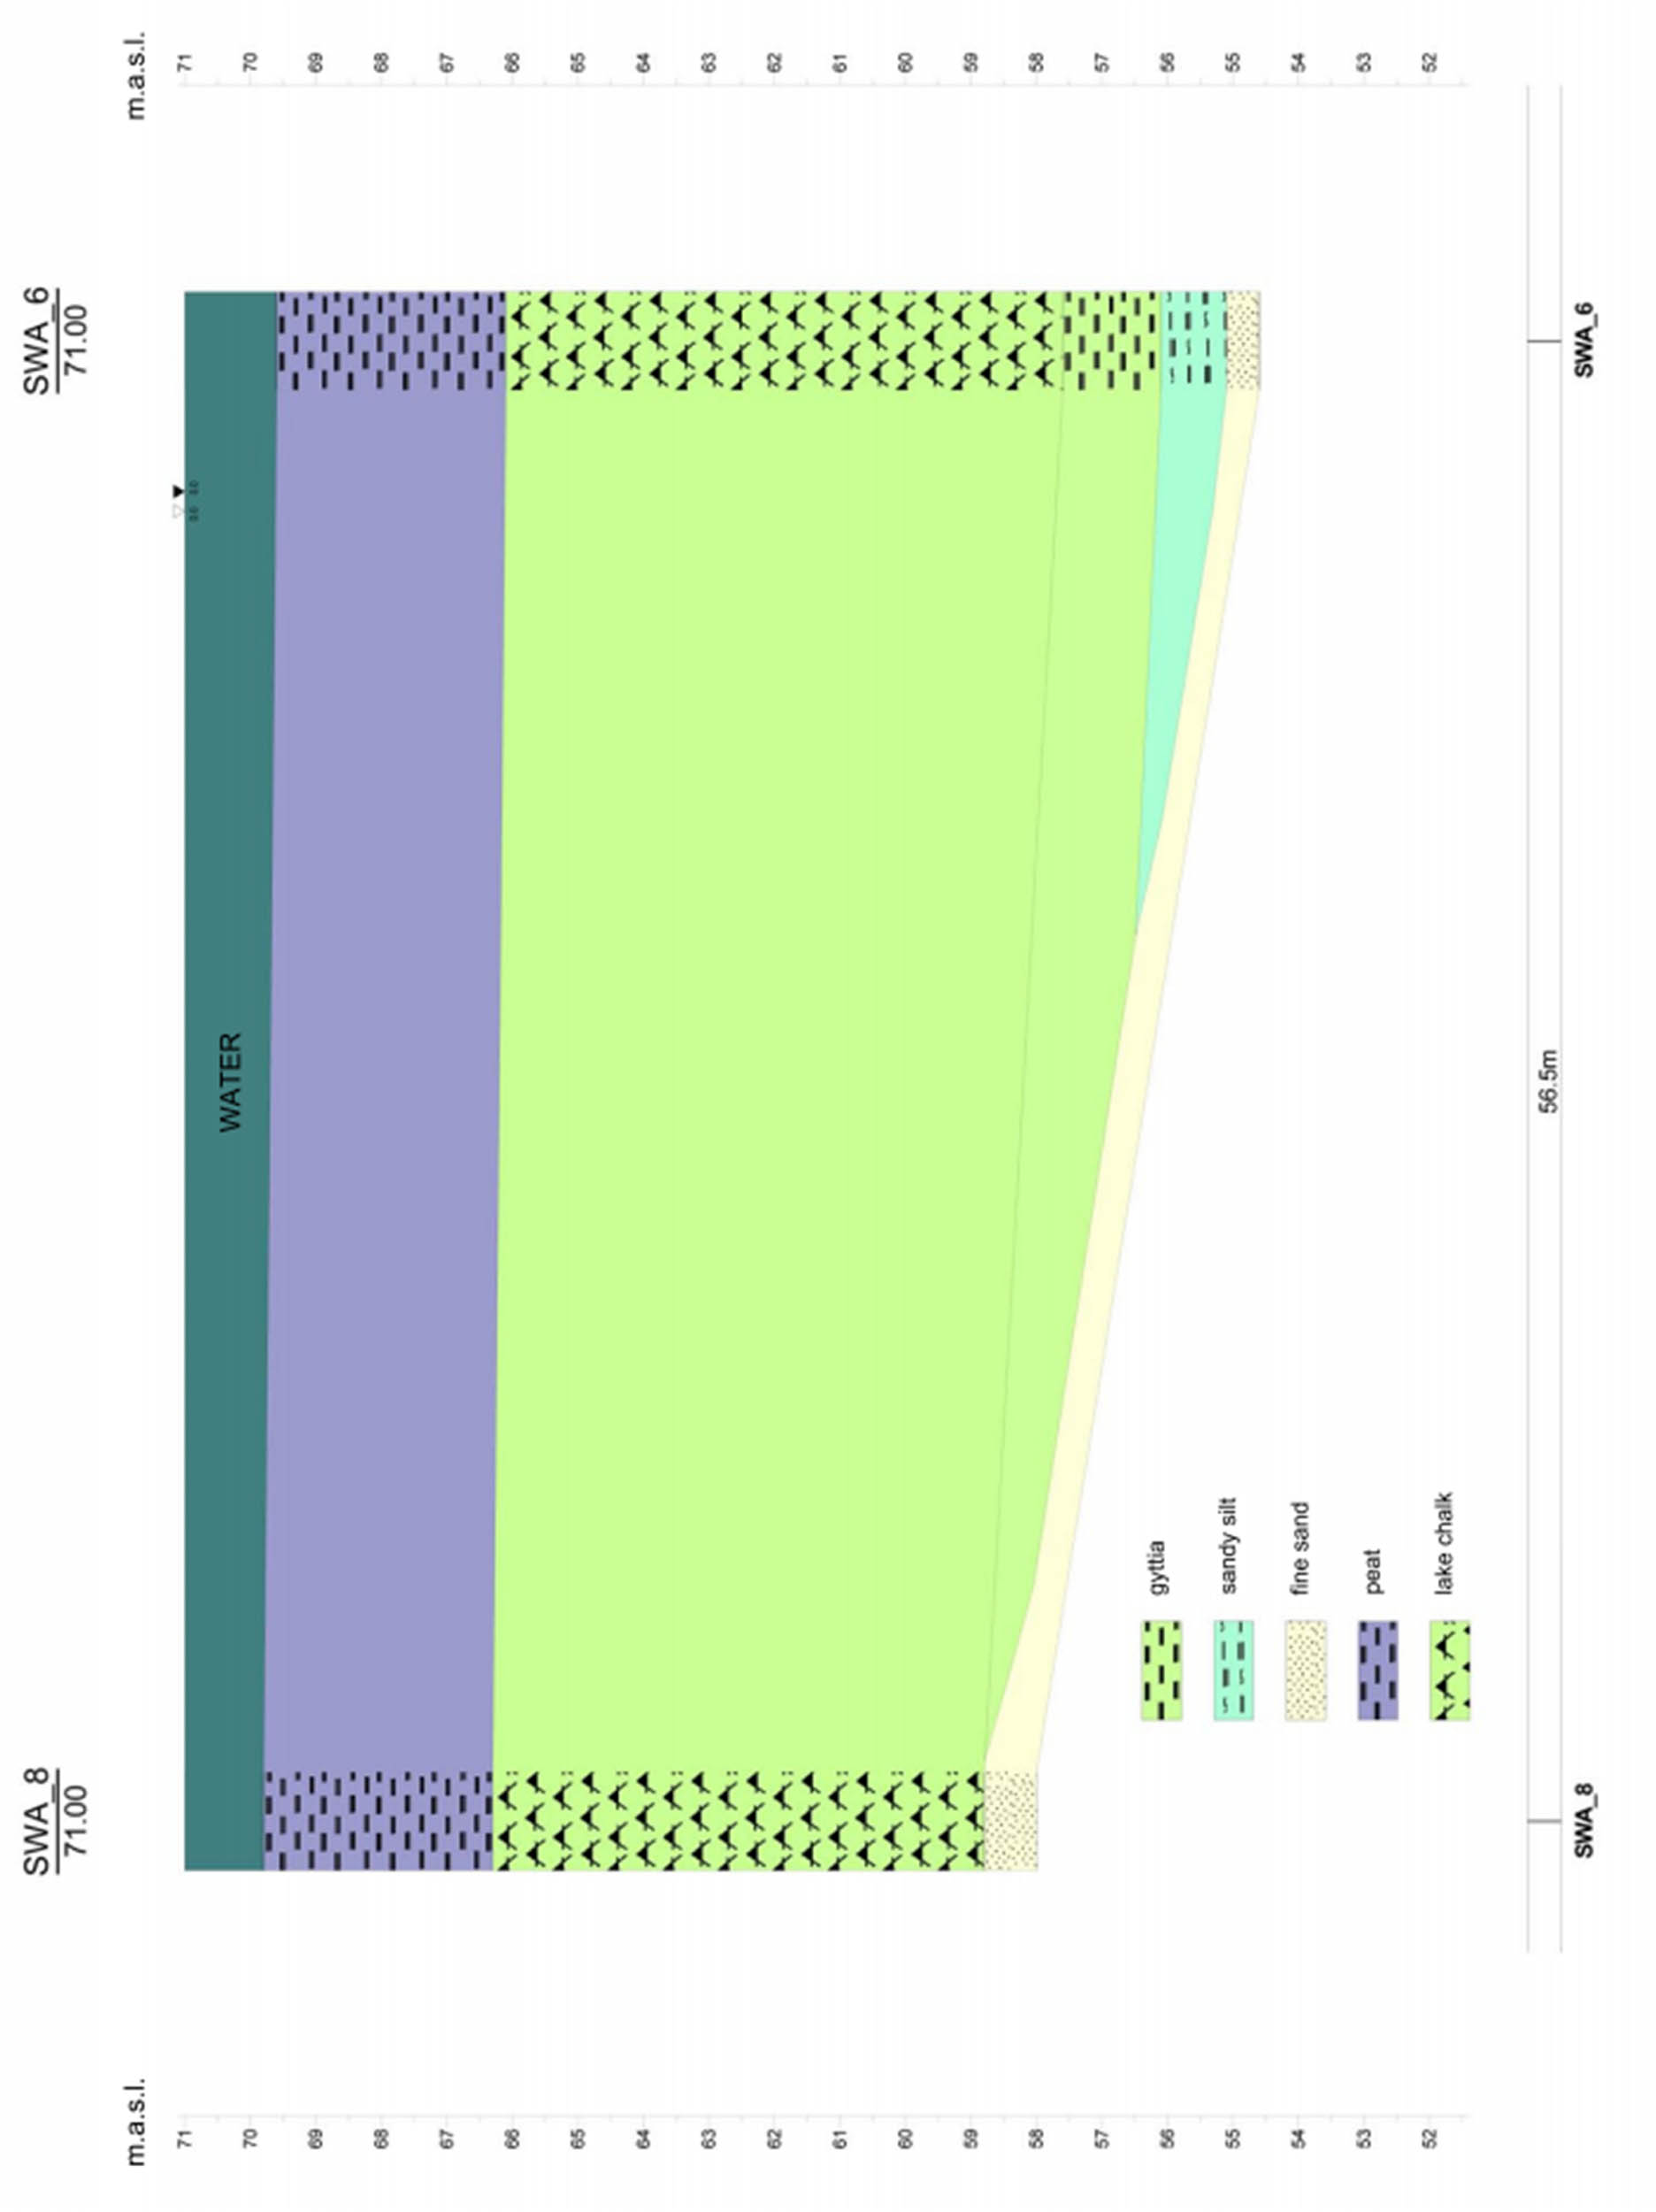
Bottom sediments “constitute a complex of physical agents, they are a sphere forming biotopes for the various components existing there and are an archive of knowledge about the ecological and geological background of the water body and its surroundings” [32]. The spatial differentiation and thickness of bottom sediments depend on the nature of the flow, the time of operation of the lake and the bottom shape. The positive balance of energy and matter in the lake entails accumulation of organic matter, which is an essential component of sediments. Lake Swarzędzkie is a drainage lake fed by autochthonous matter from the river Cybina. The basin shape elongated along the meridian, with a narrowing in the south and an island in the north, and the flow of the river Cybina, create diverse sedimentation conditions in the lake. Due to the relatively large area (94 ha), the water body is exposed to waves caused mainly by western winds. These factors cause the suspended substances flowing into the lake to accumulate there as the water that carries them loses its kinetic energy. Studies on spatial differentiation and thickness of bottom sediments in Lake Swarzędzkie showed differences in the amount and type of material deposited at the bottom. Sediments are the thickest in the central and southern parts of the lake, from 3 to more than 15 m. Based on eight boreholes in the bottom of the lake located as in Figure 1, geotechnical hole sheets were developed to document the depth of sand formations that were drilled under organogenic sediments. Sand sediments provide information on the shape of the Lake Swarzędzkie basin before the beginning of the biogenic sedimentation, i.e. on the layout of the “primary” bottom. It shows that the water body had depths of up to 20 m and the process of sedimentation was the most intense in this area. The depths in the entire water body differed significantly from the present, in the northern part, they were greater by 3–12 m, while in the southern part, which is only 1.5–2.5 m deep today, they were greater by approx. 15 m. This is evidence of different sedimentation rates in the lake, on the one hand, and of huge volumes of sediments that filled the original lake basin, on the other hand. Their volume exceeds the volume of water in the current water body (Figure 1).
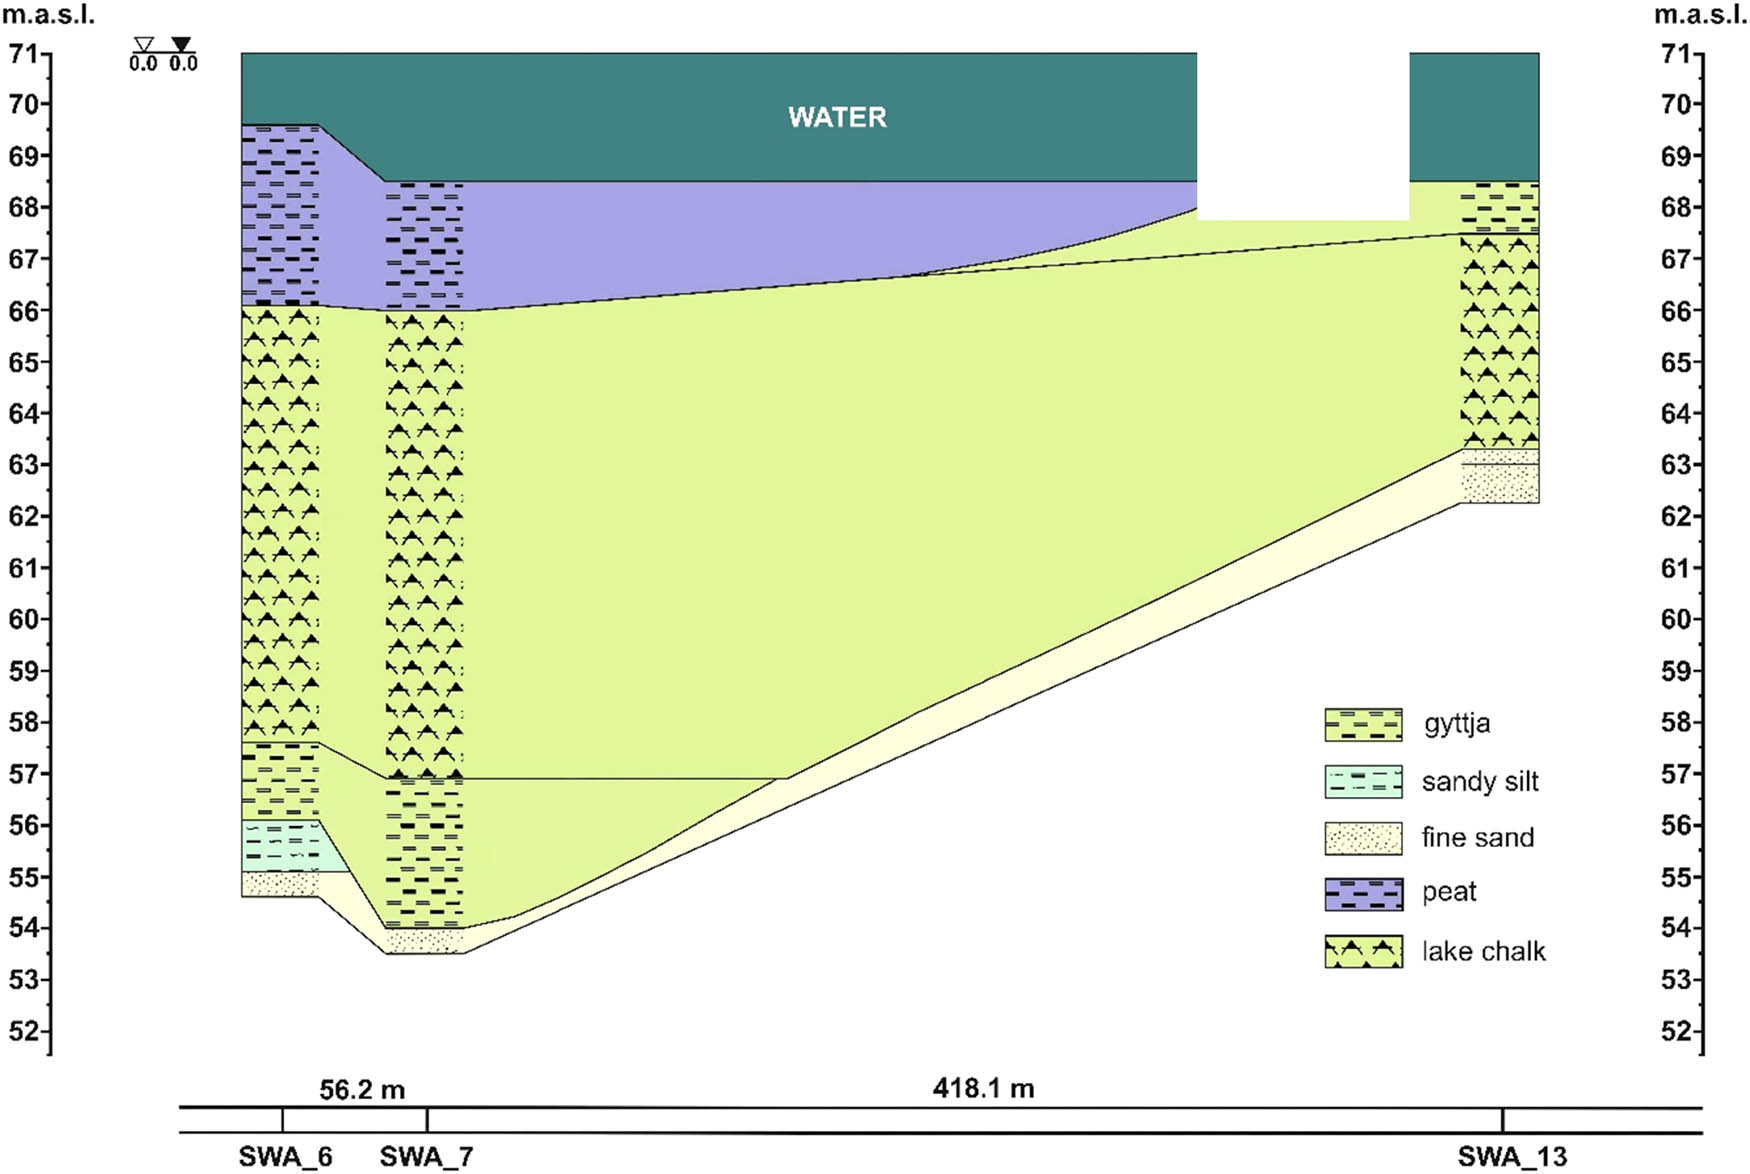
Geological cross-section through the sediments of Lake Swarzędzkie between boreholes no. 6, 7, and 13.
In this work, we present an analysis of impact of the sediments’ depth on their chemical composition, as well as on physicochemical properties such as thermal stability, size of the sediments’ grains, particle size distribution, and pore size distribution. The aim of the study was to determine whether lake sediments could be a potential raw material for the plastics industry. The use of lake sediment as polymer fillers can potentially reduce production costs, affect the physicochemical properties of composites, and is in line with the principles of the closed-loop economy.
2 Materials and methods
2.1 Field study
Field studies were carried out in September 2017 in the area of Lake Swarzędzkie. To identify the thickness and the spatial differentiation of the sediments in Lake Swarzędzkie, eight boreholes were made in the bottom of the water body up to the depth of 15 m below the ground level, with the total length of 65.5 linear metres. The sediments were collected in 1 and 0.5 m cores, with an Instorf drill and a specialised boat for drilling in the lake bottom.
During the field measurements, the depth of the bottom was recorded together with the geographical coordinates in the entire water body along the designated profiles. The resulting measurement data were post-processed in ReefMaster 2.0 licensed for Adam Mickiewicz University in Poznań.
Based on the hydroacoustic survey data along the individual measurement profiles and the generated orthophotographs, a vector bathymetric plan was developed with 0.25 m isobaths covering Lake Swarzędzkie from the inlet to the outlet of river Cybina. Bathymetric plan (Figure 2) was generated in ReefMaster2 by triangulation.

Bathymetric plan of Lake Swarzędzkie with highlighted borehole location (red).
2.2 Preparation of samples
A 14 m core with geographical coordinates of 52°24′50.5″N and 17°04′14.8″E, representing the thicker area of the water body, consisting of turf and carbonate sediment, was selected for further examination. Core no. 7 was divided into sections every 1 or 0.5 m. A total of 16 samples determined according to the sampling depth were obtained for further measurements. The sample marked 0–1 m was taken from the layer closest to the surface of Lake Swarzędzkie.
The collected, divided sediments were prepared for further examination in three different ways. The samples for the thermogravimetric analysis (TGA) and elemental analysis were prepared in their original form; the samples for the DLS, Fourier transform-infrared (FT-IR), and SEM/EDS analysis were pre-dried at 60°C for 24 h, and the samples for X-ray analysis and for adsorption–desorption of nitrogen were calcinated in a muffle oven at 500°C for 1.5 h in the air atmosphere.
Some examinations, i.e. identification of thickness and spatial differentiation of sediments, were carried out using the whole undivided core, while granulometric and graniformametric analysis, together with the determination of the quartz grains rounding ratio were carried out in the sample of the bottom part of the core where quartz grains were present.
2.3 Characterisation methods
The size of the sediment grains was measured with Mastersizer 3000 (Malvern Instruments Ltd, Malvern, UK). The measurements were made for the samples in water suspension (Hydro EV attachment). The parameters of measurements were stirrer resolution of 2,330 rpm and ultrasound power of 70%.
The porous structure was determined by low temperature (77 K) nitrogen adsorption measurements carried out on the accelerated surface area and Porosimetry System model 2420 made by Micromeritics, using 200–300 mg of materials with the grain size fraction between 0.1 and 0.2 mm. Prior to nitrogen adsorption, all samples were outgassed at 623 K and at 0.4 Pa until the constant weight. Both adsorptive and desorptive branches of the isotherm were taken in the range of p/p 0 0–1.
Thermogravimetry was performed using a NETZSCH 209 F1 Libra gravimetric analyser (Netzsch Group, Selb, Germany). Samples of 5 ± 0.2 mg were placed in Al2O3 crucibles. Measurements were conducted in the temperature range of 30–1,000°C at 10°C·min−1 heating rate and under air flow (20 mL·min−1).
In order to determine the chemical composition of sediments, measurements were made with the FLASH 2000 elemental analyser, which is based on the dynamic combustion technology. The samples were weighed in tin capsules (approx. 2–4 mg), and then introduced into the reactor with an autosampler together with an appropriate, strictly defined portion of oxygen. After burning at 900–1,000°C, the exhaust gases were transported in a helium flow to another reactor oven filled with copper, and then through the water trap to the chromatography column that separated the individual products from each other. Finally, the separated gases were detected by the thermal conductivity detector. The Thermo Scientific Eager Xperience software was used to analyse the data.
FT-IR spectra were recorded on a Nicolet iS50 Fourier transform spectrometer (Thermo Fischer Scientific) equipped with an ATR unit.
The phase identification and the influence of the sediment depth fraction was performed using an X-ray diffraction (XRD) powder diffractometer (Bruker AXS D8 Advance) using CuKα lamp radiation and Ni filter. X-ray spectra were recorded in the angular range of 20–80 [2θ].
Imaging of the surface was performed with scanning electron microscopy (SEM; Quanta 250 FEG, FEI).
3 Results and discussion
3.1 Identification of thickness and spatial differentiation of sediments
Based on sonar probing of the lake bottom and calibration of the results on the basis of the boreholes made, the thickness and spatial differentiation of sediments were identified in the whole water body. Thanks to the image of Lake Swarzędzkie’s bottom structure, information about the thickness of the lake sediments and the depth of fluvio-glacial mineral formations was obtained. Figure A1 (in Appendix) presents the sediments’ structure. At the depth of more than 15 m under the water surface, mineral deposits are visible as light yellow spots reflecting the acoustic wave.
3.2 Granulometric and graniformametric analysis, quartz grains rounding ratio
Mineral formations from the bottom of the collected deposits were subjected to granulometric and graniformametric analyses, and the quartz grains rounding ratio was determined for the 0.25–1.40 mm fraction.
The graniformametric analysis involves the use of an inclined plane on which round grains roll down at a slight slope and angular grains at a larger slope. The rounding ratio (W o) calculated using this method provides information on the grains’ wear:
W o = (500–800) – fresh grains, no signs of wear, angular grains, young grains;
W o = (800–1,600) – grains with traces of wear, mature type;
W o = (800–1,200) – grains with weak traces of wear;
W o = (1,200–1,600) – grains with clear traces of wear;
W o > 1,600 – grains with significant wear, old type;
W o = (1,600–2,000) – grains with significant wear;
W o > 2,000 – grains with very significant wear.
The quartz grains examined were characterised by a rounding ratio in the range of 460–720. The average quartz grains rounding ratio in the bottom sediments of Lake Swarzędzkie was W o = 549, which indicates that these are young grains without traces of wear. This indicates the fluvio-glacial origin of the mineral formations that were carried to the basin of Lake Swarzędzkie at the end of the glacial period, before the beginning of biogenic accumulation in the water body.
Individual quartz grains were also subjected to photogrammetrical analysis in Agisoft PhotoScan. Based on the macro-photographic documentation, three-dimensional models of quartz grains were developed to determine their shape and dimensions (Figure A2).
A geotechnical hole sheet has also been developed for the boreholes. The top layer is made up of turfs with thickness of approx. 3 m, which contain visible macro-remains of plant origin and small fragments of malacofauna. Below, in the layer with thickness of approx. 8–9 m, homogeneous lake chalk occurs with CaCO3 content of more than 80%. Below the lake chalk, calcareous gyttja with a concentration of CaCO3 of approx. 50% is located. The bottom of Holocene lake formations was drilled at the following depths: in hole no. 6, at 14.6 m under the water surface; in hole no. 7, at 14.5 m under the water surface; and in hole no. 8, at 10.8 m under the water surface. The profile of the drilled formations was illustrated in the geotechnical hole sheet (Figure A3), and their spatial arrangement – on the geotechnical cross-section (Figure A4).
3.3 Analysis of particle size distribution according to the sediment depth (DLS)
Analyses of particle size distribution of sediments collected from lakes [33] showed that the size distribution of particles varied according to the place of their collection and was specific to the given aquatic area. The connection between the grain size and the percentage of individual mineral fractions is also visible, which is linked to the process of ice sheet retreating and its influence on sedimental processes occurring in water bodies.
For sediments obtained from Lake Swarzędzkie, all the analysed fractions contain both nanoparticles of less than 1 μm and particles of 1–400 μm. Depending on the depth, the particle size distribution varies with the average particle size of the main particle fraction shifting in the range of 3–60 μm. Total grain size distribution in individual fractions collected at different depths of the cave water body showed a relationship between the size change and the distribution of particles in the examined sediments in correlation with the depth of their collection; this is also the case for sediments collected from the water body at the Żarska cave [34]. Fractions at the depth of 3 m collected from Lake Swarzędzkie (Figure 3) have the largest proportion of particles with diameter of approx. 50 μm. With the depth increasing up to 8 m, the average main fraction size decreases down to ∼3 μm, after which it increases back up to ∼60 μm for 13–13.5 m fraction. Fractions from the depth of 4–8 m have the largest proportion of particles with approx. 10 μm in diameter. At the same time, the proportion of particles with an average size of less than 1 μm is also increased. From 8 to 12 m depth, the prevailing particle fraction is of average size of ∼10 μm [35].
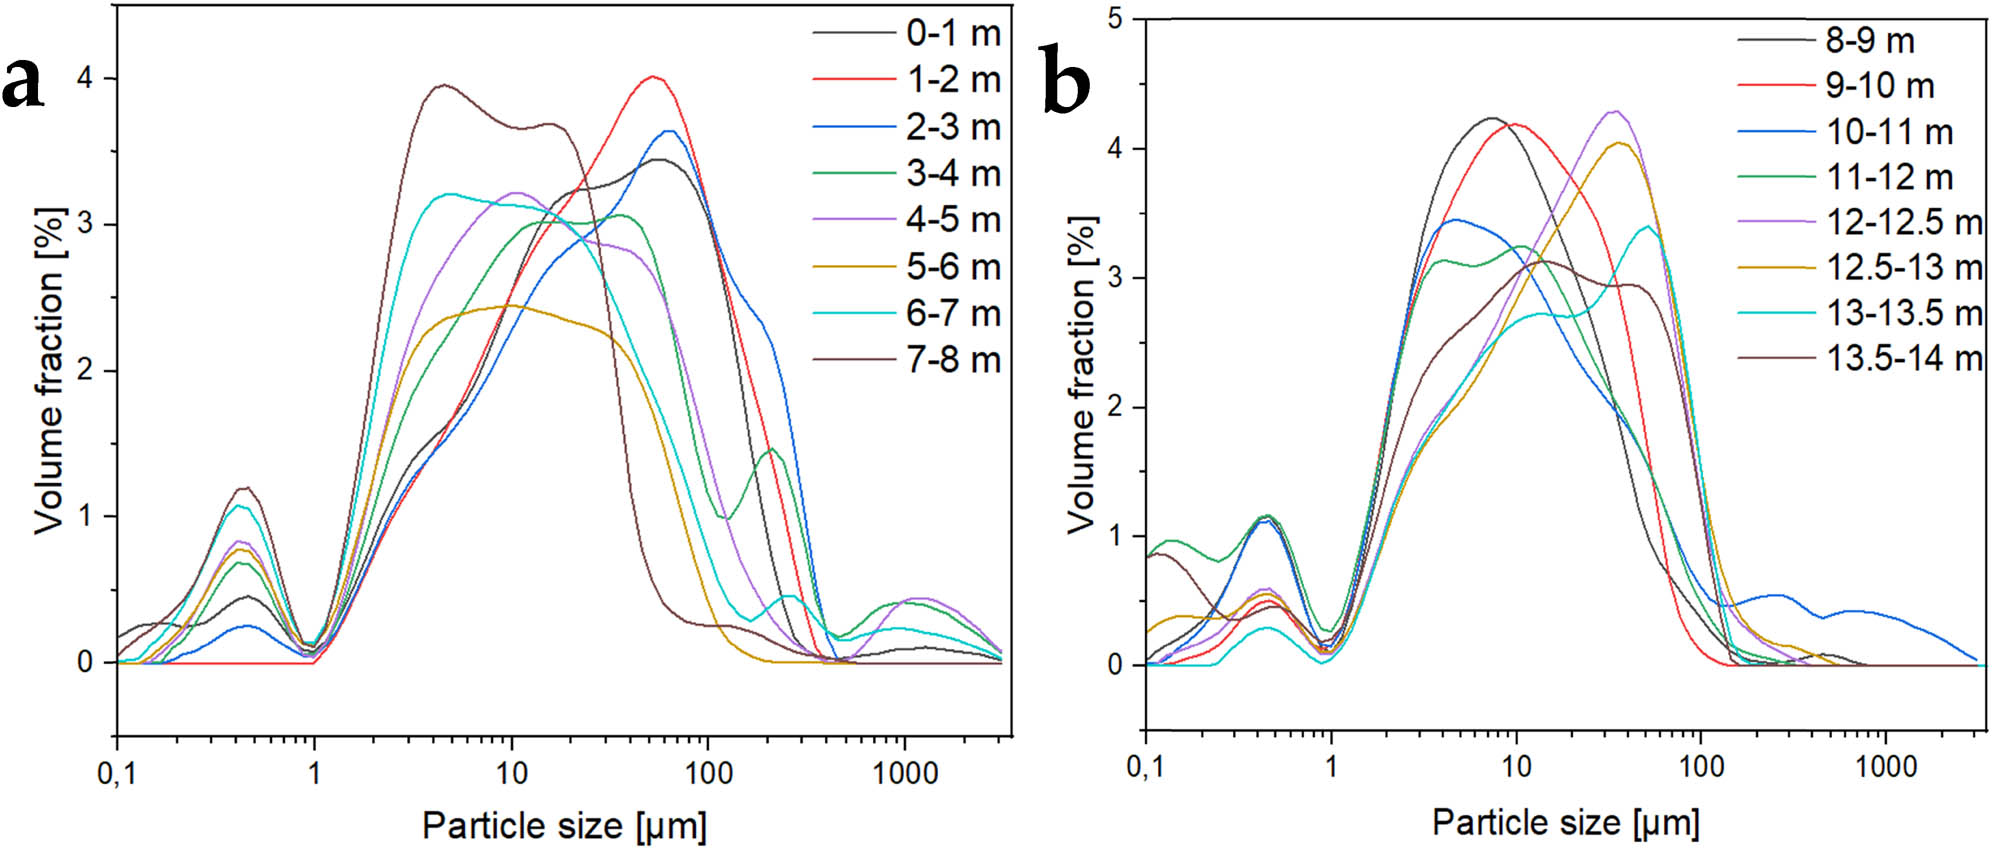
Sediment particle size distribution; (a) 0–8 m depth and (b) 8–14 m depth.
3.4 Adsorption–desorption isotherms and pore size distribution
Comparing adsorption–desorption isotherms made for sediment samples from Lake Swarzędzkie, it can be observed that they show a similar shape (Figure A5). According to the adopted IUPAC classification of porous materials, the isotherm shape can be classified as type IV isotherms, which are characteristic of microporous materials, whereas the hysteresis loops can be classified to H3 type, which suggests the slit shape of pores [36].
The results of the texture examination indicate variations in both the surface area and porosity of the sediments, depending on the bottom sheet layer. The surface area BET of all sediments does not exceed 40 m2·g−1 (Table 2, Figure 4). After an initial slight increase in the surface area for the fractions from 0–1 and 1–2 m, its sudden decrease is observed as the depth increases. Fractions from 2 to 10 m have the area BET not exceeding 10 m2·g−1 [37], while from 9 to 14 m, the surface area increases again and assumes values of up to 36.5 m2·g−1. The pore size in sediment particles up to 10 m is above 10 nm, up to a maximum of 17.2 nm (Des.) and 18.1 nm (Ads.), while above 10 m it stays within the range of 8.5–10 nm. The pore size in the lowest layers is <10 nm [38]. Both the pore size and the pore volume assume the lowest values for the fraction at 2–10 m. In the other ranges, the values are significantly higher.
Textural properties of the sediments
| Sample | Pore volume BJH Ads. (cm3·g−1) | Pore volume BJH Des. (cm3·g−1) | Pore size BJH Ads. (nm) | Pore size BJH Des. (nm) |
|---|---|---|---|---|
| 0–1 | 0.0616 | 0.0624 | 15.0 | 13.4 |
| 1–2 | 0.0680 | 0.0708 | 12.9 | 11.1 |
| 2–3 | 0.0347 | 0.0352 | 17.4 | 15.3 |
| 3–4 | 0.0253 | 0.0255 | 17.4 | 17.2 |
| 4–5 | 0.0215 | 0.0219 | 17.8 | 15.8 |
| 5–6 | 0.0241 | 0.0245 | 17.9 | 16.0 |
| 6–7 | 0.0194 | 0.0197 | 16.4 | 15.4 |
| 7–8 | 0.0172 | 0.0174 | 17.6 | 15.9 |
| 8–9 | 0.0157 | 0.0159 | 16.3 | 14.9 |
| 9–10 | 0.0218 | 0.0223 | 18.1 | 15.5 |
| 10–11 | 0.1118 | 0.1140 | 11.9 | 9.9 |
| 11–12 | 0.0474 | 0.0494 | 10.7 | 9.3 |
| 12–12.5 | 0.0647 | 0.0668 | 10.8 | 9.6 |
| 12.5–13 | 0.0410 | 0.0436 | 9.4 | 8.3 |
| 13–13.5 | 0.0448 | 0.0480 | 9.8 | 8.4 |
| 13.5–14 | 0.0506 | 0.0542 | 9.6 | 8.4 |

Surface area BET and pore areas of sediments.
3.5 Thermal analysis of sediments
The thermal analysis (TGA) showed differences between the analysed sediments. In each case, the thermal decomposition occurs in three stages (Table 3, Figure 5). The first stage occurs at temperatures of approx. 60–80°C and is linked to the desorption of physically adsorbed water. Samples collected between 6 and 11 m do not exhibit that effect, from which it can be concluded that sediment conversion processes in this range are lesser. The second effect occurs at temperatures of approx. 308–327°C, depending on the depth of sample origin. As the depth increases, this effect shifts towards higher temperatures, and for systems collected at 12 m and deeper they exceed 480°C. This maximum is due to the loss of crystallisation water from the sediment structure. The maximum temperature of the third stage of the process spans from 720°C to almost 800°C, with lower temperatures for samples taken above 12.5 m depth. It corresponds to the maximum decomposition of CaCO3 that, according to literature, occurs at 790°C [39]. The loss of mass after thermal analysis increases with the sediments collection depth. For the depth of 0–1 m, it is up to nearly 60%, while for 1 to 11 m, it is approx. 45%. Below 11 m, for the samples collected at 11–12 and at 12.5–13 m, it is approx. 30%, and less than 10% for other samples, including those collected from the deepest layers.
Results of thermal analysis of the examined sediments
| Sample name | t 1 (°C) | Mass loss mt 1 (%) | t 2 (°C) | Mass loss mt 2 (%) | t 3 (%) | Mass loss mt 3 (%) | Residual mass (%) |
|---|---|---|---|---|---|---|---|
| 0–1 m | 77.5 | 8.30 | 312.7 | 37.30 | 755.5 | 13.30 | 41.10 |
| 1–2 m | 74.4 | 6.94 | 322.8 | 31.00 | 726.1 | 7.69 | 54.37 |
| 2–3 m | 65.9 | 2.47 | 311.5 | 11.36 | 788.4 | 34.41 | 51.76 |
| 3–4 m | 54.5 | 1.23 | 308.3 | 6.27 | 789.5 | 39.60 | 52.90 |
| 4–5 m | 51.7 | 1.03 | 308.6 | 6.00 | 795.9 | 40.36 | 52.61 |
| 5–6 m | 65.0 | 1.29 | 310.7 | 5.56 | 790.8 | 39.36 | 53.79 |
| 6–7 m | — | — | 326.9 | 5.78 | 797.5 | 40.91 | 53.31 |
| 7–8 m | — | — | 308.2 | 4.34 | 793.4 | 40.24 | 55.42 |
| 8–9 m | — | — | 321.2 | 3.37 | 793.9 | 40.52 | 56.11 |
| 9–10 m | — | — | 315.0 | 4.46 | 798.6 | 40.81 | 54.73 |
| 10–11 m | — | — | 310.3 | 4.64 | 799.7 | 40.39 | 54.97 |
| 11–12 m | 68.1 | 2.01 | 315.2 | 3.62 | 780.7 | 24.35 | 70.02 |
| 12–12.5 m | 120.1 | 3.08 | 493.1 | 2.78 | 724.2 | 4.96 | 89.18 |
| 12.5–13 m | 119.1 | 1.57 | 485.8 | 0.98 | 722.1 | 4.45 | 93.00 |
| 13–13.5 m | 117.8 | 1.22 | 488.5 | 2.70 | 726.0 | 5.51 | 90.57 |
| 13.5–14 m | 64.8 | 1.60 | 493.1 | 2.78 | 724.2 | 4.96 | 90.66 |
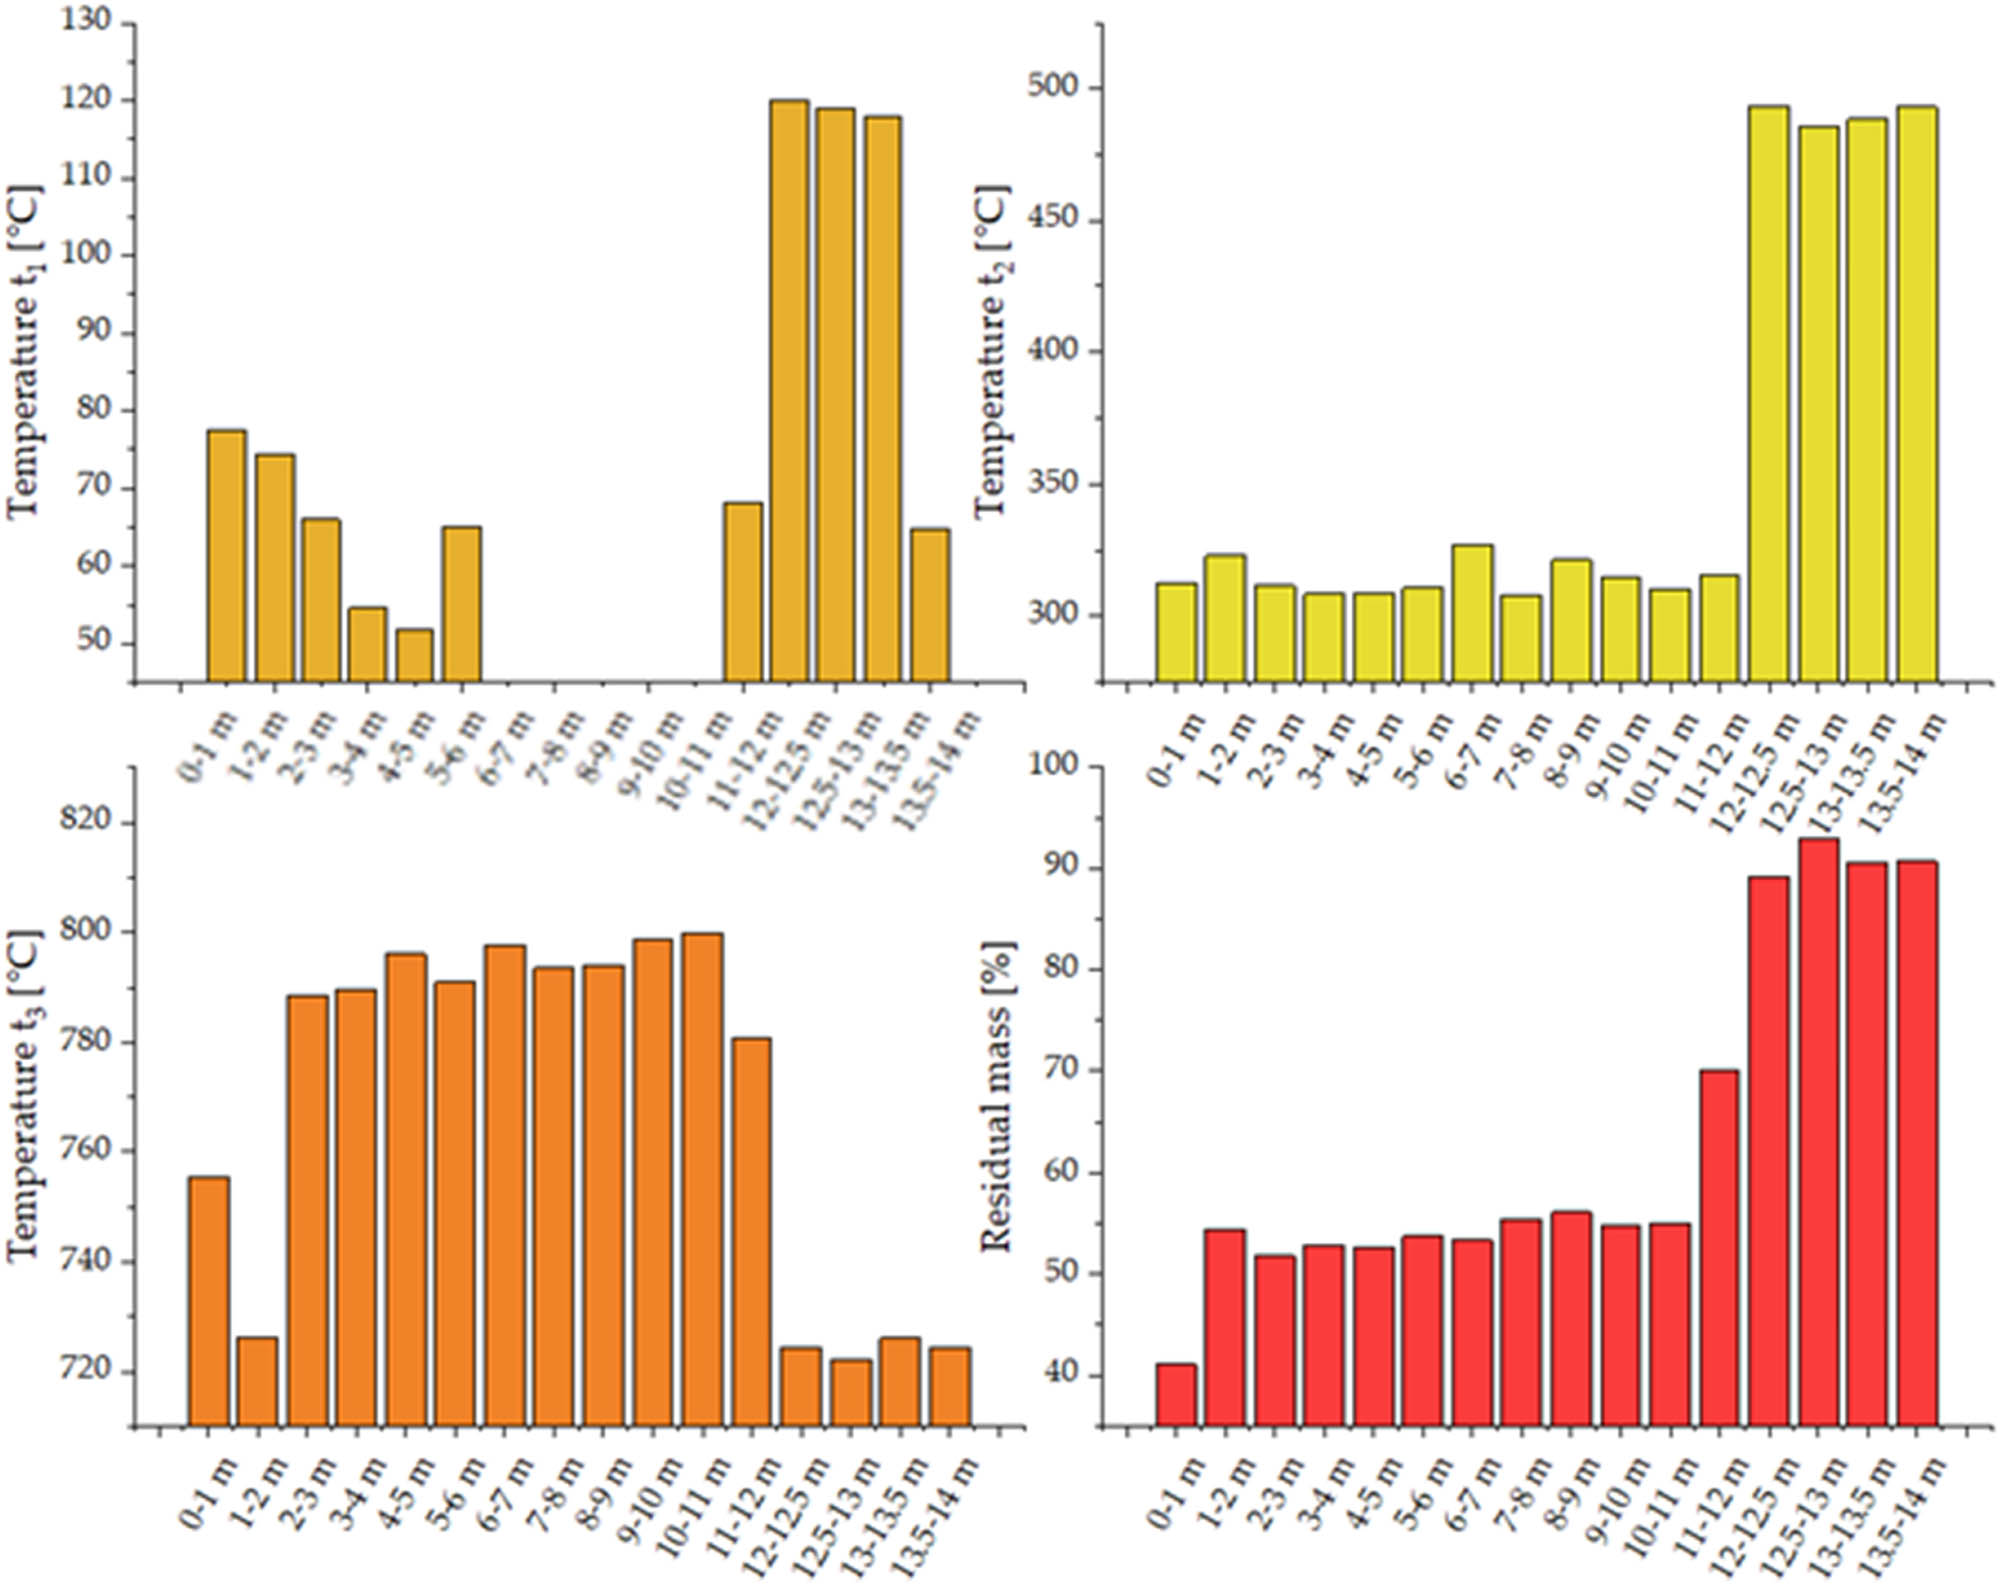
Temperatures t 1, t 2, and t 3, and residual mass determined by thermal analysis.
The TGA carried out showed that for sediments collected at smaller depths, e.g., 3–4 m, the carbon dioxide band from decomposition of carbonate groups is present at 775.8°C, while for sediments collected at greater depths, i.e. at 12–12.5 m, this temperature is slightly lower and reaches 770.6°C, as shown in Figures A6 and A7. This can be interpreted as arising from differences in crystalline characteristics, with younger sediments appearing to have a higher crystallinity.
3.6 Elemental analysis
Table 4 presents the results of the CNS elemental analysis of the collected bottom sediments. The content of two main biogenes, nitrogen, and carbon content was determined. The sulphur content in all samples was below the limit of detection.
CNS content values
| Sample name | Combustion temperature (°C) | Nitrogen content N (%) | Carbon content C (%) |
|---|---|---|---|
| 0–1 m | 900 | 1.38 | 25.66 |
| 1,000 | 1.33 | 25.89 | |
| 1–2 m | 900 | 1.06 | 19.85 |
| 1,000 | 0.97 | 19.65 | |
| 2–3 m | 900 | 0.20 | 16.65 |
| 1,000 | 0.15 | 16.17 | |
| 3–4 m | 900 | b.l.d. | 14.19 |
| 1,000 | 14.28 | ||
| 4–5 m | 900 | b.l.d. | 13.83 |
| 13.86 | |||
| 1,000 | |||
| 5–6 m | 900 | b.l.d. | 13.80 |
| 13.94 | |||
| 1,000 | |||
| 6–7 m | 900 | b.l.d. | 13.54 |
| 13.62 | |||
| 1,000 | |||
| 7–8 m | 900 | b.l.d. | 13.31 |
| 1,000 | 13.31 | ||
| 8–9 m | 900 | b.l.d. | 13.04 |
| 1,000 | 12.92 | ||
| 9–10 m | 900 | b.l.d. | 12.87 |
| 1,000 | 12.85 | ||
| 10–11 m | 900 | b.l.d. | 12.61 |
| 1,000 | 12.58 | ||
| 11–12 m | 900 | b.l.d. | 10.43 |
| 1,000 | 10.22 | ||
| 12–12.5 m | 900 | b.l.d. | 10.28 |
| 1,000 | 10.53 | ||
| 12.5–13 m | 900 | b.l.d. | 2.04 |
| 1,000 | 2.00 | ||
| 13–13.5 m | 900 | b.l.d. | 2.44 |
| 1,000 | 2.58 | ||
| 13.5–14 m | 900 | b.l.d. | 2.20 |
| 1,000 | 2.11 |
b.l.d. – below limit of detection.
The analysis results reflect differences in the chemical composition of the examined sediments depending on the depth of their occurrence (Figure 6, Table 4). All examined samples contain carbon, the residue of which is due to the biogenic origin of the raw material. The first top fractions collected from the shallowest layers in the lake (0–3 m) contain nitrogen with a maximum content of up to 1.38% in the upper sheet layer [40]. As the depth of the sediments collected increases, carbon content decreases sharply to about 14% at the depth of 3 m. In addition, nitrogen is absent above the depth of 3 m. A similar decrease in total organic carbon (TOC) percentage content and total nitrogen (TN) along the depth profile was also observed for Lake Żabińskie [41] and Lake Łazduny [42] in Poland. A high percentage content of the CHN element and its subsequent sharp decrease correspond well to the results of the thermal analysis and decarbonisation mass losses (including decomposition of CaCO3) of samples collected up to 3 m depth from the bottom. Sediments collected from the depth of 3–11 m have similar carbon content (approx. 15%). For the fraction at 11–12.5 m, the carbon content is slightly reduced (10–10.5%). In both cases, deeper sediment fractions (above 12.5 m) contain significantly lower levels of this element [43].
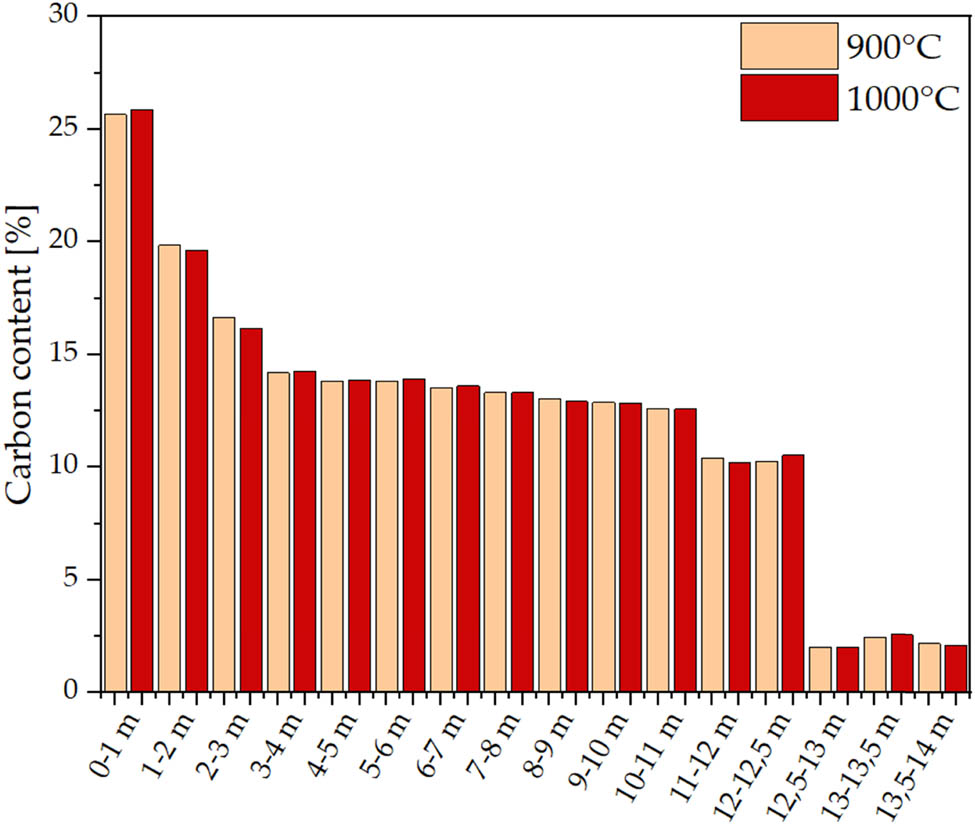
Carbon content in sediments determined by elemental analysis.
3.7 FT-IR spectroscopic analysis – functional group characteristics
The characteristics of the sediment materials were also determined by means of the FTIR analysis. For sediments collected up to the depth of 12 m, the spectra are almost identical. The bands at the 1,400, 870, and 710 cm−1 wavelengths correspond to C–O vibrations of calcite [44]. The most intense band observed for these samples is concentrated at approx. 1,400 cm−1 (Figure 7).

FT-IR spectra of the analysed sediments; (a) sediments collected at depths from 0 to 8 m and (b) sediments collected at depths from 8 to 14 m.
FTIR analyses of carbonate deposits from other lakes (Lake Malawi and Lake Qinghai), depending on the content and distribution of carbonate minerals, have different positions of the CaCO3 main C–O peak [45]. For samples from the deeper parts of Lake Swarzędzkie, above 10 m, two bands at approx. wavelengths of 1,020 and 800 cm−1 originating from SiO2 with a quartz structure emerge and increase [46]. On the other hand, the band at 1,400 cm−1 from kaolinite [47] diminishes as the depth increases and it disappears for sediments collected at 13.5–14 m [48]. The bands present at a wavelength of approx. 3,400 cm−1 originate from C–H and –OH vibrations and have a similar intensity for each sample, regardless of their composition [49].
3.8 XRD analysis
To identify the crystalline phase of the sediments, XRD was used, and the results are shown in Figure 8a [50]. The diffractograms of sediment samples collected at the depth of 0–12 m do not exhibit any differences. The main phase of the sediments is CaCO3 (calcite), with 2θ reflections angle values assigned to it: 23°, 29.5°, 31.5°, 36°, 39.5°, 43.2°, 47.15°, 47.5°, 48.5°, 48.9°, 56.8°, 57.4°, 58.1°, 60.7°, 61°, 61.4°, 63.1°, 64.7°, 65.7°, 68.2°, 70.3°, 72.9°, 73.7°, and 76.4°. The other identified phase in the sediments is SiO2 with a quartz structure. This is indicated by the presence of reflections at the following 2θ angle values: 26.6°, 31.7°, 58.0°, 61.0°, 70.4°, and 71.6°.
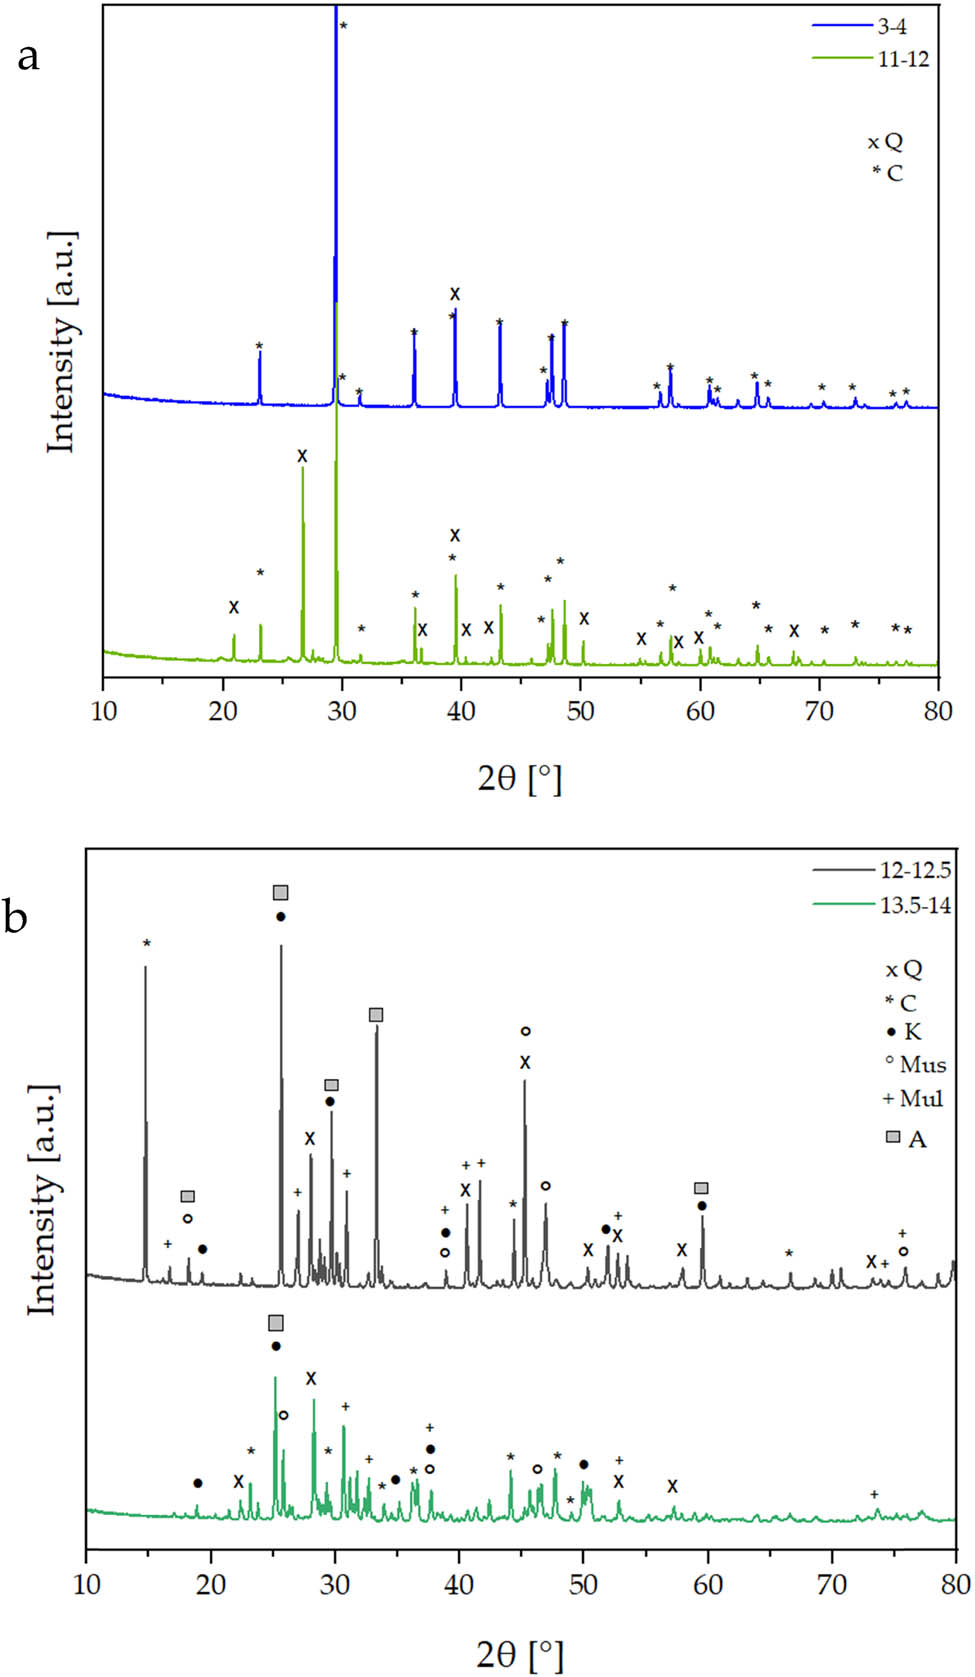
Diffractograms of sediment samples collected at different depths; (a) depth of 3–4 and 11–12 m and (b) depth of 12–12.5 and 13.5–14 m, Q – quartz SiO2, C – calcium carbonate CaCO3, K – kaolinite Al2Si2O5(OH)4, Mus – muscovite KAl2(Si3Al)O10(OH)2, Mul – mullite Al4+2x + Si2−2x O10−x (x = 0.4), A – anhydrite CaSO4, D – dolomite CaMg(CO3)2.
For sediments collected at the depth of 12–14 m, not only the presence of both these phases is observed but also other mineral phases such as kaolinite, muscovite, mullite, and anhydrite (formed during sample drying before microscopy analysis), as shown by reflections marked in Figure 8b can be identified. For 2θ angle values: 24°, 31°, 34°, 37.5°, 41.5°, 45°, 50.5°, 51.5°, 60°, and 63° there are reflections related to dolomite CaMg(CO3)2, while for 21°, 22.5°, 23.5°, 24.5°, 25.5°, 26.5°, 27.5°, 28°, 29.5°, 30°, 31°, 32.5°, 34.5°, 37°, 39°, 42°, 49°, and 51° are related to microcline KalSi3O8.
The chemical content of the analysed sediments does not change up to the depth of 12 m. Above 12 m, other phases can be observed, including aluminosilicates or sulphates, as traces of the processes occurring in this ecosystem. The phase composition is in agreement with the composition of sediments from other lakes in Poland, e.g. Lake Lęborskie [31].
3.9 SEM and SEM/EDS sediment powder imaging
Figure 9 shows microscopic photographs of the carbon lake sediments. Each analysed fraction of sediments presents similar image of samples morphology, including particle agglomerates. In some cases, fragments of diatomaceous earth can be observed (fraction at 3–4 and at 12.5–13 m depth). Similar characteristics were observed in sediments from Lake Łukie [51]. No significant differences in the appearance of the sediments were found according to the depth of the sediment collection. The appearance of the sediment particles themselves, i.e. lack of sharp edges may indicate that they were originally located at a large distance from the place of their deposition. This in turn suggests transportation from another place of origin [52]. In the shallowest layers of the lake sediments, the particles have more irregular edges compared to those in deeper layers, which may indicate increased movement of the sediment particles closer to the lake surface. As the depth at which the sediments were deposited increases, these movements are much less intense or absent. A morphological study of sediments of lake origin (Lake Purwin) presented in the work of Apolinarska and Gałka corresponds to the data presented in this work and supports our observations and analysis of the mineral composition of sediments from Lake Swarzędzkie [53]. Microscopic analysis allows us to observe changes in the morphology of the examined sediments. In order to characterise the changes in the elemental composition along the depth profile, the collected sediments were subjected to the SEM-EDS analysis [47]. Imaging with EDS (Figure 10, Table 5) showed that fractions at 0–1 and 1–2 m have a large proportion of alkali metal oxides (potassium and sodium oxides), which is confirmed by the high level of oxygen, marked in green, present on the sediments’ surface. For fractions at 3–11 m, the proportion of calcium is significantly increased; it reaches approx. 70–80% and is a predominant element in the system. For fractions at the depth exceeding 11 m, the calcium proportion in the system diminishes to the level of 12–16% at the depth of 12.5 m, while the percentage content of silicon increases to 43–45%. The content of the other elements is similar throughout the depth of the sediment core. The low sodium content of 1–3% indicates (as expected) a very low salinity of the water body.

SEM photographs of sediments.

SEM-EDS photographs with phase identification.
Content of the main elements depending on the depth of sediment collection based on the SEM-EDS mapping
| % OK | % NaK | % MgK | % AlK | % SiK | % KK | % CaK | % FeK | |
|---|---|---|---|---|---|---|---|---|
| 0–1 m | 14 | 2 | 2 | 5 | 9 | 5 | 50 | 13 |
| 1–2 m | 16 | 1 | 3 | 11 | 28 | 5 | 29 | 7 |
| 2–3 m | 12 | 2 | 2 | 5 | 5 | 3 | 67 | 4 |
| 3–4 m | 14 | 3 | 3 | 5 | 5 | 3 | 64 | 3 |
| 4–5 m | 13 | 3 | 3 | 8 | 3 | 3 | 64 | 3 |
| 5–6 m | 14 | 3 | 3 | 6 | 4 | 2 | 65 | 3 |
| 6–7 m | 12 | 2 | 3 | 5 | 3 | 3 | 69 | 3 |
| 7–8 m | 13 | 1 | 3 | 3 | 3 | 3 | 71 | 3 |
| 8–9 m | 6 | 1 | 1 | 1 | 1 | 1 | 88 | 1 |
| 9–10 m | 10 | 1 | 1 | 2 | 3 | 3 | 77 | 3 |
| 10–11 m | 8 | 1 | 2 | 2 | 4 | 2 | 78 | 3 |
| 11–12 m | 11 | 1 | 1 | 6 | 17 | 3 | 54 | 7 |
| 12–12.5 m | 12 | 2 | 2 | 7 | 13 | 4 | 51 | 9 |
| 12.5–13 m | 14 | 1 | 2 | 13 | 44 | 5 | 13 | 8 |
| 13–13.5 m | 14 | 1 | 2 | 12 | 43 | 5 | 16 | 7 |
| 13.5–14 m | 14 | 1 | 2 | 13 | 45 | 5 | 12 | 8 |
SEM/EDS imaging showed that the CaCO3 content increases with depth and is predominant in systems collected at the depth from 3 to 12.5 m, whereas above this value the proportion of silica SiO2 is becoming predominant [54]. The low SiO2 content in sediments may result from reduced erosion processes during periods of lower climate humidity. During dry periods, subsurface precipitation of carbonates occurred, caused by the degassing of surface water from CO2. These climate conditions in Holocene helped to create rock formations composed of CaCO3 [55].
4 Conclusion
The probing of Lake Swarzędzkie’s bottom served as a basis to determine the thickness and spatial differentiation of sediments in the whole water body. The analyses allowed us to determine that the depth of sediment occurrence significantly affects both the chemical composition and physicochemical properties. Granulometric and graniformametric analyses indicate the fluvio-glacial origin of the mineral formations. The quartz grains’ rounding ratio was on average W o = 549, which proves that the collected grains were young and without traces of wear. The particle size distribution was depth-dependent, the smallest particles being observed in the 6–12 m depth. In the layers closer to the lake surface, particles tend to agglomerate, which affects the particle size distribution or measurable pore size. Based on the TG analysis, it was determined that the thermal distribution occurs in three stages (first step 60–80°C; second step 308–327°C; third step 720–800°C). The diffractograms of sediments from up to 12 m do not differ. The main phase of sediments up to 12 m is calcite (CaCO3) and quartz-structured SiO2, and above 12 m, kaolinite, muscovite, mullite, and anhydrite were also recorded. The depth of the sediments origin also affects the chemical composition (quantitative content of the elements). The tests carried out showed a relatively high complexity of the sediments’ composition and morphology. This is not necessarily a disadvantage from the perspective of their utilisation as raw materials originating from lake sediments. However, it can be argued that in order to properly and reasonably take advantage of this type of raw material, a physico-chemical characterisation of the potential deposit is necessary in each individual case.
-
Funding information: This work was funded by a grant "Analysis of possibilities of using carbonate lake sediments in the plastics proces sing industry" from the Centre for Advanced Technologies and the Faculty of Geographical and Geological Sciences, Adam Mickiewicz University, Poznań.
-
Author contributions: Grzegorz Borkowski: writing – original draft, writing – review and editing, methodology, formal analysis, project administration, resources, and investigation; Agnieszka Martyła: writing – original draft, visualisation, writing – review and editing, data curation, and investigation; Marta Dobrosielska: writing – original draft, writing – review and editing, visualisation, and data curation; Piotr Marciniak: visualisation and writing – review and editing; Julia Głowacka: writing – original draft and writing – review and editing; Daria Pakuła: visualisation, data curation, and investigation; Ewa Gabriel: writing – original draft, writing – review and editing, data curation, and investigation; Robert E. Przekop: writing – original draft, writing – review and editing, methodology, formal analysis, project administration, and resources.
-
Conflict of interest: Authors state no conflict of interest.
Appendix
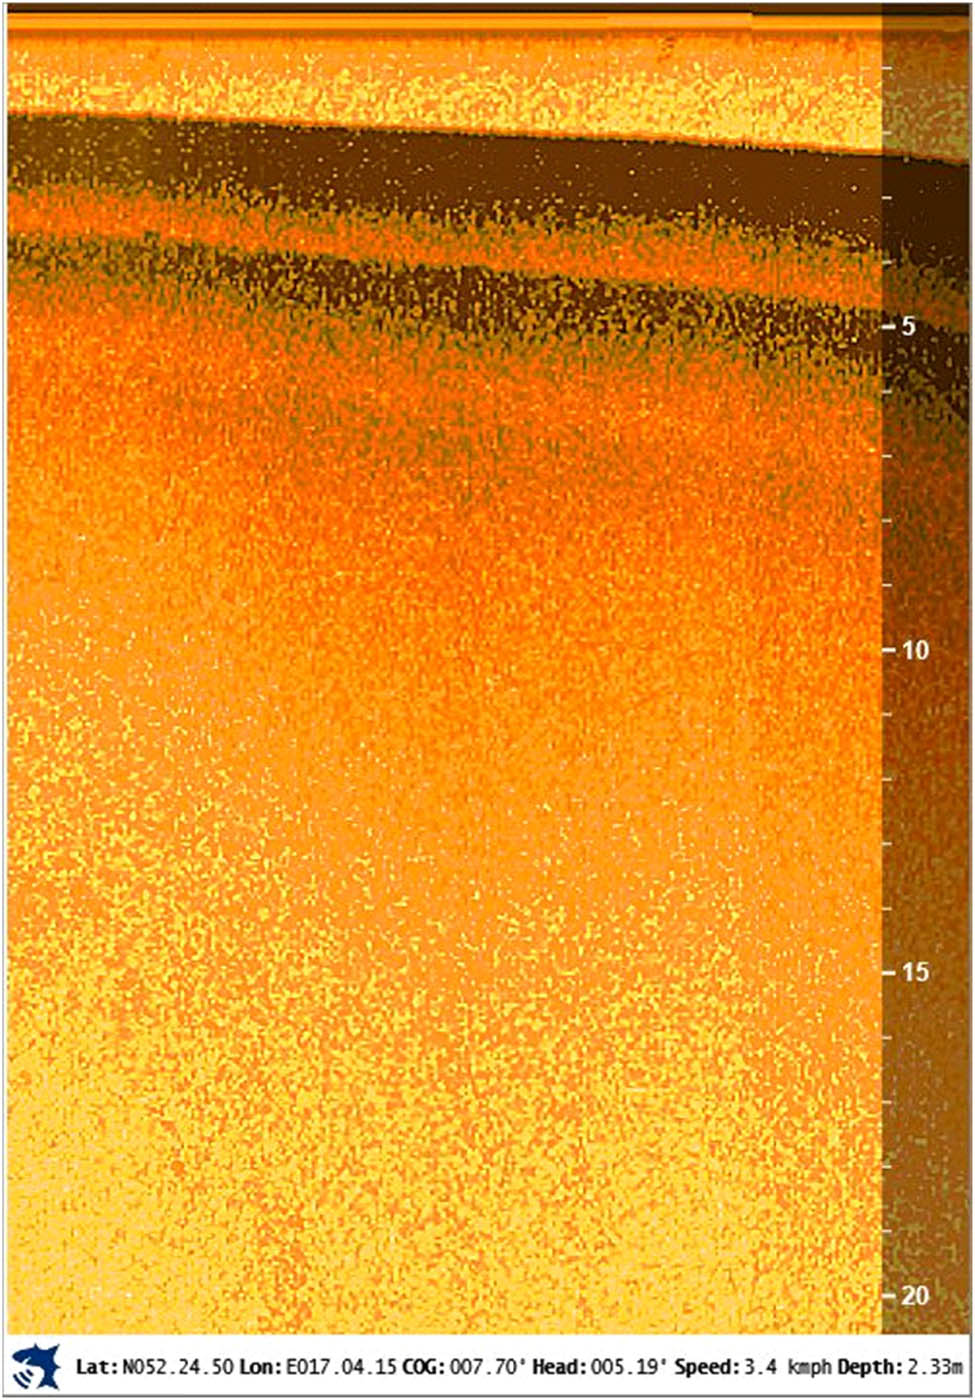
Image of the bottom structure of Lake Swarzędzkie.
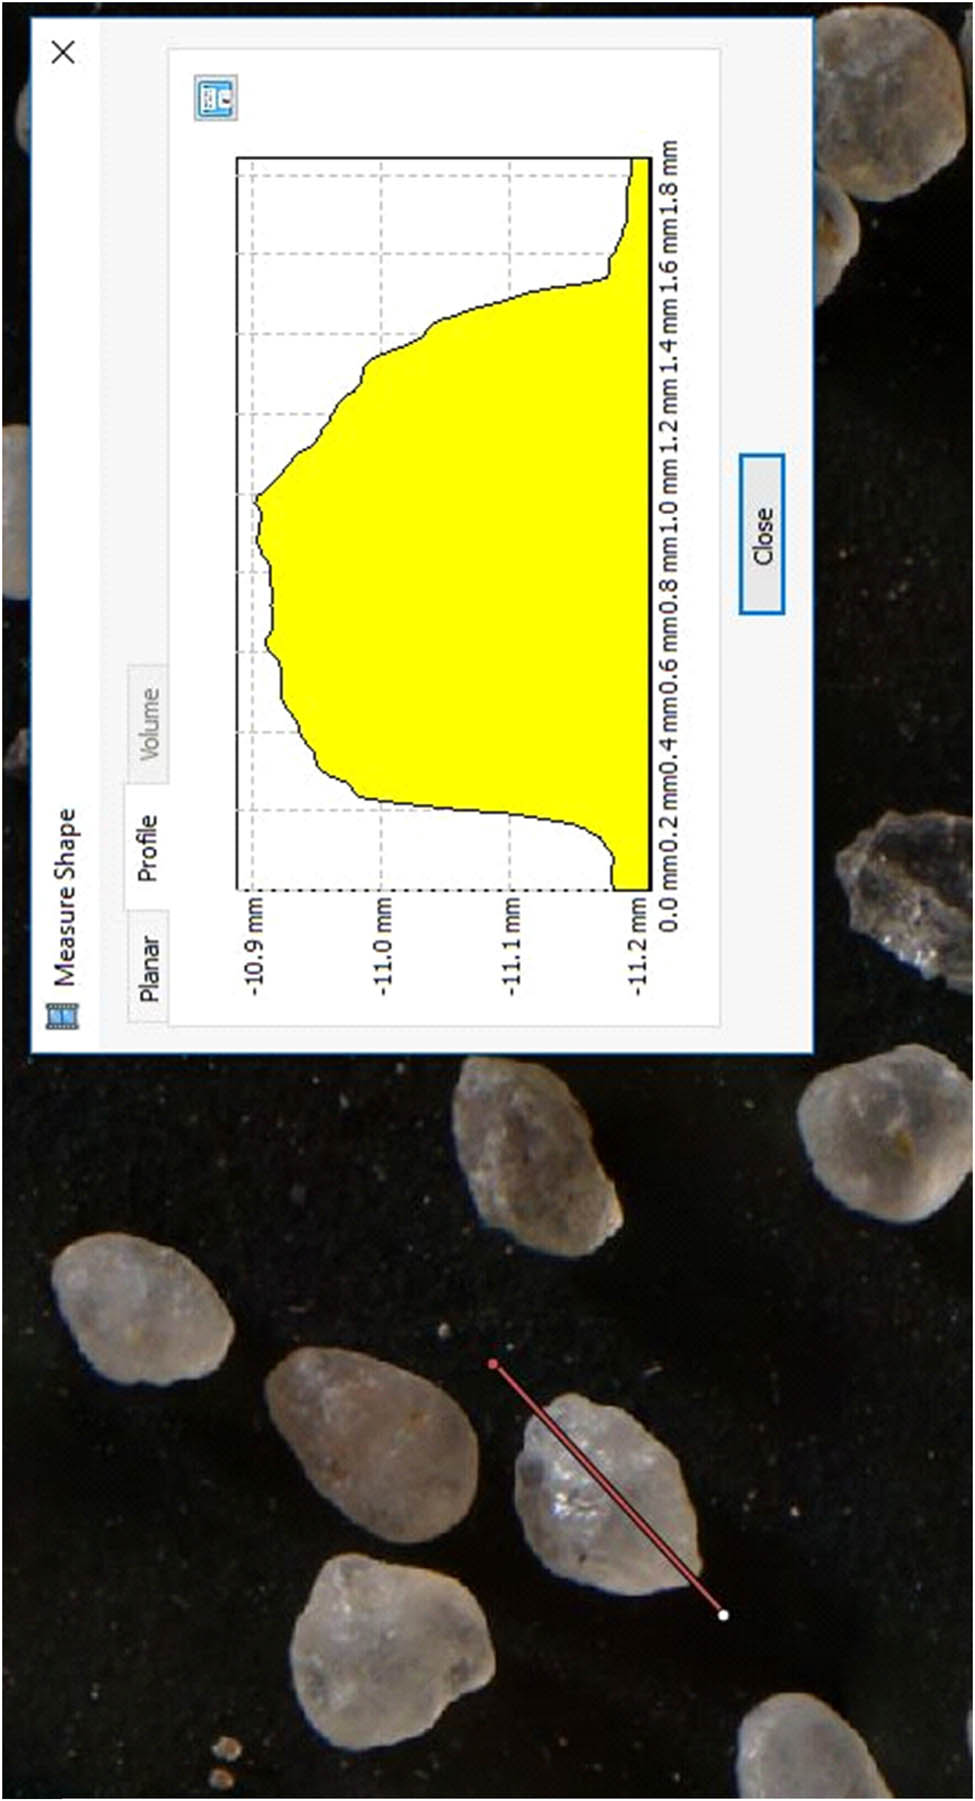
Three-dimensional model of quartz grains from bottom sediments from Lake Swarzędzkie (Agisoft PhotoScan).
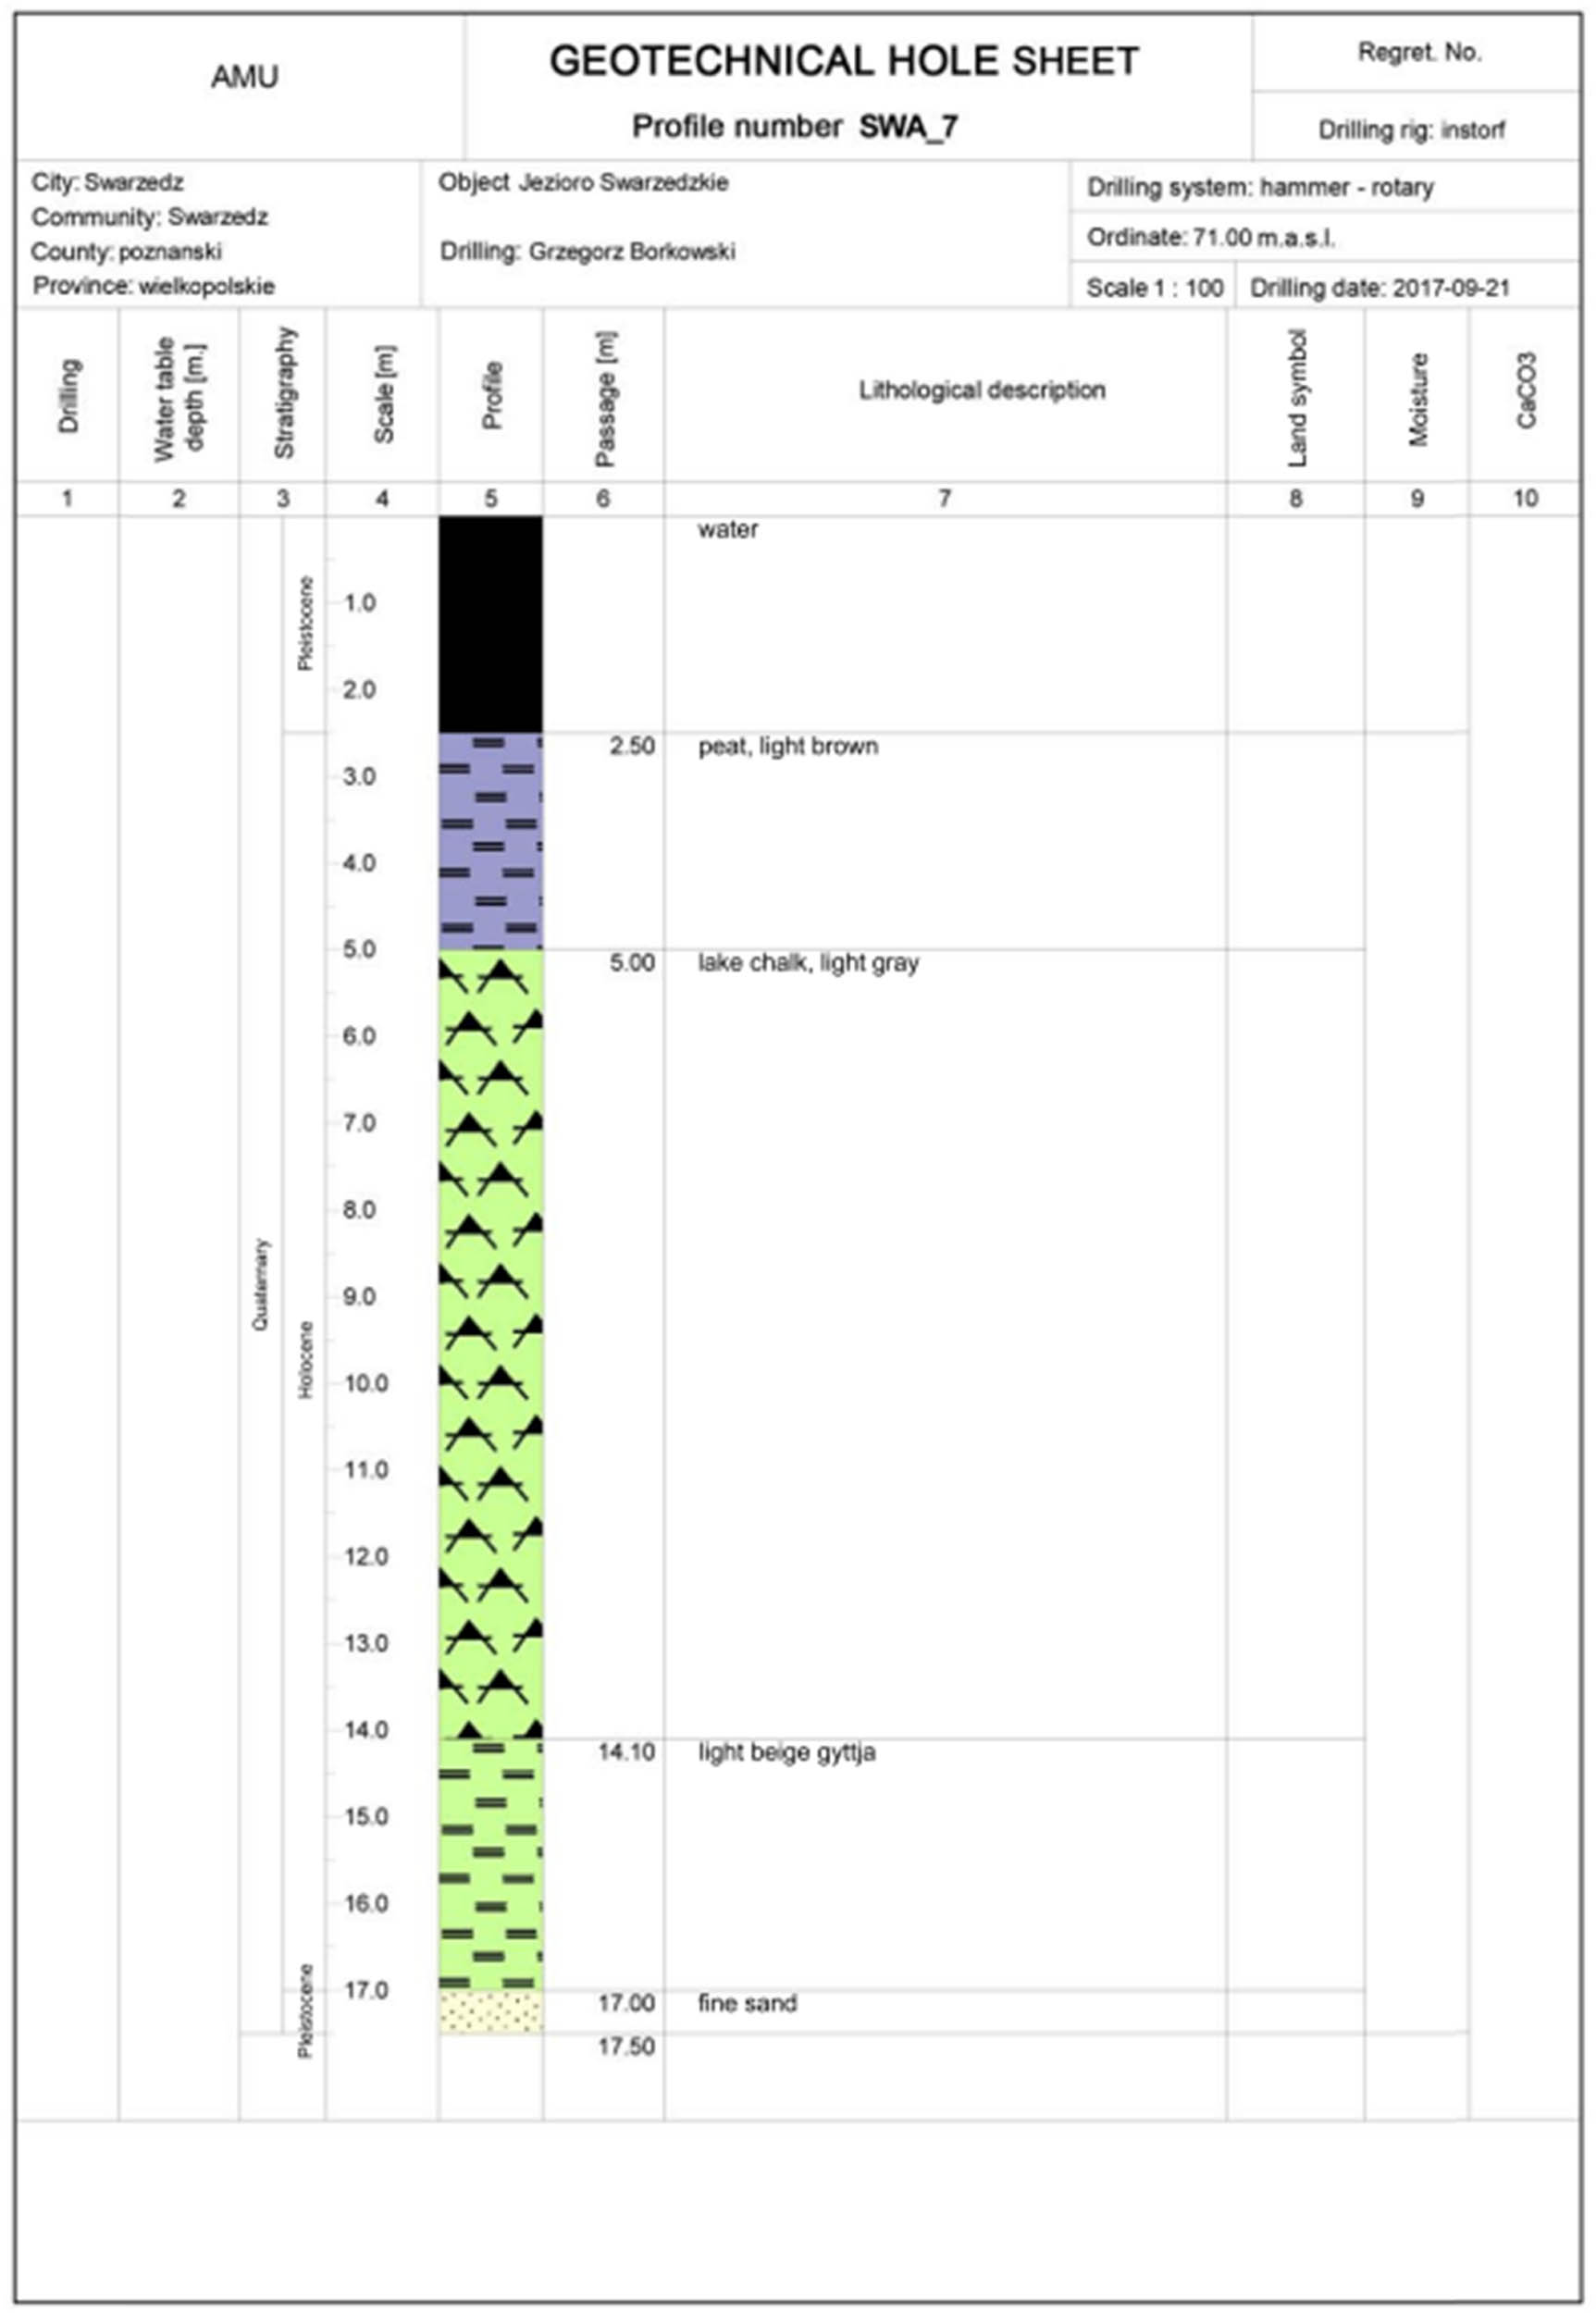
Profile of the drilled formations.
Spatial arrangement – on the geotechnical cross-section.

Nitrogen adsorption–desorption isotherms for sediments.
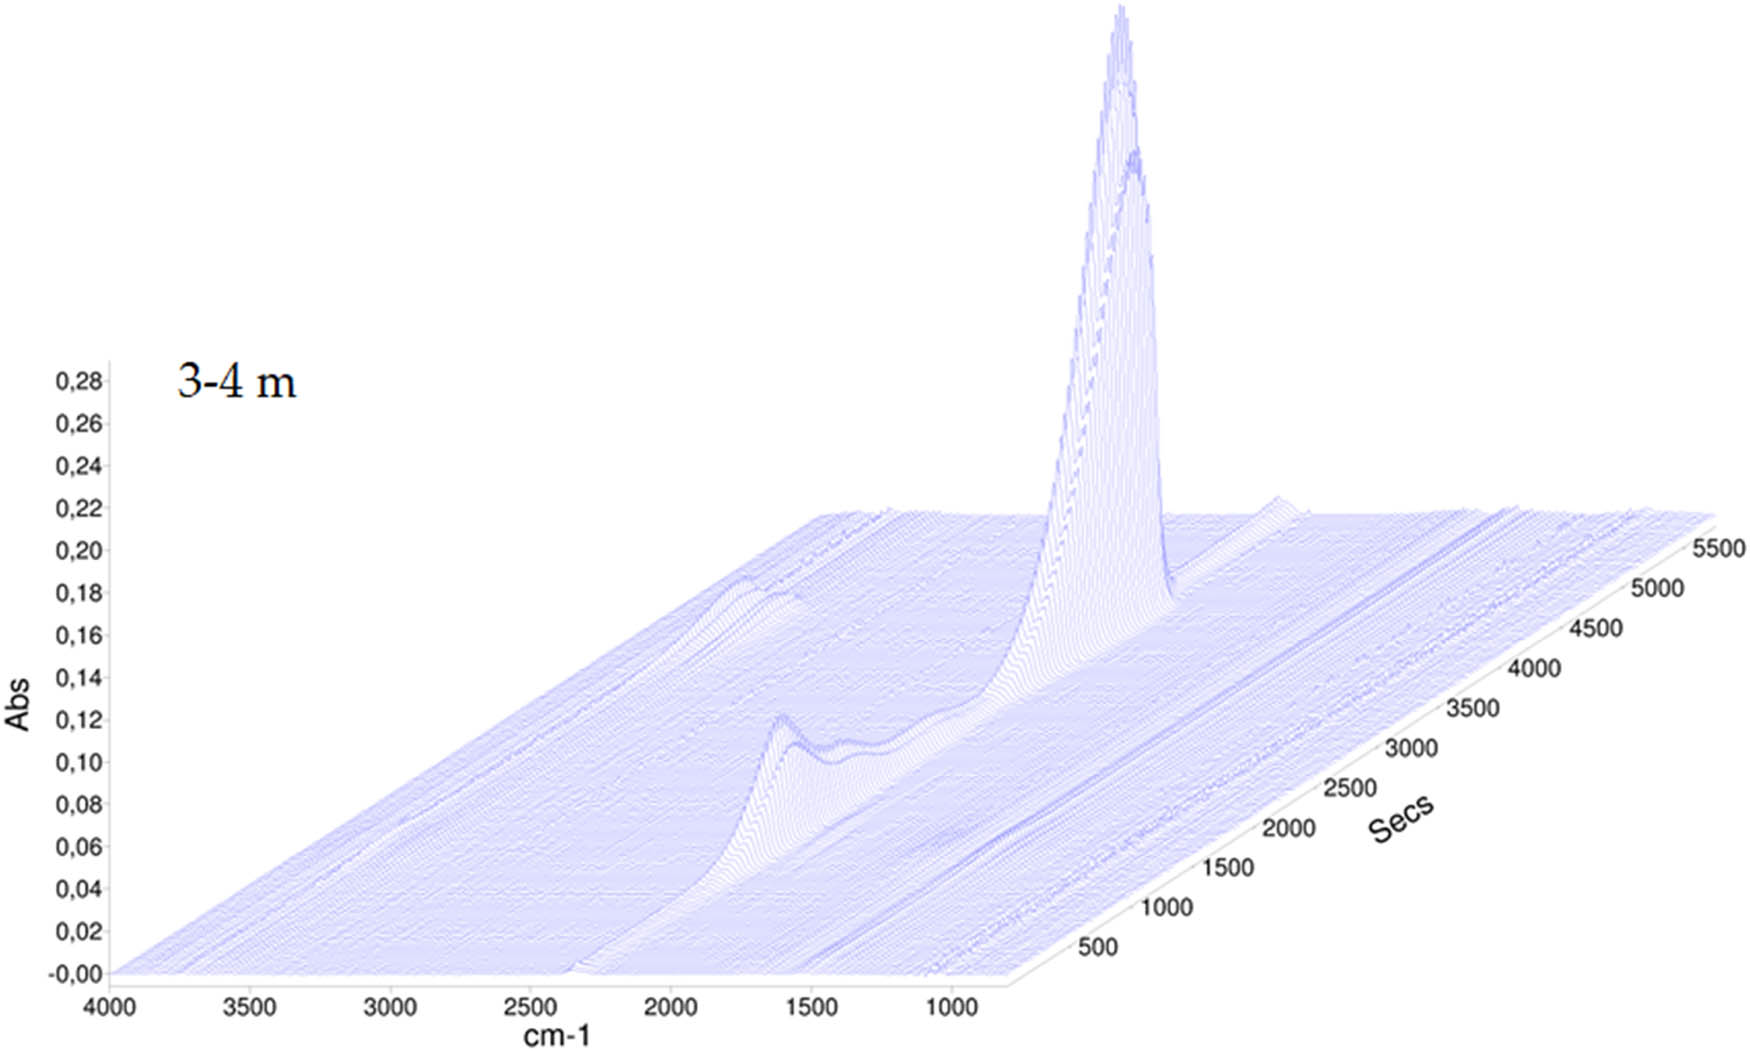
The TGA-FT-IR spectrum of sediment collected at the depth of 3–4 m.
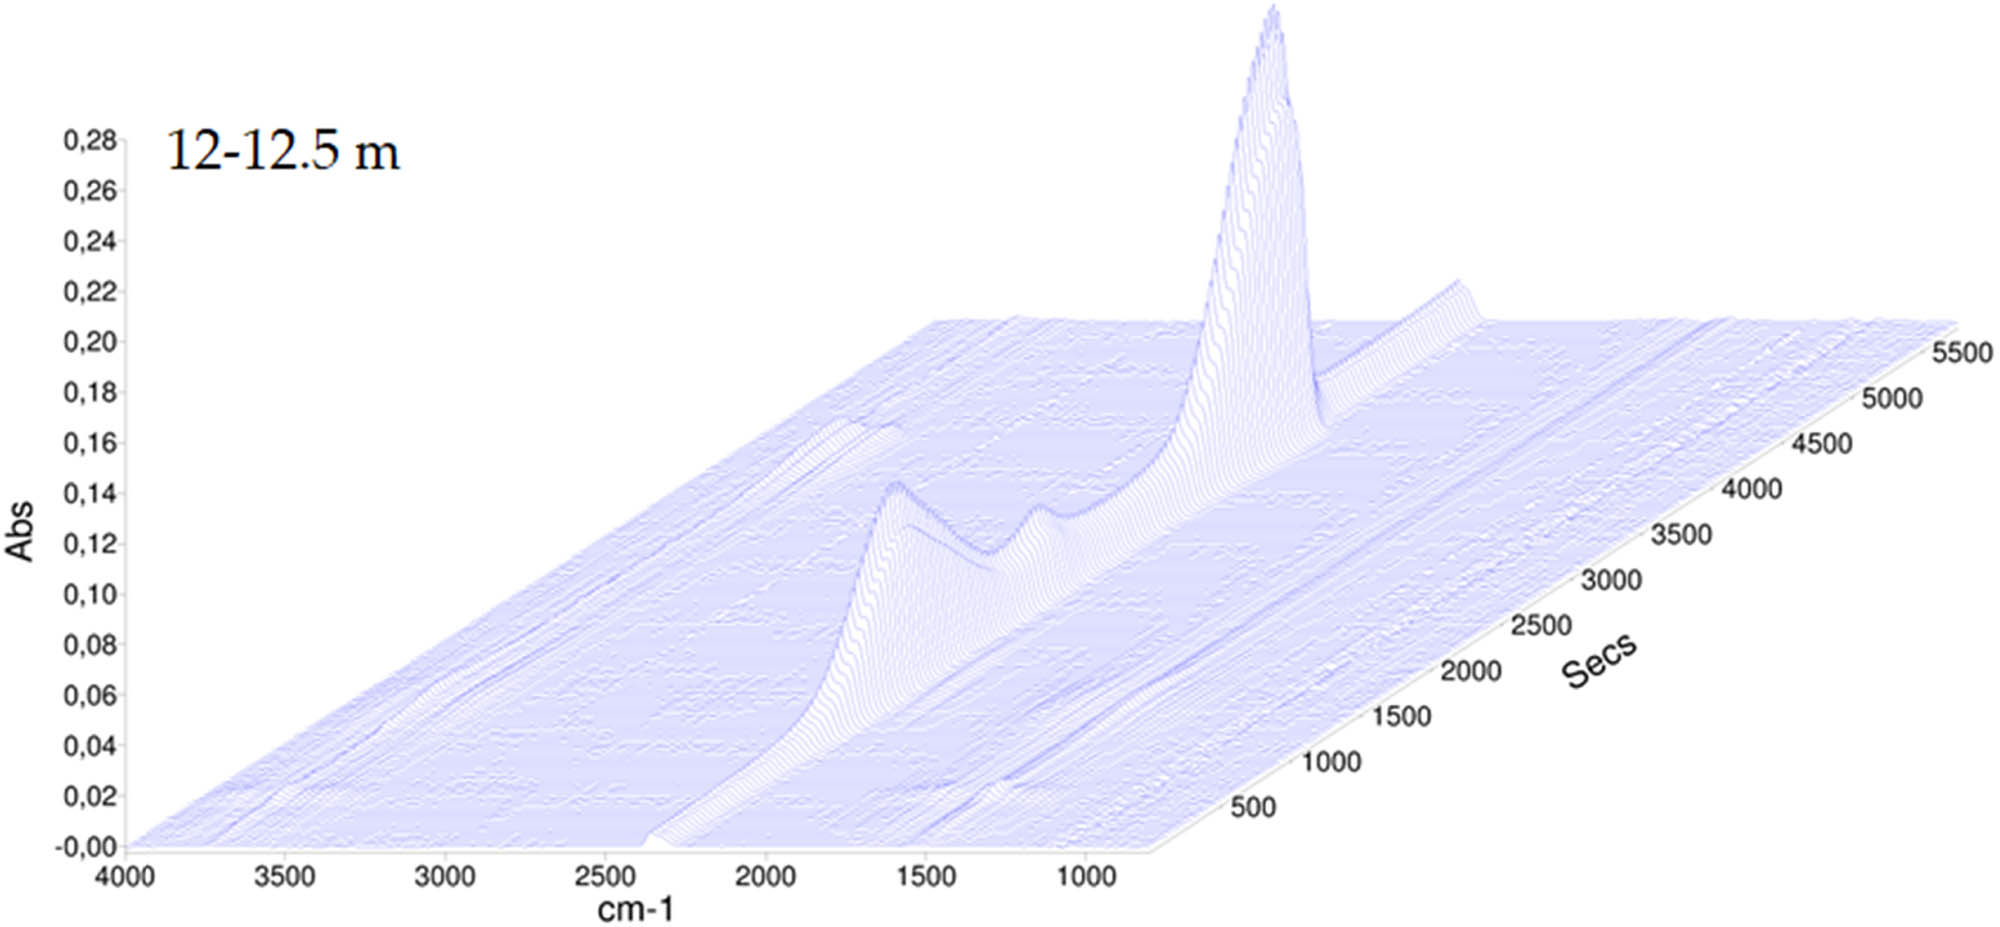
The TGA-FT-IR spectrum of sediment collected at the depth of 12–12.5 m.
References
[1] Kjeński J. Tworzywa polimerowe w zrównoważonym rozwoju – od potrzeby użycia do potrzeby zużycia Cz. II. Powrót do monomerów. Polimery. 2019;64(11–12):740–50. 10.14314/polimery.2019.11.2.Search in Google Scholar
[2] Saravanakumaar A, Senthilkumar A, Muthu Chozha Rajan B. Effect of fillers on natural fiber–Polymer composite: An overview of physical and mechanical properties. In: Krishnasamy S, editors. Mechanical and Dynamic Properties of Biocomposites; 2021. p. 207–33. 10.1002/9783527822331.ch11.Search in Google Scholar
[3] Jakubowska P, Borkowski G, Brząkalski D, Sztorch B, Kloziński A, Przekop RE. The accelerated aging impact on mechanical and thermal properties of polypropylene composites with sedimentary rock opoka-hybrid natural filler. Materials. 2022;15(1):338. 10.3390/ma15010338.Search in Google Scholar PubMed PubMed Central
[4] Dong C. Mechanical properties of natural fibre-reinforced hybrid composites. J Reinf Plast Compos. 2019;38(19–20):910–22. 10.1177/0731684419856686.Search in Google Scholar
[5] Thenepalli T, Jun AY, Han C, Ramakrishna C, Ahn JW. A strategy of precipitated calcium carbonate (CaCO3) fillers for enhancing the mechanical properties of polypropylene polymers. Korean J Chem Eng. 2015;32(6):1009–22. 10.1007/s11814-015-0057-3.Search in Google Scholar
[6] Leong YW, Abu Bakar MB, Mohd Ishak ZA, Ariffin A. Characterization of talc/calcium carbonate filled polypropylene hybrid composites weathered in a natural environment. Polym Degrad Stab. 2004;83(3):411–22. 10.1016/j.polymdegradstab.200.Search in Google Scholar
[7] Palanikumar K, AshokGandhi R, Raghunath BK, Jayaseelan V. Role of Calcium Carbonate( CaCO3) in improving wear resistance of Polypropylene (PP) components used in automobiles. Mater Today Proc. 2019;16:1363–71. 10.1016/j.matpr.2019.05.237.Search in Google Scholar
[8] Gao X, Zhou B, Guo Y, Zhu Y, Chen X, Zheng Y, et al. Synthesis and characterization of well-dispersed polyurethane/CaCO3 nanocomposites. Colloids Surf A: Physicochem Eng Asp. 2010;371(1–3):1–7. 10.1016/j.colsurfa.2010.08.036.Search in Google Scholar
[9] Gao X, Zhu Y, Zhou S, Gao W, Wang Z, Zhou B. Preparation and characterization of well-dispersed waterborne polyurethane/CaCO3 nanocomposites. Colloids Surf A Physicochem Eng Asp. 2011;377(1–3):312–7. 10.1016/j.colsurfa.2011.01.025.Search in Google Scholar
[10] Donate-Robles J, Martín-Martínez JM. Addition of precipitated calcium carbonate filler to thermoplastic polyurethane. Int J Adhes Adhes. 2011;31(8):795–804. 10.1016/j.ijadhadh.2011.07.008.Search in Google Scholar
[11] Basilia BA, Panganiban MEG, Collado AAVC, Pesigan MOD, De Yro PA. Study on the functionality of nano-precipitated calcium carbonate as filler in thermoplastics. J Solid Mech Mater Eng. 2007;1(4):566–70. 10.1299/jmmp.1.564.Search in Google Scholar
[12] Avella M, Errico ME, Gentile G. Nylon 6/calcium carbonate nanocomposites: characterization and properties. Macromol Symp. 2006;234(1):170–5. 10.1002/masy.200650222.Search in Google Scholar
[13] Borkowski G, Martyła A, Dobrosielska M, Marciniak P, Gabriel E, Głowacka J, et al. Carbonate lake sediments in the plastics processing-preliminary polylactide composite case study: Mechanical and structural properties. Materials. 2022;15(17):6106. 10.3390/ma15176106.Search in Google Scholar PubMed PubMed Central
[14] Sztorch B, Brząkalski D, Pakuła D, Frydrych M, Špitalský Z, Przekop RE. Natural and synthetic polymer fillers for applications in 3D printing – FDM technology area. Solids. 2022;3(3):508–48. 10.3390/solids3030034.Search in Google Scholar
[15] Winkler H. Closed-loop production systems – A sustainable supply chain approach. CIRP J Manuf Sci Technol. 2011;4(3):243–6. 10.1016/j.cirpj.2011.05.001.Search in Google Scholar
[16] Tobolski K. Przewodnik do oznaczania torfów i osadów jeziornych. Vademecum Geobotanicum. Warszawa; 2000.Search in Google Scholar
[17] Lange W. Metody badań fizycznolimnologicznych. Gdańsk: Wydawnictwo Uniwersytetu Gdańskiego; 1993. p. 67–108.Search in Google Scholar
[18] Borówka RK. Geochemiczne badania osadów jeziornych strefy umiarkowanej. Studia Limnologia et Telmatologica. 2007;1(1):33–42.Search in Google Scholar
[19] Młynarczyk Z, Nowaczyk B. Budowa geologiczna. Uwarunkowania i plany rozwoju turystyki. Tom I. Przyrodnicze zasoby turystyczne i metody ich oceny; 2008. p. 267.Search in Google Scholar
[20] Nowaczyk B. Wiek jezior i problemy zanikania brył pogrzebanego lodu na przykładzie sandru Brdy w okolicy Charzykowy. Acta Universitatis Nicolai Copernici. Geografia. Geografia XXVII. Nauki Matematyczno-Przyrodnicze. Zeszyt. 1994;27(92):97–110.Search in Google Scholar
[21] Błaszkiewicz M. Dolina Wierzycy, jej geneza oraz rozwój w późnym plejstocenie i wczesnym holocenie. Dokumentacja Geograficzna. IGiPZ PAN. Warszawa: Continuo. Vol. 10; 1998. p. 7–116.Search in Google Scholar
[22] Błaszkiewicz M. Późnoglacjalna i wczesnoholoceńska ewolucja obniżeń jeziornych na Pojezierzu Kociewskim (wschodnia część Pomorza). Warszawa: IGiPZ PAN; 2005.Search in Google Scholar
[23] Choiński A. Wybrane zagadnienia z limnologii fizycznej Polski. Poznań: Wydawnictwo Naukowe UAM; 1985.Search in Google Scholar
[24] Nowaczyk B. Geneza i rozwój wydm śródlądowych w zachodniej części Pradoliny Warszawsko-Berlińskiej w świetle badań struktury, uziarnienia i stratygrafii budujących je osadów. PTPN. Prace kom. Geogr.-Geol.; 1976.Search in Google Scholar
[25] Wojciechowski A. Zmiany paleohydrologiczne w środkowej Wielkopolsce w ciągu ostatnich 12000 lat w świetle badań osadów jeziornych rynny kórnicko-zaniemyskiej. Poznań: Wydawnictwo Naukowe UAM; 2000.Search in Google Scholar
[26] Nowaczyk B, Tobolski K. W sprawie poźnoglacjalnych osadów wapiennych akumulowanych w środowisku wodnym. Badania Fizjograficzne nad Polską Zachodnią. Seria A: Geografia Fizyczna. Warszawa-Poznań: Państwowe Wydawnictwo Naukowe; 1981.Search in Google Scholar
[27] Borkowski G. Funkcjonowanie jezior w holocenie na przykładzie Jeziora Zbąszyńskiego. Studia i Prace z Geografii nr 46, Poznań: Bogucki Wydawnictwo Naukowe; 2014.Search in Google Scholar
[28] Piątkowski J. Łeba ice-marginal valley, Łeba Spit, and Lębork ice-dammed lake. Ann Soc Geol Pol. 1960;29:375–86.Search in Google Scholar
[29] Morawski W. Morphogenesis of the Łebsko Lowland and Łeba ice-marginal valley between Lębork and Łeba. Studia I Materiały Oceanologiczne. 1989;56:163–70.Search in Google Scholar
[30] Morawski W. Sedimentation of fluviomorainic sediments at subsequent stages of deglaciation of the western part of the Lębork Plateau. In: Kostrzewski A, editor. Genesis, Lithology and Stratigraphy of Quaternary Formations. UAM, Geografia; 1990. p. 127–242.Search in Google Scholar
[31] Rogoziński R, Maciejewska A. Geochemistry and mineralogy of ice-dammed lake sediments of the Lębork deposit. Clays Clay Min. 2021;69(3):315–27. 10.1007/s42860-021-00129-6.Search in Google Scholar
[32] Tobolski K. O potrzebie badań osadów dennych jezior w środkowej Wielkopolsce. In: Kaniecki A, Rotnicka J, editors. Wody powierzchniowe Poznania. Problemy wodne obszarów miejskich. Poznań: Sorus; 1995. p. 384–8.Search in Google Scholar
[33] Kelly AL, Passchier S. A sub-millennial sediment record of ice-stream retreat and meltwater storage in the Baltic Ice Lake during the Bølling-Allerød interstadial. Quat Sci Rev. 2018;198:126–39. 10.1016/j.quascirev.2018.08.018.Search in Google Scholar
[34] Wilczyński J, Krajcarz MT, Moskal-del Hoyo M, Alexandrowicz WP, Miękina B, Pereswiet-Soltan A, et al. Late Glacial and Holocene paleoecology and paleoenvironmental changes in the northern Carpathians foreland: The Żarska Cave (southern Poland) case study. Holocene. 2020;30:905–22. 10.1177/0959683620902220.Search in Google Scholar
[35] Żarczyński M, Szmańd J, Tylmann W. Grain-size distribution and structural characteristics of varved sediments from Lake Żabińskie (Northeastern Poland). Quaternary. 2019;2(1):8. 10.3390/quat2010008.Search in Google Scholar
[36] Klinik J. Texture of porosity solids. AGH, Ośrodek Edukacji Niestacjonarnej, Kraków; 2000.Search in Google Scholar
[37] Zhang L, Du C, Du Y, Xu M, Chen S, Liu H. Kinetic and isotherms studies of phosphorus adsorption onto natural riparian wetland sediments: linear and non-linear methods. Env Monit Assess. 2015;187:381. 10.1007/s10661-015-4621-4.Search in Google Scholar PubMed
[38] Hycnar E, Ratajczak T, Sęk M. The miocene lacustrine chalk from lignite bełchatów deposit (Poland) – Structural and textural character and SO2 sorption properties in the fluid combustion conditions. Minerals. 2021;11:572. 10.3390/min11060572.Search in Google Scholar
[39] Karunadasa KSP, Manorante CH, Pitawala HMTGA, Rajapakse RMG. Thermal decomposition of calcium carbonate (calcite polymorph) as examined by in-situ high-temperature X-ray powder diffraction. J Phys Chem Solids. 2019;134:21–8.10.1016/j.jpcs.2019.05.023Search in Google Scholar
[40] Apolinarska K, Woszczyk M, Obremska M. Late Weichselian and Holocene palaeoenvironmental changes in northern Poland based on the Lake Skrzynka record: Late Weichselian and Holocene palaeoenvironmental changes, N Poland. Boreas. 2012;41:292–307. 10.1111/j.1502-3885.2011.00235.x.Search in Google Scholar
[41] Zander PD, Żarczyński M, Vogel H, Tylmann W, Wacnik A, Sanchini A, et al. A high-resolution record of Holocene primary productivity and water-column mixing from the varved sediments of Lake Żabińskie, Poland. Sci Total Env. 2021;755:143713. 10.1016/j.scitotenv.2020.143713.Search in Google Scholar PubMed
[42] Sanchini A, Szidat S, Tylmann W, Vogel H, Wacnik A, Grosjean M. A Holocene high‐resolution record of aquatic productivity, seasonal anoxia and meromixis from varved sediments of Lake Łazduny, North‐Eastern Poland: insight from a novel multi‐proxy approach. J Quat Sci. 2020;35(8):1070–80. 10.1002/jqs.3242.Search in Google Scholar
[43] Horvatinčić N, Sironić A, Barešić J, Sondi I, Krajcar Bronić I, Borković D. Mineralogical, organic and isotopic composition as palaeoenvironmental records in the lake sediments of two lakes, the Plitvice Lakes, Croatia. Quat Int. 2018;494:300–13. 10.1016/j.quaint.2017.01.022.Search in Google Scholar
[44] White WB. The carbonate minerals. In: Farmer VC, editor. The infrared spectra of minerals. London: Mineralogical Society; 1974.Search in Google Scholar
[45] Liu X, Colman SM, Brown ET, Minor EC, Li H. Estimation of carbonate, total organic carbon, and biogenic silica content by FTIR and XRF techniques in lacustrine sediments. J Paleolimnol. 2013;50:387–98. 10.1007/s10933-013-9733-7.Search in Google Scholar
[46] Chidambaram S, Senthilkumar K, Prasanna MV, John Peter A, Ramanathan AL, Srinivasamoorthy K. A study on the hydrogeology and Hydro geochemistry of groundwater from different depths in a coastal aquifer, Annamalai Nagar,Tamilnadu, India. Env Geol. 2009;57(1):59–73. 10.1007/s00254-008-1282-4.Search in Google Scholar
[47] Rajkumar K, Ramanathan AL, Behera PN. Characterization of clay minerals in the Sundarban mangroves river sediments by SEM/EDS. J Geol Soc India. 2012;80:429–34. 10.1007/s12594-012-0161-5.Search in Google Scholar
[48] Sivakumar S, Ravisankar R, Raghu Y, Chandrasekaran A, Chandramohan J. FTIR spectroscopic studies on coastal sediment samples from Cuddalore District, Tamilnadu, India. Indian J Adv Chem Sci. 2021;1:40–6.Search in Google Scholar
[49] Mecozzi M, Pietrantonio E, Amici M, Romanelli G. Determination of carbonate in marine solid samples by FTIR-ATR spectroscopy. Analyst. 2001;126:144–6. 10.1039/B009031J.Search in Google Scholar
[50] Kanbar HJ, Tran Le T, Olajos F, Englund G, Holmboe M. Tracking mineral and geochemical characteristics of Holocene lake sediments: the case of Hotagen, west-central Sweden. J Soils Sediment. 2017;17(6):3150–68. 10.1007/s11368-021-03012-y.Search in Google Scholar
[51] Zawiska I, Apolinarska K, Woszczyk M. Holocene climate vs catchment forcing on a shallow, eutrophic lake in eastern Poland. Boreas. 2019;48(1):166–78. 10.1111/bor.12347.Search in Google Scholar
[52] Radulescu C, Bucurica IA, Bretcan P, Chelarescu ED, Tanislav D, Dulama ID, et al. Complex investigation of unconsolidated sediments of Romanian Plain salt lake. Rom J Phys. 2019;64:809.Search in Google Scholar
[53] Apolinarska K, Gałka M. Detrital input to spring-fed fen deposits – a problem or an opportunity in palaeoenvironmental studies? A Holocene palaeoclimatic reconstruction from central Europe: DETRITAL INPUT TO SPRING-FED FEN DEPOSITS. J Quat Sci. 2017;32(1):91–103. 10.1002/jqs.2926.Search in Google Scholar
[54] de Oca-Palma RM, Solache-Ríos M, Jiménez-Reyes M, García-Sánchez JJ, Almazán-Sánchez PT. Adsorption of cobalt by using inorganic components of sediment samples from water bodies. Int J Sediment Res. 2021;36(4):524–31. 10.1016/j.ijsrc.2020.11.003.Search in Google Scholar
[55] Pedley M, Andrews J, Ordonez S, del Cura MAG, Martin J-AG, Taylor D. Does climate control the morphological fabric of freshwater carbonates? A comparative study of Holocene barrage tufas from Spain and Britain. Palaeogeogr Palaeoclimatol Palaeoecol. 1996;121(3–4):239–57. 10.1016/0031-0182(95)00080-1.Search in Google Scholar
© 2023 the author(s), published by De Gruyter
This work is licensed under the Creative Commons Attribution 4.0 International License.
Articles in the same Issue
- Research Articles
- Value-added utilization of coal fly ash and recycled polyvinyl chloride in door or window sub-frame composites
- High removal efficiency of volatile phenol from coking wastewater using coal gasification slag via optimized adsorption and multi-grade batch process
- Evolution of surface morphology and properties of diamond films by hydrogen plasma etching
- Removal efficiency of dibenzofuran using CuZn-zeolitic imidazole frameworks as a catalyst and adsorbent
- Rapid and efficient microwave-assisted extraction of Caesalpinia sappan Linn. heartwood and subsequent synthesis of gold nanoparticles
- The catalytic characteristics of 2-methylnaphthalene acylation with AlCl3 immobilized on Hβ as Lewis acid catalyst
- Biodegradation of synthetic PVP biofilms using natural materials and nanoparticles
- Rutin-loaded selenium nanoparticles modulated the redox status, inflammatory, and apoptotic pathways associated with pentylenetetrazole-induced epilepsy in mice
- Optimization of apigenin nanoparticles prepared by planetary ball milling: In vitro and in vivo studies
- Synthesis and characterization of silver nanoparticles using Origanum onites leaves: Cytotoxic, apoptotic, and necrotic effects on Capan-1, L929, and Caco-2 cell lines
- Exergy analysis of a conceptual CO2 capture process with an amine-based DES
- Construction of fluorescence system of felodipine–tetracyanovinyl–2,2′-bipyridine complex
- Excellent photocatalytic degradation of rhodamine B over Bi2O3 supported on Zn-MOF nanocomposites under visible light
- Optimization-based control strategy for a large-scale polyhydroxyalkanoates production in a fed-batch bioreactor using a coupled PDE–ODE system
- Effectiveness of pH and amount of Artemia urumiana extract on physical, chemical, and biological attributes of UV-fabricated biogold nanoparticles
- Geranium leaf-mediated synthesis of silver nanoparticles and their transcriptomic effects on Candida albicans
- Synthesis, characterization, anticancer, anti-inflammatory activities, and docking studies of 3,5-disubstituted thiadiazine-2-thiones
- Synthesis and stability of phospholipid-encapsulated nano-selenium
- Putative anti-proliferative effect of Indian mustard (Brassica juncea) seed and its nano-formulation
- Enrichment of low-grade phosphorites by the selective leaching method
- Electrochemical analysis of the dissolution of gold in a copper–ethylenediamine–thiosulfate system
- Characterisation of carbonate lake sediments as a potential filler for polymer composites
- Evaluation of nano-selenium biofortification characteristics of alfalfa (Medicago sativa L.)
- Quality of oil extracted by cold press from Nigella sativa seeds incorporated with rosemary extracts and pretreated by microwaves
- Heteropolyacid-loaded MOF-derived mesoporous zirconia catalyst for chemical degradation of rhodamine B
- Recovery of critical metals from carbonatite-type mineral wastes: Geochemical modeling investigation of (bio)hydrometallurgical leaching of REEs
- Photocatalytic properties of ZnFe-mixed oxides synthesized via a simple route for water remediation
- Attenuation of di(2-ethylhexyl)phthalate-induced hepatic and renal toxicity by naringin nanoparticles in a rat model
- Novel in situ synthesis of quaternary core–shell metallic sulfide nanocomposites for degradation of organic dyes and hydrogen production
- Microfluidic steam-based synthesis of luminescent carbon quantum dots as sensing probes for nitrite detection
- Transformation of eggshell waste to egg white protein solution, calcium chloride dihydrate, and eggshell membrane powder
- Preparation of Zr-MOFs for the adsorption of doxycycline hydrochloride from wastewater
- Green nanoarchitectonics of the silver nanocrystal potential for treating malaria and their cytotoxic effects on the kidney Vero cell line
- Carbon emissions analysis of producing modified asphalt with natural asphalt
- An efficient and green synthesis of 2-phenylquinazolin-4(3H)-ones via t-BuONa-mediated oxidative condensation of 2-aminobenzamides and benzyl alcohols under solvent- and transition metal-free conditions
- Chitosan nanoparticles loaded with mesosulfuron methyl and mesosulfuron methyl + florasulam + MCPA isooctyl to manage weeds of wheat (Triticum aestivum L.)
- Synergism between lignite and high-sulfur petroleum coke in CO2 gasification
- Facile aqueous synthesis of ZnCuInS/ZnS–ZnS QDs with enhanced photoluminescence lifetime for selective detection of Cu(ii) ions
- Rapid synthesis of copper nanoparticles using Nepeta cataria leaves: An eco-friendly management of disease-causing vectors and bacterial pathogens
- Study on the photoelectrocatalytic activity of reduced TiO2 nanotube films for removal of methyl orange
- Development of a fuzzy logic model for the prediction of spark-ignition engine performance and emission for gasoline–ethanol blends
- Micro-impact-induced mechano-chemical synthesis of organic precursors from FeC/FeN and carbonates/nitrates in water and its extension to nucleobases
- Green synthesis of strontium-doped tin dioxide (SrSnO2) nanoparticles using the Mahonia bealei leaf extract and evaluation of their anticancer and antimicrobial activities
- A study on the larvicidal and adulticidal potential of Cladostepus spongiosus macroalgae and green-fabricated silver nanoparticles against mosquito vectors
- Catalysts based on nickel salt heteropolytungstates for selective oxidation of diphenyl sulfide
- Powerful antibacterial nanocomposites from Corallina officinalis-mediated nanometals and chitosan nanoparticles against fish-borne pathogens
- Removal behavior of Zn and alkalis from blast furnace dust in pre-reduction sinter process
- Environmentally friendly synthesis and computational studies of novel class of acridinedione integrated spirothiopyrrolizidines/indolizidines
- The mechanisms of inhibition and lubrication of clean fracturing flowback fluids in water-based drilling fluids
- Adsorption/desorption performance of cellulose membrane for Pb(ii)
- A one-pot, multicomponent tandem synthesis of fused polycyclic pyrrolo[3,2-c]quinolinone/pyrrolizino[2,3-c]quinolinone hybrid heterocycles via environmentally benign solid state melt reaction
- Green synthesis of silver nanoparticles using durian rind extract and optical characteristics of surface plasmon resonance-based optical sensor for the detection of hydrogen peroxide
- Electrochemical analysis of copper-EDTA-ammonia-gold thiosulfate dissolution system
- Characterization of bio-oil production by microwave pyrolysis from cashew nut shells and Cassia fistula pods
- Green synthesis methods and characterization of bacterial cellulose/silver nanoparticle composites
- Photocatalytic research performance of zinc oxide/graphite phase carbon nitride catalyst and its application in environment
- Effect of phytogenic iron nanoparticles on the bio-fortification of wheat varieties
- In vitro anti-cancer and antimicrobial effects of manganese oxide nanoparticles synthesized using the Glycyrrhiza uralensis leaf extract on breast cancer cell lines
- Preparation of Pd/Ce(F)-MCM-48 catalysts and their catalytic performance of n-heptane isomerization
- Green “one-pot” fluorescent bis-indolizine synthesis with whole-cell plant biocatalysis
- Silica-titania mesoporous silicas of MCM-41 type as effective catalysts and photocatalysts for selective oxidation of diphenyl sulfide by H2O2
- Biosynthesis of zinc oxide nanoparticles from molted feathers of Pavo cristatus and their antibiofilm and anticancer activities
- Clean preparation of rutile from Ti-containing mixed molten slag by CO2 oxidation
- Synthesis and characterization of Pluronic F-127-coated titanium dioxide nanoparticles synthesized from extracts of Atractylodes macrocephala leaf for antioxidant, antimicrobial, and anticancer properties
- Effect of pretreatment with alkali on the anaerobic digestion characteristics of kitchen waste and analysis of microbial diversity
- Ameliorated antimicrobial, antioxidant, and anticancer properties by Plectranthus vettiveroides root extract-mediated green synthesis of chitosan nanoparticles
- Microwave-accelerated pretreatment technique in green extraction of oil and bioactive compounds from camelina seeds: Effectiveness and characterization
- Studies on the extraction performance of phorate by aptamer-functionalized magnetic nanoparticles in plasma samples
- Investigation of structural properties and antibacterial activity of AgO nanoparticle extract from Solanum nigrum/Mentha leaf extracts by green synthesis method
- Green fabrication of chitosan from marine crustaceans and mushroom waste: Toward sustainable resource utilization
- Synthesis, characterization, and evaluation of nanoparticles of clodinofop propargyl and fenoxaprop-P-ethyl on weed control, growth, and yield of wheat (Triticum aestivum L.)
- The enhanced adsorption properties of phosphorus from aqueous solutions using lanthanum modified synthetic zeolites
- Separation of graphene oxides of different sizes by multi-layer dialysis and anti-friction and lubrication performance
- Visible-light-assisted base-catalyzed, one-pot synthesis of highly functionalized cinnolines
- The experimental study on the air oxidation of 5-hydroxymethylfurfural to 2,5-furandicarboxylic acid with Co–Mn–Br system
- Highly efficient removal of tetracycline and methyl violet 2B from aqueous solution using the bimetallic FeZn-ZIFs catalyst
- A thermo-tolerant cellulase enzyme produced by Bacillus amyloliquefaciens M7, an insight into synthesis, optimization, characterization, and bio-polishing activity
- Exploration of ketone derivatives of succinimide for their antidiabetic potential: In vitro and in vivo approaches
- Ultrasound-assisted green synthesis and in silico study of 6-(4-(butylamino)-6-(diethylamino)-1,3,5-triazin-2-yl)oxypyridazine derivatives
- A study of the anticancer potential of Pluronic F-127 encapsulated Fe2O3 nanoparticles derived from Berberis vulgaris extract
- Biogenic synthesis of silver nanoparticles using Consolida orientalis flowers: Identification, catalytic degradation, and biological effect
- Initial assessment of the presence of plastic waste in some coastal mangrove forests in Vietnam
- Adsorption synergy electrocatalytic degradation of phenol by active oxygen-containing species generated in Co-coal based cathode and graphite anode
- Antibacterial, antifungal, antioxidant, and cytotoxicity activities of the aqueous extract of Syzygium aromaticum-mediated synthesized novel silver nanoparticles
- Synthesis of a silica matrix with ZnO nanoparticles for the fabrication of a recyclable photodegradation system to eliminate methylene blue dye
- Natural polymer fillers instead of dye and pigments: Pumice and scoria in PDMS fluid and elastomer composites
- Study on the preparation of glycerylphosphorylcholine by transesterification under supported sodium methoxide
- Wireless network handheld terminal-based green ecological sustainable design evaluation system: Improved data communication and reduced packet loss rate
- The optimization of hydrogel strength from cassava starch using oxidized sucrose as a crosslinking agent
- Green synthesis of silver nanoparticles using Saccharum officinarum leaf extract for antiviral paint
- Study on the reliability of nano-silver-coated tin solder joints for flip chips
- Environmentally sustainable analytical quality by design aided RP-HPLC method for the estimation of brilliant blue in commercial food samples employing a green-ultrasound-assisted extraction technique
- Anticancer and antimicrobial potential of zinc/sodium alginate/polyethylene glycol/d-pinitol nanocomposites against osteosarcoma MG-63 cells
- Nanoporous carbon@CoFe2O4 nanocomposite as a green absorbent for the adsorptive removal of Hg(ii) from aqueous solutions
- Characterization of silver sulfide nanoparticles from actinobacterial strain (M10A62) and its toxicity against lepidopteran and dipterans insect species
- Phyto-fabrication and characterization of silver nanoparticles using Withania somnifera: Investigating antioxidant potential
- Effect of e-waste nanofillers on the mechanical, thermal, and wear properties of epoxy-blend sisal woven fiber-reinforced composites
- Magnesium nanohydroxide (2D brucite) as a host matrix for thymol and carvacrol: Synthesis, characterization, and inhibition of foodborne pathogens
- Synergistic inhibitive effect of a hybrid zinc oxide-benzalkonium chloride composite on the corrosion of carbon steel in a sulfuric acidic solution
- Review Articles
- Role and the importance of green approach in biosynthesis of nanopropolis and effectiveness of propolis in the treatment of COVID-19 pandemic
- Gum tragacanth-mediated synthesis of metal nanoparticles, characterization, and their applications as a bactericide, catalyst, antioxidant, and peroxidase mimic
- Green-processed nano-biocomposite (ZnO–TiO2): Potential candidates for biomedical applications
- Reaction mechanisms in microwave-assisted lignin depolymerisation in hydrogen-donating solvents
- Recent progress on non-noble metal catalysts for the deoxydehydration of biomass-derived oxygenates
- Rapid Communication
- Phosphorus removal by iron–carbon microelectrolysis: A new way to achieve phosphorus recovery
- Special Issue: Biomolecules-derived synthesis of nanomaterials for environmental and biological applications (Guest Editors: Arpita Roy and Fernanda Maria Policarpo Tonelli)
- Biomolecules-derived synthesis of nanomaterials for environmental and biological applications
- Nano-encapsulated tanshinone IIA in PLGA-PEG-COOH inhibits apoptosis and inflammation in cerebral ischemia/reperfusion injury
- Green fabrication of silver nanoparticles using Melia azedarach ripened fruit extract, their characterization, and biological properties
- Green-synthesized nanoparticles and their therapeutic applications: A review
- Antioxidant, antibacterial, and cytotoxicity potential of synthesized silver nanoparticles from the Cassia alata leaf aqueous extract
- Green synthesis of silver nanoparticles using Callisia fragrans leaf extract and its anticancer activity against MCF-7, HepG2, KB, LU-1, and MKN-7 cell lines
- Algae-based green AgNPs, AuNPs, and FeNPs as potential nanoremediators
- Green synthesis of Kickxia elatine-induced silver nanoparticles and their role as anti-acetylcholinesterase in the treatment of Alzheimer’s disease
- Phytocrystallization of silver nanoparticles using Cassia alata flower extract for effective control of fungal skin pathogens
- Antibacterial wound dressing with hydrogel from chitosan and polyvinyl alcohol from the red cabbage extract loaded with silver nanoparticles
- Leveraging of mycogenic copper oxide nanostructures for disease management of Alternaria blight of Brassica juncea
- Nanoscale molecular reactions in microbiological medicines in modern medical applications
- Synthesis and characterization of ZnO/β-cyclodextrin/nicotinic acid nanocomposite and its biological and environmental application
- Green synthesis of silver nanoparticles via Taxus wallichiana Zucc. plant-derived Taxol: Novel utilization as anticancer, antioxidation, anti-inflammation, and antiurolithic potential
- Recyclability and catalytic characteristics of copper oxide nanoparticles derived from bougainvillea plant flower extract for biomedical application
- Phytofabrication, characterization, and evaluation of novel bioinspired selenium–iron (Se–Fe) nanocomposites using Allium sativum extract for bio-potential applications
- Erratum
- Erratum to “Synthesis, characterization, and evaluation of nanoparticles of clodinofop propargyl and fenoxaprop-P-ethyl on weed control, growth, and yield of wheat (Triticum aestivum L.)”