Synergism between lignite and high-sulfur petroleum coke in CO2 gasification
-
Lirui Mao
 ,
Yanlin Zhao
,
Yanlin Zhao

Abstract
High-sulfur petroleum coke (PC) as solid waste has high treatment cost. Gasification technology can utilize PC and lignite for co-gasification. Organically combining the two is the key to expanding the adaptability of gasification raw materials. This work used thermal analysis technology to study the gasification reaction of PC and lignite systems in a CO2 atmosphere. The results show that the starting and end temperatures of the co-gasification of lignite/high-sulfur PC are lower than those of pure coke. The improved carbonization rate and gasification reaction index indicate that lignite improves the gasification performance. The gasification synergy factors are all greater than 1, indicating that the co-gasification process produces obvious synergism, and the synergism is more obvious in the gasification stage after 800°C. The lignite ash is gradually enriched on the surface of high-sulfur PC with the temperature increase, and the Ca and Fe elements have an obvious catalytic effect, but the catalytic effect has a saturation value. Ashes from lignite used as a multi-component gasification catalyst can increase the overall reactivity in the lignite/high-sulfur PC system, which can broaden the selection of gasification raw materials, and make efficient use of the resource characteristics of both.
Abbreviations
- DTG
-
differential thermal gravity
- ML
-
Meihekou lignite
- PC
-
petroleum coke
- R
-
reactivity index
- SEM-EDX
-
scanning electron microscopy/energy-dispersive X-ray technique
- SF
-
synergy factor
- TG
-
thermal gravity
- TGA
-
thermal gravimetric analyzer
- X
-
conversion rate
1 Introduction
As China’s reliance on foreign oil and processing of imported high-sulfur crude oil increases, the total amount of high-sulfur petroleum coke (PC) will increase. Carbon, the main element of PC, accounts for more than 80%. The remaining elements are hydrogen, oxygen, ammonia, sulfur, and metals. PC can be divided into high-sulfur coke (sulfur >3%) and low-sulfur coke (sulfur <3%), with high-sulfur PC being treated as solid waste at high cost. PC, despite its potential as a fossil fuel, has not been widely utilized in China [1,2]. As a result, research has focused on how to utilize high-sulfur with low cost and high cleanliness.
Theoretically, gasification technology, an advanced method for clean and efficient energy conversion, can transform PC into gaseous raw materials. However, due to its high graphitization, small specific surface area, and low ash content, the gasification reaction activity of PC is poor. At the same time, lignite comprises a significant portion of China’s coal resources. As lignite has a low thermal efficiency of direct combustion due to its low calorific value and high moisture content, it is not used as a gasification raw material in most entrained flow gasifiers. Among the soot species of various coal ranks, lignite has the highest gasification reaction activity due to the formation of lignite with more curved graphene layers and a higher amorphous carbon content [3].
Currently, some academics have analyzed the PC gasification process. Low gasification activity results from the dense structure, underdeveloped pores, low ash, and volatile PC content. The two stages of PC gasification are pyrolysis and carbon gasification. The char gasification process is the rate-controlling step of the PC gasification reaction. PC has a smoother surface morphology and a higher degree of graphitization than coal coke, and its gasification reactivity is significantly lower than that of coal coke [4]. Wei et al. [5] found that the degree of graphitization, surface density, and pore structure determine the gasification reactivity of various PCs. Wu et al. [6] compared the differences in physical properties between coal char and PC, and the results showed that the specific surface area of PC increased with temperature, which is advantageous for its gasification reaction. Li et al. [7] investigated the location of the active groups of PC during the drop tube furnace’s gasification process. They observed that relatively ordered coke structures have energy barriers, which transform the ordered graphitic carbon structure into the amorphous carbon structure at 1,200°C. In addition, the high temperature facilitates the transformation of oxygen-containing functional groups into hydroxyl groups. Therefore, although PC has excellent properties of high heating value and low ash content, its low gasification reactivity makes it a difficult feedstock for gasification [8].
Numerous researchers have co-processed biomass, catalyst, and coal with PC to better exploit its potential for gasification. The ash in biomass can catalyze the gasification of PC during the co-gasification of biomass and PC [9,10]. Co-gasification of PC and biomass is a promising method for combining the benefits of different gasification feedstocks with syngas production. It is necessary to comprehend the differences in the gasification behavior between PC (also known as pet coke) and other fuels (coal or biomass) [11]. The synergistic behavior of the co-gasification reaction varies as the reaction proceeds. The synergistic mechanism of co-gasification has a strong relationship with the migration and transfer of free radicals and the intrinsic metal. There are certain limitations and challenges in this field of research [12].
In addition, traditional gasification industrial production is typically conducted under high temperatures and pressure. These harsh conditions will result in increased energy consumption and operational dangers. Catalytic gasification accelerates process speed, increases carbon conversion rate, decreases process temperature, and decreases energy consumption [13,14,15]. Numerous researchers have examined the effect of catalysts on PC gasification and the catalytic mechanism in depth. It is also noted that NaAlO2 can effectively enhance the gasification reaction activity of PC, whereas the catalytic effect of MgO, Fe2O3, CaO, and Fe3O4 at lower temperatures is not readily apparent. The activation of NaAlO2 is relatively stable as the temperature rises, making it an ideal catalyst for the high-temperature gasification of PC [16]. Similarly, Lv et al. [17] synthesized iron-based spent catalysts with inexpensive additive F-T, an efficient PC gasification catalyst that can reduce the activation energy of gasification. The spent catalyst containing iron induces more activated carbon sites on the surface of PC, resulting in the formation of more oxygen-containing intermediates. Iron’s cyclic redox reaction can act as an oxygen carrier to speed up the reaction of CO2 with carbon.
Li et al. [18] conducted the PC and coal co-gasification reaction, and found that co-gasification with low-rank coal can increase the reaction rate of PC gasification. The synergistic effect is due to the catalysis of alkali and alkaline earth metals in coal ash. Ren et al. [19] studied the synergistic effect of PC, coal, and coal liquefaction residues in the co-gasification process. The results showed that the increasing proportion of coal enhances the synergistic effect of co-gasification of PC and coal/coal liquefaction residue. As the degree of coal metamorphism increases, the synergy in the co-gasification process gradually weakens, and low-rank coal and coal liquefaction residues produce better results when co-gasified with PC. The high content of catalytic components such as calcium and iron in coal facilitates co-gasification with PC, and minerals play a central role in the co-gasification process. Active components, such as Fe2O3/CaO, have a catalytic effect, whereas inert components, such as Al2O3/SiO2, have no catalytic effect and even have adverse effects [20,21].
This article describes the co-processing of PC and lignite as gasification feedstocks. Based on the properties of PC and low-rank coal, co-gasification will become a more effective method for enhancing the low reactivity of PC. Co-gasification of coal and PC compensates for the shortcomings of their respective gasification processes from an environmental and economic standpoint. On the one hand, lignite is more reactive due to its greater alkalinity and larger surface area. On the other hand, PC, a high-carbon material, is added to low-rank coal to increase its carbon content effectively.
In conclusion, the physical and chemical characteristics of coal and PC are comparable. The co-gasification of PC and lignite can provide a new avenue for utilizing low-quality resources. In addition, the combination of the two is the key to expanding the adaptability of feedstocks for gasification. However, it is unclear whether there exists interaction, especially synergism between PC and lignite in the process of co-gasification. Moreover, the mechanism of the interaction needs further research. In this work, the synergistic effect and synergy mechanism between lignite and high-sulfur PC in CO2 gasification were investigated.
2 Experiments
2.1 Experimental raw materials
Table 1 shows the industrial and elemental composition of high-sulfur PC and Meihekou lignite (ML). Table 2 displays the chemical composition of the two samples’ ash following combustion. PC is a residual byproduct of carbonaceous solids in the refining process, containing primarily high concentrations of fixed carbon and sulfur. High levels of moisture and volatile substances are present in ML. The silicon and aluminum content of PC is relatively high, accounting for 63.42% of ash, while basic components are low, accounting for less than 20%. Fe2O3 and CaO comprise 40.38% of ML coal ash, while silicon and aluminum comprise 35.14% of PC coal ash; the content of Fe2O3 and CaO in ML coal ash was significantly greater than that in PC.
Proximate and ultimate analysis of samples (wt%)
| Samples | Proximate analysis (wt%) | Ultimate analysis (wt%) | |||||||
|---|---|---|---|---|---|---|---|---|---|
| M ad | A ad | V ad | FCad | C ad | H ad | O ad | N ad | S t,ad | |
| PC | 0.22 | 0.23 | 9.99 | 89.56 | 84.65 | 3.68 | 4.58 | 1.44 | 5.20 |
| ML | 8.60 | 11.83 | 45.53 | 34.04 | 54.95 | 3.94 | 17.64 | 1.24 | 1.80 |
Analysis of chemical composition of ash (wt%)
| Samples | SiO2 | Al2O3 | Fe2O3 | CaO | MgO | TiO2 | K2O | Na2O | P2O5 | MnO2 | SO3 |
|---|---|---|---|---|---|---|---|---|---|---|---|
| PC | 42.66 | 20.76 | 7.96 | 11.99 | 0.90 | 0.70 | 0.85 | 0.80 | 0.25 | 0.41 | 12.74 |
| ML | 20.16 | 14.98 | 17.33 | 23.05 | 3.40 | 0.83 | 0.68 | 0.01 | 0.23 | 0.09 | 19.24 |
2.2 Experimental instruments and methods
2.2.1 Sample preparation
All samples were dried at 105°C until there was no mass loss. The PC and ML mixtures were weighed in certain ratios (10:0, 7:3, 5:5, 3:7, and 0:10) and ground together in deionized water. After grinding, the product was dried at 105°C until there was no mass loss, with sample particle sizes ranging from 83–165 μm. In the same configuration, a certain proportion of CaO and Fe2O3 were added to the PC.
2.2.2 Thermal analysis experiment and coke appearance
The thermogravimetric analyzer (TGA, NETZSCH STA 449F3, Germany) is used to conduct the gasification experiments. The mass of the sample is approximately 20 mg, the heating temperature range is 25–1,400°C, the heating rate is 15°C·min−1, and the reaction gas is CO2 (100 mL·min−1). To ensure the experiment’s accuracy and reproducibility, a single experiment with the same sample was repeated at least three times under identical conditions. The apparent morphology and microchemistry of the pyrolysis residue of the lignite/high-sulfur PC system at 900°C were analyzed by SEM-EDX (Tescan VEGA3 SBH-BRUKER XFlash 6|30, Germany). Spread the sample evenly across the conductive adhesive, apply the conductive film, and place it in the sample chamber. The surface characteristics of the sample were analyzed at various rates, and the local positions were mapped to determine the characteristics of the element distribution. Conversion rate calculation method is as follows:
where X represents the conversion rate, %; m 0 is the original mass of coal without mass loss, mg; m t corresponds to the mass from weightlessness to a certain moment, mg; m end is the mass of the ash content of the sample without mass loss, mg;
After the two samples are evenly mixed in a certain proportion, the formula for calculating the theoretical mass loss of the mixed fuel by pyrolysis and gasification is as follows:
where X c is the theoretical mass loss, %; k 1 and k 2 represent the mass fraction of PC and coal in the mixed sample, respectively, %; X 1t and X 2t represent the experimental value of the change in the quality of a single sample of PC and coal with time, %. The theoretical mass loss rate uses a similar calculation method.
Reactivity index calculation method:
where R 0.5 is the reactivity index, min−1; t 0.5 is the gasification time when the carbon conversion rate reaches 50%, min. Where t 0.5 refers to the time to reach 50% mass loss at the same heating rate. R 0.5 is the gasification reaction activity index, indicating the strength of the char reaction activity; the larger the value, the stronger the gasification reactivity of the mixed sample.
Note: The range of R 0.5 required in this article is between 0.005 and 0.040. In order to facilitate data processing and comparison, this study will multiply the required R 0.5 by 103 for processing.
For further synergistic effect studies, the synergy factor (SF) was used for comparison.
where R 0.5–Exp, R 0.9–Cal, R 0.5–Exp, and R 0.9–Cal represent the experimental and calculated reactivity index values, respectively. A higher SF value means a more significant synergistic effect.
3 Results and discussion
3.1 Synergistic effect between lignite and high-sulfur PC in co-gasification
In this section, thermal analysis technology is used to study the change in mass loss during the co-gasification of lignite and high-sulfur PC. The experimental and calculated TG/DTG curves are compared to study the synergistic effect of PC and ML mixture in the co-gasification process.
3.1.1 Analysis of co-gasification thermal analysis curve
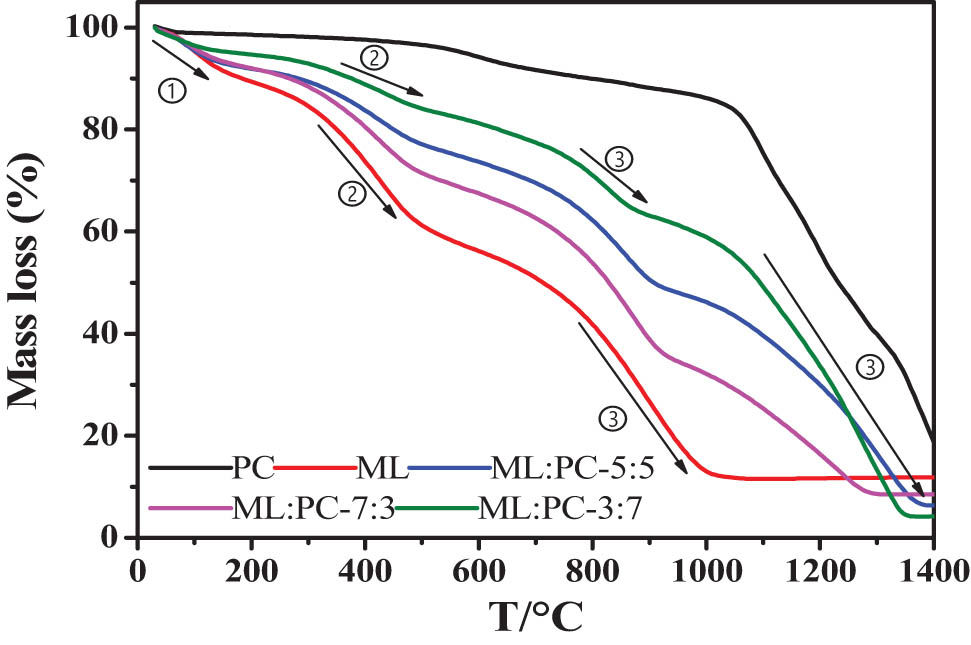
The effects of different ML/PC ratios on the co-gasification process were investigated in this section, and the results are presented below. Figure 1 depicts the TG mass loss curves of various samples, while Figure 2 depicts the DTG mass loss rate curves of various samples. To investigate the influence of ML/PC mixing ratio on co-gasification reactivity, the following mixing ratios were chosen: 10:0, 7:3, 5:5, 3:7, and 0:10. In general, the gasification process consists of three phases: drying, pyrolysis, and gasification of the remaining coke, and the remaining coke gasification process is the limiting step in the overall reaction [21].
Curves of ML/PC co-gasification.

DTG curves of ML/PC co-gasification.
As illustrated in Figures 1 and 2, stage 1 is the dehydration stage, stage 2 is the devolatilization and pyrolysis stage, and stage 3 is the gasification process stage. The overall reaction has concluded, and the ratio of ML’s mass loss rate to that of PC is greater. The volatile content of lignite is greater than that of PC, resulting in significant devolatilization and pyrolysis at temperatures between 300°C and 500°C. The PC samples were weakly devolatilized and pyrolyzed at 600–700°C, and the mass loss of PC at this stage (6%) was less than that of lignite coal (approximately 25%). The mass loss of the ML gasification process is approximately 30%, while the PC gasification process is incomplete, with two mass loss peaks between 1,000°C and 1,200°C. The residual ash content of co-gasification is lower than that of PC and ML after gasification alone, indicating that a synergistic effect promotes the continued reaction of unreacted carbon during the co-gasification stage.
According to the peak shape of the DTG curves of pure ML, PC, and ML–PC co-gasification, the highest mass loss peak of the DTG curve of the ML–PC mixture lies between the highest mass loss peak of pure ML and PC. At 800°C, ML has the highest gasification rate, while PC has the highest rate at 1,200°C. The mass loss rate curve of co-gasification of ML and PC in gasification stage is slightly bimodal, with the first peak occurring around 850°C, which corresponds to the ML coal gasification stage; the second peak occurs between 1,200°C and 1,300°C, which corresponds to the PC gasification stage. The initial gasification stage (step 3: 600–1,000°C) is primarily caused by the ML gasification stage, which exhibits a sharp peak for ML and a broad peak for PC. With total ML consumption, the peak shape is smooth, whereas PC exhibits sharp peaks; therefore, the second gasification stage (step 4: 1,000–1,400°C) is dominated by the reaction of residual PC. Lignite is more reactive than ML and PC during co-gasification, so its gasification reaction concludes at a lower temperature. At the high temperature stage of the gasification process, the ML residues catalyzed PC, significantly enhancing its reactivity.
3.1.2 Co-gasification characteristic parameters
The TG curve obtained from the thermogravimetric experiment shows that T i is the temperature at which mass loss begins in the gasification stage, and T f is the temperature at which the mass loss ends in the gasification stage. Figure 3a shows the characteristic parameters of the co-gasification process. The mixing ratio significantly affects the co-gasification reactivity of PC and coal. The T i and T f values of the mixture are slightly higher than that of the single ML coal, about 300°C higher. This is mainly due to the lower volatile matter and higher fixed carbon content in PC, which requires a higher temperature for the reaction. The high mixing ratio of ML:PC improves the co-gasification reactivity. The gasification starting temperature of co-gasification is lower than that of pure PC, and the temperature at the end of gasification is also lower than that of pure PC. Figure 3b presents the reactivity (R) of the single and blends. The greater the reactivity index R 0.5 = 0.5/t 0.5, the better the reactivity. The R 0.5 of pure PC is 6.21 min−1, and the carbon conversion rate has not reached 90% at 1,400°C; the R 0.5 of ML:PC-7:3, 5:5, and 3:7 are 9.7, 8.79, and 7.09 min−1, respectively; due to the addition of ML, the reactivity is increased by 3.49, 2.58, 0.88 min−1, and the R 0.9 are 11.61, 10.57, 10.53, respectively. It can be found that the reactivity index increases with the increase in the mixing amount of ML coal. It is concluded that the reactivity of PC can be enhanced by co-gasification with ML, and the co-gasification reactivity increases as the mixing ratio of ML:PC increases.
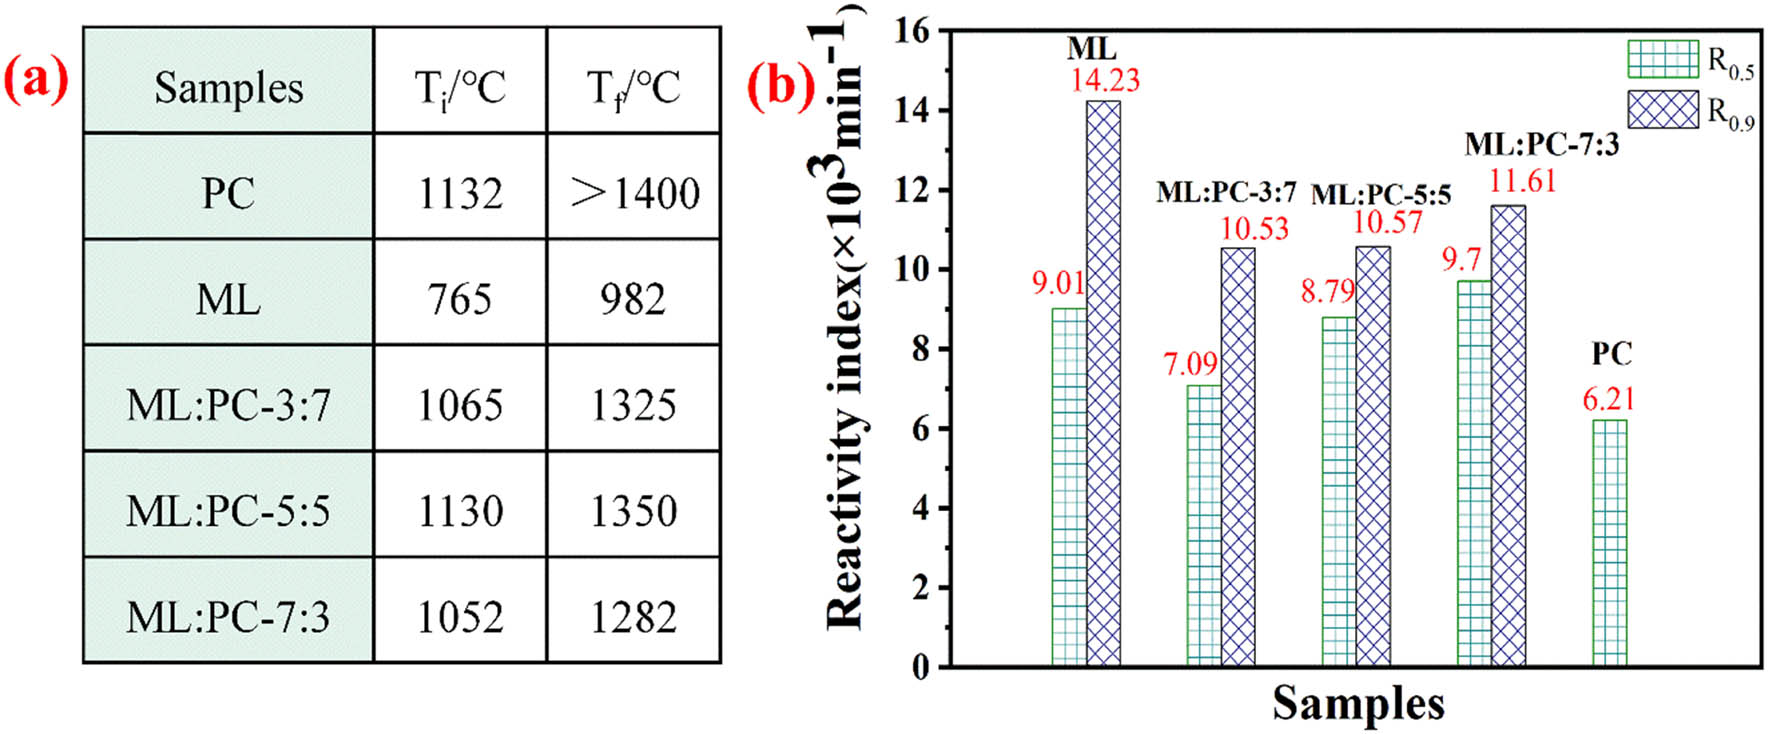
Reactivity of ML/PC gasification: (a) characteristic data, (b) reactivity index.
3.1.3 Co-gasification synergistic effect analysis
By comparing the experimental and calculated TG/DTG curves and the SF, the synergistic effect of PC and ML mixtures during CO2 co-gasification is investigated. The experimental and calculated TG/DTG curves are compared in Figure 4. When the ML:PC ratio is 3:7, Figure 4a reveals that the mass loss in the gasification stage dominated by ML is approximately 10%; the mass loss in the gasification stage dominated by PC is approximately 50%, which is approximately 5% greater than the theoretical mass loss. When the ratio of ML to PC is 5:5, the mass loss in the gasification stage dominated by ML is approximately 20% and the mass loss in the gasification stage dominated by PC is approximately 40%, which is approximately 3% greater than the theoretical mass loss. When the ML:PC ratio is 7:3, the ML-based coal gasification stage mass decreases by approximately 30% and the PC-based DE gasification stage mass decreases by approximately 25%, which is approximately 5% more than the theoretical mass loss.

ML/PC co-gasification TG calculated value and experimental value curve: (a) experimental and calculated TG curves, (b) synergy factor, (c) experimental and calculated DTG curves of ML:PC-5:5, (d) experimental and calculated DTG curves of ML:PC-7:3, (e) experimental and calculated DTG curves of ML:PC-3:7.
Figure 4b points out that the SF of ML and PC mixed gasification at the ratio of 7:3, 5:5, and 3:7 is all greater than 1, and all have obvious synergistic effects. The mixture with ML:PC ratio of 3:7 has the lowest SF value (SF0.5 = 1.08, SF0.9 = 1.07), and there is a slight synergistic effect of the mixture with ML:PC ratio of 3:7. The SF value of a mixture with an ML:PC ratio of 5:5 is close to that of a ML:PC ratio of 7:3 (SF0.5 = 1.15, SF0.9 = 1.06); for the SF value of the mixture with ML:PC ratio of 7:3 (SF0.5 = 1.16, SF0.9 = 1.07), a clear synergistic effect was observed (SF was significantly higher than 1).
Figure 4c–e shows the comparison results of the experimental and calculated DTG curves for the co-gasification of ML and PC at 3:7, 5:5, and 7:3 ratios. There is a deviation between the calculated and experimental values in the co-gasification stage mixed with different ratios, that is, the interaction. Moreover, the synergistic effect becomes more obvious in the gasification stage after 800°C. In the temperature region before 700°C, it is observed that the calculated and experimental DTG curves almost overlap, and there is no synergistic effect, indicating that the synergistic effect mainly occurs in the high-temperature stage [22]. The main reasons for the synergistic effect are: (1) the high reactivity of ML and high content of volatile substances in ML coal; (2) the catalysis of alkali metals (such as Mg, Fe, and Ca) in ML and PC [23].
3.2 Synergy mechanism of lignite/high-sulfur PC co-gasification
3.2.1 Effect of ML coal ash on gasification of PC
In order to verify the possible role of minerals in coal ash in co-gasification, 5%, 10%, 20%, and 30% ML lignite ash was added to PC to study the co-gasification mechanism. Figure 5 is the gasification TG-DTG curves of different lignite ash and PC.

TG-DTG curves of PC with different contents of ML ash: (a) TG curves, (b) DTG curves, (c) TG curves between 1,000˚C and 1,400˚C, (d) DTG curves between 1,000˚C and 1,400˚C, (e) synergy factor.
The termination temperature is lowest (1,210°C) when the additional amount of ML ash is 20%; it is 1,292°C when the additional amount of ML ash is 5%; it is 1,265°C when the additional amount of ML ash is 10%; and it is 1,246°C when the additional amount of ML ash is 30%. Individual PC has not completed the reaction at 1,400°C, and the gasification termination temperature is 1,200–1,300°C after adding varying amounts of coal ash, which significantly reduces the gasification termination temperature of PC, thereby enhancing its gasification reactivity. The temperature corresponding to the maximum mass loss rate of the DTG curve is lower as the amount of coal ash addition increases than the temperature corresponding to the maximum mass loss rate of PC gasification alone. The temperature at which 20% of lignite ash is added is 100°C lower than that of pure PC, and 20% of lignite ash can significantly improve the gasification reactivity of PC (Figure 5a and b).
The effect of ML ash addition on the CO2 gasification reactivity of PC is depicted in Figure 5c and d. Compared to the gasification of PC alone, adding ash residue significantly improves the gasification reactivity of PC, with a 20% increase being particularly significant. This demonstrates that the ash residue plays an important role in promoting the CO2 gasification of PC and can significantly enhance the PC’s gasification activity. In conjunction with the ash composition data, the analysis reveals that ML ash is rich in calcium and iron, while PC ash contains less calcium and iron. These calcium and iron active components could be responsible for the synergistic effect of ML and PC gasification.
In most cases, the gasification reactivity of carbonaceous materials is correlated with the minerals they contain. According to Table 1, the dry basis ash content of PC is 0.23%, which is significantly less than that of ML (12.94%). PC ash’s limited autocatalysis and low gasification reactivity result from its low mineral content. During the co-gasification of coal and PC, transferring minerals from coal particles to the closely contacted PC surface can significantly improve the PC’s gasification reactivity.
As shown in Figure 5e, the amount of coal ash added is 5%, 10%, 20%, and 30%. After adding 5% ML ash and PC mixed gasification, the reactivity index of R 0.5 when the conversion rate reaches 50% is 6.45; the reactivity index of R 0.5 after adding 10% ML ash and PC mixed gasification is 6.54; the reactivity index of R 0.5 after adding 20% ML ash and PC mixed gasification is 6.9; after adding 30% ML ash and PC mixed gasification, the reactivity index R 0.5 is 6.77. The results all have a higher reactivity index than PC alone (R 0.5 = 6.21).
After adding 5% ML ash and PC mixed gasification, the reactivity index of R 0.9 when the conversion rate reaches 90% is 10.26; after adding 10% ML ash and PC mixed gasification, the reactivity index R 0.9 is 10.49; after adding 20% ML ash and PC mixed gasification, the reactivity index R 0.9 is 11; the reactivity index R 0.9 is 10.47 after adding 30% ML ash mixed with PC for gasification, and the conversion rate of PC at 1,400°C has not reached 90%.
The reactivity index increases as ML coal ash addition increases. The minerals present in ML coal ash can enhance the reactivity of PC. The reactivity index for a 20% addition of coal ash is the highest, and the reactivity index for a 30% addition is even lower. This indicates that the optimal addition amount of 20% coal ash has the greatest impact on enhancing the gasification reaction of PC and that the addition amount has reached saturation, meaning that further additions will diminish the reaction area of carbon and coal ash.
Since the initial stage of gasification is the pyrolysis stage and the reaction with CO2 only at the high-temperature stage, the residue at 900°C during the initial reaction of PC is selected for research. Therefore, weigh ML with a mass of 5 g, and place the ML:PC-7:3, 5:5, 3:7 PC samples in a high-temperature tube furnace, respectively. The furnace temperature was raised to 900°C under an N2 atmosphere, and the micro-area chemical composition analysis of the samples was carried out.
Figure 6 depicts the microdomain morphology and chemical composition of different ML and PC coke proportions. PC has a lower ash content, exhibiting blocky particles, whereas ML has a higher ash content, exhibiting agglomerated irregular particles. With an increasing ML mixing ratio, the proportion of ash on the surface of PC coke increases; when the ratio of ML to PC is 7:3, the surface of the PC scorch is almost covered by ML ash. The surface of PC coke is predominantly carbon, with a small amount of oxygen and sulfur; the surface of ML coke is predominantly carbon and oxygen, with more metal elements such as calcium and iron. The elemental composition of multiple regions indicates that ML and PC coke samples have a higher surface O content than single coke samples. This suggests that the interaction between ML and PC increases the oxygen-containing functional groups on the surface of PC. Oxygen-containing functional groups can form relatively less ordered carbon structures and are directly proportional to the carbon’s concentration of active sites.

Microdomain morphology and chemical composition of different ML and PC coke proportions analyzed by SEM-EDX.
As low-rank coal with a high volatile content and O/C molar ratio, ML possesses more oxygen-containing functional groups. Through devolatilization and decomposition reactions, OH and H radicals from oxygen-containing functional groups can be released, and subsequently adsorbed onto the surface of adjacent PC particles, resulting in the formation of particles with more amorphous carbon structures, more active sites, and fewer large aromatic rings [24,25]. Simultaneously, the proportion of ML to PC increases from 3:7 to 7:3, and the carbon content of the ash particles decreases as the proportion of ML coal rises. Ca, Fe, Si, and Al concentrations in the ash increase proportionally, indicating that AAEMS from ML ash coats the surface of PC particles.
3.2.2 Effect of synthetic ash on gasification of PC
In order to study the influence of minerals on the reactivity of co-gasification and derive the co-gasification mechanism, gasification experiments were carried out with the addition of 20% real ash and simulated ash and PC as a mixture. The effect of blending 20% ML real ash and simulated ash (CaO, Fe2O3, SiO2, and Al2O3) on the gasification performance of PC is investigated. Among them, the simulated ash only follows the content of CaO, Fe2O3, SiO2, and Al2O3 in the bone (Table 2) according to the ash chemical composition of ML.
Figure 7 shows the gasification conversion rate and reactivity index of various types of coal ash to PC. The conversion rate of PC with 20% ML real ash and 20% simulated ash is significantly greater than that of pure PC, particularly at 1,250°C; the reaction of PC is complete after the addition of real ash. The reactivity index R 0.5 when adding 20% of the real ash conversion rate to 50% is 6.9; the reactivity index R 0.5 of adding 20% simulated ash is 6.34, both higher than the reactivity index of PC alone (R 0.5 = 6.21). The reactivity index R 0.9 for adding 20% of real ash when the conversion rate reaches 90% is 11; the reactivity index R 0.9 for adding 20% of simulated ash is 10.21. The gasification activity of PC with 20% ML real ash is better than that with 20% simulated ash. This is mainly because there is still a small amount of MgO, K2O, and Na2O in the coal ash, which is not considered, and only CaO, Fe2O3, SiO2, and Al2O3 are added to the simulated ash. In addition to CaO and Fe2O3, real ash also contains alkali metal and alkaline earth metal compounds such as MgO, K2O, Na2O, etc., which can be regarded as multi-component catalysts.

Effect of additions on the gasification reactivity of PC coal: (a) TG curves of PC with ash addition, (b) synergy factor of PC with ash addition, (c) TG curves of PC with CaO addition, (d) synergy factor of PC with CaO addition.
In order to further verify the effect of minerals with high content of CaO and Fe2O3 in ash on the co-gasification reactivity, 3.6% Fe2O3 and 4% CaO and PC are added into the mixture of 20% ML ash for gasification experiment to further explore the co-gasification mechanism. Figure 7c and d shows the gasification carbon conversion rate curves and reactivity index diagrams under different CaO and Fe2O3 mineral conditions. The catalytic effect of Fe2O3 and CaO is particularly obvious, which significantly improves the carbon conversion rate of PC. The gasification reactivity of the mixture of PC and Fe2O3 or CaO is significantly higher than that of pure PC. The reactivity index R 0.5 when adding 3.6% Fe2O3 to 50% conversion is 6.26; the reactivity index R 0.5 of adding 4% CaO is 6.59, both higher than that of PC alone (R 0.5 = 6.21). The reactivity index R 0.9 at 90% conversion with 3.6% Fe2O3 addition is 9.99, and the reactivity index R 0.9 with 4% CaO addition is 10.18. In summary, the reason why coal ash significantly improves the gasification reactivity of PC is the promotion effect of Fe2O3 and CaO in the ash, and the effect of CaO on improving the gasification reactivity of PC is stronger than that of Fe2O3.
4 Conclusion
When lignite and high-sulfur PC are co-gasified, the beginning and ending temperatures of gasification are lower than those of pure PC, and the carbonization rate and gasification reaction index are both enhanced. In addition, the gasification SFs are all greater than 1, indicating that the co-gasification process produces evident synergistic effects.
The synergistic effect is evident during the high-temperature gasification stage of the lignite/high-sulfur PC system, and lignite ash is the key to the synergistic effect in the co-gasification process. As the temperature rises, the lignite ash gradually envelops the PC’s surface, enhancing the co-gasification reactivity. As a result, the optimal addition of 20% lignite ash has the greatest impact on the gasification reaction of high-sulfur PC, and the saturation point has been reached.
The gasification activity of high-sulfur PC with 20% lignite real ash is better than that with 20% simulated ash. This shows the catalytic performance of a small amount of alkali and alkaline earth metal compounds such as MgO, K2O, Na2O, etc., in coal ash, and the effect of CaO on improving the gasification reactivity of high-sulfur PC is stronger than that of Fe2O3.
The lignite/high-sulfur PC system can broaden the selection of gasification raw materials, effectively utilize the resource attributes of the two, and provide new solutions for the disposal of PC.
-
Funding information: The completion of this work and related results received support from the Graduate Research Project of Higher Education in Anhui Province (Grant No. YJS20210377), the University Synergy Innovation Program of Anhui Province (Grant No. GXXT-2020-006), Natural Science Research Project of Colleges and Universities in Anhui Province (Grant No. KJ2021A0432), and the Open Research Fund Program of Anhui Provincial Institute of Modern Coal Processing Technology, Anhui University of Science and Technology (Grant No. MTY202201).
-
Author contributions: Lirui Mao: conceptualization, methodology, and writing; Tao Liu: conceptualization and methodology; Yanlin Zhao: data curation; Mingdong Zheng: conceptualization and supervision.
-
Conflict of interest: The authors state no conflict of interest.
References
[1] Wu JH, Liu JZ, Yu YJ, Wang RK, Zhou JH, Cen KF. Improving slurryability, rheology, and stability of slurry fuel from blending petroleum coke with lignite. Pet Sciense. 2015;12(1):157–69. 10.1007/s12182-014-0008-3.Search in Google Scholar
[2] Ayoola OT, Saka JO, Lawal BO. Blending principles of petroleum coke and low-rank coal to prepare high quality slurries. Int J Coal Prep Util. 2021;42(11):1954915. 10.1080/19392699.2021.1954915.Search in Google Scholar
[3] Gai Z, Zhang R, Bi J. Characteristics of soot from rapid pyrolysis of coal and petroleum coke. Energy Fuels. 2017;31(4):3759–67. 10.1021/acs.energyfuels.6b03366.Search in Google Scholar
[4] Song H, Yang H, Zhao C, Hu J, Zou J, Wu P, et al. Co-gasification of petroleum coke with coal at high temperature: Effects of blending ratio and the catalyst. Fuel. 2021;307:121863. 10.1016/j.fuel.2021.121863.Search in Google Scholar
[5] Wei R, Ren L, Geng F. Gasification reactivity and characteristics of coal chars and petcokes. J Energy Inst. 2021;96:25–30. 10.1016/j.joei.2020.07.012.Search in Google Scholar
[6] Wu Y, Wu S, Gu J, Gao J. Differences in physical properties and CO2 gasification reactivity between coal char and petroleum coke. Process Saf Env Prot. 2009;87(5):323–30. 10.1016/j.psep.2009.05.001.Search in Google Scholar
[7] Li W, Pudasainee D, Gupta R, Yang W, Wang B, Sun L. The fate of char structure and active groups in petroleum coke gasification in a drop tube furnace. Fuel. 2021;310:122438. 10.1016/j.fuel.2021.122438.Search in Google Scholar
[8] Ba Z, Zhao J, Li C, Huang J, Fang Y, Zhang L, et al. Developing efficient gasification technology for high-sulfur petroleum coke to hydrogen-rich syngas production. Fuel. 2020;267:117170. 10.1016/j.fuel.2020.117170.Search in Google Scholar
[9] He Q, Yu J, Song X, Ding L, Wei J, Yu G. Utilization of biomass ash for upgrading petroleum coke gasification: Effect of soluble and insoluble components. Energy. 2019;192:116642. 10.1016/j.energy.2019.116642.Search in Google Scholar
[10] Yu X, Yu D, Liu F, Han J, Wu J, Xu M. Synergistic effects, gas evolution and ash interaction during isothermal steam co-gasification of biomass with high-sulfur petroleum coke. Energy. 2021;240:122840. 10.1016/j.energy.2021.122840.Search in Google Scholar
[11] Kumari N, Saha S, Sahu G, Chauhan V, Roy R, Datta S, et al. Comparison of CO2 gasification reactivity and kinetics: petcoke, biomass and high ash coal. Biomass Convers Biorefin. 2020;12(6):2277–90. 10.1007/s13399-020-00882-z.Search in Google Scholar
[12] Wang M, Wan Y, Guo Q, Bai Y, Yu G, Liu Y, et al. Brief review on petroleum coke and biomass/coal co-gasification: Syngas production, reactivity characteristics, and synergy behavior. Fuel. 2021;304:121517. 10.1016/j.fuel.2021.121517.Search in Google Scholar
[13] Mao L, Zheng M, Li H. Acceleration effect of BDO tar on coal water slurry during co-gasification. Energy. 2022;262:125432. 10.1016/j.energy.2022.125432.Search in Google Scholar
[14] Mao L, Li H, Xia B, Liu T, Zhang Y, Zheng M. Effect of Ca/Fe-based auxiliaries on anthracite char gasification under CO2 atmosphere: Synergistic catalysis. Thermochim Acta. 2022;713:179224. 10.1016/j.tca.2022.179224.Search in Google Scholar
[15] Liu T, Mao L, Jiao F, Wu C, Zheng M, Li H. Catalytic Performance of Na/Ca-based fluxes coal char gasification. Green Process Synth. 2022;11(1):204–17. 10.1515/gps-2022-0020.Search in Google Scholar
[16] Yang H, Song H, Zhao C, Hu J, Li S, Chen H. Catalytic gasification reactivity and mechanism of petroleum coke at high temperature. 2021;293:120469. 10.1016/j.fuel.2021.120469.Search in Google Scholar
[17] Lv P, Wang J, Bai Y, Song X, Su W, Yu G, et al. CO2 gasification of petroleum coke with use of iron-based waste catalyst from F-T synthesis. 2022;711:179205. 10.1016/j.tca.2022.179205.Search in Google Scholar
[18] Li J, Wang Y, Zhu L, Zhang Z, Xiao H. Experimental study on co-pyrolysis of petroleum coke and coals: Synergy effects and co-gasification reactivity. Fuel. 2020;279:118368. 10.1016/j.fuel.2020.118368.Search in Google Scholar
[19] Ren L, Wei R, Zhu T. Co-gasification reactivity of petroleum coke with coal and coal liquefaction residue. J Energy Inst. 2020;93(1):436–41. 10.1016/j.joei.2019.01.013.Search in Google Scholar
[20] Ren L, Wei R, Gao Y. Co-gasification reactivity of petcoke and coal at high temperature. Fuel. 2017;190:245–52. 10.1016/j.fuel.2016.11.020.Search in Google Scholar
[21] Zhou T, Ge L, Li Q, Yang L, Mai L, Huang J. Combustion and gasification properties of petroleum coke and its pyrolytic semi-coke. Energy. 2023;266:126414.10.1016/j.energy.2022.126414Search in Google Scholar
[22] Edreis EM, Li X, Xu C, Yao H. Kinetic study and synergistic interactions on catalytic CO2 gasification of Sudanese lower sulphur petroleum coke and sugar cane bagasse. J Mater Res Technol. 2017;6(2):147–57. 10.1016/j.jmrt.2016.09.001.Search in Google Scholar
[23] Jayaraman K, Gokalp I. Gasification characteristics of petcoke and coal blended petcoke using thermogravimetry and mass spectrometry analysis. Appl Therm Eng. 2015;80:10–9. 10.1016/j.applthermaleng.2015.01.026.Search in Google Scholar
[24] Li X, Chang G, Yang L, Wang C. Enhancement of coke gasification by lignite and a low-cost Fe/red mud catalyst to produce syngas. J Energy Inst. 2021;98:116–23.10.1016/j.joei.2021.06.004Search in Google Scholar
[25] Krerkkaiwan S, Fushimi C, Tsutsumi A, Kuchonthara P. Synergetic effect during co-pyrolysis/gasification of biomass and sub-bituminous coal. Fuel Process Technol. 2013;115:11–8.10.1016/j.fuproc.2013.03.044Search in Google Scholar
© 2023 the author(s), published by De Gruyter
This work is licensed under the Creative Commons Attribution 4.0 International License.
Articles in the same Issue
- Research Articles
- Value-added utilization of coal fly ash and recycled polyvinyl chloride in door or window sub-frame composites
- High removal efficiency of volatile phenol from coking wastewater using coal gasification slag via optimized adsorption and multi-grade batch process
- Evolution of surface morphology and properties of diamond films by hydrogen plasma etching
- Removal efficiency of dibenzofuran using CuZn-zeolitic imidazole frameworks as a catalyst and adsorbent
- Rapid and efficient microwave-assisted extraction of Caesalpinia sappan Linn. heartwood and subsequent synthesis of gold nanoparticles
- The catalytic characteristics of 2-methylnaphthalene acylation with AlCl3 immobilized on Hβ as Lewis acid catalyst
- Biodegradation of synthetic PVP biofilms using natural materials and nanoparticles
- Rutin-loaded selenium nanoparticles modulated the redox status, inflammatory, and apoptotic pathways associated with pentylenetetrazole-induced epilepsy in mice
- Optimization of apigenin nanoparticles prepared by planetary ball milling: In vitro and in vivo studies
- Synthesis and characterization of silver nanoparticles using Origanum onites leaves: Cytotoxic, apoptotic, and necrotic effects on Capan-1, L929, and Caco-2 cell lines
- Exergy analysis of a conceptual CO2 capture process with an amine-based DES
- Construction of fluorescence system of felodipine–tetracyanovinyl–2,2′-bipyridine complex
- Excellent photocatalytic degradation of rhodamine B over Bi2O3 supported on Zn-MOF nanocomposites under visible light
- Optimization-based control strategy for a large-scale polyhydroxyalkanoates production in a fed-batch bioreactor using a coupled PDE–ODE system
- Effectiveness of pH and amount of Artemia urumiana extract on physical, chemical, and biological attributes of UV-fabricated biogold nanoparticles
- Geranium leaf-mediated synthesis of silver nanoparticles and their transcriptomic effects on Candida albicans
- Synthesis, characterization, anticancer, anti-inflammatory activities, and docking studies of 3,5-disubstituted thiadiazine-2-thiones
- Synthesis and stability of phospholipid-encapsulated nano-selenium
- Putative anti-proliferative effect of Indian mustard (Brassica juncea) seed and its nano-formulation
- Enrichment of low-grade phosphorites by the selective leaching method
- Electrochemical analysis of the dissolution of gold in a copper–ethylenediamine–thiosulfate system
- Characterisation of carbonate lake sediments as a potential filler for polymer composites
- Evaluation of nano-selenium biofortification characteristics of alfalfa (Medicago sativa L.)
- Quality of oil extracted by cold press from Nigella sativa seeds incorporated with rosemary extracts and pretreated by microwaves
- Heteropolyacid-loaded MOF-derived mesoporous zirconia catalyst for chemical degradation of rhodamine B
- Recovery of critical metals from carbonatite-type mineral wastes: Geochemical modeling investigation of (bio)hydrometallurgical leaching of REEs
- Photocatalytic properties of ZnFe-mixed oxides synthesized via a simple route for water remediation
- Attenuation of di(2-ethylhexyl)phthalate-induced hepatic and renal toxicity by naringin nanoparticles in a rat model
- Novel in situ synthesis of quaternary core–shell metallic sulfide nanocomposites for degradation of organic dyes and hydrogen production
- Microfluidic steam-based synthesis of luminescent carbon quantum dots as sensing probes for nitrite detection
- Transformation of eggshell waste to egg white protein solution, calcium chloride dihydrate, and eggshell membrane powder
- Preparation of Zr-MOFs for the adsorption of doxycycline hydrochloride from wastewater
- Green nanoarchitectonics of the silver nanocrystal potential for treating malaria and their cytotoxic effects on the kidney Vero cell line
- Carbon emissions analysis of producing modified asphalt with natural asphalt
- An efficient and green synthesis of 2-phenylquinazolin-4(3H)-ones via t-BuONa-mediated oxidative condensation of 2-aminobenzamides and benzyl alcohols under solvent- and transition metal-free conditions
- Chitosan nanoparticles loaded with mesosulfuron methyl and mesosulfuron methyl + florasulam + MCPA isooctyl to manage weeds of wheat (Triticum aestivum L.)
- Synergism between lignite and high-sulfur petroleum coke in CO2 gasification
- Facile aqueous synthesis of ZnCuInS/ZnS–ZnS QDs with enhanced photoluminescence lifetime for selective detection of Cu(ii) ions
- Rapid synthesis of copper nanoparticles using Nepeta cataria leaves: An eco-friendly management of disease-causing vectors and bacterial pathogens
- Study on the photoelectrocatalytic activity of reduced TiO2 nanotube films for removal of methyl orange
- Development of a fuzzy logic model for the prediction of spark-ignition engine performance and emission for gasoline–ethanol blends
- Micro-impact-induced mechano-chemical synthesis of organic precursors from FeC/FeN and carbonates/nitrates in water and its extension to nucleobases
- Green synthesis of strontium-doped tin dioxide (SrSnO2) nanoparticles using the Mahonia bealei leaf extract and evaluation of their anticancer and antimicrobial activities
- A study on the larvicidal and adulticidal potential of Cladostepus spongiosus macroalgae and green-fabricated silver nanoparticles against mosquito vectors
- Catalysts based on nickel salt heteropolytungstates for selective oxidation of diphenyl sulfide
- Powerful antibacterial nanocomposites from Corallina officinalis-mediated nanometals and chitosan nanoparticles against fish-borne pathogens
- Removal behavior of Zn and alkalis from blast furnace dust in pre-reduction sinter process
- Environmentally friendly synthesis and computational studies of novel class of acridinedione integrated spirothiopyrrolizidines/indolizidines
- The mechanisms of inhibition and lubrication of clean fracturing flowback fluids in water-based drilling fluids
- Adsorption/desorption performance of cellulose membrane for Pb(ii)
- A one-pot, multicomponent tandem synthesis of fused polycyclic pyrrolo[3,2-c]quinolinone/pyrrolizino[2,3-c]quinolinone hybrid heterocycles via environmentally benign solid state melt reaction
- Green synthesis of silver nanoparticles using durian rind extract and optical characteristics of surface plasmon resonance-based optical sensor for the detection of hydrogen peroxide
- Electrochemical analysis of copper-EDTA-ammonia-gold thiosulfate dissolution system
- Characterization of bio-oil production by microwave pyrolysis from cashew nut shells and Cassia fistula pods
- Green synthesis methods and characterization of bacterial cellulose/silver nanoparticle composites
- Photocatalytic research performance of zinc oxide/graphite phase carbon nitride catalyst and its application in environment
- Effect of phytogenic iron nanoparticles on the bio-fortification of wheat varieties
- In vitro anti-cancer and antimicrobial effects of manganese oxide nanoparticles synthesized using the Glycyrrhiza uralensis leaf extract on breast cancer cell lines
- Preparation of Pd/Ce(F)-MCM-48 catalysts and their catalytic performance of n-heptane isomerization
- Green “one-pot” fluorescent bis-indolizine synthesis with whole-cell plant biocatalysis
- Silica-titania mesoporous silicas of MCM-41 type as effective catalysts and photocatalysts for selective oxidation of diphenyl sulfide by H2O2
- Biosynthesis of zinc oxide nanoparticles from molted feathers of Pavo cristatus and their antibiofilm and anticancer activities
- Clean preparation of rutile from Ti-containing mixed molten slag by CO2 oxidation
- Synthesis and characterization of Pluronic F-127-coated titanium dioxide nanoparticles synthesized from extracts of Atractylodes macrocephala leaf for antioxidant, antimicrobial, and anticancer properties
- Effect of pretreatment with alkali on the anaerobic digestion characteristics of kitchen waste and analysis of microbial diversity
- Ameliorated antimicrobial, antioxidant, and anticancer properties by Plectranthus vettiveroides root extract-mediated green synthesis of chitosan nanoparticles
- Microwave-accelerated pretreatment technique in green extraction of oil and bioactive compounds from camelina seeds: Effectiveness and characterization
- Studies on the extraction performance of phorate by aptamer-functionalized magnetic nanoparticles in plasma samples
- Investigation of structural properties and antibacterial activity of AgO nanoparticle extract from Solanum nigrum/Mentha leaf extracts by green synthesis method
- Green fabrication of chitosan from marine crustaceans and mushroom waste: Toward sustainable resource utilization
- Synthesis, characterization, and evaluation of nanoparticles of clodinofop propargyl and fenoxaprop-P-ethyl on weed control, growth, and yield of wheat (Triticum aestivum L.)
- The enhanced adsorption properties of phosphorus from aqueous solutions using lanthanum modified synthetic zeolites
- Separation of graphene oxides of different sizes by multi-layer dialysis and anti-friction and lubrication performance
- Visible-light-assisted base-catalyzed, one-pot synthesis of highly functionalized cinnolines
- The experimental study on the air oxidation of 5-hydroxymethylfurfural to 2,5-furandicarboxylic acid with Co–Mn–Br system
- Highly efficient removal of tetracycline and methyl violet 2B from aqueous solution using the bimetallic FeZn-ZIFs catalyst
- A thermo-tolerant cellulase enzyme produced by Bacillus amyloliquefaciens M7, an insight into synthesis, optimization, characterization, and bio-polishing activity
- Exploration of ketone derivatives of succinimide for their antidiabetic potential: In vitro and in vivo approaches
- Ultrasound-assisted green synthesis and in silico study of 6-(4-(butylamino)-6-(diethylamino)-1,3,5-triazin-2-yl)oxypyridazine derivatives
- A study of the anticancer potential of Pluronic F-127 encapsulated Fe2O3 nanoparticles derived from Berberis vulgaris extract
- Biogenic synthesis of silver nanoparticles using Consolida orientalis flowers: Identification, catalytic degradation, and biological effect
- Initial assessment of the presence of plastic waste in some coastal mangrove forests in Vietnam
- Adsorption synergy electrocatalytic degradation of phenol by active oxygen-containing species generated in Co-coal based cathode and graphite anode
- Antibacterial, antifungal, antioxidant, and cytotoxicity activities of the aqueous extract of Syzygium aromaticum-mediated synthesized novel silver nanoparticles
- Synthesis of a silica matrix with ZnO nanoparticles for the fabrication of a recyclable photodegradation system to eliminate methylene blue dye
- Natural polymer fillers instead of dye and pigments: Pumice and scoria in PDMS fluid and elastomer composites
- Study on the preparation of glycerylphosphorylcholine by transesterification under supported sodium methoxide
- Wireless network handheld terminal-based green ecological sustainable design evaluation system: Improved data communication and reduced packet loss rate
- The optimization of hydrogel strength from cassava starch using oxidized sucrose as a crosslinking agent
- Green synthesis of silver nanoparticles using Saccharum officinarum leaf extract for antiviral paint
- Study on the reliability of nano-silver-coated tin solder joints for flip chips
- Environmentally sustainable analytical quality by design aided RP-HPLC method for the estimation of brilliant blue in commercial food samples employing a green-ultrasound-assisted extraction technique
- Anticancer and antimicrobial potential of zinc/sodium alginate/polyethylene glycol/d-pinitol nanocomposites against osteosarcoma MG-63 cells
- Nanoporous carbon@CoFe2O4 nanocomposite as a green absorbent for the adsorptive removal of Hg(ii) from aqueous solutions
- Characterization of silver sulfide nanoparticles from actinobacterial strain (M10A62) and its toxicity against lepidopteran and dipterans insect species
- Phyto-fabrication and characterization of silver nanoparticles using Withania somnifera: Investigating antioxidant potential
- Effect of e-waste nanofillers on the mechanical, thermal, and wear properties of epoxy-blend sisal woven fiber-reinforced composites
- Magnesium nanohydroxide (2D brucite) as a host matrix for thymol and carvacrol: Synthesis, characterization, and inhibition of foodborne pathogens
- Synergistic inhibitive effect of a hybrid zinc oxide-benzalkonium chloride composite on the corrosion of carbon steel in a sulfuric acidic solution
- Review Articles
- Role and the importance of green approach in biosynthesis of nanopropolis and effectiveness of propolis in the treatment of COVID-19 pandemic
- Gum tragacanth-mediated synthesis of metal nanoparticles, characterization, and their applications as a bactericide, catalyst, antioxidant, and peroxidase mimic
- Green-processed nano-biocomposite (ZnO–TiO2): Potential candidates for biomedical applications
- Reaction mechanisms in microwave-assisted lignin depolymerisation in hydrogen-donating solvents
- Recent progress on non-noble metal catalysts for the deoxydehydration of biomass-derived oxygenates
- Rapid Communication
- Phosphorus removal by iron–carbon microelectrolysis: A new way to achieve phosphorus recovery
- Special Issue: Biomolecules-derived synthesis of nanomaterials for environmental and biological applications (Guest Editors: Arpita Roy and Fernanda Maria Policarpo Tonelli)
- Biomolecules-derived synthesis of nanomaterials for environmental and biological applications
- Nano-encapsulated tanshinone IIA in PLGA-PEG-COOH inhibits apoptosis and inflammation in cerebral ischemia/reperfusion injury
- Green fabrication of silver nanoparticles using Melia azedarach ripened fruit extract, their characterization, and biological properties
- Green-synthesized nanoparticles and their therapeutic applications: A review
- Antioxidant, antibacterial, and cytotoxicity potential of synthesized silver nanoparticles from the Cassia alata leaf aqueous extract
- Green synthesis of silver nanoparticles using Callisia fragrans leaf extract and its anticancer activity against MCF-7, HepG2, KB, LU-1, and MKN-7 cell lines
- Algae-based green AgNPs, AuNPs, and FeNPs as potential nanoremediators
- Green synthesis of Kickxia elatine-induced silver nanoparticles and their role as anti-acetylcholinesterase in the treatment of Alzheimer’s disease
- Phytocrystallization of silver nanoparticles using Cassia alata flower extract for effective control of fungal skin pathogens
- Antibacterial wound dressing with hydrogel from chitosan and polyvinyl alcohol from the red cabbage extract loaded with silver nanoparticles
- Leveraging of mycogenic copper oxide nanostructures for disease management of Alternaria blight of Brassica juncea
- Nanoscale molecular reactions in microbiological medicines in modern medical applications
- Synthesis and characterization of ZnO/β-cyclodextrin/nicotinic acid nanocomposite and its biological and environmental application
- Green synthesis of silver nanoparticles via Taxus wallichiana Zucc. plant-derived Taxol: Novel utilization as anticancer, antioxidation, anti-inflammation, and antiurolithic potential
- Recyclability and catalytic characteristics of copper oxide nanoparticles derived from bougainvillea plant flower extract for biomedical application
- Phytofabrication, characterization, and evaluation of novel bioinspired selenium–iron (Se–Fe) nanocomposites using Allium sativum extract for bio-potential applications
- Erratum
- Erratum to “Synthesis, characterization, and evaluation of nanoparticles of clodinofop propargyl and fenoxaprop-P-ethyl on weed control, growth, and yield of wheat (Triticum aestivum L.)”