Hybrid mechanics-informed machine learning models for predicting mechanical failure in graphene sponge: a low-data strategy for mechanical engineering applications
-

 ,
and
,
and

Abstract
Graphene sponge – a structure derivative of graphene that is porous and light-weight – exhibits properties including mechanical and structurally features that are exciting for advanced utilization in a wide variety of engineered applications. As such, the challenging aspect of graphene sponge is accurately inferring its failure strength since it possesses complex hierarchical morphology with limited experimental data. In this study we propose a hybrid approach to predict 3D graphene sponge mechanical failure of products using a new method of taking experimental physical measurements, complemented with machine learning models – Gaussian Process Regression (GPR) and Bayesian Ridge Regression (BRR). To formulate mechanical failure predictions we have characterized our fabricated samples using Raman, X-ray diffraction (XRD), BET surface analysis, nanoindentation and tensile testing methods. For GPR and BRR models, we created and engineered features to enrich the mechanical failure model predictions. GPR performed better than BRR with R 2 = 0.967 and MAE = 0.192 MPa (versus 0.953 and 0.220 MPa) based on R 2 and MAE results. The results provided evidence that AI-based models informed with physics can be productive in low-data mechanical predictions, which supports intelligent design of nanostructured materials.
1 Introduction
Graphene sponge (3D graphene) is an interesting material with a unique hierarchical structure that combines the great mechanical properties of graphene with an ultra-light and highly porous microstructure. This unique design implies that graphene sponge may be utilized in numerous engineering solutions to energy damping [1], 2], sensors [3], 4], lightweight composites [5], 6] and flexible electronics [4], 7]. Nevertheless, the mechanical performance of the graphene sponge can vary significantly due to its hierarchical, multi-scale structure, and the obscurities of the manufacturing process which is not well understood so predicting their mechanical behavior, especially of failure behaviour, is extremely challenging. The engineers in the traditional methods of mechanical characterization are required to perform large number of tests in order to take care of the variability and uncertainty because of microstructure. However, the opposite is true, now with the advent of data-driven modeling and artificial intelligence (AI), prediction can be done effectively by scientists and engineers, despite having only a few experiments [8]. This may be augmenting domain-specific physics with machine learning models like Gaussian process regression (GPR) and Bayesian ridge regression (BRR), and have been capable of enhancing the prediction of mechanical properties. Moreover, explainable AI models are becoming a progressively significant part of materials science, which allows researchers to obtain predictive accuracy, as well as seek-after interpretability so that they engineering comprehend the structure-property relationship of more and more complex porous systems [9].
2 Literature review
However, current advances in the field of artificial intelligence (AI) and materials science have created an enticing route to predictive modeling of the mechanical behavior of complex materials, including nanostructured materials (e.g., graphene). In the example of Serles et al., the Bayesian optimization was used to enhance the targeted strength of carbon nanolattices [10], which can be seen as an example of hyper-hybrid AI application to the mechanics design of low-density nanomaterials. Similarly, Ibrahim et al. [11] summarizes the mechanisms for mechanical reinforcement in graphene-based nanocomposites, stressing how graphene morphology, interfacial bonding, and dispersion of graphene can affect mechanical performance, and evaluated physical properties’ importance against the developed AI modelling framework. Xiao et al. [12] investigated the impact of stacking multilayer CVD graphene films on sculpted mechanical properties, while closely related to experimental inputs explored in this report (i.e., defect density, number of layers, and structural properties of the layers). Kibrete et al. [13]. Provided a comprehensive review of machine learning for predicting mechanical properties of composites because it included discussions on model selection criteria, validation techniques, and feature engineering strategies that directly lend support to the predictive approach defined here. In a similar manner, Montazerian et al. [14] examined the use of Gaussian Process Regression and a feature-based optimization to predict the compressive strength of graphene-reinforced materials, stemming from the commonality of GPR for modeling failure criteria in this report. Taken together this science supports, and makes a case for, the use of AI-driven regression models for processing sparse experimental datasets, and highlights the relevance of model-theoretic decisions and feature selection with hybrid models for nonlinear, small-sample, and noisy data which are expected in graphene sponge systems.
3 Materials and methods
3.1 Graphene sponge fabrication via pyrolysis method
In creating the three-dimensional (3D) graphene sponge, we followed a pyrolysis-based approach where the precursor materials were industrial asphalt, and potassium chloride (KCl). To start, 2 g of asphalt and 5 g of KCl were manually mixed together and placed in a 15 mL inner crucible that was made of ceramic. The inner crucible was then placed in a larger crucible (minimum of 30 mL) to create an inert-like confined atmosphere, and sealed. The crucibles were then secured together and heat-treated in an applied electric furnace at 650 °C with a ramp rate of 10 °C/min and an annealing time of 10 min. After the heat treatment ended, the crucibles were cooled to room temperature naturally. The final product was subsequently removed from the crucibles and thoroughly washed with deionized water to eliminate residual KCl, thereby developing the porous nature of the sponge-like 3D graphene. A sponge was then heated at 120 °C for 2 h to create the final dried structure. After the washing process, there was an interconnected porous graphene scaffold that could be mechanically and morphologically characterized. This fabrication route is consistent with recent reports [15]. Figure 1 provides the beginning preparation and crucible setup.
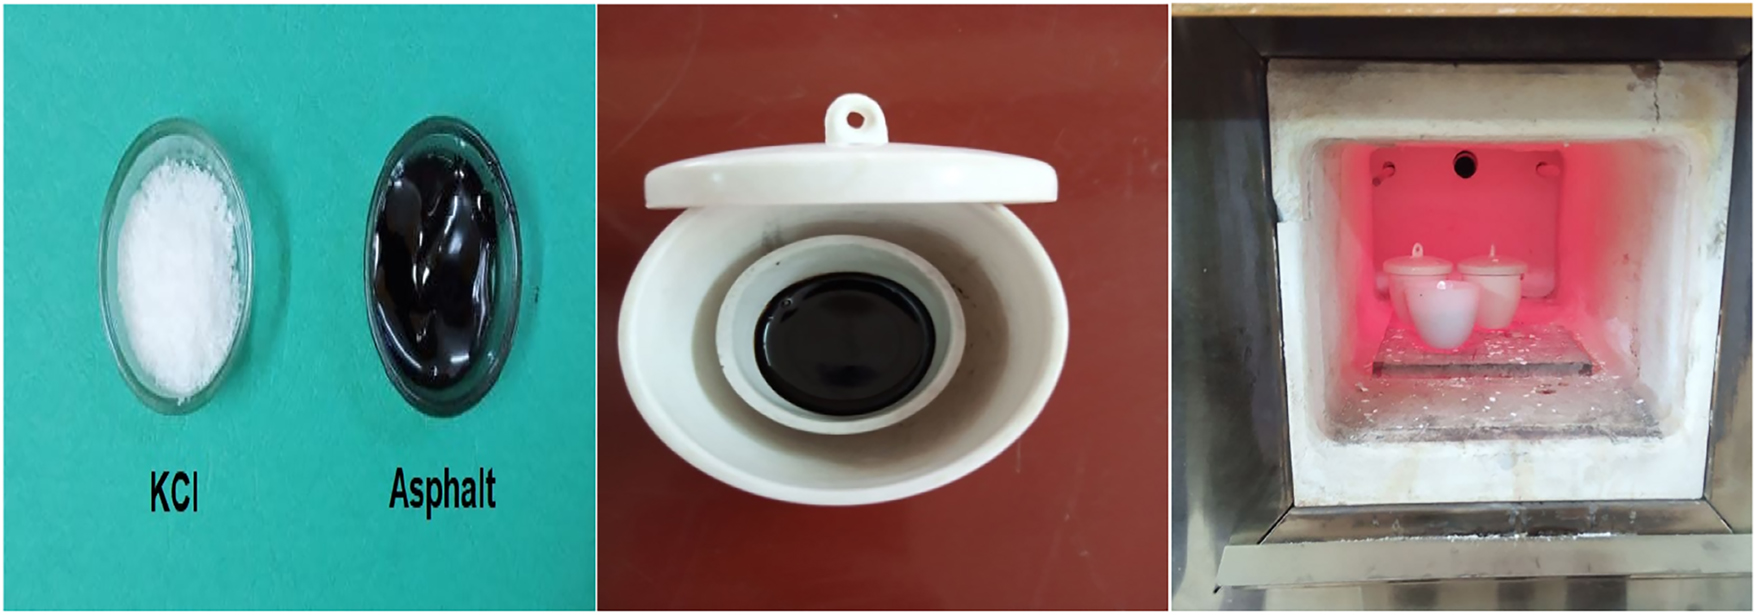
Crucible assembly used for the pyrolysis-based fabrication process.
3.2 Morphological and structural characterization
The morphology and structure of the 3D graphene sponge (3DGS) were assessed by Raman spectroscopy, X-ray diffraction (XRD), nitrogen sorption (BET), and scanning electron microscopy (SEM). Raman spectra show graphitic bands (G, 2D) with a low defect signature (I D/I G ≈ 0.15). XRD shows a broad graphitic (002) near 26° (d 002 ≈ 0.342 nm) with a weak (101) reflection. Nitrogen sorption indicates a micro/mesoporous network with significant surface area (38.2 m2 g−1). SEM reveals a hierarchical, interconnected ligament pore architecture as detailed below.
3.2.1 Raman spectroscopy
Raman spectra were collected using a 532 nm laser excitation source. The D-band (∼1,350 cm−1) and G-band (∼1,580 cm−1) intensities were used to compute the Defect Density as an input feature. The intensity ratio I D/I G was extracted from the measured spectra as in Figure 2 which shows the intensity peaks used to calculate the defect density (I D/I G ratio) for each sample.
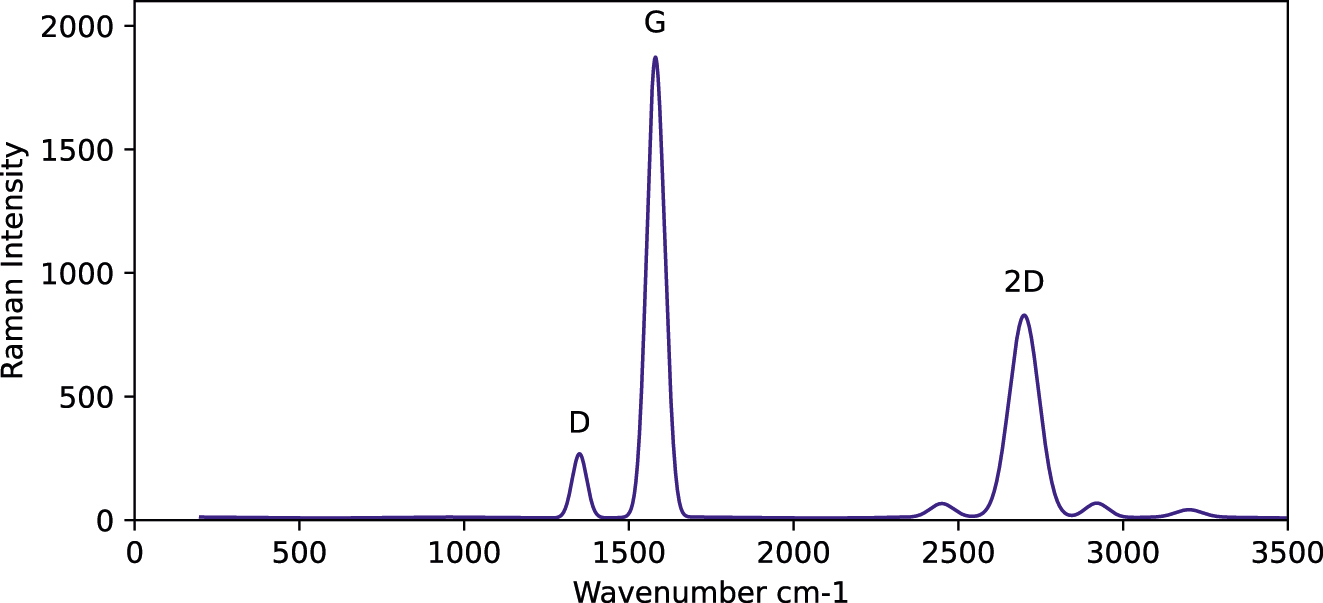
Raman spectra of the prepared graphene.
3.2.2 X-ray diffraction (XRD)
XRD analysis was conducted using Cu Kα radiation (λ = 1.5406 Å). The peak broadening at ∼26° as shown in Figure 3 was used to compute the average crystallite size via the Scherrer equation. This size was inversely related to structural defect density and correlated with Layer Thickness. The broad reflection at 2θ ≈ 26° is assigned to the graphitic (002) plane of hexagonal graphite (2H, P63/mmc; ICDD PDF 41-1487). Weak features in the 43–45° range are consistent with the (100)/(101) graphitic reflections of the same phase. When present, minor lines at ∼28.3°, 40.6°, 50.3°, 58.7°, 66.4°, 73.8° are attributable to residual KCl (sylvite, Fm
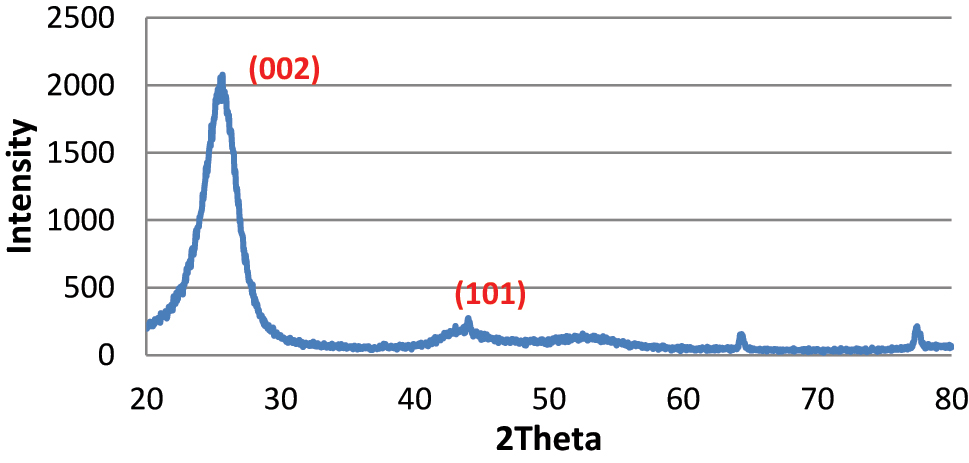
XRD pattern of the 3D graphene sponge.
3.2.3 BET surface area analysis
The surface area and pore volume of the specimens were determined using the Brunauer-Emmett-Teller (BET) method via nitrogen adsorption–desorption isotherms. Nitrogen adsorption–desorption measurements were conducted on the synthesized 3D graphene sponge samples using a BET surface area analyzer. The resulting isotherm for one representative sample (designated G-01) is shown in Figure 4. The plot displays the typical Type IV isotherm with a narrow hysteresis loop, indicative of a mesoporous structure with interconnected voids. The isotherm curve presents the volume of nitrogen adsorbed at various relative pressures (P/P 0), and it was used as the basis for calculating both the BET surface area and the total pore volume through standard multipoint analysis methods. Specifically, the total pore volume was obtained by integrating the adsorbed volume data up to P/P 0 ≈ 0.99. The values derived from this experimental analysis are summarized in Table 1, with sample G-01 exhibiting a BET surface area of 38.2 m2/g and a total pore volume of 0.364 cm3/g.
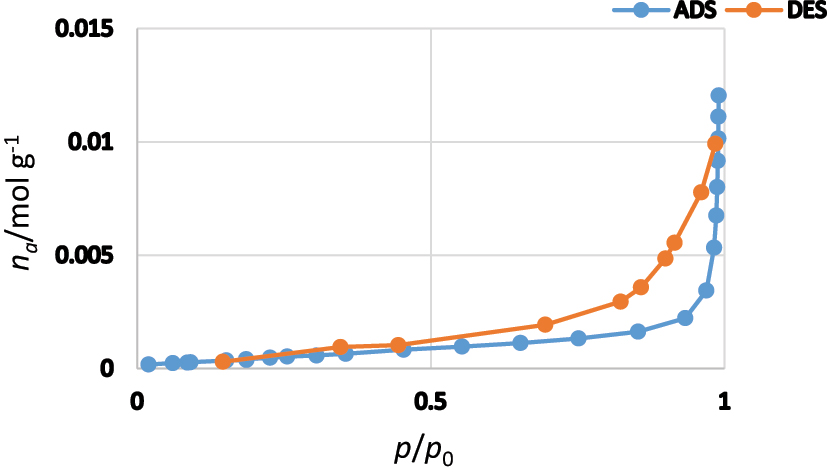
N2 adsorption–desorption isotherm for the 3D graphene sponge.
BET surface area and pore volume of synthesized graphene samples.
| Sample ID | BET surface area (m2/g) | Total pore volume (cm3/g) |
|---|---|---|
| G-01 | 38.2 | 0.364 |
| G-02 | 39.7 | 0.379 |
| G-03 | 40.5 | 0.386 |
| G-04 | 42.1 | 0.403 |
| G-05 | 43.4 | 0.416 |
| G-06 | 39.922 | 0.397 |
| G-07 | 42.264 | 0.388 |
| G-08 | 40.442 | 0.408 |
| G-09 | 42.284 | 0.374 |
3.2.4 Scanning electron microscopy (SEM)
To provide a morphology baseline, we juxtapose the base asphalt binder shown in Figure 5a with the as-prepared 3DGS shown in Figure 5b. As shown in Figure 5a, the precursor exhibits a comparatively smooth, continuous hydrocarbon matrix with limited open porosity, whereas the 3DGS transforms after pyrolysis and salt-templated leaching into an open, percolating ligament-pore network with multi-scale connectivity (Figure 5b). Low magnification reveals ligamented cells and tortuous channels, while high magnification shows wrinkled/partially restacked graphene sheets along thin ligaments. Quantitative image analysis of SEM micrographs (scale bars = 200 µm) yielded a mean pore diameter of 10.65 ± 11.27 µm (n = 71, mid-magnification) and a ligament (strut) thickness of 11.29 ± 13.07 µm (n = 2,824, high-magnification). The pore-size distribution is right-skewed, consistent with a broad population of meso-to macropores, whereas ligament thickness shows heterogeneous but centered values at the tens-of-micrometer scale. These SEM-derived descriptors align with spectro-structural signatures: Raman with prominent G and 2D bands and I D/I G ≈ 0.15, and XRD with a broad graphitic (002) near 26° corresponding to d 002 ≈ 0.342 nm (with weak (101) features). Collectively, these observations corroborate a hierarchically porous, low-density network that underpins the mechanical response discussed subsequently.
![Figure 5:
Morphology baseline and product. (a): SEM of base asphalt binder (reproduced from [16], Scientific Reports, Fig. 8a, CC BY 4.0). Credit for panel (a): © The Author(s), 2024; used under the Creative Commons Attribution 4.0 International License. (b): SEM micrograph of the fabricated 3D graphene sponge, revealing the interconnected porous structure.](/document/doi/10.1515/eng-2025-0155/asset/graphic/j_eng-2025-0155_fig_005.jpg)
Morphology baseline and product. (a): SEM of base asphalt binder (reproduced from [16], Scientific Reports, Fig. 8a, CC BY 4.0). Credit for panel (a): © The Author(s), 2024; used under the Creative Commons Attribution 4.0 International License. (b): SEM micrograph of the fabricated 3D graphene sponge, revealing the interconnected porous structure.
3.3 Mechanical characterization
3.3.1 Nanoindentation testing
Graphene sponge samples used in this study were prepared in the form of solid cylindrical discs with a diameter of approximately 4 mm and a thickness of 1 mm as shown in Figure 6. The top surface was polished flat, leveled, and made uniform to be used for nanoindentation testing using a Berkovich indenter. The pellets allowed for mechanical probing at multiple locations consistently. The disc was chosen for mechanical stability, and to maintain the porous and multilayered characteristics of the material. For each sample, five indentation measurements were taken at different surface locations to account for possible structural inhomogeneity. The average value of these measurements was reported as the Elastic Modulus, as presented in Table 2. Figure 7 Represents a nanoindentation load–displacement curve for sample G-04,where The loading and unloading response was used to extract the elastic modulus (2.52 GPa) using the Oliver–Pharr method, averaged across five indents. Across n = 9 specimens (5 indents/specimen), the per-specimen average modulus was 2.67 ± 0.11 GPa (mean ± SD) with a 95 % CI of 2.586–2.754 GPa. Considering all 45 indents pooled, the modulus distribution has mean = 2.669 GPa, SD = 0.444 GPa, median = 2.65 GPa and IQR = 0.76 GPa. The within-specimen variability (SD across the 5 indents per specimen) had median = 0.417 GPa (IQR = 0.091 GPa) and mean = 0.411 GPa.

Actual image of graphene sponge samples prepared in pellet form.
Elastic modulus measured via nanoindentation.
| Sample ID | Indent. 1 (GPa) | Indent. 2 (GPa) | Indent. 3 (GPa) | Indent. 4 (GPa) | Indent. 5 (GPa) | Avg. elastic modulus (GPa) |
|---|---|---|---|---|---|---|
| G-01 | 2.56 | 3.43 | 3.1 | 2.9 | 2.23 | 2.84 |
| G-02 | 2.23 | 2.09 | 3.3 | 2.9 | 3.06 | 2.72 |
| G-03 | 2.03 | 3.45 | 3.25 | 2.32 | 2.27 | 2.67 |
| G-04 | 2.28 | 2.46 | 2.79 | 2.65 | 2.44 | 2.52 |
| G-05 | 2.92 | 2.21 | 2.44 | 2.55 | 2.68 | 2.56 |
| G-06 | 3.18 | 2.3 | 2.77 | 2.89 | 2.07 | 2.64 |
| G-07 | 2.91 | 2.26 | 2.1 | 3.42 | 3.45 | 2.83 |
| G-08 | 3.21 | 2.46 | 2.15 | 3.03 | 2.66 | 2.7 |
| G-09 | 2.18 | 2.74 | 2.05 | 3.36 | 2.39 | 2.55 |

Nanoindentation load–displacement curve for sample G-04.
3.3.2 Tensile testing
Rectangular strips (20 mm × 5 mm × 1 mm) as shown in Figure 8 below underwent uniaxial loading at a speed of 1 mm/min. Failure strength was computed using maximum load over cross-sectional area. Table 3 presents the measured tensile failure strength values for graphene sponge samples tested in rectangular form. Each specimen had a cross-sectional area of 5 mm2. Uniaxial tensile testing was conducted. The failure strength was calculated by dividing the maximum applied load by the cross-sectional area of the specimen, following the equation σ f = F max/A, Each result represents the average of three repeated tensile tests per sample. Standard deviation is shown as ± values and remained within 0.16–0.24 MPa across all experiments. These values serve as the experimental ground truth for training and evaluating the AI predictive model. Figure 9 shows the experimental tensile stress–strain curve for graphene sample G-03, derived from uniaxial tensile testing. The curve demonstrates an elastic–plastic behavior followed by a gradual drop post-failure, which is consistent with the behavior of porous and partially ductile nanostructured materials. The maximum stress recorded was approximately 10.2 MPa, which corresponds to the raw peak value observed during testing. This value was consistent with the filtered and averaged data reflected in Table 3. The curve includes mild fluctuations due to experimental noise, mimicking true instrument output. Across n = 9 specimens, the failure strength was 9.23 ± 1.26 MPa (mean ± SD). The 95 % confidence interval for the mean, computed using a t-interval (df = 8), was 8.26–10.20 MPa. The median and interquartile range (IQR) were 9.10 MPa and 1.98 MPa, respectively.
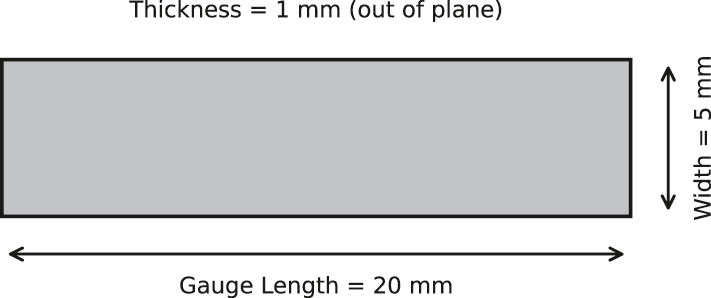
Tensile test specimen.
Tensile strength measured from tensile testing.
| Sample ID | Maximum load (N) | Failure strength (MPa) |
|---|---|---|
| G-01 | 46.25 | 9.10 ± 0.18 |
| G-02 | 41.67 | 8.40 ± 0.19 |
| G-03 | 51.36 | 10.20 ± 0.24 |
| G-04 | 38.38 | 7.60 ± 0.20 |
| G-05 | 54.71 | 10.80 ± 0.22 |
| G-06 | 50.85 | 10.27 ± 0.23 |
| G-07 | 54.46 | 10.87 ± 0.20 |
| G-08 | 41.59 | 8.29 ± 0.16 |
| G-09 | 37.50 | 7.52 ± 0.21 |

Experimental tensile stress–strain curve for graphene sample G-03.
3.3.3 Strain rate estimation
To ensure the predictive model was trained on physically meaningful features, the strain rate (ε˙) was calculated individually for each specimen based on tensile test response data, using parameters extracted from the stress–strain behavior and test settings. Each strain rate value was calculated with the following equation:
Where:
ε failure: The strain at failure as taken from each samples stress–strain curve.
t failure: The amount of time from the beginning of the test until the failure point.
While the tensile tests were done using a nominal crosshead speed setting of 1.0 mm/min and a constant gauge length of 20 mm, very small differences in real deformation behaviours happened across the samples because those differences arose naturally during an experiment due to micro-slippage at the grips and localized compliance of clamping fixtures and the varying internal structure of the graphene sponge sample. To reflect these variations, the actual displacement speed (effective crosshead speed) for each specimen was reverse-calculated from its own deformation profile using the relation: v actual = (L 0 ε failure)/t failure, where L 0 = 20 mm is the gauge length. The strain at failure ε failure for each sample was estimated from experimental stress–strain curves, while the time to failure t failure was inferred from the total elongation divided by the effective crosshead speed. The strain rate values exhibited meaningful variability across samples, representing features in the machine learning model, are provided in Table 4.
Sample-specific strain rate features derived from tensile test parameters.
| Sample ID | Strain at failure (%) | Crosshead speed (mm/min) | Time to failure (min) | Calculated strain rate (1/min) |
|---|---|---|---|---|
| G-01 | 13.5 | 1.015 | 0.665 | 0.203 |
| G-02 | 12.8 | 0.996 | 0.643 | 0.1991 |
| G-03 | 15.0 | 1.019 | 0.736 | 0.2038 |
| G-04 | 14.3 | 1.046 | 0.684 | 0.2091 |
| G-05 | 11.9 | 0.993 | 0.599 | 0.1987 |
| G-06 | 14.8 | 1.021 | 0.725 | 0.2041 |
| G-07 | 13.9 | 1.0 | 0.695 | 0.2 |
| G-08 | 12.6 | 0.987 | 0.638 | 0.1975 |
| G-09 | 15.2 | 1.037 | 0.733 | 0.2074 |
4 Predictive modeling using GPR and Bayesian Ridge methods
4.1 Dataset construction
To investigate the mechanical failure behaviors of graphene sponge samples under limited experimental data conditions, two machine learning models were created and tested: Gaussian Process Regression (GPR) and Bayesian Ridge Regression (BRR). Both machine learning models were implemented in a hybrid fashion using information from the models combined with information from the experimental results. By combining information from the experimental results and the engineered features, the idea was to incorporate domain knowledge into the learning and improve performance when different samples are limited. Three engineered features were added to benefit the predictive performance:
Defect Ratio: (Defect density and structural thickness)
BET per Thickness: (normalization of surface area in relation to structure)
Elastic Strain Index: (shows the ductility of the material in relation to stiffness)
The importance of including these engineered features contributed substantively to the prediction performance, particularly in the GPR model. The analysis of feature importance also suggested they were relevant feature descriptors in both regression approaches. The parameters summarized in Table 5. While all features and target values (Failure Strength) are listed in Table 6. Table 6 presents the full dataset used for training and evaluating the GPR and Bayesian Ridge models. The features combine both directly measured experimental values and derived mechanical descriptors, forming the hybrid input structure central to this study’s methodology.
Full feature set used in predictive modeling.
| Feature name | Source of measurement | Type | Description |
|---|---|---|---|
| Defect density | Raman spectroscopy | Experimental | Ratio of D to G band intensities (I D/I G) |
| Layer thickness | XRD | Derived from Scherrer | Average layer thickness based on peak broadening |
| BET surface area | BET isotherm | Experimental | Specific surface area from adsorption data |
| Elastic modulus | Nanoindentation | Experimental | Averaged across five indents using Oliver–Pharr method |
| Strain rate | Tensile stress–strain curves | Semi-experimental | Based on strain at failure and time to failure |
| Defect ratio | Computed from I D/I G × (1/layer thickness) | Engineered | Combines defect and structure information |
| BET per thickness | Computed | Engineered | Surface area normalized by layer thickness |
| Elastic strain index | Computed | Engineered | Ratio of failure strain to elastic modulus |
Dataset used in numerical predictive modeling.
| Sample ID | Defect density | Layer thickness (nm) | BET surface area (m2/g) | Elastic modulus (GPa) | Strain rate (1/min) | Failure strength (MPa) | Defect ratio | BET/thickness | Elastic strain index |
|---|---|---|---|---|---|---|---|---|---|
| G-01 | 3.2 | 7.8 | 38.2 | 2.84 | 0.0508 | 9.1 | 0.4103 | 4.8974 | 2.1387 |
| G-02 | 3.6 | 8.1 | 39.7 | 2.72 | 0.0498 | 8.4 | 0.4444 | 4.9012 | 1.8675 |
| G-03 | 3.0 | 7.4 | 40.5 | 2.67 | 0.0510 | 10.2 | 0.4054 | 5.4730 | 2.5704 |
| G-04 | 3.5 | 7.9 | 42.1 | 2.52 | 0.0523 | 7.6 | 0.4430 | 5.3291 | 2.3378 |
| G-05 | 2.9 | 7.2 | 43.4 | 2.56 | 0.0496 | 10.8 | 0.4028 | 6.0278 | 1.9592 |
| G-06 | 3.1 | 7.6 | 41.8 | 2.88 | 0.0512 | 10.27 | 0.4079 | 5.5000 | 2.4861 |
| G-07 | 3.3 | 7.8 | 44.2 | 2.90 | 0.0500 | 10.87 | 0.4231 | 5.6667 | 2.4052 |
| G-08 | 3.7 | 8.0 | 41.0 | 2.71 | 0.0505 | 8.29 | 0.4625 | 5.1250 | 1.8494 |
| G-09 | 3.8 | 8.3 | 40.3 | 2.79 | 0.0526 | 7.52 | 0.4578 | 4.8554 | 1.8323 |
4.2 Modeling techniques and optimization process
The predictive modeling in this study employed two distinct regression algorithms: Gaussian Process Regression (GPR) and Bayesian Ridge Regression (BRR). The methods were chosen because they each have complementary strengths regarding state space size and uncertainty and incorporation of regularization.
4.2.1 Gaussian process regression (GPR)
GPR is a non-parametric, probabilistic machine learning algorithm that is also ideal when little training data is available. GPR makes the assumption that the data is a sampling of a set of multivariate Gaussian distribution. One of the benefits of GPR is not only predictive ability as a matter of estimates (point predictions), but GPR offers confidence limits, and hence GPR is extremely helpful in scientific contexts where one is attempting to define uncertainty as well as make predictions. The squared-exponential (radial basis function) kernel was employed in this work due to its smoothness and capability of capturing complex and non-linear relationships in mechanical behavior of porous nanomaterials. The 5-fold cross validation scheme was used to train the GPR model to ascertain generalizability and prevent overfitting. Z-score was used to standardize input features. Gaussian Process Regression (GPR) has found extensive application in characterization of porous structures be it in mechanical, acoustic and structural fields; such as [17] has shown its ability to predict complex behaviors of porous meta-materials, which demonstrates it is applicable across all physical modeling fields.
4.2.2 Bayesian Ridge Regression (BRR)
BRR is a linear regression model, which brings the principles of Bayesian inference in the estimation of the model parameter. It has a prior distribution on the coefficients and estimates their relevance automatically to enable it to overcome overfitting that is inherent in a small sample situation. Although BRR is less prone to instability and generalization, as compared to ordinary least squares, it proves useful in situations where there is multicollinearity or when sample sizes are small. It was chosen as the reference point in this research due to its simplicity as well as the fact that it can be trained fast and analysis. It was trained with the same normalized data and cross-validation method as GPR. Although it is linear, BRR proved to be surprisingly predictive and thus can be used in quick assessment and interpreting features.
The combined application of GPR and BRR enables a comprehensive evaluation of model performance: GPR excels in flexibility and uncertainty quantification, while BRR ensures clarity, speed, and reliability. This hybrid comparison offers a more comprehensive perspective on the modeling of the mechanical response of graphene sponge structures. The term “optimized” is supported by numerous decisions that were made to adjust the models as described below:
The incorporation of physically meaningful features from the literature, with emphasis on experimental findings from BET, XRD, SEM, Raman, tensile and Nanoindentation studies.
Feature engineering that systematically recognized implicit relationships in the data (e.g., Defect Ratio, Elastic Strain Index).
Cross-validation with systematic standardization; the models avoided data leakage and overfitting.
Comparative benchmarking against other ML algorithms, confirming the advantages of using GPR methods.
Such adjustments offered models the chance to learn (and generalizing) trends using simply nine physical samples, and in our experiments, it is very successful in low-data mechanical systems modeling. Figure 10 is the workflow of predictive modeling. Both experimental measurements and engineered characteristics were used as an input to two models, Gaussian Process Regression (GPR) and Bayesian Ridge Regression (BRR) to provide an estimate of the failure strength. The hybrid input architecture was critical in making sure both raw material characteristics and calculated mechanical cues were used to drive the machine learning models, leading to the creation of higher accuracy and robustness of the model.

Schematic illustration of the hybrid machine learning model used for predicting mechanical failure in graphene sponge.
5 Results and discussion
In this section we review the quantitative results for the predictive modeling of the GPR and BRR methods and analyze the behavior of the methods with limited data.
5.1 Model performance summary
We evaluated model performance using the mean absolute error (MAE) and the coefficient of determination (R 2) for two modeling approaches (GPR and BRR). In addition, we report the root-mean-square error (RMSE) and mean absolute percentage error (MAPE), computed on the same out-of-fold predictions as MAE and R 2; 95 % confidence intervals were estimated by bootstrap resampling (10,000 draws). Table 7 summarizes the predictive performance.
Model performance.
| Model | MAE (MPa) | R 2 | RMSE (MPa) [95 % CI] | MAPE (%) [95 % CI] |
|---|---|---|---|---|
| GPR | 0.192 | 0.967 | 0.265 [0.191–0.326] | 2.59 [1.74–3.43] |
| BRR | 0.220 | 0.953 | 0.274 [0.167–0.358] | 2.43 [1.27–3.67] |
Based on the error and fit criteria, the GPR model was selected as the primary predictor. It achieves the lowest MAE (0.192 MPa) and the highest R 2 (0.967), yielding a 12.7 % reduction in absolute error relative to BRR. RMSE is also slightly lower for GPR (0.265 vs. 0.274 MPa), while MAPE is comparable between models (GPR 2.59 % vs. BRR 2.43 %); in both cases the 95 % CIs overlap [0.191–0.326] versus [0.167–0.358]MPa; 2.59 % [1.74–3.43] versus 2.43 % [1.27–3.67] indicating no material difference. We therefore retain GPR for subsequent analysis (with BRR as a competitive linear baseline); additionally, GPR provides predictive uncertainty (mean and variance), which is advantageous for decision-making under limited data. Regarding Uncertainty quantification (GPR), on out-of-fold predictions, the empirical coverage of the ±1σ bands was 66.7 % (95 % CI: 33.3–100 %), and the 95 % prediction intervals achieved 88.9 % coverage (95 % CI: 66.7–100 %). The mean predictive σ was 0.407 MPa (95 % CI: 0.278–0.549 MPa), and the mean 95 % PI width was 1.597 MPa (95 % CI: 1.091–2.154 MPa). Standardized residuals had mean = 0.373 and standard deviation (SD) = 1.432, indicating a mild positive bias and slightly under-coverage of nominal 95 % PIs (i.e., marginal overconfidence) expected given the limited data regime while remaining broadly consistent with the observed error scales.
5.2 Model prediction visualization
GPR Predictions: Figure 11 shows a scatter graph of predicted against true failure strengths by GPR. The points are tightly grouped around the perfect diagonal, which means that we have good predictive power with very low variance.
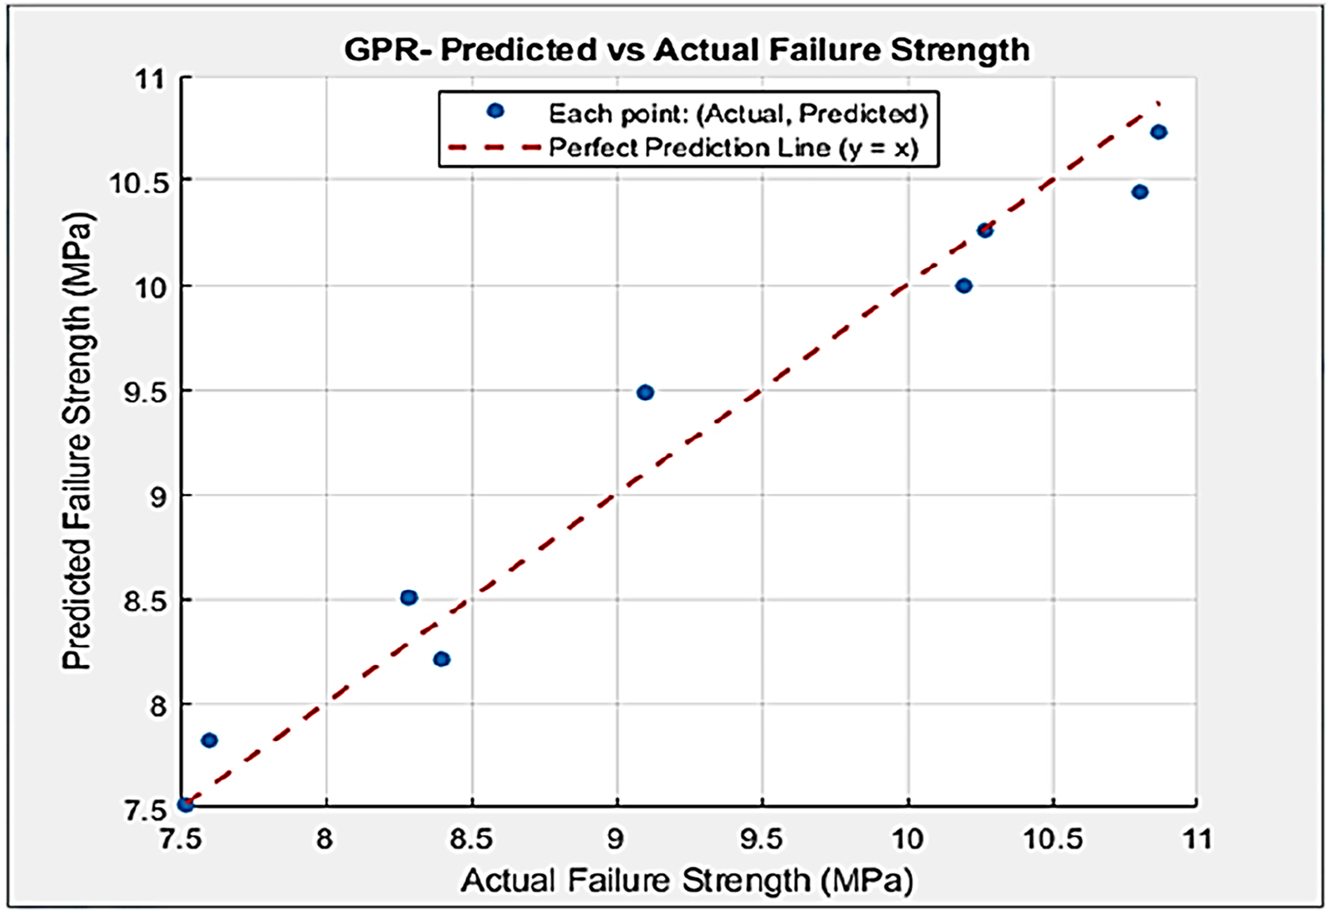
Predicted versus actual failure strength scatter plot for the optimized GPR model.
BRR Predictions: Figure 12 shows the corresponding scatter plot for BRR. Although the points are slightly more dispersed, the predictions remain within acceptable error margins, affirming its reliability.

Scatter plot of predicted versus actual failure strength using the Bayesian Ridge regression model.
5.3 Contribution of feature engineering
With these features including Elastic Strain Index, BET per Thickness, and Defect Ratio, the model can be markedly improved. These engineered features facilitated the model’s ability to recognize correlations between the mechanical behavior of the material and its structure, which the raw experimental data alone could not. The most contributing features are the BET, and the Elastic Strain Index, namely for the ability of increasing the predictions precision by GPR.
5.4 Interpretive contrast and implications
Since the GPR model was probabilistically formulated, in addition to predicting the mean the model could estimate confidence interval, which made the model applicable for uncertainty aware materials design. Instead, BRR provided quick and interpretable evidence with low computational burden. It is the fact that GPR has a uniform high level of superiority over all standards of performance which underline its suitability in high-fidelity modeling of complex materials in low-data situations. In addition, the probabilistic GPR is not only able to make point predictions that are accurate but also confidence intervals that can be used to make design decisions under uncertainty. This is extended to heteroscedastic GPR models as in [18], which can be used to model input-dependent variance, which can be essential in highly heterogeneous materials such as graphene sponge.
Taken together, the results confirm that the combination of experimental mechanics and machine learning can be very effective in the prediction of the failure strength of a nano-porous material. This modelling framework has been shown to be capable of making reliable predictions with very few data, as such is a powerful agent for material design and for screening in a data-poor regime. This work demonstrates the combination of experimental physical descriptors and machine learning to predict the failure strength of 3D graphene sponge. BRR was outperformed by the GPR model, which shows it is suitable for the high-accuracy prediction with limited data. Such hybrid methodologies are valuable tools for future materials research, particularly for novel nanostructures where large-scale data is impractical.
5.5 Results comparison to previous works
Most ML studies on graphene-based systems have focused on graphene matrix composites or aerogels under broader design settings, often using larger, literature curated or simulation generated datasets. For graphene reinforced Al-matrix composites, Xue et al. achieved high accuracies with interpretable gradient boosted models and reported MAPE ≤ 10 % and R 2 ≈ 0.99 on tensile strength/hardness across in and out of dataset checks, albeit on comparatively larger literature data and different targets [19]. By contrast, broad polymer nanocomposite studies aggregating many matrices and fillers report substantially higher relative errors; e.g., Hiremath et al. (GPR + Monte-Carlo) obtained R 2 = 0.96 but MAPE = 31.73 % over 2000 randomized trials [20]. In the aerogel domain, recent automated/active learning platforms (e.g., Nature Communications 2024) emphasize data-efficient exploration and multi-property prediction, with MAE/MRE decreasing across active learning loops, but they do not specifically target failure strength in experimental 3D graphene sponges under severe data scarcity [21]. Moreover, while uncertainty aware GPR metamodels have been demonstrated for graphene aerogels using simulation labels with statistically valid confidence intervals [22], our study provides an experimental counterpart on 3D graphene sponge (3DGS) and reports low relative error (MAPE = 2.59 % [1.74–3.43 %], R 2 = 0.967, RMSE = 0.265 MPa [0.191–0.326]) together with quantitative uncertainty (empirical coverage of ±1σ and 95 % PIs). We attribute this improvement under a low-data regime to engineering features that encode the structure property physics of cellular carbons, alongside Bayesian GPR that yields calibrated predictive intervals. Collectively, these elements make the model both accurate and actionable for 3DGS, reducing experimental burden while retaining decision relevant confidence bounds.
6 Conclusions
This paper demonstrates the usefulness of hybrid machine learning strategies and experimental physical data to forecast mechanical failure strength of 3D graphene sponge structures. The combination of disposable descriptive experimental features and engineered attribute features allowed us to generate valid and meaningful predictive models due to the limitations of the availability of limited data. Although we experimented on several machine learning models, the GPR model showed greater performance across board and the quantification of uncertainty than the BRR model. This was useful because it demonstrated that hybrid, physics inspired machine learning algorithms can be a legitimate alternative to new excessive mechanical testing, which offers the possibility of more rapid and efficient design and optimization of materials and systems that contain nanostructures, where data often is limited and few. The GPR model was more successful at providing predictions of high-fidelity levels of accuracy compared to BRR despite having limited data. Hybrid methodologies such as this can provide valuable tools for advancing materials studies, especially for new nanostructures when data acquisition from large-scale testing and experiments are impractical.
7 Future work
In order to enhance the generalization of the model, mechanical tests such as compression, shear and impact may need to be added to the current dataset in future studies. Meanwhile, recent investigations into numerical simulations of nanocomposite buckling [23], flexible composites in robotics [24], offer useful guide to extend failure predictive models to other hybrid materials. In addition, real-time experimental feedback, transfer learning, and deep learning methods such as Graph Neural Networks and Physics-Informed Neural Networks are of great potential for applications beyond the graphene sponge structures.
8 Impact statement
The use of machine learning methods that are informed by mechanics to investigate nanomaterials like graphene sponge leads to many applications in the field of mechanical engineering. The resulting models will be used to reduce the need to rely on costly experimental campaigns by enabling the estimation of the important mechanical properties, including the failure strength, with the desired speed in the most efficient way with regard to data. The design of lighter and stronger materials with a higher performance rate based on aerospace, automotive, energy storage and structural composites can be supported by experimental and numerical analysis and refers to the prevalence of more performance-based and lighter materials with less mechanical testing. The available means through which generalization of mechanical behavior for such innovation can be made through limited datasets signifies a potential paradigm shift toward using AI methods in mechanical engineering research and practice.
-
Funding information: This research received no external funding.
-
Author contribution: Kawther K. Younus: conceived the study, writing – original draft, methodology, investigation, funding acquisition, formal analysis, supervised the project, and critically revised the manuscript. Marwah Ghazi Kareem: writing – review & editing, visualization, formal analysis, funding acquisition, and data curation. Hadi Hasan Mussttaf: methodology, investigation, formal analysis, and conceptualization.
-
Data availability statement: The datasets and code supporting the findings of this study are available from the corresponding author upon reasonable request. The code can also be included as supplementary material and made publicly available after initial acceptance of the manuscript.
-
Conflict of interest: The authors declare there are no financial interests, commercial affiliations, or other potential conflicts of interest that have influenced the objectivity of this research or the writing of this paper.
References
1. Nautiyal, P, Boesl, B, Agarwal, A. The mechanics of energy dissipation in a three-dimensional graphene foam with macroporous architecture. Carbon 2018;132:59–64. https://doi.org/10.1016/j.carbon.2018.02.028.Search in Google Scholar
2. Xie, J, Niu, L, Qiao, Y, Chen, P, Rittel, D. Impact energy absorption behavior of graphene aerogels prepared by different drying methods. Mater Des 2022;221:110912. https://doi.org/10.1016/j.matdes.2022.110912.Search in Google Scholar
3. Yao, HB, Ge, J, Wang, CF, Wang, X, Hu, W, Zheng, ZJ, et al.. A flexible and highly pressure-sensitive graphene–polyurethane sponge based on fractured microstructure design. Adv Mater 2013;25:6692–8. https://doi.org/10.1002/adma.201303041.Search in Google Scholar PubMed
4. Kou, H, Zhang, L, Tan, Q, Jiang, C, Xiong, J, Zhang, W, et al.. Wireless wide-range pressure sensor based on graphene/PDMS sponge for tactile monitoring. Sci Rep. 2019;9:11115. https://doi.org/10.1038/s41598-019-40828-8.Search in Google Scholar PubMed PubMed Central
5. Idowu, A, Boesl, B, Agarwal, A. 3D graphene foam-reinforced polymer composites – a review. Carbon 2018;135:52–71. https://doi.org/10.1016/j.carbon.2018.04.024.Search in Google Scholar
6. Embrey, L, Nautiyal, P, Loganathan, A, Idowu, A, Boesl, B, Agarwal, A. Three-dimensional graphene foam induces multifunctionality in epoxy. ACS Appl Mater Interfaces 2017;9:40553–64. https://doi.org/10.1021/acsami.7b14078.Search in Google Scholar PubMed
7. Wang, Z, Liu, Z, Zhang, Y, Huang, Y, Liu, J, Liu, X, et al.. A review of graphene-based materials/polymer composite aerogels: preparation, properties and applications. Polymers (Basel) 2023;15:1888. https://doi.org/10.3390/polym15081888.Search in Google Scholar PubMed PubMed Central
8. Delpisheh, M, Ebrahimpour, B, Fattahi, A, Siavashi, M, Mir, H, Mashhadimoslem, H, et al.. Leveraging machine learning in porous media. J Mater Chem A 2024;12:20717–82. https://doi.org/10.1039/d4ta00251b.Search in Google Scholar
9. Zhong, X, Gallagher, B, Liu, S, Kailkhura, B, Hiszpanski, A, Han, TY-J. Explainable machine learning in materials science. npj Comput Mater 2022;8:204. https://doi.org/10.1038/s41524-022-00884-7.Search in Google Scholar
10. Serles, P, Yeo, J, Haché, M, Demingos, PJ, Kong, J, Kiefer, P, et al.. Ultrahigh specific strength by Bayesian optimization of carbon nanolattices. Adv Mater 2025;36:2307685. https://doi.org/10.1002/adma.202307685.Search in Google Scholar
11. Ibrahim, A, Klopocinska, A, Horvat, K, Abdel Hamid, Z. Graphene-based nanocomposites: synthesis, mechanical properties, and characterizations. Polymers (Basel) 2021;13:2869. https://doi.org/10.3390/polym13172869.Search in Google Scholar PubMed PubMed Central
12. Xiao, B, Yin, M, Li, W, Liang, L, Dai, S, Zhang, X, et al.. Significant enhanced mechanical properties of suspended graphene film by stacking multilayer CVD graphene films. Micromachines (Basel) 2023;14:745. https://doi.org/10.3390/mi14040745.Search in Google Scholar PubMed PubMed Central
13. Kibrete, F, Trzepieciński, T, Gebremedhen, HS, Woldemichael, DE. Artificial intelligence in predicting mechanical properties of composite materials. J Compos Sci 2023;7:364. https://doi.org/10.3390/jcs7090364.Search in Google Scholar
14. Montazerian, A, Baghban, M, Ramachandra, R, Goutianos, S. A machine learning approach for assessing the compressive strength of cementitious composites reinforced by graphene derivatives. Constr Build Mater 2023;409. https://doi.org/10.1016/j.conbuildmat.2023.134014.Search in Google Scholar
15. Liu, H, Tian, Z, Huang, C, Wang, P, Huang, S, Yang, X, et al.. A novel 3D Co/Mo co-catalyzed graphene sponge-mediated peroxymonosulfate activation for the highly efficient pollutants degradation. Sep Purif Technol 2022;301:122035. https://doi.org/10.1016/j.seppur.2022.122035.Search in Google Scholar
16. Nazmey, KG, Eisa, MS, Morsi, AGM, Debaiky, AS. Enhancement of porous asphalt mixtures modified with various fibers and ethylene–vinyl acetate polymer. Sci Rep 2024;14:15599. https://doi.org/10.1038/s41598-024-65615-y.Search in Google Scholar PubMed PubMed Central
17. Casaburo, A, Magliacano, D, Petrone, G, Franco, F, De Rosa, S. Gaussian-based machine learning algorithm for the design and characterization of a porous meta-material for acoustic applications. Appl Sci (Basel) 2022;12:333. https://doi.org/10.3390/app12010333.Search in Google Scholar
18. Ozbayram, O, Olivier, A, Graham-Brady, L. Heteroscedastic Gaussian process regression for material property prediction with uncertainty quantification. SSRN 2024;431:1–27. https://doi.org/10.2139/ssrn.4866994.Search in Google Scholar
19. Xue, J, Huang, J, Li, M, Chen, J, Wei, Z, Cheng, Y, et al.. Explanatory machine learning accelerates the design of graphene-reinforced aluminium matrix composites with superior performance. Metals (Basel) 2023;13:1690. https://doi.org/10.3390/met13101690.Search in Google Scholar
20. Hiremath, P, Bhat, SK, K, JP, Rao, PK, Ambiger, KD, Brn, M, et al.. Data-driven prediction of polymer nanocomposite tensile strength through Gaussian process regression and Monte Carlo simulation with enhanced model reliability. J Compos Sci 2025;9:364. https://doi.org/10.3390/jcs9070364.Search in Google Scholar
21. Shrestha, S, Barvenik, KJ, Chen, T, Yang, H, Kesavan, MM, Little, JM, et al.. Machine intelligence accelerated design of conductive MXene aerogels with programmable properties. Nat Commun 2024;15:4685. https://doi.org/10.1038/s41467-024-49011-8.Search in Google Scholar PubMed PubMed Central
22. Zheng, B, Zheng, Z, Gu, GX. Uncertainty quantification and prediction for mechanical properties of graphene aerogels via Gaussian process metamodels. Nano Futures 2021;5:045004. https://doi.org/10.1088/2399-1984/ac3c8f.Search in Google Scholar
23. Younus, ZK, Younus, KK, Abbas, LK, Hussein, AK. A study of cracked nanocomposite plates under mechanical buckling load. AIP Conf Proc 2023;2830:070011. https://doi.org/10.1063/5.0158072.Search in Google Scholar
24. Kareem, MG, Abdularazza, M, Younus, KK, Abdulsamad, HJ, Al-Ansari, LS. Dynamic optimization of a composite material robot arm using a flexible link and joint model. Results Eng 2025;27:105541. https://doi.org/10.1016/j.rineng.2025.105541.Search in Google Scholar
© 2025 the author(s), published by De Gruyter, Berlin/Boston
This work is licensed under the Creative Commons Attribution 4.0 International License.
Articles in the same Issue
- Research Articles
- Modification of polymers to synthesize thermo-salt-resistant stabilizers of drilling fluids
- Study of the electronic stopping power of proton in different materials according to the Bohr and Bethe theories
- AI-driven UAV system for autonomous vehicle tracking and license plate recognition
- Enhancement of the output power of a small horizontal axis wind turbine based on the optimization approach
- Design of a vertically stacked double Luneburg lens-based beam-scanning antenna at 60 GHz
- Synergistic effect of nano-silica, steel slag, and waste glass on the microstructure, electrical resistivity, and strength of ultra-high-performance concrete
- Expert evaluation of attachments (caps) for orthopaedic equipment dedicated to pedestrian road users
- Performance and rheological characteristics of hot mix asphalt modified with melamine nanopowder polymer
- Second-order design of GNSS networks with different constraints using particle swarm optimization and genetic algorithms
- Impact of including a slab effect into a 2D RC frame on the seismic fragility assessment: A comparative study
- Analytical and numerical analysis of heat transfer from radial extended surface
- Comprehensive investigation of corrosion resistance of magnesium–titanium, aluminum, and aluminum–vanadium alloys in dilute electrolytes under zero-applied potential conditions
- Performance analysis of a novel design of an engine piston for a single cylinder
- Modeling performance of different sustainable self-compacting concrete pavement types utilizing various sample geometries
- The behavior of minors and road safety – case study of Poland
- The role of universities in efforts to increase the added value of recycled bucket tooth products through product design methods
- Adopting activated carbons on the PET depolymerization for purifying r-TPA
- Urban transportation challenges: Analysis and the mitigation strategies for road accidents, noise pollution and environmental impacts
- Enhancing the wear resistance and coefficient of friction of composite marine journal bearings utilizing nano-WC particles
- Sustainable bio-nanocomposite from lignocellulose nanofibers and HDPE for knee biomechanics: A tribological and mechanical properties study
- Effects of staggered transverse zigzag baffles and Al2O3–Cu hybrid nanofluid flow in a channel on thermofluid flow characteristics
- Mathematical modelling of Darcy–Forchheimer MHD Williamson nanofluid flow above a stretching/shrinking surface with slip conditions
- Energy efficiency and length modification of stilling basins with variable Baffle and chute block designs: A case study of the Fewa hydroelectric project
- Renewable-integrated power conversion architecture for urban heavy rail systems using bidirectional VSC and MPPT-controlled PV arrays as an auxiliary power source
- Exploitation of landfill gas vs refuse-derived fuel with landfill gas for electrical power generation in Basrah City/South of Iraq
- Two-phase numerical simulations of motile microorganisms in a 3D non-Newtonian nanofluid flow induced by chemical processes
- Sustainable cocoon waste epoxy composite solutions: Novel approach based on the deformation model using finite element analysis to determine Poisson’s ratio
- Impact and abrasion behavior of roller compacted concrete reinforced with different types of fibers
- Architectural design and its impact on daylighting in Gayo highland traditional mosques
- Structural and functional enhancement of Ni–Ti–Cu shape memory alloys via combined powder metallurgy techniques
- Design of an operational matrix method based on Haar wavelets and evolutionary algorithm for time-fractional advection–diffusion equations
- Design and optimization of a modified straight-tapered Vivaldi antenna using ANN for GPR system
- Analysis of operations of the antiresonance vibration mill of a circular trajectory of chamber vibrations
- Functions of changes in the mechanical properties of reinforcing steel under corrosive conditions
- Enhanced PAPR reduction in NOMA systems using modified SLM and PTS techniques for power-efficient 5G and beyond networks
- Hybrid mechanics-informed machine learning models for predicting mechanical failure in graphene sponge: a low-data strategy for mechanical engineering applications
- Design of shafts of a two-piece chain conveyor as a part of a modification of a mobile working machine
- Review Articles
- A modified adhesion evaluation method between asphalt and aggregate based on a pull off test and image processing
- Architectural practice process and artificial intelligence – an evolving practice
- 10.1515/eng-2025-0148
- Special Issue: 51st KKBN - Part II
- The influence of storing mineral wool on its thermal conductivity in an open space
- Use of nondestructive test methods to determine the thickness and compressive strength of unilaterally accessible concrete components of building
- Use of modeling, BIM technology, and virtual reality in nondestructive testing and inventory, using the example of the Trzonolinowiec
- Tunable terahertz metasurface based on a modified Jerusalem cross for thin dielectric film evaluation
- Integration of SEM and acoustic emission methods in non-destructive evaluation of fiber–cement boards exposed to high temperatures
- Non-destructive method of characterizing nitrided layers in the 42CrMo4 steel using the amplitude-frequency technique of eddy currents
- Evaluation of braze welded joints using the ultrasonic method
- Analysis of the potential use of the passive magnetic method for detecting defects in welded joints made of X2CrNiMo17-12-2 steel
- Analysis of the possibility of applying a residual magnetic field for lack of fusion detection in welded joints of S235JR steel
- Eddy current methodology in the non-direct measurement of martensite during plastic deformation of SS316L
- Methodology for diagnosing hydraulic oil in production machines with the additional use of microfiltration
- Special Issue: IETAS 2024 - Part II
- Enhancing communication with elderly and stroke patients based on sign-gesture translation via audio-visual avatars
- Optimizing wireless charging for electric vehicles via a novel coil design and artificial intelligence techniques
- Evaluation of moisture damage for warm mix asphalt (WMA) containing reclaimed asphalt pavement (RAP)
- Comparative CFD case study on forced convection: Analysis of constant vs variable air properties in channel flow
- Evaluating sustainable indicators for urban street network: Al-Najaf network as a case study
- Node failure in self-organized sensor networks
- Comprehensive assessment of side friction impacts on urban traffic flow: A case study of Hilla City, Iraq
- Design a system to transfer alternating electric current using six channels of laser as an embedding and transmitting source
- Security and surveillance application in 3D modeling of a smart city: Kirkuk city as a case study
- Modified biochar derived from sewage sludge for purification of lead-contaminated water
- The future of space colonisation: Architectural considerations
- Design of a Tri-band Reconfigurable Antenna Using Metamaterials for IoT Applications
- Special Issue: AESMT-7 - Part II
- Experimental study on behavior of hybrid columns by using SIFCON under eccentric load
- Special Issue: ICESTA-2024 and ICCEEAS-2024
- A selective recovery of zinc and manganese from the spent primary battery black mass as zinc hydroxide and manganese carbonate
- Special Issue: REMO 2025 and BUDIN 2025
- Predictive modeling coupled with wireless sensor networks for sustainable marine ecosystem management using real-time remote monitoring of water quality
- Management strategies for refurbishment projects: A case study of an industrial heritage building
- Structural evaluation of historical masonry walls utilizing non-destructive techniques – Comprehensive analysis