Sustainable cocoon waste epoxy composite solutions: Novel approach based on the deformation model using finite element analysis to determine Poisson’s ratio
-
Sutha Loidueanchai
 and
Achira Artnaseaw
and
Achira Artnaseaw

Abstract
Poisson’s ratio is essential in composite analysis and design. This study presents a novel method for determining the modulus of elasticity and Poisson’s ratio of cocoon waste epoxy composites (CWECs) using FEA, validated through tensile testing. The deformation curve was first established experimentally, followed by Latin Hypercube Sampling (LHS) in MATLAB to generate 20 data pairs, enhancing result reliability. In the subsequent phase, detailed structural models of CWEC were constructed using PowerShape, and simulations were performed in ANSYS to analyze mechanical behavior. Validation was achieved by comparing the simulated deformations with empirical test data, with RMSE used as the primary accuracy metric. The results yielded an RMSE of 0.2181, indicating a strong correlation between the FEA model and experimental observations. This confirms the reliability of the derived values for modulus of elasticity (565.57 MPa) and Poisson’s ratio (0.4564). Further validation of Poisson’s ratio for CWEC was conducted by comparing the simulation outcomes with experimental data in accordance with ASTM standards. The findings revealed a high degree of correlation between the two methods, with a similarity of 94.21%.
1 Introduction
Natural fiber-reinforced epoxy resin composites have garnered significant attention as a viable alternative to conventional synthetic fiber composites in engineering and structural applications. These composites, which consist of an epoxy resin matrix reinforced with natural fibers such as hemp fiber [1], Piassava fiber [2], Bamboo cellulose fiber [3], Ramie faber [4], Kenaf fiber [5], and flax fiber [6], offer enhanced mechanical properties, positioning them as suitable candidates for a wide range of industries, including automotive [7], aerospace [8], and construction [9,10]. The increasing interest in these materials is largely attributed to their environmental sustainability [11,12], cost-efficiency, and their potential to provide lightweight and high-strength solutions, thereby addressing the growing demand for sustainable engineering materials [13].
Poisson’s ratio is a key parameter in fiber-reinforced epoxy composites, indicating the material’s ability to deform transversely under longitudinal stress [14]. It is influenced by the properties of both the fiber and matrix, their volume fractions, and fiber orientation [15]. For unidirectional composites, Poisson’s ratio typically ranges from 0.20 to 0.50, depending on the materials used [16,17,18]. This ratio is crucial for predicting mechanical behavior and designing materials with specific properties [19]. Mechanical properties, including Poisson’s ratio, are assessed using micromechanical and experimental methods. Models account for the contributions of fiber and matrix, while techniques like tensile testing and digital image correlation validate these predictions. Understanding these properties is vital for industries such as aerospace [15], automotive [20], and civil engineering [21]. Recent advancements have led to hybrid composites that combine different fibers to optimize mechanical properties. These hybrids can achieve unique Poisson’s ratios, offering tailored solutions for specific applications [22]. Such innovations drive the development of next-generation composites with improved performance and reliability.
Accurate testing of Poisson’s ratio in fiber-reinforced epoxy composites necessitates the use of precise methodologies. One widely adopted approach involves the application of strain gauges to measure longitudinal and transverse strains under uniaxial loading, with Poisson’s ratio calculated as the negative ratio of these strains. The reliability of this method is contingent upon the quality of the strain gauges and the precision of the data acquisition system [23]. Digital image correlation, a non-contact optical technique, provides a detailed assessment of strain distribution by capturing and analyzing images of the specimen during deformation [24]. This method is particularly well-suited for complex loading scenarios and mitigates the risk of altering the specimen’s behavior by eliminating the need for physical sensors. Dynamic mechanical analysis is employed to evaluate Poisson’s ratio in viscoelastic composites, measuring the material’s response to oscillatory stress. By analyzing the phase lag between applied stress and resulting strain, dynamic mechanical analysis provides insights into the temperature and frequency dependence of Poisson’s ratio [25]. Each testing method presents distinct advantages and limitations, with the selection of technique determined by factors such as the type of composite and the specific loading conditions. Continued advancements in testing technologies will further enhance the accuracy of Poisson’s ratio measurements in fiber-reinforced epoxy composites [26].
Cocoon waste epoxy composites (CWECs), a subset of fiber-reinforced epoxy materials, present several advantages, positioning them as promising candidates for diverse engineering applications. One of their primary benefits is sustainability, as the use of silkworm cocoon waste minimizes environmental impact and promotes the utilization of renewable resources [27]. This aligns with the increasing demand for environmentally friendly materials in sectors such as automotive and construction. In addition to their eco-friendly nature, these composites exhibit outstanding mechanical properties, including high tensile strength and impact resistance [28]. The inherent toughness of silkworm cocoons enhances the composite’s durability, making them particularly well-suited for protective gear and ballistic panels. Moreover, CWECs demonstrate exceptional thermal stability, maintaining their integrity under elevated temperatures, which is advantageous in aerospace and automotive industries [29]. From an economic perspective, the use of waste materials from the silk industry significantly reduces raw material costs, making CWEC a cost-effective alternative to traditional synthetic fiber-reinforced composites. With ongoing research and development, these composites hold great potential for further optimization and broader adoption in a variety of industrial applications. Fiber-reinforced composites typically exhibit anisotropic behavior, with mechanical properties like tensile strength and modulus varying based on the direction of applied force. However, CWECs have been found to demonstrate isotropic characteristics under certain processing conditions, resulting in uniform mechanical properties in all directions. This isotropy is due to the random distribution of cocoon waste fibers within the epoxy matrix, which ensures consistent reinforcement across all orientations [30]. Strong interfacial bonding between the fibers and epoxy resin further promotes uniform stress distribution, enabling effective load transfer regardless of direction, thereby enhancing the composite’s isotropic mechanical behavior [31]. Consequently, these composites are well-suited for applications requiring consistent mechanical performance, especially in structural components subjected to multi-directional loads. To assess the mechanical properties of cocoon waste-epoxy composites, an isotropic material model is often used to determine parameters like modulus of elasticity and Poisson’s ratio, given their uniform response to mechanical stresses.
Poisson’s ratio is a crucial parameter in the analysis of natural fiber epoxy composites, influencing their mechanical performance under various loading conditions. For example, both the modulus of elasticity and Poisson’s ratio play essential roles in finite element analysis (FEA), which simulates the behavior of these composites. Micromechanical models like the Rule of Mixtures and Halpin–Tsai equations are often used to estimate elastic properties based on the fiber volume fraction and orientation. Researchers applied these models to banana, jute, and pineapple leaf fiber composites in a polylactic acid matrix, observing a general decrease in Poisson’s ratio with increasing fiber content, except in sisal composites [32]. However, due to fiber morphology and interfacial variability, experimental calibration is often required. Tensile testing, especially according to ASTM D3039, remains essential for validating such models. Empirical data [33] highlight the importance of fiber alignment and stiffness on transverse response and reinforce the value of combining theoretical and experimental methods. FEA enables detailed simulations of natural-fiber composites using realistic geometries and material properties. Simulations conducted using ANSYS Workbench facilitated a comparative analysis between banana fiber/polylactic acid composites and polyethylene terephthalate composites, highlighting the promising potential of natural fiber-reinforced materials for environmentally sustainable applications [32]. Advanced FEA techniques, including representative volume elements and multiscale modeling, have proven effective in capturing anisotropic behavior [34]. Hybrid approaches integrating FEA and experimental data, such as the numerical homogenization method used by Adeniyi et al. [35], offer reliable predictions and now serve as benchmarks. Therefore, any new method must demonstrate improved accuracy, efficiency, or applicability.
This study presents an innovative methodology for determining Poisson’s ratio of CWEC. The proposed approach employs foundational models to predict the mechanical behavior of these composites by integrating empirical data with theoretical analysis. These models indicate that Poisson’s ratio can be tailored by modifying cell geometry, such as the cell wall thickness and angle of hexagonal cells. Advanced numerical techniques, particularly FEA, are utilized to perform detailed simulations that accommodate complex geometries and material behaviors under various loading conditions. In addition, experimental methods were employed to validate the theoretical and computational models, with results providing critical insights and confirming model accuracy. Overall, these integrated approaches underscore the significance of combining theoretical, computational, and experimental methodologies to achieve a comprehensive understanding and optimization of the mechanical properties of CWEC.
2 Materials and methods
2.1 Procedure
The structured workflow procedure is designed to achieve specific objectives efficiently through the systematic integration of various components and adherence to established protocols. This organized approach facilitates the effective completion of tasks. A thorough explanation of the process requires identifying its key phases and dependencies, which is essential for improving both understanding and operational efficiency. Initially, the deformation curve of CWEC was determined through tensile testing. Subsequently, the study utilized LHS implemented via MATLAB software (The MathWorks, Inc., Natick, MA, USA) to calculate key mechanical properties, including the modulus of elasticity and Poisson’s ratio. In the third phase, detailed CWEC structural models were generated using PowerShape software, developed by Autodesk Inc. (San Rafael, CA, USA). Following model generation, the simulation process was conducted using ANSYS Workbench, a sophisticated computational tool developed by ANSYS Inc. (Canonsburg, PA, USA). The research placed particular emphasis on FEA and its consistency with experimentally validated data from CWEC, as demonstrated in Figure 1.
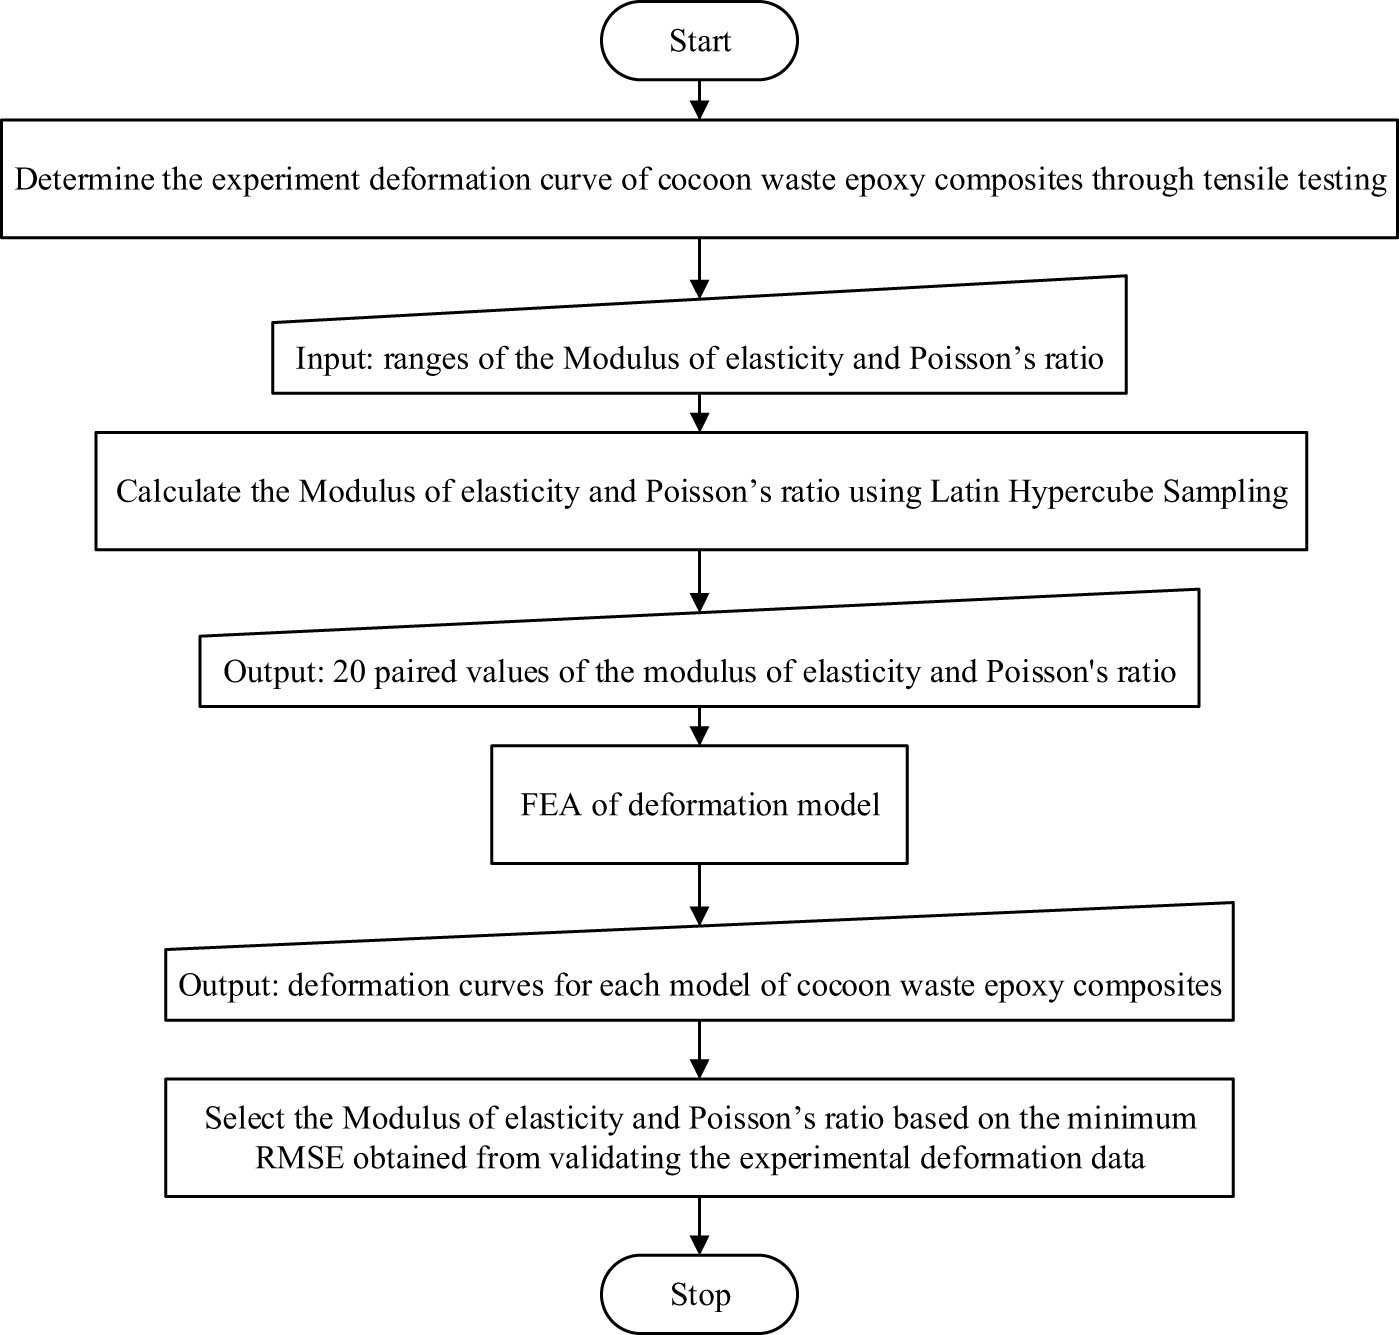
Workflow for the novel methodology based on the deformation model and utilizing FEA.
2.2 Tensile testing
The cocoon waste used in this study, sourced from the Nang Noi Sisaket-1 silkworm breed in Sisaket Province, consists of discarded or defective cocoons unsuitable for reeling due to irregular morphology. Typically, the waste has a pointed end, blunt head, a fibrous texture, and averages 3 cm in length and 1.5 cm in width, as shown in Figure 2(a). Its average weight is 6.47–6.55 g per 10 cocoons, with silk lengths ranging from 280 to 950 m. The epoxy resin (CYD-128) used as the matrix has a density of 1,200 kg/m³, and the hardener, EPAMINE PA53, was sourced locally in Thailand. The cured epoxy composites exhibit a hardness exceeding 85 Shore A. The composite plate was fabricated using compression molding. Epoxy resin and hardener were mixed in a 4:1 ratio, producing 50 g of matrix solution, which was degassed to remove air bubbles. Initially, 10 g of the solution was poured into the base of a 15 cm × 15 cm × 20 cm mold. Approximately 50 g of cocoon waste was then evenly distributed, and the remaining resin was poured to fully cover the material. The mold was sealed and compressed at 1.5 MN for 2 h at 25°C. After compression, the specimen was removed and cured at 25°C for 72 h, resulting in fully formed composite panels, as shown in Figure 2(b).
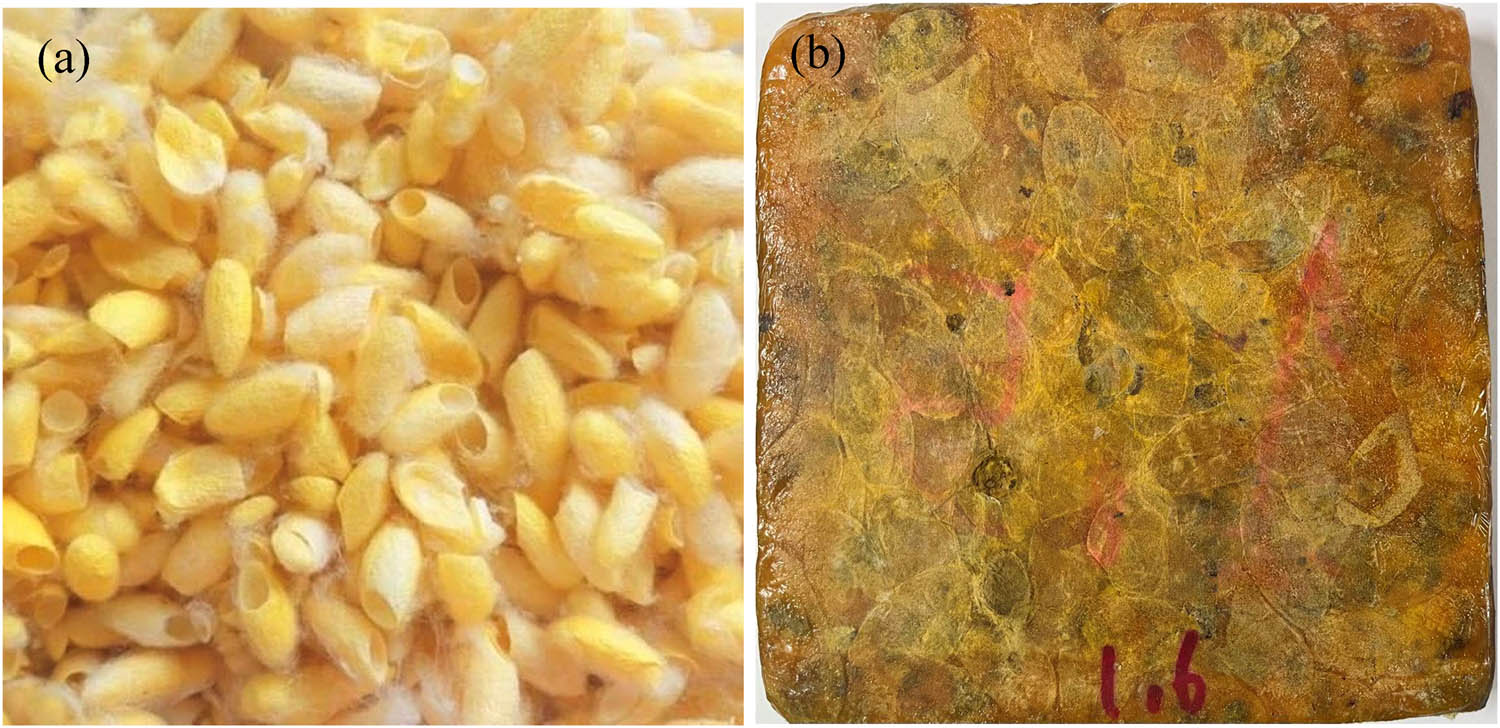
The general macroscopic view of (a) raw cocoon waste materials and (b) CWEC panels.
Tensile testing was conducted at a displacement rate of 5 mm/min until the specimen reached the load cutoff, in accordance with ASTM D638 standards [36]. The experiment utilized the Bluehill software, version 3 (INSTRON Co., Ltd., High Wycombe, Bucks, UK). In experimental tensile tests, the load–extension relationship plays a crucial role in determining the mechanical properties of materials. This method consists of applying tensile force to the specimen and accurately recording the resulting elongation or displacement, as illustrated in Figure 3. These measurements provide the foundation for evaluating the material’s behavior under external forces, contributing to a deeper understanding of its mechanical properties. The experimental deformation curve, derived from these measurements, is subsequently employed to validate the deformation curve generated through FEA models, ensuring consistency between empirical and simulated results. The deformation curve was derived through testing a set of ten specimens in the experimental setup.
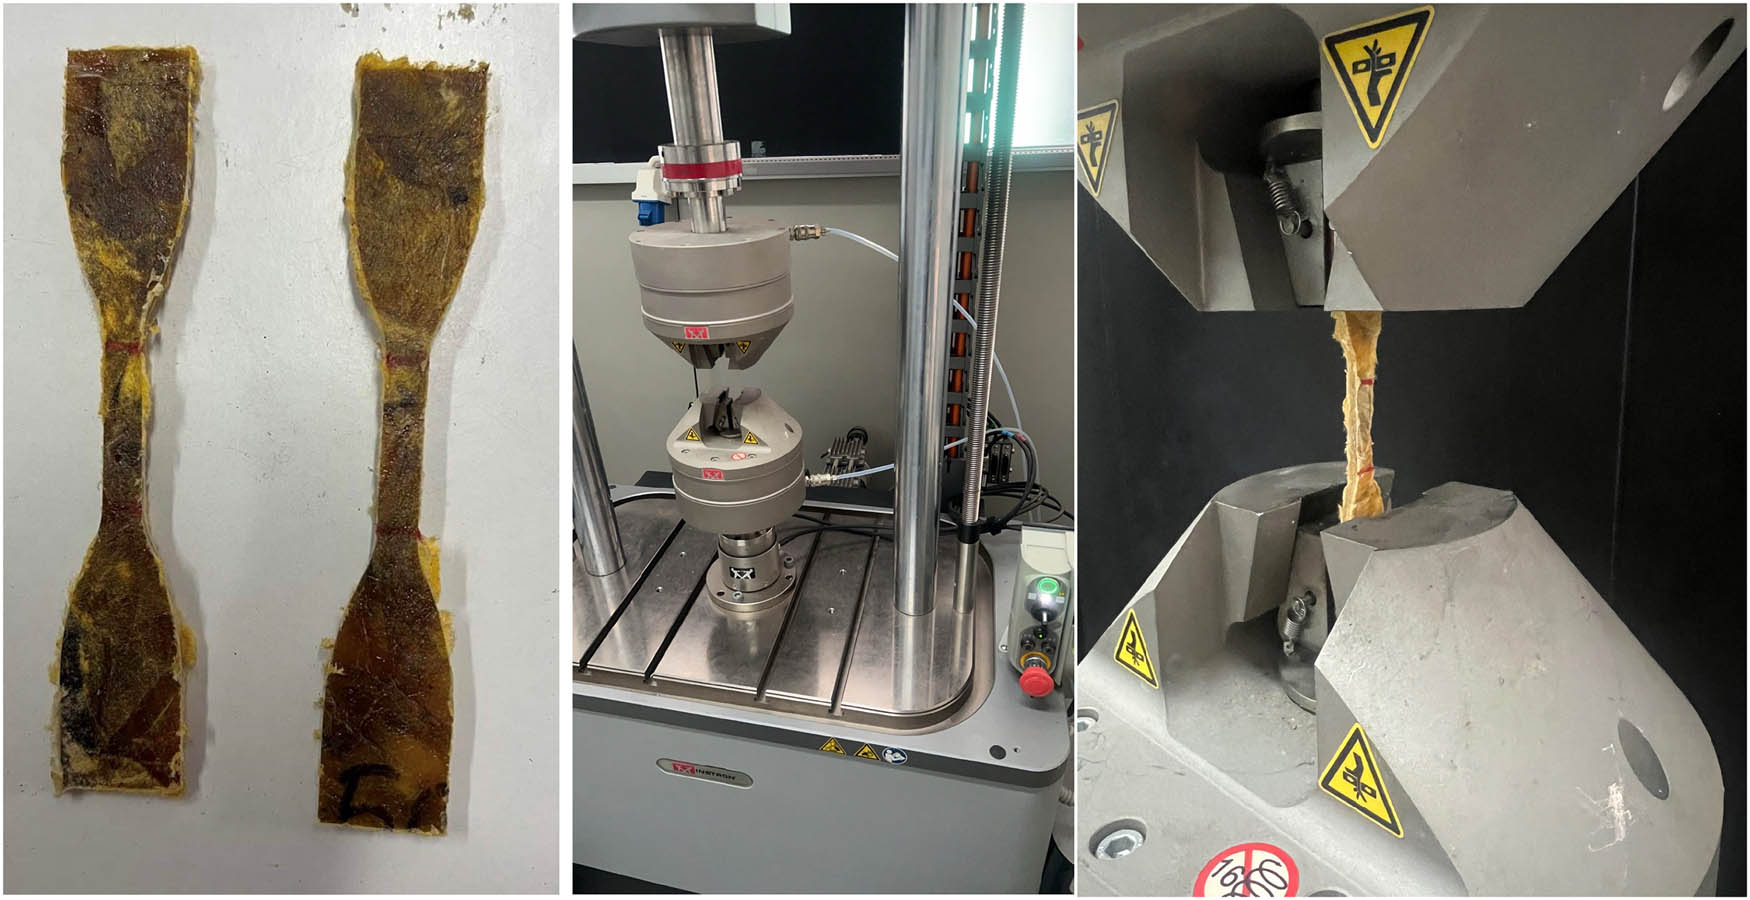
The configuration for the tensile testing of CWEC panels.
2.3 LHS
LHS is a valuable tool in materials science for investigating the properties and behavior of CWEC structures [37]. When applying LHS to CWEC structures, the goal is to systematically explore the parameter space, encompassing design variables and manufacturing conditions that influence the material’s properties. This process begins with identifying the key design variables, such as geometric parameters, material properties, or manufacturing conditions, that affect the CWEC structure. Crucial to this step is defining the ranges and discretization levels for each variable, including the minimum and maximum values for parameters such as cell size and the number of intervals within each range. Based on this defined parameter space, a Latin hypercube design is generated. The LHS algorithm ensures that the sampling of design variables is both even and representative, allowing for a diverse exploration of CWEC structure configuration.
For each experimental run or simulation, specific values are assigned to the design variables according to the Latin hypercube design, creating unique combinations of design parameters for each trial. These parameter sets are then used to either simulate the behavior of CWEC structures through computational methods or to fabricate physical prototypes with varying parameter combinations. Once the physical prototypes are fabricated, measurements of material properties, such as mechanical strength, stiffness, or thermal conductivity, are conducted. In parallel, simulations provide relevant material property data derived from computational results. The collected data from both experiments and simulations are analyzed to assess the material properties corresponding to each set of design variables. Statistical analysis and data visualization techniques are then employed to identify trends and correlations between the design parameters and material properties. By utilizing LHS in the study of CWEC structures, researchers can efficiently explore the influence of various design variables, optimize structural performance, balance trade-offs between different properties, and gain valuable insights into the behavior of these unique cellular materials.
The exit is divided into M sub-intervals, resulting in the occurrence of the jth sub-interval for the ith design variable X i :
The points within each sub-range were subsequently generated through uniform random sampling of a point X ij within the jth sub-interval corresponding to the ith design variable, employing the Monte Carlo method:
After obtaining
2.4 Finite element analysis (FEA)
FEA is a powerful numerical technique widely used in engineering to simulate the physical behavior of structures and materials [34]. This approach involves dividing complex geometries into smaller, more manageable elements, which facilitates detailed analysis of behavior under various conditions. FEA has demonstrated effectiveness in predicting stress, strain, and deformation, providing engineers with critical insights into structural performance prior to the construction of physical prototypes. Moreover, this methodology is applicable across a diverse range of engineering disciplines, including mechanical, civil, aerospace, and biomedical engineering. When applying FEA to model the CWEC structure, it is essential to establish an appropriate mathematical framework. This framework is characterized by specific equations that depend on key model details, including material properties, geometry, and loading conditions. A simplified representation of the finite element formulation for the CWEC structure can be articulated through a general structural equation based on force equilibrium, particularly within the context of linear elastic analysis:
In this discussion, K (N/mm) is referred to as the stiffness matrix, U (mm) represents the displacement vector, and F (N) signifies the force vector. The stiffness matrix encompasses material properties, such as the modulus of elasticity (E), measured in MPa, and Poisson’s ratio (
2.5 Verification of experimental results
To validate the simulation results, an experimental investigation of Poisson’s ratio was conducted in accordance with the ASTM D3039 standard [38]. The experiment involved testing ten specimens, and the standard error was calculated to compare the experimental findings with the simulation data. For fiber-reinforced polymer composite materials, the determination of Poisson’s ratio follows the ASTM D3039 standard, which outlines the procedures for assessing the tensile properties of reinforced polymer composites under controlled conditions. In this study, an Instron Electropulse E10000 (INSTRON Co., Ltd., High Wycombe, Bucks, UK) was used, equipped with a dynamic extensometer featuring a 12.5 mm gauge length, ±5 mm travel, and 0.01 mm accuracy. Poisson’s ratio testing process comprised several steps. First, dog-bone-shaped test specimens were fabricated from the composite material according to specific dimensions and geometry. Second, strain gauges or extensometers were attached to the specimen in both axial (loading) and transverse directions to measure longitudinal and lateral strains during the tensile loading process. Next, the prepared specimen was mounted in a tensile testing machine and subjected to uniaxial tensile loading until failure, with load and strain data continuously recorded throughout. Finally, Poisson’s ratio was determined by calculating the negative ratio of lateral strain to axial strain, focusing on the elastic region of the stress–strain curve.
3 Results and discussion
The CWEC specimen model was developed using PowerShape software to assess its mechanical properties through tensile testing. The specimen’s dimensions, shown in Figure 4, were carefully predefined to ensure accurate evaluation of the material’s behavior under tensile loading. These dimensions, along with the specific testing conditions, were intentionally designed to enable a precise analysis of the material’s response to tension. Additionally, these parameters enhance the overall tensile testing process, allowing for a more comprehensive assessment of the CWEC’s mechanical properties.
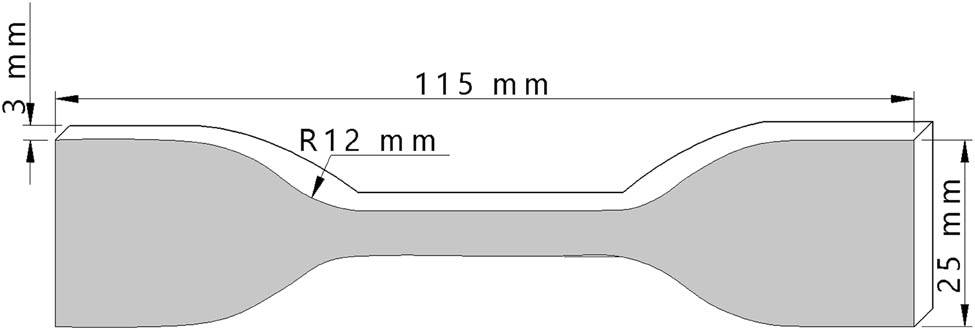
Dimensions of the CWEC specimen model used for FEA.
3.1 LHS modulus of elasticity and Poisson’s ratio
The LHS method has gained widespread adoption in research due to its effectiveness and ease of implementation. To support this approach, an experimental program was developed in MATLAB, allowing for the assignment of 20 distinct values to each design variable. The range for modulus of elasticity was set between 300 and 600 MPa, while Poisson’s ratio was defined between 0.3 and 0.5. These values were derived from the deformation analysis of the tensile test conducted on CWEC, in conjunction with the findings reported by Gere and Goodno [16] and Chowdary et al. [17]. These values were subsequently analyzed using the FEA to calculate the deformation for the 20 models presented in Figure 5. In this figure, the modulus of elasticity is plotted on the vertical axis, and Poisson’s ratio is plotted on the horizontal axis, offering a clear visual representation of the normal data distribution within the specified ranges. The randomization process employed in this study is based on a uniform data distribution.

The findings obtained using the LHS technique, utilizing 20 pairs of input variables.
The results obtained from incorporating the modulus of elasticity and Poisson’s ratio parameters into the computation of 20 FEA models are presented in Table 1.
Optimization results for determining the modulus of elasticity and Poisson’s ratio using a surrogate model
| Model | Modulus of elasticity (MPa) | Poisson’s ratio | Validated RMSE | 95% CI |
|---|---|---|---|---|
| Mean ± SEM | ||||
| Model 1 | 350.24 | 0.4870 | 0.8465 ± 0.0706 | 0.7867–0.9062 |
| Model 2 | 387.00 | 0.4166 | 0.6563 ± 0.0824 | 0.6022–0.7103 |
| Model 3 | 311.25 | 0.4473 | 1.1079 ± 0.0765 | 1.0232–1.1927 |
| Model 4 | 546.41 | 0.3273 | 0.2257 ± 0.0741 | 0.2090–0.2424 |
| Model 5 | 565.57 | 0.4564 | 0.2181 ± 0.0718 | 0.2024–0.2337 |
| Model 6 | 365.26 | 0.3172 | 0.7682 ± 0.0776 | 0.7086–0.8279 |
| Model 7 | 517.50 | 0.3720 | 0.2560 ± 0.0804 | 0.2354–0.2766 |
| Model 8 | 457.50 | 0.3880 | 0.3897 ± 0.0694 | 0.3626–0.4167 |
| Model 9 | 318.00 | 0.3420 | 1.0622 ± 0.0760 | 0.9815–1.1430 |
| Model 10 | 574.91 | 0.4067 | 0.2181 ± 0.0734 | 0.2021–0.2341 |
| Model 11 | 337.50 | 0.3926 | 0.9284 ± 0.0716 | 0.8619–0.9949 |
| Model 12 | 441.66 | 0.4362 | 0.4381 ± 0.0699 | 0.4075–0.4687 |
| Model 13 | 507.00 | 0.4246 | 0.2721 ± 0.0772 | 0.2511–0.2931 |
| Model 14 | 412.50 | 0.4720 | 0.5435 ± 0.0786 | 0.5008–0.5862 |
| Model 15 | 395.11 | 0.3637 | 0.6206 ± 0.0814 | 0.5701–0.6712 |
| Model 16 | 432.00 | 0.3021 | 0.4742 ± 0.0801 | 0.4363–0.5122 |
| Model 17 | 468.00 | 0.3362 | 0.3609 ± 0.0771 | 0.3331–0.3887 |
| Model 18 | 534.43 | 0.4942 | 0.2340 ± 0.0688 | 0.2179–0.2501 |
| Model 19 | 488.94 | 0.4674 | 0.3067 ± 0.0726 | 0.2845–0.3290 |
| Model 20 | 596.47 | 0.3550 | 0.2250 ± 0.0784 | 0.2074–0.2426 |
SEM = standard error of mean; CI = confidence interval.
3.2 FEA simulation
The boundary conditions applied during the tensile testing of CWEC are critical for accurately capturing the material’s mechanical behavior. At the fixed end of the specimen, displacement is constrained to zero, while at the moving end, the applied force is either controlled or measured, providing essential input load data for the tensile test. This configuration ensures that the test reliably reflects the actual mechanical response of the CWEC material. Figure 6 illustrates the boundary conditions employed in the simulation. The finite element mesh consists of 9,000 elements and 46,602 nodes. The element size in finite element models of specimens varies depending on the region of interest. Accurate stress analysis in the gauge and fillet transition areas, where stress gradients peak, necessitates the use of fine mesh elements with edge lengths near 0.5 mm. Conversely, in less critical regions such as the grip sections, a coarser mesh with element edge lengths of 1.0 mm is generally sufficient. To ensure numerical accuracy and minimize distortion, it is essential to maintain an element aspect ratio close to unity. The use of a structured mesh with a gradual transition between fine and coarse regions is recommended to achieve an optimal balance between computational efficiency and solution fidelity. In particular, localized mesh refinement should be applied in the fillet regions, where geometric discontinuities can lead to elevated stress concentrations. Capturing these localized effects accurately is crucial for evaluating mechanical performance and predicting failure. To ensure the reliability of simulation results, mesh convergence studies should be systematically performed. This involves refining the mesh and monitoring the variation in stress or strain at key locations within the model. A variation of less than 3% between successive mesh refinements is accepted as an indicator of adequate mesh convergence and model stability.

Boundary conditions applied in the analysis: (a) distributed load with a fixed support, and (b) meshing of the tensile model using the quadratic hexahedral element.
FEA will be performed on each model, applying load values ranging from 10 to 300 N to calculate the corresponding elongation distances. The results from the elongation phase tests for each model will then be compared with data obtained from actual tensile test experiments. To validate the tensile test results for CWEC using FEA, the root mean square error (RMSE) will be used as a key statistical measure to evaluate how accurately the simulation represents the material’s deformation behavior. RMSE quantifies the discrepancies between experimental data and simulated results by assessing the differences between observed and predicted values. A lower RMSE indicates a closer alignment between FEA predictions and experimental observations [39], suggesting that the simulation effectively reflects the real-world deformation behavior of CWEC under tensile loading, as illustrated in Figure 7. Calculating RMSE allows for the evaluation of agreement between experimental and simulated results. For example, a low RMSE value indicates that the FEA model successfully captures the deformation patterns observed in physical tests. Therefore, RMSE is a reliable metric for comparing deformation behavior in tensile testing with FEA predictions [39]. Minimizing RMSE is essential for validating the FEA model and ensuring its accuracy in representing the mechanical performance of CWEC under tensile stress [40]. This validation is critical for both material research and design applications. The minimum RMSE observed for Model 5 is 0.2181, as shown in Table 1, with corresponding modulus of elasticity and Poisson’s ratio values of 565.57 MPa and 0.4564, respectively.
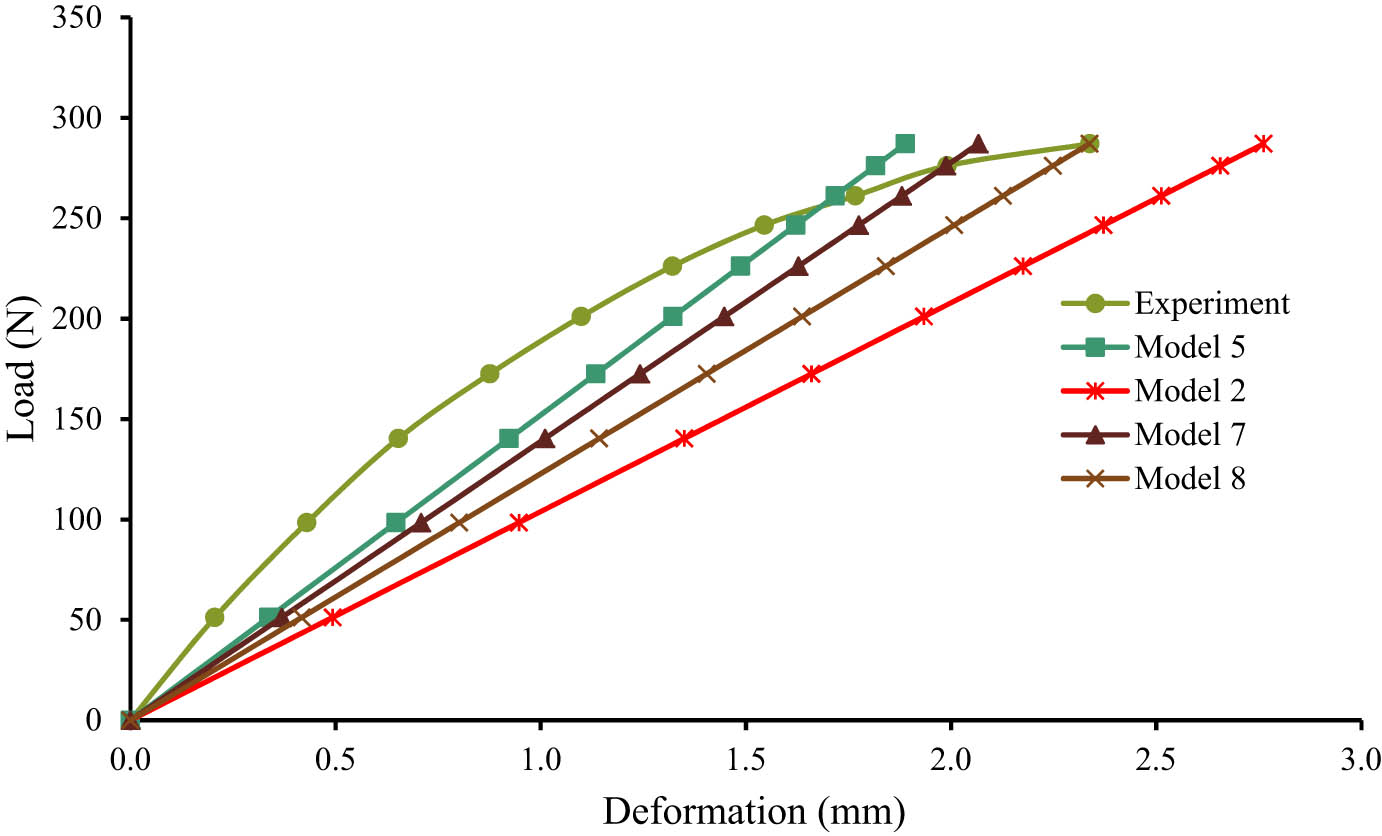
Deformation comparison between the results of the experiment and some simulation data.
A total of ten specimens were employed in the experimental procedure. Given the limited sample size, the confidence interval (CI) for RMSE of CWEC was calculated using the t-distribution rather than the normal distribution due to the increased statistical uncertainty inherent in small datasets. For a 95% confidence level with a sample size of ten, the CI is computed using the following equation:
where
This approach is widely adopted in the analysis of composite materials due to its robustness in handling small sample sizes. The calculated CI values are presented in Table 1, with SEM ranging from 0.0694 to 0.0824. The relatively wide CI indicates a higher degree of uncertainty in the mechanical behavior of the material. This variability is attributed to the natural heterogeneity of plant-based fibers, including variations in fiber diameter, cellulose content, and fiber–matrix interfacial bonding, which contribute to broader CIs compared to those observed in synthetic fiber composites [41,42,43].
The validation of numerical simulations was performed by comparing the simulation outcomes with the experimental results. Specifically, Poisson’s ratio of CWEC was measured in both the numerical simulations and the experimental tests. The findings indicate a high degree of correlation between the two approaches, with a similarity of 94.21%, corresponding to an error margin of 5.79%.
FEA simulations are critical for understanding the mechanical behavior of CWEC during tensile testing. These simulations provide detailed insights into stress distribution, deformation patterns, and strain energy within the material. Several factors affect the accuracy of FEA results, including boundary conditions, material properties, geometric configuration, and the time-dependent behavior of the composite. By analyzing these variables, FEA reveals the formation of complex stress fields, especially in cases of significant deformation. Accurately modeling stress distribution is essential for predicting the mechanical performance of CWEC, identifying potential failure points, and optimizing designs that rely on its tensile properties. For example, as illustrated in Figure 8, the maximum recorded stress reached 18.98 MPa, while the peak observed deformation was 1.89 mm.
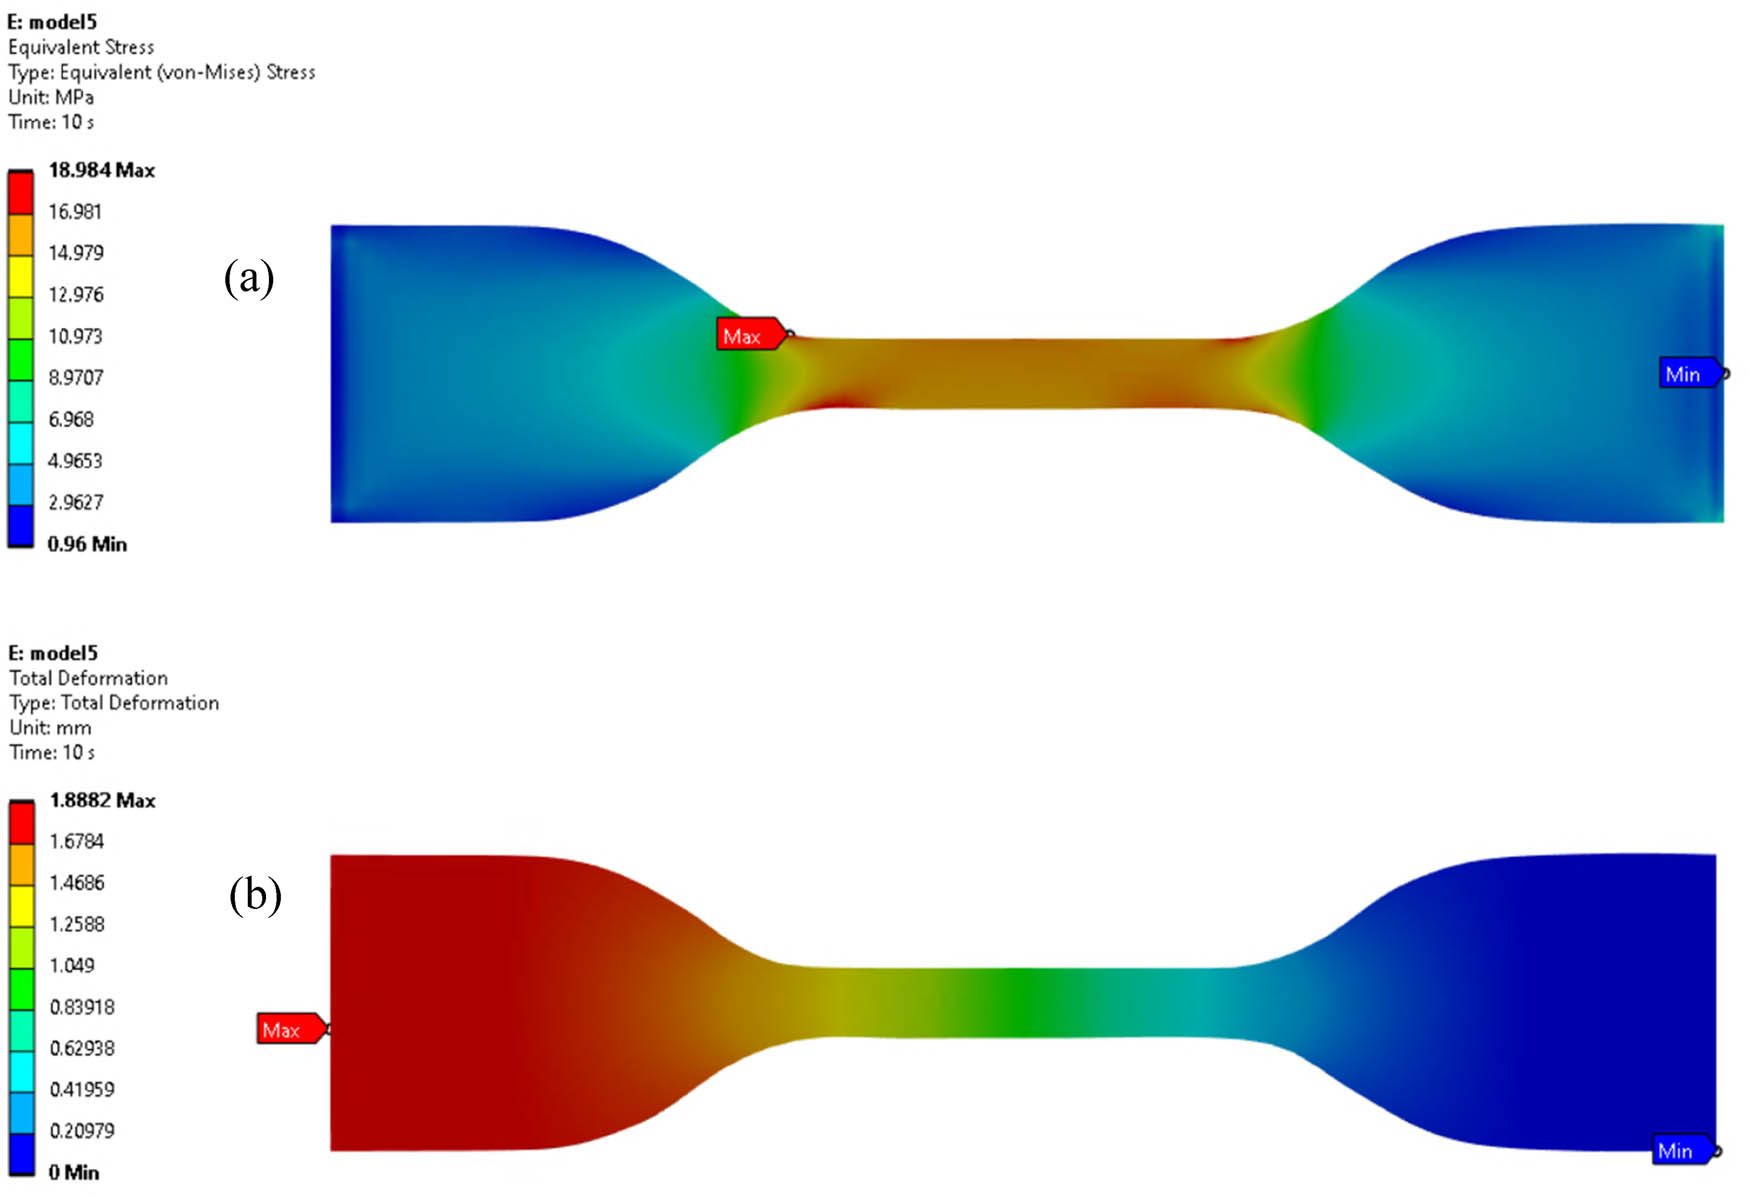
(a) Stress distribution and (b) deformation in CWEC subjected to load extension.
4 Conclusion
This study focuses on determining the modulus of elasticity and Poisson’s ratio of CWEC using FEA, with validation achieved through comparative tensile testing. To improve the robustness and reliability of the validation process, 20 data pairs were generated utilizing the LHS method, allowing for a thorough exploration of the parameter space. The validation process involved systematically comparing the simulated deformations to empirical test results, employing RMSE as the primary measure of accuracy. The analysis yields the following conclusions:
The observed RMSE of 0.2181 demonstrates a strong agreement between the FEA model and experimental observations, thereby confirming the reliability of the identified values for the modulus of elasticity (565.57 MPa) and Poisson’s ratio (0.4564).
The validation of Poisson’s ratio for CWEC was accomplished by comparing simulation outcomes with experimental data. The results indicate a high degree of correlation between the two approaches, with a similarity of 94.21%, corresponding to an error percentage of 5.79%.
5 Future work
Building upon the promising outcomes of the present study, future research should extend the proposed methodology to a wider range of natural fiber and waste-derived composite materials to evaluate its generalizability. Further investigations into the influence of fiber content, orientation, and matrix composition on Poisson’s ratio and the modulus of elasticity are warranted to gain a more comprehensive understanding of the mechanical behavior of such composites. Moreover, the simulation framework may be refined by incorporating dynamic loading scenarios, environmental factors (e.g., temperature and humidity), and long-term degradation effects to improve its predictive accuracy. The integration of machine learning algorithms with FEA for real-time parameter optimization also represents a promising direction for advancing the design and performance prediction of composite materials.
Acknowledgments
The authors would like to express their sincere gratitude to Dr. Kriengkrai Nabudda for his valuable contributions to the revision of the manuscript, particularly in relation to the finite element analysis and the interpretation of the results. The authors are also deeply grateful to the Faculty of Engineering, Khon Kaen University, for its generous financial support, specifically in covering doctoral-level tuition fees, which was instrumental in facilitating the progress of this postgraduate research. In addition, the successful completion of this study was greatly supported by the expertise, facilities, and resources provided by the Center for Alternative Energy Research and Development, Khon Kaen University, Khon Kaen, Thailand.
-
Funding information: The authors state no funding involved.
-
Author contributions: All authors have accepted responsibility for the entire content of this manuscript and consented to its submission to the journal, reviewed all the results and approved the final version of the manuscript. Sutha Loidueanchai took the lead in conceptualizing and designing the study, as well as in collecting, analyzing, and interpreting the data. Apichart Artnaseaw provided supervision, secured funding, and played a key role in drafting the manuscript. Furthermore, Apichart Artnaseaw offered critical feedback to ensure the manuscript’s accuracy, coherence, and compliance with scholarly standards. Achira Artnaseaw provided essential guidance throughout the research process, contributing significantly to refining the research questions, developing the methodology, and interpreting the findings.
-
Conflict of interest: The authors state no conflict of interest.
-
Data availability statement: The datasets generated and/or analyzed during the course of this study are available from the corresponding author upon reasonable request.
References
[1] Deshmukh GS. Advancement in hemp fibre polymer composites: A comprehensive review. J Polym Eng. 2022;42:575–98.10.1515/polyeng-2022-0033Search in Google Scholar
[2] Da F, Filho CG, Monteiro SN. Piassava fiber as an epoxy matrix composite reinforcement for ballistic armor applications. J Miner Met Mater Soc. 2018;71:801–8.10.1007/s11837-018-3148-xSearch in Google Scholar
[3] Behera D, Pattnaik SS, Nanda D, Mishra PP, Manna S, Behera AK. A review on bamboo fiber reinforced composites and their potential applications. Emergent Mater. 2025;8:157–72.10.1007/s42247-024-00832-9Search in Google Scholar
[4] Cai M, Liu J, Zhang X, Ma Q, Wang D, Waterhouse GIN, et al. Mechanical stability of carbon/ramie fiber hybrid composites under hygrothermal aging. Appl Compos Mater. 2024;31:1–20.Search in Google Scholar
[5] Da Silva TT, Mendonça Da Silveira PHP, Ribeiro MP, Lemos MF, Da Silva AP, Monteiro SN, et al. Thermal and chemical characterization of kenaf fiber (Hibiscus cannabinus) reinforced epoxy matrix composites. Polymers (Basel). 2021;13:1–15.10.3390/polym13122016Search in Google Scholar PubMed PubMed Central
[6] Bambach MR. Direct comparison of the structural compression characteristics of natural and synthetic fiber-epoxy composites: Flax, jute, hemp, glass and carbon fibers. Fibers. 2020;8:1–14.10.3390/fib8100062Search in Google Scholar
[7] Mahmud MZAl, Rabbi SMF, Islam MD, Hossain N. Synthesis and applications of natural fiber-reinforced epoxy composites: A comprehensive review. SPE Polym. 2025;6:e10161.10.1002/pls2.10161Search in Google Scholar
[8] Singh B, Ahmad KA, Manikandan M, Pai R, Ng EYK, Yidris N. Natural fiber reinforced composites and their role in aerospace engineering. Green hybrid composite in engineering and non-engineering applications. Singapore: Springer; 2023. p. 61–76.10.1007/978-981-99-1583-5_5Search in Google Scholar
[9] Marichelvam MK, Kumar CL, Kandakodeeswaran K, Thangagiri B, Saxena KK, Kishore K, et al. Investigation on mechanical properties of novel natural fiber-epoxy resin hybrid composites for engineering structural applications. Case Stud Constr Mater. 2023;19:e02356.10.1016/j.cscm.2023.e02356Search in Google Scholar
[10] Fairclough PA, Silva T, Golpour A, Patel RV, Yadav A, Winczek J. Physical, mechanical, and thermal properties of natural fiber-reinforced epoxy composites for construction and automotive applications. Appl Sci. 2023;13:5126.10.3390/app13085126Search in Google Scholar
[11] Premnath K, Arunprasath K, Sanjeevi R, Elilvanan R, Ramesh M. Natural/synthetic fiber reinforced hybrid composites on their mechanical behaviors– A review. Interactions. 2024;245:1–18.10.1007/s10751-024-01924-ySearch in Google Scholar
[12] Tasgin Y, Demircan G, Kandemir S, Acikgoz A. Mechanical, wear and thermal properties of natural fiber-reinforced epoxy composite: cotton, sisal, coir and wool fibers. J Mater Sci. 2024;59:10844–57.10.1007/s10853-024-09810-2Search in Google Scholar
[13] Kamarudin SH, Mohd Basri MS, Rayung M, Abu F, Ahmad S, Norizan MN, et al. A review on natural fiber reinforced polymer composites (NFRPC) for sustainable industrial applications. Polymers (Basel). 2022;14:3698.10.3390/polym14173698Search in Google Scholar PubMed PubMed Central
[14] Khan FM, Shah AH, Wang S, Mehmood S, Wang J, Liu W, et al. A comprehensive review on epoxy biocomposites based on natural fibers and bio-fillers: Challenges, recent developments and applications. Adv Fiber Mater. 2022;4:683–704.10.1007/s42765-022-00143-wSearch in Google Scholar
[15] Wang C, Lu C, Wang L, Zuo Q, Das A, Salleh KM, et al. Modeling and simulation of epoxy/natural fiber composites. Handbook of epoxy/fiber composites. Singapore: Springer; 2022. p. 807–36.10.1007/978-981-19-3603-6_30Search in Google Scholar
[16] Gere JM, Goodno BJ. Mechanics of materials. 9th edn. Stamford: Cengage Learning; 2017.Search in Google Scholar
[17] Chowdary MS, Raghavendra G, Ojha S, Kumar MSRN. Morphology and mechanical properties of epoxy/natural fiber composites. Handbook of epoxy/fiber composites. Singapore: Springer; 2022. p. 745–66.10.1007/978-981-19-3603-6_27Search in Google Scholar
[18] Christiansson H, Helsing J. Poisson’s ratio of fiber-reinforced composites. J Appl Phys. 1996;79:7582–5.Search in Google Scholar
[19] Hall W, Javanbakht Z. Mechanics of composite structures. Adv Struct Mater. 2021;158:13–32.10.1007/978-3-030-78807-0_2Search in Google Scholar
[20] Zhong J, Zhao C, Liu Y, Ren J, Yang C, Zhang Z. Meta-materials of re-entrant negative Poisson’s ratio structures made from fiber-reinforced plastics: A short review. Fibers Polym. 2024;25:395–406.10.1007/s12221-023-00455-7Search in Google Scholar
[21] Liu XY, Xu DP, Li SJ, Duan SQ, Xu HS, Jiang Q, et al. Estimating the mechanical properties of rocks and rock masses based on mineral micromechanics testing. Rock Mech Rock Eng. 2024;57:5267–78.10.1007/s00603-024-03796-8Search in Google Scholar
[22] Hou X, Silberschmidt VV. Metamaterials with negative Poisson’s ratio: A review of mechanical properties and deformation mechanisms. Mechanics of advanced materials. Cham: Springer; 2015. p. 155–79.10.1007/978-3-319-17118-0_7Search in Google Scholar
[23] Kowalkowski KJ, Grace NF, Hodges SE. Test methods for measuring material properties of composite materials in all three material axes. Defense Technical Information Center, Mississippi State; 2012.Search in Google Scholar
[24] Kiely E, Zwane R, Fox R, Reilly AM, Guerin S. Density functional theory predictions of the mechanical properties of crystalline materials. CrystEngComm. 2021;23:5697–710.10.1039/D1CE00453KSearch in Google Scholar
[25] Budhoo Y. Temperature effect on Poisson’s ratio of woven composites. Conference Proceedings of the Society for Experimental Mechanics Series. Vol. 3. New York, NY: Springer; 2011. p. 163–9.10.1007/978-1-4614-0213-8_25Search in Google Scholar
[26] Akay E, Yilmaz C, Kocaman ES, Turkmen HS, Yildiz M. Monitoring Poisson’s ratio degradation of FRP composites under fatigue loading using biaxially embedded FBG sensors. Materials. 2016;9:781.10.3390/ma9090781Search in Google Scholar PubMed PubMed Central
[27] Loidueanchai S, Seithtanabutara V, Artnaseaw A. Sustainable ballistic solutions for recycling silkworm cocoon waste into high-performance bulletproof materials. Green Chem Lett Rev. 2024;17:2385929.10.1080/17518253.2024.2385929Search in Google Scholar
[28] Jarupong J, Sasrimuang S, Artnaseaw A. Characteristics of bulletproof plate made from silkworm cocoon waste: Hybrid silkworm cocoon waste-reinforced epoxy/UHMWPE composite. Sci Eng Compos Mater. 2024;31:20240006.10.1515/secm-2024-0006Search in Google Scholar
[29] Chen F, Hesselberg T, Porter D, Vollrath F. The impact behaviour of silk cocoons. J Exp Biol. 2013;216:2648–57.10.1242/jeb.082545Search in Google Scholar PubMed
[30] Jarupong J, Artnaseaw A, Sasrimuang S. Cocoon waste reinforced in epoxy matrix composite: Investigation on tensile properties and surface morphology. Eng Appl Sci Res. 2023;50:597–604.Search in Google Scholar
[31] Mohammed M, Rasidi MSM, Mohammed AM, Rahman R, Osman AF, Adam T, et al. Interfacial bonding mechanisms of natural fibre-matrix composites: An overview. Bioresources. 2022;17:7031–90.10.15376/biores.17.4.MohammedSearch in Google Scholar
[32] Parbin S, Kirtania S, Kashyap S. Analytical and finite element analysis of natural fiber reinforced composites for application in food packaging industry. J Inst Eng (India): Ser D. 2023;106:1–10.10.1007/s40033-023-00601-8Search in Google Scholar
[33] Christiansson H, Helsing J. Poisson’s ratio of fiber‐reinforced composites. J Appl Phys. 1996;79:7582–5.10.1063/1.362414Search in Google Scholar
[34] Alhijazi M, Zeeshan Q, Qin Z, Safaei B, Asmael M. Finite element analysis of natural fibers composites: A review. Nanotechnol Rev. 2020;9:853–75.10.1515/ntrev-2020-0069Search in Google Scholar
[35] Adeniyi AG, Adeoye AS, Ighalo JO, Onifade DV. FEA of effective elastic properties of banana fiber-reinforced polystyrene composite. Mech Adv Mater Struct. 2021;28:1869–77.10.1080/15376494.2020.1712628Search in Google Scholar
[36] ASTM D638-14. Standard test method for tensile properties of plastics. West Conshohocken, PA, United States: ASTM International; 2014.Search in Google Scholar
[37] Kumbhare N, Moheimani R, Dalir H. Analysis of composite structures in curing process for shape deformations and shear stress: Basis for advanced optimization. J Compos Sci. 2021;5:63.10.3390/jcs5020063Search in Google Scholar
[38] ASTM D3039. Standard test method for tensile properties of polymer matrix composite materials. West Conshohocken, PA, United States: ASTM international; 2017.Search in Google Scholar
[39] Banerjee DK, Iadicola MA, Creuziger A. Understanding deformation behavior in uniaxial tensile tests of steel specimens at varying strain rates. J Res Natl Inst Stand Technol. 2021;126:126050.10.6028/jres.126.050Search in Google Scholar PubMed PubMed Central
[40] Rund M, Rzepa S, Melzer D, Konopík P, Urbánek M. Improved methodology for validation of the FEA model using testing components. METAL 2021 - 30th Anniversary International Conference on Metallurgy and Materials. Brno: TANGER Ltd.; 2021. p. 447–52.10.37904/metal.2021.4150Search in Google Scholar
[41] Khan SH, Rahman MZ, Haque MR, Hoque ME. Characterization and comparative evaluation of structural, chemical, thermal, mechanical, and morphological properties of plant fibers. Annual plant: Sources of fibres, nanocellulose and cellulosic derivatives. Singapore: Springer; 2023. p. 1–45.10.1007/978-981-99-2473-8_1Search in Google Scholar
[42] Berni R, Cai G, Hausman JF, Guerriero G. Plant fibers and phenolics: A review on their synthesis, analysis and combined use for biomaterials with new properties. Fibers. 2019;7:80.10.3390/fib7090080Search in Google Scholar
[43] Célino A, Fréour S, Jacquemin F, Casari P. The hygroscopic behavior of plant fibers: A review. Front Chem. 2014;1:71637.10.3389/fchem.2013.00043Search in Google Scholar PubMed PubMed Central
© 2025 the author(s), published by De Gruyter
This work is licensed under the Creative Commons Attribution 4.0 International License.
Articles in the same Issue
- Research Articles
- Modification of polymers to synthesize thermo-salt-resistant stabilizers of drilling fluids
- Study of the electronic stopping power of proton in different materials according to the Bohr and Bethe theories
- AI-driven UAV system for autonomous vehicle tracking and license plate recognition
- Enhancement of the output power of a small horizontal axis wind turbine based on the optimization approach
- Design of a vertically stacked double Luneburg lens-based beam-scanning antenna at 60 GHz
- Synergistic effect of nano-silica, steel slag, and waste glass on the microstructure, electrical resistivity, and strength of ultra-high-performance concrete
- Expert evaluation of attachments (caps) for orthopaedic equipment dedicated to pedestrian road users
- Performance and rheological characteristics of hot mix asphalt modified with melamine nanopowder polymer
- Second-order design of GNSS networks with different constraints using particle swarm optimization and genetic algorithms
- Impact of including a slab effect into a 2D RC frame on the seismic fragility assessment: A comparative study
- Analytical and numerical analysis of heat transfer from radial extended surface
- Comprehensive investigation of corrosion resistance of magnesium–titanium, aluminum, and aluminum–vanadium alloys in dilute electrolytes under zero-applied potential conditions
- Performance analysis of a novel design of an engine piston for a single cylinder
- Modeling performance of different sustainable self-compacting concrete pavement types utilizing various sample geometries
- The behavior of minors and road safety – case study of Poland
- The role of universities in efforts to increase the added value of recycled bucket tooth products through product design methods
- Adopting activated carbons on the PET depolymerization for purifying r-TPA
- Urban transportation challenges: Analysis and the mitigation strategies for road accidents, noise pollution and environmental impacts
- Enhancing the wear resistance and coefficient of friction of composite marine journal bearings utilizing nano-WC particles
- Sustainable bio-nanocomposite from lignocellulose nanofibers and HDPE for knee biomechanics: A tribological and mechanical properties study
- Effects of staggered transverse zigzag baffles and Al2O3–Cu hybrid nanofluid flow in a channel on thermofluid flow characteristics
- Mathematical modelling of Darcy–Forchheimer MHD Williamson nanofluid flow above a stretching/shrinking surface with slip conditions
- Energy efficiency and length modification of stilling basins with variable Baffle and chute block designs: A case study of the Fewa hydroelectric project
- Renewable-integrated power conversion architecture for urban heavy rail systems using bidirectional VSC and MPPT-controlled PV arrays as an auxiliary power source
- Exploitation of landfill gas vs refuse-derived fuel with landfill gas for electrical power generation in Basrah City/South of Iraq
- Two-phase numerical simulations of motile microorganisms in a 3D non-Newtonian nanofluid flow induced by chemical processes
- Sustainable cocoon waste epoxy composite solutions: Novel approach based on the deformation model using finite element analysis to determine Poisson’s ratio
- Impact and abrasion behavior of roller compacted concrete reinforced with different types of fibers
- Architectural design and its impact on daylighting in Gayo highland traditional mosques
- Structural and functional enhancement of Ni–Ti–Cu shape memory alloys via combined powder metallurgy techniques
- Design of an operational matrix method based on Haar wavelets and evolutionary algorithm for time-fractional advection–diffusion equations
- Design and optimization of a modified straight-tapered Vivaldi antenna using ANN for GPR system
- Analysis of operations of the antiresonance vibration mill of a circular trajectory of chamber vibrations
- Functions of changes in the mechanical properties of reinforcing steel under corrosive conditions
- Enhanced PAPR reduction in NOMA systems using modified SLM and PTS techniques for power-efficient 5G and beyond networks
- Hybrid mechanics-informed machine learning models for predicting mechanical failure in graphene sponge: a low-data strategy for mechanical engineering applications
- Design of shafts of a two-piece chain conveyor as a part of a modification of a mobile working machine
- Review Articles
- A modified adhesion evaluation method between asphalt and aggregate based on a pull off test and image processing
- Architectural practice process and artificial intelligence – an evolving practice
- 10.1515/eng-2025-0148
- Special Issue: 51st KKBN - Part II
- The influence of storing mineral wool on its thermal conductivity in an open space
- Use of nondestructive test methods to determine the thickness and compressive strength of unilaterally accessible concrete components of building
- Use of modeling, BIM technology, and virtual reality in nondestructive testing and inventory, using the example of the Trzonolinowiec
- Tunable terahertz metasurface based on a modified Jerusalem cross for thin dielectric film evaluation
- Integration of SEM and acoustic emission methods in non-destructive evaluation of fiber–cement boards exposed to high temperatures
- Non-destructive method of characterizing nitrided layers in the 42CrMo4 steel using the amplitude-frequency technique of eddy currents
- Evaluation of braze welded joints using the ultrasonic method
- Analysis of the potential use of the passive magnetic method for detecting defects in welded joints made of X2CrNiMo17-12-2 steel
- Analysis of the possibility of applying a residual magnetic field for lack of fusion detection in welded joints of S235JR steel
- Eddy current methodology in the non-direct measurement of martensite during plastic deformation of SS316L
- Methodology for diagnosing hydraulic oil in production machines with the additional use of microfiltration
- Special Issue: IETAS 2024 - Part II
- Enhancing communication with elderly and stroke patients based on sign-gesture translation via audio-visual avatars
- Optimizing wireless charging for electric vehicles via a novel coil design and artificial intelligence techniques
- Evaluation of moisture damage for warm mix asphalt (WMA) containing reclaimed asphalt pavement (RAP)
- Comparative CFD case study on forced convection: Analysis of constant vs variable air properties in channel flow
- Evaluating sustainable indicators for urban street network: Al-Najaf network as a case study
- Node failure in self-organized sensor networks
- Comprehensive assessment of side friction impacts on urban traffic flow: A case study of Hilla City, Iraq
- Design a system to transfer alternating electric current using six channels of laser as an embedding and transmitting source
- Security and surveillance application in 3D modeling of a smart city: Kirkuk city as a case study
- Modified biochar derived from sewage sludge for purification of lead-contaminated water
- The future of space colonisation: Architectural considerations
- Design of a Tri-band Reconfigurable Antenna Using Metamaterials for IoT Applications
- Special Issue: AESMT-7 - Part II
- Experimental study on behavior of hybrid columns by using SIFCON under eccentric load
- Special Issue: ICESTA-2024 and ICCEEAS-2024
- A selective recovery of zinc and manganese from the spent primary battery black mass as zinc hydroxide and manganese carbonate
- Special Issue: REMO 2025 and BUDIN 2025
- Predictive modeling coupled with wireless sensor networks for sustainable marine ecosystem management using real-time remote monitoring of water quality
- Management strategies for refurbishment projects: A case study of an industrial heritage building
- Structural evaluation of historical masonry walls utilizing non-destructive techniques – Comprehensive analysis