Modeling performance of different sustainable self-compacting concrete pavement types utilizing various sample geometries
-
Tahseen D. Saadoon
 ,
Hadel Obaidi
,
Hadel Obaidi

Abstract
Concrete is most used material in the building and transportation projects. The crucial and essential characteristic of the concrete is its compressive performance. The current plan is to investigate and predict how geometries of specimen affected the mechanical performance of environmentally friendly self-compacting normal-strength concrete (NSC) and high-strength concrete (HSC) containing recycled concrete as partial replacement of virgin (not recycled) aggregate, and using of pozzolanic material (fly ash) as replacement of cement. More than 100 samples of standard and HSC compositions, both cylindrical and cubic/prismatic, were cast and tested. The experimental results indicate that the replacement of virgin aggregate lead to the reduced mechanical performance of the concrete. The replacement of fine aggerate has less negative effect on strength than coarse aggregate. Although a reduction in strength was observed, the 60% replacement level still achieved strength values that are acceptable according to the standards of the pavement sector. The measured compressive strength of NSC and HSC is influenced by specimen size, slenderness ratio (H/D: height/diameter or smaller dimension), and shape. When cylinders and prisms are compared at the same H/D values, the compressive strength values for prism specimens are higher. For the same specimen shape, the effect of slenderness ratio increases with specimen size. The type of concrete (NSC or HSC) does not clearly affect the differences in strength between the types of tested specimens. The model prediction of the mechanical performance of various shapes and sizes of NSC and HSC based on small sample sizes obtained a confidence factor greater than 0.9, supporting the use in other works or research.
1 Introduction
Concrete is a fundamental material in construction, playing a key role in shaping modern infrastructure [1]. However, its extensive use raises important environmental concerns [2]. Implementing sustainable practices, such as recycling concrete and utilizing alternative materials, is essential for environmental stewardship and promoting sustainable development, particularly in light of climate change [3].
In industrialized nations, the demolition of outdated structures produces millions of tons of debris [4]. Addressing this challenge is vital for advancing circular economies and recycling materials like concrete, which helps reduce landfill use and conserve natural resources [5].
A promising solution to these issues is the introduction of self-compacting concrete (SCC), which has emerged as a high-performance option in contemporary construction [6,7]. SCC offers several advantages, including enhanced quality and durability, faster construction times, greater architectural flexibility, long-term cost savings, improved safety, and environmental benefits due to its ability to flow under its own weight without mechanical vibration during placement [8,9,10]. The reduced need for mechanical compaction not only accelerates the construction process but also minimizes noise pollution and lowers labor costs, further enhancing its appeal in sustainable construction [11].
Another vital consideration in concrete use is its compressive strength, which is critical for determining the maximum load capacity a concrete structure can withstand without deformation [12]. Compressive strength tests ensure the structural integrity of buildings, bridges, and other load-bearing constructions. Most structural concrete components used in pavements typically have compressive strengths ranging from 20 to 35 MPa [13]. However, technological advancements have led to a trend toward using high-strength concrete (HSC), which offers even greater compressive strength, typically exceeding 40 MPa. HSC is increasingly utilized in the transportation sector, particularly for highways designed to accommodate heavy traffic [12]. This results in the construction of more durable roadways that can support higher load demands and resist wear over time.
In addition to its applications in transportation, HSC is also being used in high-rise buildings, industrial facilities, and other critical infrastructure projects where enhanced load-bearing capacity is necessary. Its development signifies a major advancement in concrete technology, contributing to both structural efficiency and the long-term sustainability of infrastructure by extending the lifespan of concrete structures and reducing the frequency of repairs and replacements.
1.1 Research significance and novelty
In general, with sustainable SCC, the mechanical performance of this type of concrete is investigated using partially recycled concrete aggregate (RCA), which replaces up to 60% of the fine aggregate and fly ash. The key innovation lies in the systematic evaluation of the effects of specimen geometry (size, shape, slenderness ratio) on compressive strength, while developing predictive models to extrapolate performance over a wide range of small-scale tests (e.g., 75 mm cubes). These models reduce the need for high-capacity testing equipment, large sample sizes (which save aggregate or cement), and extensive cutting of concrete or reinforcement in field tests, thus reducing material waste, testing costs, and environmental impact (CO2).
Objectives: (1) Maximize the RCA and fly ash participation of SCC for normal-strength concrete (NSC) and HSC concrete. (2) Measure the effects of geometry (size, shape, and H/D ratio) on strength performance. (3) Validated models can be used for small samples to predict large-scale behavior.
Limitations: (a) Lab-scale validation; field studies under traffic and weather conditions are recommended. (b) Focus on compressive strength; durability (e.g., cooling and chloride resistance) requires future research.
2 Experimental program
2.1 Materials
The materials used in this study are Portland cement (CEM I 52.5R), local river quartz sand with a maximum particle size of 4.75 mm, natural crushed quartz gravel with a nominal maximum size of 10 mm, fly ash (FA) type 450-S produced by Cemex Company, which was prepared such that less than 12% was retained on a 45 µm sieve, viscosity modifying agents (VMAs), SP: Polycarboxylate-based superplasticizer Type F (known as MIGHTY 21) with 1.08 specific gravity, and potable tap water, as illustrated in Figure 1. The product conforms with the requirements for technical specifications [14,15,16,17,18,19].

Materials used in the work: (a) aggregate, (b) ordinary portland cement, (c) FA, (d) SP, and (e) VMAs.
The recycling process for concrete aggregates, illustrated in Figure 2, exemplifies a closed-loop system that supports the circular economy model.
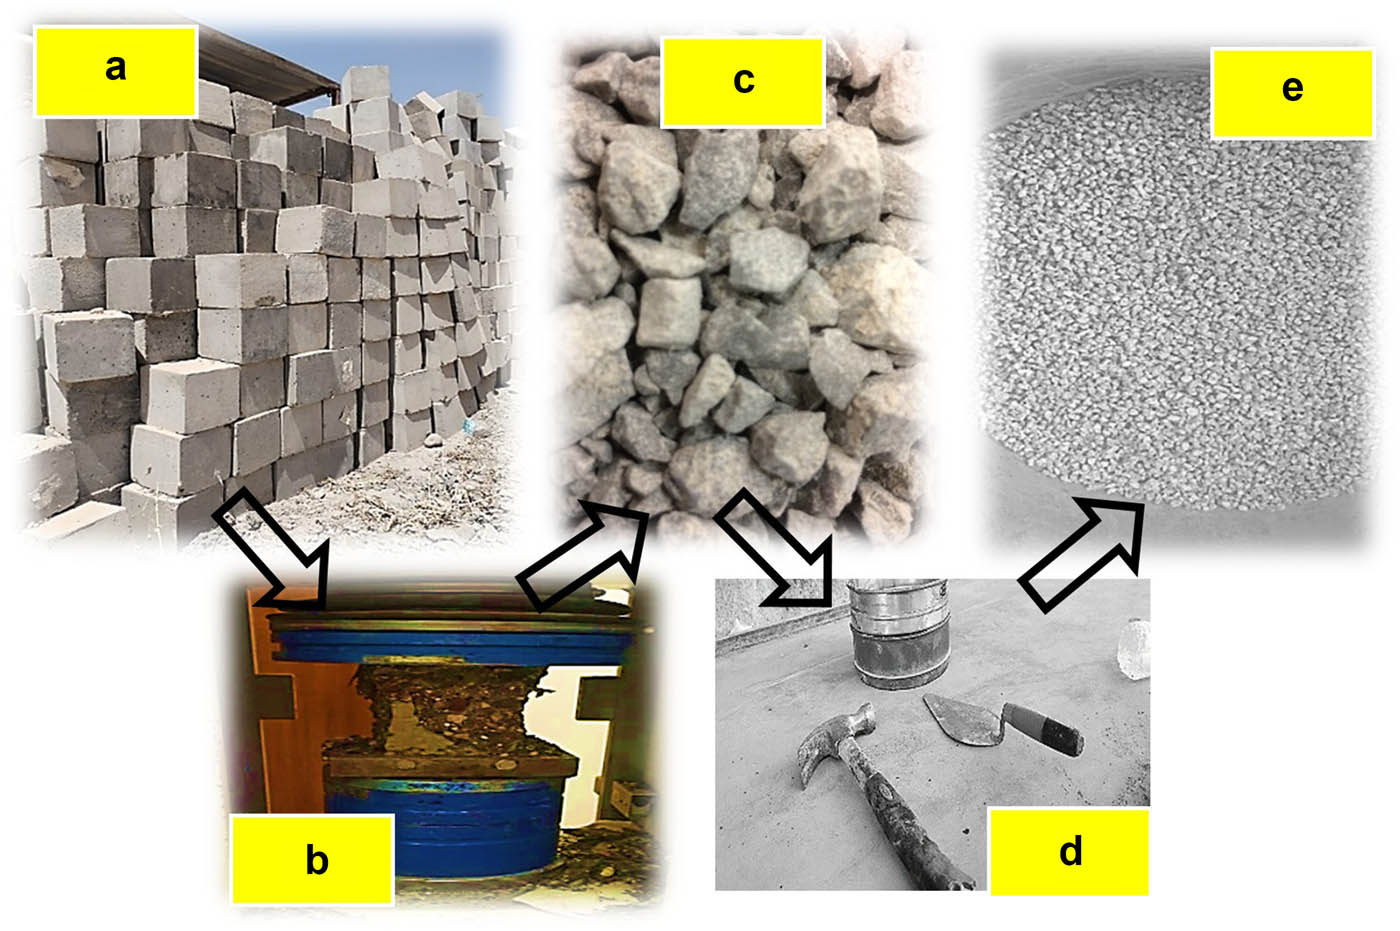
Preparing of recycling aggregate: (a) waste concrete masses; (b) crushing by compressive machine; (c) samples after stage B; (d) tools used in crushing to small sizes and sieving; and (e) RCA.
Recycling waste concrete (with a typical compressive strength of 40 ± 5 MPa) as aggregates in new concrete is achieved through a systematic approach that addresses the challenges of disposing demolition debris and promotes sustainable construction practices. This process transforms old concrete into a valuable resource for new projects.
The recycling of concrete begins with the collection and segregation of debris from construction and demolition sites. This material often includes a mix of concrete, steel, wood, and other components, making it essential to separate non-concrete elements during the initial sorting. Once the concrete is isolated, it is subjected to mechanical crushing, where larger chunks are broken down into smaller, manageable pieces. Specialized equipment, such as heavy steel hammers, is employed to facilitate size reduction for easier handling and processing.
After crushing, the concrete undergoes further screening to ensure that the resulting aggregates meet the specific size and quality standards necessary for use in new concrete mixtures. The screened aggregates are then sorted into various sizes, from coarse to fine particles. Additional steps, such as washing the aggregates, are required to remove impurities like dirt, dust, and remnants of old mortar or asphalt that could impact the performance of the recycled concrete.
2.2 Contribution of RCA in the mechanical performance of concrete
Before starting the mix design process, it is essential to investigate the effects of recycled aggregate obtained from waste concrete masses. The new and recycled aggregate gradation is exhibited in Figure 3.

Gradation of aggregate.
The investigation was conducted based on the compressive strength data of a 150 mm cube at 28 days for normal strength non-SCC with a 150 ± 3 mm slump. The investigation’s primary objective was to determine whether replacing coarse or fine aggregate had more of an effect. Three groups were formed: the first group consisted of zero-RCA, the second group substituted 100 RCAc for the coarse aggregate, and the final group substituted 100 RCAf for the fine aggregate.
As shown in Figure 4, the results indicate that incorporating RCA, whether coarse or fine, leads to a reduction in the compressive strength of concrete compared to traditional mixes. The decrease is more pronounced when coarse aggregates are replaced with coarse RCA (RCAc) than when fine aggregates are replaced with fine RCA (RCAf). This difference is likely due to the more significant structural role that coarse aggregates play in load-bearing applications.
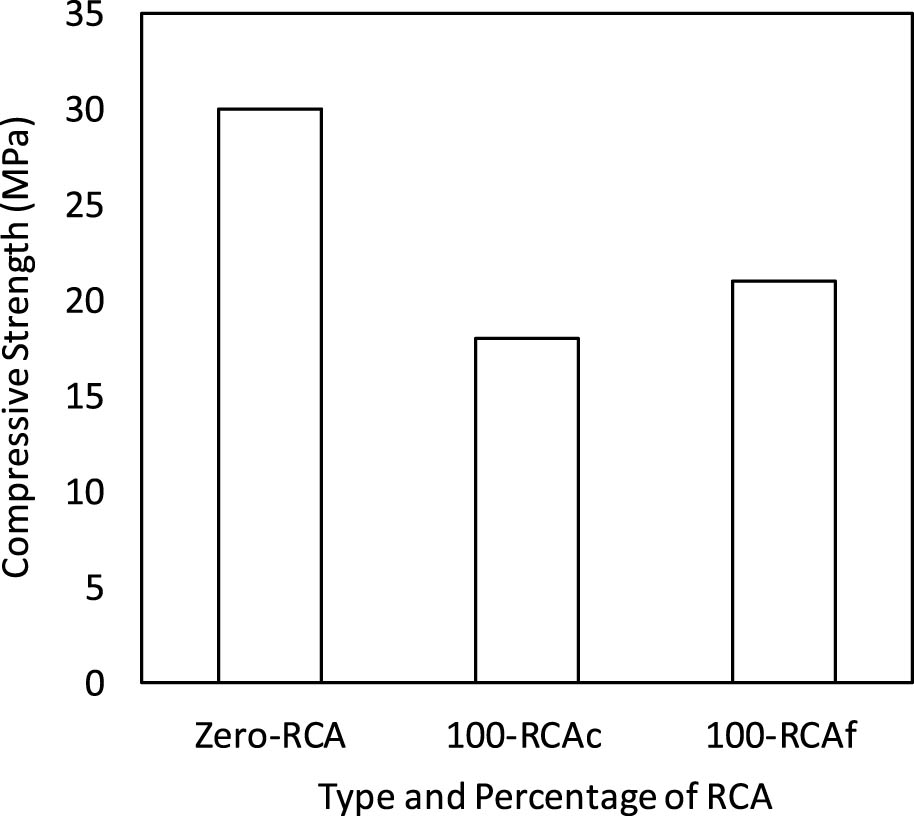
Effect of type of RCA on mechanical performance of concrete.
Consequently, if RCA is used, fine RCA (RCAf) appears to be a better option for preserving mechanical strength compared to coarse RCA (RCAc), although neither option achieves the performance levels of concrete made with natural aggregates.
The results for determining the optimum amount of RCA to replace fine aggregate are shown in Figure 5. There are five distinct percentages used: 0, 20, 40, 60, and 100% by volume. The optimum percentage was selected based on the 150 mm cube compressive strength values at 28 days for non-self-compacting NSC with a 150 ± 3 mm sag. Figure 5a indicates that the strength and percentage of RCA are negatively correlated. Even while the control mixtures (zero RCA) showed a significant reduction in strength, as shown in Figure 5b, at 60%, the strength was still within an acceptable range for the transportation industry, particularly in the pavement sector. As a result, 60% was determined to be the ideal percentage to utilize as a replacement percentage in the following stage of the mix design process.

(a) Relationship between compressive strength (MPa) and percentage of recycled concrete aggregate (RCA); (b) relationship between percentage reduction in compressive strength and percentage of RCA.
2.3 Mixture design of concrete
The work plan covers an evaluation of the performance of sustainable SCC with respect to the two primary strength types used for transportation applications. The two mixtures were designed to have 50–60 MPa of HSC and 25–35 MPa of NSC. The current work’s target workability and strength are compatible with most pavement sector criteria [19].
To combine the ingredients for the SCC, a pan mixer was needed. For optimal homogeneity, the dry mix ingredients – aggregate, cement, and filler – were added to the mixer pan and mixed for a total of 2 min. Before to use, a trowel was used to mix cement and mineral admixtures for 5 min in order to make certain that the filler grains were evenly distributed amongst the cement particles.
While the mixer was running, the dry mix in the pan was filled with all of the quantity of water, followed by adding the SP gradually. Mixing continued for a couple of minutes. Before adding another minute mixing, the mix was examined during the pause. Modified mix techniques are crucial for SCC in order to capitalize on the mix’s adsorption of poly-carboxylic ether (SP) molecules [20].
Concrete’s self-compaction can be assessed based on a number of different characteristics. The flowability was evaluated using measurements of the slump flow diameter and the time it required to reach a 50 cm, or t50, slump diameter. To confirm high passing ability and segregation resistance, j-ring and sieve segregation tests were performed. The EFNARC European guide for SCC [20] covers all the information on these tests in full. The tests that were carried out to evaluate the fresh qualities are displayed in Figure 6. The outcomes of the further work are listed in Table 1.

Different fresh properties of the SCC: (a) slump flow diameter; (b) t50 (time to reach 50 cm diameter); (c) J-Ring; and (d) sieve segregation index.
Fresh properties of the concrete mix
| Workability test | EFNARC limit [20] | Test results |
|---|---|---|
| Slump flow diameter (mm) | 650–800 | 750 |
| T 50 slump flow (S) | 2–5 | 4.1 |
| J-ring (mm) | H 1–H 2 = 0–10 | 7 |
| Sieve segregation index (%) | Less than 15 | 11 |
For mechanical performance evaluation, the compressive strength test, 100 mm cubes were used. The test was conducted according to BS.1881, Part 116 [21]. The listed values represent an average of three readings.
Eight trial mixes were created for the purpose to obtain the necessary concrete strength and fresh characteristics. Table 2 displays the mixture designs that were most successful in achieving the necessary features. The NSC uses viscosity-modifying chemicals to help maintain homogeneity and prevent segregation. Fly ash replacement in HSC was approximately 33% of the total cement quantity, in accordance with earlier studies that found the ideal proportion of FA for the highest strength and durability.
Proportions of the concrete mix
| Quantity (kg/m3) | |||||
|---|---|---|---|---|---|
| NSC | HSC | ||||
| RCA | |||||
| Material | Without | With | Without | With | |
| Cement | 380 | 380 | 450 | 450 | |
| Fine aggregate | Fresh | 750 | 300 | 710 | 284 |
| recycled | 0.00 | 450 | 0.00 | 426 | |
| Coarse aggregate | 1,120 | 1,120 | 960 | 960 | |
| Water | 175 | 175 | 152 | 152 | |
| FA | 0.00 | 0.00 | 87.0 | 87.0 | |
| SP | 0.00 | 0.00 | 6.70 | 6.70 | |
| VMAs | 0.86 | 0.86 | 0.00 | 0.00 | |
2.4 Preparing and curing the concrete specimens
To prevent any possible adverse effects from utilizing plastic or cardboard molds, the cylindrical and prism/cubical samples were cast in steel molds.
Despite the mold’s shape, all specimens were cast in one layer without any compaction for the hardened characteristics. Before the samples were demolded and cured in water (20 ± 2°C) until the test day, the molds were covered with a nylon sheet for 48 h. Figure 7 shows several samples at different stages of the curing process, while Figure 8 shows the equipment used to cut the samples into proper sizes.

Some of the samples during curing.

Machinery used for: (a) cutting and (b) coring of the samples to the appropriate dimensions.
3 Tests program
3.1 Microstructure of tested samples
A small section of the hardened SCC slices (Figure 9) was ground into a powder and passed through a 75 µm sieve in order to be examined by X-Ray Diffraction (XRD) analysis. Using Bruker AXS D8 Advance equipment, an XRD scanning speed of 2°/min and a step of 0.05° were used in the range of 10–90°.
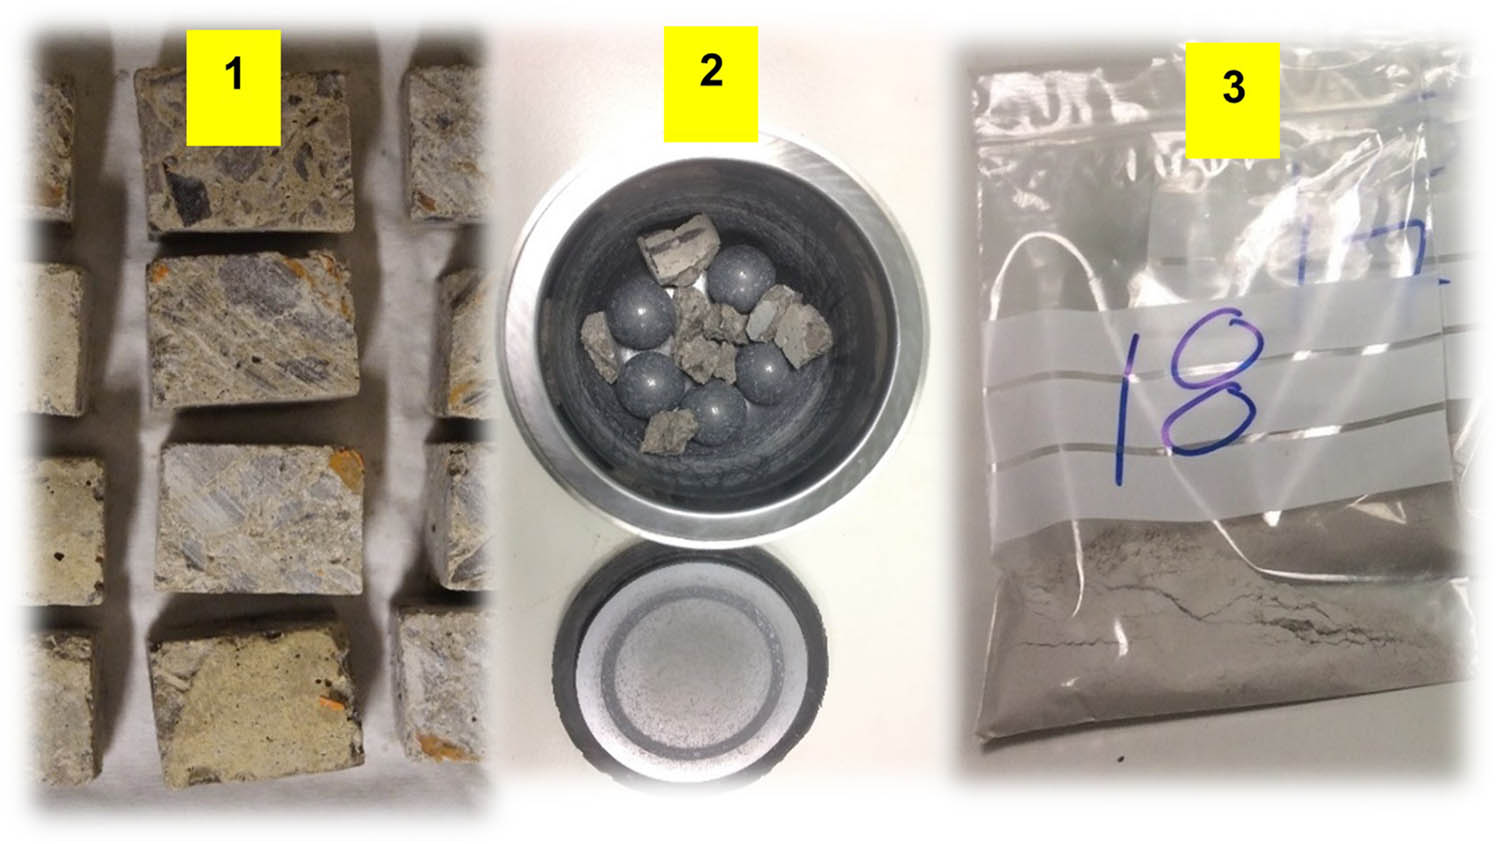
Preparation of XRD examination's sample: (1) Cutting of sample (cube) to slices, (2) crushing, and (3) milling.
The morphology of cement concrete was studied through scanning electron microscopy (SEM) in addition to XRD analysis. Before testing, samples smaller than 7 mm were taken from the center of the crushed specimens and weighed. To stop the hydration process, it was necessary to replace the pore solution (water) and reduce the relative humidity. To achieve this, the specimens were submerged in 1,000 mL beakers filled with an organic solvent, following the solvent exchange method [22,23].
3.2 Mechanical strength test
Tests for compressive strength are the most frequently utilized and easiest to do. Concrete’s compressive strength is an important feature since it is frequently produced to withstand compressive loads.
Using a standard testing equipment with a 2,000 kN capacity, the test process has been carried out in accordance with BS 1881: part 116 [21] for prismatic/cubic specimen) and ASTM C39 [24] for cylindrical specimen. At the ages of 7, 28, 60, 90, and 180 days, this test is performed. The following equation offers the compressive strength:
where f cs is the compressive strength (MPa); P is the maximum load sited up to failure (N), and A is the initial cross section area of specimens (mm2).
4 Evaluation of performance
4.1 Microstructure inspection
The analysis of the mineralogical phases of FA is illustrated in Figure 10. The XRD pattern reveals several crystalline phases in the FA sample, including calcite, dolomite, quartz, ettringite, portlandite, and calcium silicate. These phases indicate the presence of carbonates, silicates, and hydration products. The findings are consistent with previous studies, such as those by Sear [25] and Tironi et al. [26], which identified quartz, calcite, and hydration phases like ettringite and portlandite as common components of fly ash. The presence of calcium silicate suggests enhanced pozzolanic activity in cementitious systems.

Results of XRD analysis examination's FA sample.
The high crystallinity and predominant quartz content of FA are the reasons why XRD intensity peaks exceed 500 count. Li et al. [27] found comparable high-intensity patterns in fly ash with low amorphous phase content. This confirms the material’s suitability as a pozzolanic supplement.
Figure 11 presents SEM images of typical FA particles at high magnification. The SEM images show spherical FA particles, characteristic of their formation from coal combustion, along with a rough surface texture that becomes apparent at higher magnifications. This morphology aligns with the observations of Ahmaruzzaman [28,29] and Li and Zhao [30], who noted the spherical shape of FA, which improves flow properties in cement. The rough texture may indicate reactivity or weathering, correlating with the hydration products identified in the XRD results.

SEM images of typical particles of used FA at high magnification used through the research work.
Together, the XRD and SEM findings indicate that the FA sample contains typical phases such as quartz, calcite, and portlandite, along with evidence of hydration products like ettringite. The spherical morphology and surface texture observed in the SEM images support the pozzolanic potential of fly ash, in line with existing literature. These results confirm the suitability of fly ash as a supplementary cementitious material for concrete applications.
4.2 Mechanical performance
The findings of the experimental program had been for understanding how shapes and sizes affect the mechanical performance of normal and HSC used for pavement and building applications.
Figures 12–15 display compressive strength data for NSC and HSC over time, focusing on cylindrical and prism/cube specimens. The results indicate that compressive strength increases rapidly until approximately 28 days, after which the growth slows but continues up to 180 days. This trend aligns with findings from SCRB [19] and Neville [31], who linked the continued strength development to ongoing cement hydration.

Compressive strength for different NSC sizes correlated with the age of the cylindrical shape.

Compressive strength for different HSC sizes correlated with the age of the cylindrical shape.

Compressive strength for different NSC sizes correlated with the age of the prism/cube shape.

Compressive strength for different HSC sizes correlated with the age of the prism/cube shape.
HSC exhibits significantly higher initial strength compared to NSC and continues to develop strength gradually beyond 28 days. This behavior is consistent with the work of Mindess et al. [32], who emphasized the impact of dense microstructures and supplementary cementitious materials on the prolonged strength gain of HSC. Likewise, NSC prisms and cubes follow a similar pattern to cylindrical specimens, showing rapid strength increases until 28 days, followed by slower gains.
The gradual strength increase after 28 days aligns with the observations of Ding and Kusterle [33], who noted that HSC continues to gain strength over time due to supplementary materials. HSC prisms and cubes reflect this trend, demonstrating significant strength growth in the first 28 days, followed by a more gradual rise.
Overall, both NSC and HSC display rapid early strength development, with slower increases beyond 28 days. The shape of the specimens (cylinder vs prism/cube) also influences strength, with cubes generally exhibiting higher values due to better confinement. These findings are consistent with existing research and offer valuable insights for optimizing concrete mix designs and predicting long-term performance based on specimen size and shape.
4.2.1 Specimen’s size and its effect on compressive strength
The compressive strength of NSC in cylindrical specimens (Figure 12) increases with age, with smaller specimens (e.g., 75D × 150H mm) demonstrating higher values than larger ones (e.g., 125D × 375H mm), particularly during the first 28 days before stabilizing. Similarly, HSC (Figure 13) shows the same pattern, with smaller cylinders exhibiting higher compressive strengths, especially after 7 days, likely due to better stress confinement in smaller samples.
In prism and cube-shaped specimens, both NSC (Figure 14) and HSC (Figure 15) also display higher compressive strengths in smaller prisms compared to larger ones, with HSC trends stabilizing after 28 days. These findings are consistent with existing research on the size effect in concrete testing, which indicates that smaller specimens typically exhibit higher strengths due to factors such as stress distribution and the presence of flaws in larger samples.
Overall, the results support previous studies demonstrating that smaller specimens tend to have higher compressive strengths than larger ones, attributed to the “size effect” and variations in stress distribution during loading.
Bazant’s size effect law [34] states that larger concrete specimens are more likely to fail due to a higher probability of flaws or micro-cracks within the greater volume. This theory accounts for the observation that smaller specimens, such as the 75D × 150H mm cylinders, exhibit higher strength values compared to larger specimens like the 125D × 375H mm cylinders.
Fracture mechanisms: In larger concrete specimens, failure is typically more brittle and governed by fracture mechanics. In contrast, smaller specimens may exhibit more ductile failure mechanisms, leading to higher apparent compressive strengths. This effect is especially pronounced in HSC, where smaller specimens can better trap stresses, enhancing their apparent strength.
Mindess et al. [32] demonstrated that smaller specimens result in greater stress concentrations, which contributes to the increased apparent strength seen in smaller prisms and cylinders.
According to Figures 12–15, the most significant strength differences in the cylinder samples were observed at dimensions of 125D × 375H and 125D × 125H, corresponding to strengths of 5 MPa for NSC and 6 MPa for HSC. In the prism samples, the largest strength differences were 4 and 7 MPa between dimensions of 125L × 125W × 375H and 125L × 125W × 125H, respectively.
The higher strength observed in smaller samples (e.g., 75 mm cubes vs 125 mm cubes) is in agreement with Bazant’s law of size effect [34] and recent findings by Nguyen et al. [35], who attributed this to the decrease in defect density in smaller volumes.
4.2.2 Effect of the specimen’s shape on its compressive strength
Figures 12–15 compare the compressive strength of NSC and HSC in both cylindrical and prism/cube shapes. The results indicate that the shape of the specimens has a significant impact on compressive strength, with variations depending on the type of concrete and its size.
NSC:
Cylindrical Specimens (Figure 12): Smaller cylinders exhibit higher compressive strength, which stabilizes after 28 days.
Prism/cube specimens (Figure 14): A similar trend is observed, although prism and cube specimens typically demonstrate slightly higher strengths, particularly in the smaller sizes.
Specimen shape influences compressive strength through factors such as stress distribution, confinement effects, and failure mechanisms. Cylindrical specimens tend to have a more uniform stress distribution, resulting in a gradual failure process. In contrast, prism and cube specimens localize stresses at their corners, which can enhance their apparent strength. Additionally, smaller cylindrical specimens experience hoop stresses that can decrease the failure load.
Neville [31]: Cylindrical specimens demonstrate 80–90% of the compressive strength of cube specimens, primarily due to variations in stress distribution.
Mindess et al. [32]: The shape of specimens affects their failure mode, with cubes showing higher strengths attributed to more abrupt failure.
Conforming to the studies by Neville [31] and Rawat et al. [36], which emphasized corner confinement in prismatic specimens, prisms demonstrated 10–15% higher strength than cylinders at identical H/D ratios.
4.2.3 Role of the ratio of slenderness on the concrete’s compressive strength
Depending on Figures 12–15, along with the influence of sample sizes and shapes on the mechanical performance of concrete, another significant parameter is the slenderness ratio (=H/D ratio).
The study clearly shows that the compressive strength decreases with increasing slenderness. For instance, the strength of the 75D × 225H sample is nearly 10 lower than the 75D × 75H sample for NSC at 28 days of age. Furthermore, the strength of the 75D × 225H sample is 11% lower than the 75D × 75H sample for the same HSC size. This resulted in the less significant impact of concrete type (i.e., strength level) on the overall effect of the slenderness ratio.
The influence of the slenderness ratio increases with sample size for specimens of the same shape. A typical instance of this is that, at NSC, for the same cross section area, the sample 125L × 125W × 375H has a 15% lower strength than the sample 125L × 125W × 125H, whereas the sample 75L × 75W × 225H has a 10% lower strength than the sample 75L × 75W × 75H. Significant strength loss, as measured by the slenderness ratio, was observed in the 125L × 125W × 375H and 75L × 75W × 75H samples.
The sample’s shape and the slenderness ratio are unrelated. In comparison to 75D × 75H and 75L × 75W × 75H samples, respectively, the strength reduction at HSC for the 75D × 225H and 75L × 75W × 225H samples is 10 and 11%, respectively.
Regardless of the type of concrete, sample size, or shape, the observed reductions in strength due to different slenderness ratios ranged from a maximum of 18% to a minimum of 3%.
The decrease in strength with increasing H/D (e.g., 15% for 125 × 375 mm vs 15% for 125 × 125 mm) agrees with the trends reported by del Viso et al. [12] and was also confirmed for SCC mixtures by Sobuz et al. [37].
5 Models of prediction
The primary utility of the models is their ability to predict the performance (strength) of NSC and HSC based on small sample sizes (75D × 75H) or (75L × 75W × 75H), for which casting will be simple, quick, cost-effective, and require little to no effort. Thus, the following models are designed to reduce effort, cost, and time.
Figures 16–19 show the connections between the compressive strength of a smaller NSC or HSC sample at various ages and the compressive strength of other different NSC or HSC samples at various ages.

Compressive strength of NSC at different ages of the 75D × 75H sample in relation to other samples with the same geometry.

Compressive strength of NSC at different ages of the 75L × 75W × 75H sample in relation to other samples with the same geometry.

Compressive strength of HSC at different ages of the 75D × 75H sample in relation to other samples with the same geometry.

Compressive strength of HSC at different ages of the 75L × 75W × 75H sample in relation to other samples with the same geometry.
According to Figures 16–19, the best mathematical function is exponential Equation (2) with trust factor (R 2) ≥ 0.98.
where C is the compressive strength (MPa) at the required ages and sizes, C s is the compressive strength (MPa) at the required ages for 75D × 75H or 75L × 75W × 75H (cube or cylinder, NSC or HSC), and α and β are constants.
Since the parameters (α and β) vary consistently depending on the sample’s size and type (surface area), Equation (2) will be simplified to produce a more effective model. The relationship between the values (α and β) and sample surface area is shown in Figures 20–23. Table 3 and the function for trust factor (R 2) ≥ 0.90 exhibit the best connection between the parameters in Figures 20–23.

NSC 75D × 75H’s surface area and constants: α (left) and β (right).

HSC 75D × 75H’s surface area and constants: α (left) and β (right).

NSC 75L × 75W × 75H’s surface area and constants: α (left) and β (right).

HSC 75L × 75W × 75H’s surface area and constants: α (left) and β (right).
Equations sourced from Figures 20–23
| Equations | Trust factor (R²) | Source of equation | Equation no. |
|---|---|---|---|
| α = 942 × (S a)−0.468 | 0.95 | Figure 20 | (3) |
| β = 0.0063 × (S a)0.1861 | 0.90 | Figure 20 | (4) |
| α = 109 × (S a)−0.157 | 0.91 | Figure 21 | (5) |
| β = 0.0051 × (S a)0.1054 | 0.93 | Figure 21 | (6) |
| α = 16.33 × e−3×10⁻⁷ × (S a) | 0.94 | Figure 22 | (7) |
| β = 2 × 10⁻⁵ × (S a)0.5317 | 0.93 | Figure 22 | (8) |
| α = 21.75 × e−7×10⁻⁸ × (S a) | 0.91 | Figure 23 | (9) |
| β = 0.0061 × (S a)0.0731 | 0.91 | Figure 23 | (10) |
S a: surface area of sample (Cylinder: 75D × 100H or Prism/cube: 75L × 75W × 100H) (cm2).
Equations (3)–(10) are substituted in Equation (2), and the corresponding equations are obtained.
Compressive strengths of the needed NSC and HSC cylinders, respectively, are expressed as C snc and C shc, in MPa. Compressive strength (MPa) of the needed NSC cube is represented by C snp, and the necessary HSC cube is represented by C shc.
In order to confirm the quality of work (validation) of the models Equations (11)–(14), additional samples were cast and tested, but they were excluded from the model’s construction. NSC and HSC samples of two different types (75D × 100H and 75L × 75W × 100H) have been cast and examined at ages 7 and 28 days. Validation findings are shown in Figure 24. The trust factor that was obtained supports the use of models in other works and varies from 0.9 to 0.95.

Compressive strength (MPa): Tested and predicted by Equations (2)–(5).
6 Conclusion
The following conclusions about investigation and prediction of how geometries of specimen affected the mechanical performance of environmentally friendly self-compacting NSC and HSC may be drawn from the study’s experimental findings.
The average compressive strength increases significantly when SP and mineral admixtures are added.
The replacement of virgin aggregate lead to reduced mechanical performance of the concrete.
The replacement of fine aggerate has less negative effect on strength than coarse aggregate. Although there is a reduction in strength, a 60% replacement level still provides strength values that are acceptable according to the standards used in the pavement sector.
The mechanical resistance of a sample is significantly influenced by its size. Based on 75 mm cubes, the compressive strength is somewhat higher than that of 100 and 125 mm cubes. Comparing the cylindrical 75 mm samples with different cylinder sizes revealed the same result.
It is evident that compressive strength typically decreases as the height-to-diameter (H/D) ratio increases. However, this reduction is more significant for 100 mm base prisms than for 100 mm base cylinders.
Compressive strength based on 125 mm and 100 mm diameter cylinders is lower for slenderness ratio (height/diameter) = 1 than for 75 mm diameter cylinders for the same values. For cubic samples with a slenderness ratio (height/diameter) of 1, the same conclusion was arrived at.
The specimen’s shape significantly affects its compressive strength. Prism specimens have higher compressive strength ratings than cylindrical specimens when compared at the same H/D values. The type of concrete (NSC or HSC) does not appear to have much effect on the differences in strength among the many sample types tested.
With a trust factor in excess of 0.9, the model’s prediction for the performance (strength) of different NSC and HSC types and sizes based on small sample sizes (75D × 75H) or (75L × 75W × 75H) has been confirmed for application in additional investigations or works.
Acknowledgments
The authors are grateful for the support they received from the University of Nottingham, UK team at the Concrete Laboratory.
-
Funding information: Authors state no funding involved.
-
Author contributions: All authors have accepted responsibility for the entire content of this manuscript and consented to its submission to the journal, reviewed all the results and approved the final version of the manuscript. Tahseen D. Saadoon: conception or design, methodology, data collection, experimental lab, data analysis and interpretation, and writing – original draft; Hadel Obaidi: conception or design, methodology, writing – review and editing, supervision, and resources; Anmar Dulaimi: methodology, writing – review and editing, supervision, resources, and visualization; Bahman Ghiassi: review and editing, supervision, and resources.
-
Conflict of interest: Authors state no conflict of interest.
-
Data availability statement: Most datasets generated and analyzed in this study are comprised in this submitted manuscript. The other datasets are available on reasonable request from the corresponding author with the attached information.
References
[1] Mehta PK, Monteiro PJM. Concrete: microstructure, properties, and materials. New York: McGraw-Hill; 2014.Search in Google Scholar
[2] Zhang MH, Li Y, Wu H, Chen X, Zhao L, Wang S, et al. Environmental impact of concrete production. J Clean Prod. 2017;141:120–31.Search in Google Scholar
[3] Pomponi F, Moncaster A. Circular economy for the built environment: A research agenda. Waste Manag. 2017;68:488–97.Search in Google Scholar
[4] McDonald A, Zhao Y, Liu H, Carter K, Smith P, Khan R, et al. The recycling of concrete and demolition waste. Constr Build Mater. 2015;101:76–84.Search in Google Scholar
[5] Gomez-Soberon J. Recycling of concrete in the framework of a circular economy. Cem Concr Res. 2002;32(3):343–9.Search in Google Scholar
[6] Okamura H, Ouchi M. Self-compacting concrete. J Adv Concr Technol. 2003;1(1):5–15.10.3151/jact.1.5Search in Google Scholar
[7] Al-Tamimi AK, Haider G. Performance evaluation of self-compacting concrete incorporating recycled aggregate and nano-silica. J Clean Prod. 2023;410:137204.Search in Google Scholar
[8] Ramkumar K, Kannan R, Noor Ahmmad S, Jegan M. A review on performance of self-compacting concrete – Use of mineral admixtures and steel fibres with artificial neural network application. Constr Build Mater. 2020;261:120570.10.1016/j.conbuildmat.2020.120215Search in Google Scholar
[9] Ioannis P. Self-compacting concrete: History & current trends. Concrete. 2017;51:32–7.Search in Google Scholar
[10] Sonebi M, Abdalqader A. Recent development and future trends in self-compacting concrete. Proc 50th Anniv ICT Symp. London, UK: 2022.Search in Google Scholar
[11] Smith J, Johnson L. Sustainable construction practices: The advantages of self-compacting concrete. J Green Build. 2022;17(3):45–60.Search in Google Scholar
[12] del Viso J, Carmona JM, Ruiz G. Size and shape effects on the compressive strength of high strength concrete. Ciudad Real, Spain: E.T.S. de Ingenieros de Caminos, Canales y Puertos, Universidad de Castilla-La Mancha; 2005.Search in Google Scholar
[13] Aïtcin P, Miao B, Cook W. Effects of size and curing on cylinder compressive strength of normal and high-strength concrete. ACI Mater J. 1994;91(4):349–54.10.14359/4044Search in Google Scholar
[14] British Standards Institution. Specification for Portland Cement. BS 12; 1996.Search in Google Scholar
[15] Central Organization for Standardization and Quality Control (COSQC). Iraqi Specification No. 45: Aggregates of Natural Resources; 1984.Search in Google Scholar
[16] ASTM International. ASTM C1240-20: Standard Specification for Silica Fume Used in Cementitious Mixtures. West Conshohocken (PA): ASTM; 2006.Search in Google Scholar
[17] Li X, Wang Y, Zhang Q, Chen H. Crystallinity and pozzolanic activity of fly ash: Correlating XRD intensity with reactivity in cementitious systems. Cem Concr Res. 2023;165:107045.Search in Google Scholar
[18] ASTM International. ASTM C494-06: standard specification for chemical admixtures for concrete. West Conshohocken (PA): ASTM; 2006.Search in Google Scholar
[19] Ministry of Housing and Construction, State Road and Bridge Commission. General Specification for Roads and Bridges. 2nd ed.; 2003.Search in Google Scholar
[20] EFNARC. The European Guidelines for Self-Compacting Concrete. 2005 [cited 2025 Apr 25]. Available from: http://www.efnarc.org/pdf/SCCGuidelinesMay2005.pdf.Search in Google Scholar
[21] British Standards Institution. Method for determination of compressive strength of concrete cubes. BS 1881-116; 1989.Search in Google Scholar
[22] Kocaba V. Development and evaluation of methods to follow microstructural development of cementitious systems including slags [doctoral dissertation]. Lausanne: École Polytechnique Fédérale de Lausanne; 2009.Search in Google Scholar
[23] Zhang J, Scherer GW. Comparison of methods for arresting hydration of cement. Cem Concr Res. 2011;41:1027–36.10.1016/j.cemconres.2011.06.003Search in Google Scholar
[24] ASTM International. ASTM C39-21: Standard test method for compressive strength of cylindrical concrete specimens. West Conshohocken (PA): ASTM; 2021.Search in Google Scholar
[25] Sear AD. Self-compacting concrete: A practical guide. London: Thomas Telford Publishing; 2001.Search in Google Scholar
[26] Tironi A, De Matteis G, Ferrara L. Self-compacting concrete: The effects of mix design on mechanical properties. Constr Build Mater. 2012;36:336–42.Search in Google Scholar
[27] Li X, Wang Y, Zhang Q, Chen H. Crystallinity and pozzolanic activity of fly ash: Correlating XRD intensity with reactivity in cementitious systems. Cem Concr Res. 2023;165:107045.Search in Google Scholar
[28] Ahmaruzzaman M. Bio-based materials for sustainable construction: An overview. Mater Des. 2010;31(5):2396–401.Search in Google Scholar
[29] Ali MM, Khan MI. Recent advancements in eco-efficient cementitious composites: A review of sustainable design strategies. J Build Eng. 2023;74:106811.Search in Google Scholar
[30] Li Z, Zhao X. Effects of micro-silica on the properties of self-compacting concrete. Constr Build Mater. 2012;28(1):203–10.Search in Google Scholar
[31] Neville AM. Properties of concrete. 4th edn. Harlow, UK: Longman; 1995.Search in Google Scholar
[32] Mindess S, Young JF, Darwin D. Concrete. 2nd edn. Upper Saddle River (NJ): Prentice Hall; 2003.Search in Google Scholar
[33] Ding Y, Kusterle W. Self-compacting concrete: Development and application. J Adv Concr Technol. 2000;2(3):313–18.Search in Google Scholar
[34] Bazant ZP. Scaling of structural strength. Mater Struct. 2001;34(3):169–80.Search in Google Scholar
[35] Nguyen DL, Thai DK, Tran NT, Ngo TT, Le HV. Confined compressive behaviors of high-performance fiber-reinforced concrete and conventional concrete with size effect. Constr Build Mater. 2022;336:127382.10.1016/j.conbuildmat.2022.127382Search in Google Scholar
[36] Rawat S, Zhang YX, Lee CK. Effect of specimen size and shape on the compressive performance of high strength engineered cementitious composites at elevated temperatures. Innovation Infrastruct Solut. 2024;9:317.10.1007/s41062-024-01628-wSearch in Google Scholar
[37] Sobuz MHR, Alam A, Oehlers DJ, Visintin P, Sheikh AH, Mohamed Ali MS, et al. Experimental and analytical studies of size effects on compressive ductility response of ultra-high-performance fiber-reinforced concrete. Constr Build Mater. 2023;409:133864.10.1016/j.conbuildmat.2023.133864Search in Google Scholar
© 2025 the author(s), published by De Gruyter
This work is licensed under the Creative Commons Attribution 4.0 International License.
Articles in the same Issue
- Research Articles
- Modification of polymers to synthesize thermo-salt-resistant stabilizers of drilling fluids
- Study of the electronic stopping power of proton in different materials according to the Bohr and Bethe theories
- AI-driven UAV system for autonomous vehicle tracking and license plate recognition
- Enhancement of the output power of a small horizontal axis wind turbine based on the optimization approach
- Design of a vertically stacked double Luneburg lens-based beam-scanning antenna at 60 GHz
- Synergistic effect of nano-silica, steel slag, and waste glass on the microstructure, electrical resistivity, and strength of ultra-high-performance concrete
- Expert evaluation of attachments (caps) for orthopaedic equipment dedicated to pedestrian road users
- Performance and rheological characteristics of hot mix asphalt modified with melamine nanopowder polymer
- Second-order design of GNSS networks with different constraints using particle swarm optimization and genetic algorithms
- Impact of including a slab effect into a 2D RC frame on the seismic fragility assessment: A comparative study
- Analytical and numerical analysis of heat transfer from radial extended surface
- Comprehensive investigation of corrosion resistance of magnesium–titanium, aluminum, and aluminum–vanadium alloys in dilute electrolytes under zero-applied potential conditions
- Performance analysis of a novel design of an engine piston for a single cylinder
- Modeling performance of different sustainable self-compacting concrete pavement types utilizing various sample geometries
- The behavior of minors and road safety – case study of Poland
- The role of universities in efforts to increase the added value of recycled bucket tooth products through product design methods
- Adopting activated carbons on the PET depolymerization for purifying r-TPA
- Urban transportation challenges: Analysis and the mitigation strategies for road accidents, noise pollution and environmental impacts
- Enhancing the wear resistance and coefficient of friction of composite marine journal bearings utilizing nano-WC particles
- Sustainable bio-nanocomposite from lignocellulose nanofibers and HDPE for knee biomechanics: A tribological and mechanical properties study
- Effects of staggered transverse zigzag baffles and Al2O3–Cu hybrid nanofluid flow in a channel on thermofluid flow characteristics
- Mathematical modelling of Darcy–Forchheimer MHD Williamson nanofluid flow above a stretching/shrinking surface with slip conditions
- Energy efficiency and length modification of stilling basins with variable Baffle and chute block designs: A case study of the Fewa hydroelectric project
- Renewable-integrated power conversion architecture for urban heavy rail systems using bidirectional VSC and MPPT-controlled PV arrays as an auxiliary power source
- Exploitation of landfill gas vs refuse-derived fuel with landfill gas for electrical power generation in Basrah City/South of Iraq
- Two-phase numerical simulations of motile microorganisms in a 3D non-Newtonian nanofluid flow induced by chemical processes
- Sustainable cocoon waste epoxy composite solutions: Novel approach based on the deformation model using finite element analysis to determine Poisson’s ratio
- Impact and abrasion behavior of roller compacted concrete reinforced with different types of fibers
- Architectural design and its impact on daylighting in Gayo highland traditional mosques
- Structural and functional enhancement of Ni–Ti–Cu shape memory alloys via combined powder metallurgy techniques
- Design of an operational matrix method based on Haar wavelets and evolutionary algorithm for time-fractional advection–diffusion equations
- Design and optimization of a modified straight-tapered Vivaldi antenna using ANN for GPR system
- Analysis of operations of the antiresonance vibration mill of a circular trajectory of chamber vibrations
- Functions of changes in the mechanical properties of reinforcing steel under corrosive conditions
- Enhanced PAPR reduction in NOMA systems using modified SLM and PTS techniques for power-efficient 5G and beyond networks
- Hybrid mechanics-informed machine learning models for predicting mechanical failure in graphene sponge: a low-data strategy for mechanical engineering applications
- Design of shafts of a two-piece chain conveyor as a part of a modification of a mobile working machine
- Review Articles
- A modified adhesion evaluation method between asphalt and aggregate based on a pull off test and image processing
- Architectural practice process and artificial intelligence – an evolving practice
- 10.1515/eng-2025-0148
- Special Issue: 51st KKBN - Part II
- The influence of storing mineral wool on its thermal conductivity in an open space
- Use of nondestructive test methods to determine the thickness and compressive strength of unilaterally accessible concrete components of building
- Use of modeling, BIM technology, and virtual reality in nondestructive testing and inventory, using the example of the Trzonolinowiec
- Tunable terahertz metasurface based on a modified Jerusalem cross for thin dielectric film evaluation
- Integration of SEM and acoustic emission methods in non-destructive evaluation of fiber–cement boards exposed to high temperatures
- Non-destructive method of characterizing nitrided layers in the 42CrMo4 steel using the amplitude-frequency technique of eddy currents
- Evaluation of braze welded joints using the ultrasonic method
- Analysis of the potential use of the passive magnetic method for detecting defects in welded joints made of X2CrNiMo17-12-2 steel
- Analysis of the possibility of applying a residual magnetic field for lack of fusion detection in welded joints of S235JR steel
- Eddy current methodology in the non-direct measurement of martensite during plastic deformation of SS316L
- Methodology for diagnosing hydraulic oil in production machines with the additional use of microfiltration
- Special Issue: IETAS 2024 - Part II
- Enhancing communication with elderly and stroke patients based on sign-gesture translation via audio-visual avatars
- Optimizing wireless charging for electric vehicles via a novel coil design and artificial intelligence techniques
- Evaluation of moisture damage for warm mix asphalt (WMA) containing reclaimed asphalt pavement (RAP)
- Comparative CFD case study on forced convection: Analysis of constant vs variable air properties in channel flow
- Evaluating sustainable indicators for urban street network: Al-Najaf network as a case study
- Node failure in self-organized sensor networks
- Comprehensive assessment of side friction impacts on urban traffic flow: A case study of Hilla City, Iraq
- Design a system to transfer alternating electric current using six channels of laser as an embedding and transmitting source
- Security and surveillance application in 3D modeling of a smart city: Kirkuk city as a case study
- Modified biochar derived from sewage sludge for purification of lead-contaminated water
- The future of space colonisation: Architectural considerations
- Design of a Tri-band Reconfigurable Antenna Using Metamaterials for IoT Applications
- Special Issue: AESMT-7 - Part II
- Experimental study on behavior of hybrid columns by using SIFCON under eccentric load
- Special Issue: ICESTA-2024 and ICCEEAS-2024
- A selective recovery of zinc and manganese from the spent primary battery black mass as zinc hydroxide and manganese carbonate
- Special Issue: REMO 2025 and BUDIN 2025
- Predictive modeling coupled with wireless sensor networks for sustainable marine ecosystem management using real-time remote monitoring of water quality
- Management strategies for refurbishment projects: A case study of an industrial heritage building
- Structural evaluation of historical masonry walls utilizing non-destructive techniques – Comprehensive analysis