Comprehensive assessment of side friction impacts on urban traffic flow: A case study of Hilla City, Iraq
-
Ali Hussein Hashim Al-yasee
 and
Hamid A. Al-Jameel
and
Hamid A. Al-Jameel

Abstract
This study provides a comprehensive evaluation of the impact of side friction (SF) elements on urban traffic flow in Hilla City, Iraq, with a particular focus on how both static and dynamic SF elements such as parked vehicles, pedestrian activities, and irregular vehicular entry–exit maneuvers affect traffic performance and road capacity. The research aims to address the gap in the literature regarding the combined effects of these elements, particularly in rapidly urbanizing cities with diverse traffic conditions. Using data collected from strategically positioned video cameras on four key urban roads, the study analyzes traffic behavior during peak and off-peak hours over multiple days. The Roadside Friction Index and Friction units were employed to quantify the intensity of SF impacts, and regression models were developed to predict changes in traffic behavior under varying SF scenarios. Findings indicate that high levels of SF can lead to significant reductions in vehicle speeds by up to 49% during peak hours, emphasizing the need for targeted interventions. Practical recommendations include stricter parking regulations, the enhancement of pedestrian infrastructure, and the integration of SF data into Intelligent Transport Systems for real-time traffic management. This research provides valuable insights for urban planners and policymakers in developing effective traffic management strategies that mitigate the adverse effects of SF and enhance road safety and efficiency in rapidly developing urban environments.
1 Introduction
Traffic congestion in urban areas, especially in developing countries, presents a significant challenge for urban planners and traffic management authorities. The phenomenon of side friction (SF), which encompasses a variety of activities and elements occurring near or within the roadway, is a critical factor influencing traffic flow and road capacity [1]. In addition, various parameters of SF have been identified as significant contributors to traffic congestion. These parameters include
On-street parking: On-street parking impacts road capacity through multiple mechanisms. First, it reduces the effective width of the roadway, limiting the space available for moving vehicles. Second, frequent parking and unparking maneuvers create complex traffic scenarios that exacerbate congestion, as vehicles must navigate around stationary and maneuvering cars [2].
Temporary stopping: Vehicles that stop temporarily on the carriageway can obstruct traffic flow. These stops not only create physical blockages but also effectively reduce the available road width, leading to a reduction in overall speed and increased potential for traffic delays [2].
Entry–exit maneuvers: Vehicles entering or exiting the street typically do so at lower speeds, which can disrupt the smooth flow of traffic. These maneuvers force other drivers to decelerate or change lanes, leading to potential slowdowns and congestion [2].
Pedestrian activities: The presence of pedestrians walking along or crossing the carriageway can also impact traffic flow. Drivers often slow down or veer away to maintain a safe distance from pedestrians, which can cause reductions in speed and potential bottlenecks. This includes providing continuous, connected, safe, and well-maintained pathways and facilities that accommodate walking and other forms of non-motorized transport, as highlighted [2].
These SF parameters must be carefully considered in urban traffic management and planning to minimize their impact on traffic flow and enhance overall road safety and efficiency, as emphasized [3].
Bang [1] studied identifying roadside friction elements usually noticed along urban roads in Asian countries. These elements were parking and access to roadside premises, pedestrians, and vehicles stopping on shoulders. Chiguma [2] analyzed the effect of SF elements on the performance of the traffic flow characteristics, particularly the road capacity and speed. The study was conducted in several urban areas; microscopic and macroscopic analysis was performed in his study, considering all the factors of side impedance. Also, the individual effect of each impedance element on the traffic factors was studied microscopically. Purohit et al. [3] examined the impact of non-motorized vehicles (NMVs) on mixed traffic flow in Rourkela, India. They found that increasing NMV presence significantly reduces vehicle speed and traffic density, negatively affecting flow efficiency. NMVs tend to occupy the left side of the road, forcing motorized vehicles to overtake on the right, leading to traffic conflicts. This research offers important insights into traffic behavior in mixed conditions and proposes strategies to mitigate these challenges.
To address this gap, this study adopts a holistic approach to analyze the impact of SF on traffic flow in Hilla City. The primary hypothesis of this research posits that higher levels of SF, encompassing both static (e.g., parked vehicles) and dynamic (e.g., pedestrian crossings) elements, will result in significant reductions in vehicle speed and road capacity, especially during peak traffic hours. This hypothesis is grounded in preliminary observations and supported by existing literature, suggesting a strong correlation between SF intensity and traffic performance degradation.
The study utilizes advanced data collection methods, including elevated video cameras strategically positioned along four key urban roads to capture detailed traffic data. The selected roads 60th Street, 40th Street, Al-Atbaaba Street, and Al-Mahkamh Street exhibit significant variations in SF activities due to their diverse commercial, educational, and residential uses, making them ideal for this investigation. Data were collected on Sundays, Mondays, and Wednesdays during both morning and evening periods to capture peak and off-peak traffic behaviors, providing a comprehensive view of how SF elements influence traffic under varying conditions.
This research employs an analytical framework that incorporates the Roadside Friction Index (RSFI) and Friction (FRIC) unit, which quantify the severity of SF impacts on traffic flow. Regression models were developed to predict changes in traffic behavior under varying levels of SF, offering valuable insights for traffic management and urban planning. The study’s primary objectives are to (1) quantify the impact of static and dynamic SF elements on traffic speed and road capacity, (2) develop predictive models to assess the influence of SF under different urban contexts, and (3) propose practical solutions for mitigating the adverse effects of SF on traffic performance.
By achieving these objectives, the study aims to contribute to the broader discourse on urban traffic management, offering a comprehensive framework for addressing SF-related challenges in developing cities. The findings are expected to provide actionable insights for local policymakers and urban planners, enabling them to develop more effective traffic management strategies that account for the unique characteristics of SF in Hilla City. Furthermore, the study serves as a valuable reference for other cities facing similar challenges, emphasizing the importance of considering both static and dynamic SF elements in the design and regulation of urban transport systems.
Ultimately, this research seeks to bridge the existing research gap by integrating empirical data with robust analytical models, thereby contributing to the development of sustainable urban mobility solutions that enhance traffic flow and safety in rapidly growing urban environments. This comprehensive approach is crucial for supporting the sustainable growth and development of cities like Hilla, ensuring that they can accommodate the diverse needs of their populations while maintaining efficient and safe transportation systems.
2 SF phenomena
In developing countries, the impact of SF is even more pronounced due to the lack of strict traffic regulations and infrastructure challenges. The increase in vehicular and pedestrian activity, combined with limited road space, results in frequent interactions that hinder smooth traffic flow and reduce road capacity. Studies, such as those [4], have highlighted the significant impact of roadside activities on travel speed and the Level of Service (LOS) of roads, especially in countries with less regulated traffic systems. The Indonesian Highway Capacity Manual (IHCM) has classified SF levels based on the frequency of SF events per hour, indicating that higher SF levels correlate with greater reductions in average stream speed. For instance, at very high levels of SF, the average speed can be reduced by up to 51%. These data underscore the critical need for addressing SF elements in urban planning and traffic management strategies to improve the efficiency and safety of road networks [3].
Current methodologies for assessing the impact of SF on traffic include the use of RSFI and FRIC units, which quantify the combined effect of various SF elements on traffic flow. These indices help in developing models that can predict changes in traffic behavior due to varying levels of SF, allowing for better planning and mitigation measures.
Moreover, studies have shown that SF not only affects traffic flow but also has broader implications for urban mobility, environmental pollution, and public health. The interactions between vehicles and SF elements often lead to increased emissions due to stop-and-go driving patterns, which can contribute to air pollution in densely populated urban areas.
Overall, understanding and managing SF is crucial for developing sustainable urban transportation systems. It requires a multidisciplinary approach that considers traffic engineering, urban planning, and environmental factors to create comprehensive strategies that can accommodate the diverse needs of urban populations.
3 SF impact
Purohit et al. [3] identified SF as a key criterion contributing to a decline in road capacity. They noted that SF primarily affects undivided streets more significantly than divided ones, as the latter tend to have more regulated traffic conditions. Biswas et al. [4] also supported this notion, highlighting the lack of incorporation of SF characteristics in the Highway Capacity Manual HCM (2016), which provides detailed rules for capacity calculations and LOS based on vehicle speed and other variables. However, the HCM adjustments for estimating capacity and LOS do not account for SF elements.
Rao et al. [5] conducted a study in India, examining the effect of SF on street capacity. Their findings indicated a significant reduction in speed for segments with bus stops (49–57%) and on-street parking (45–67%). Similarly, Chiguma [2] explored the impact of SF factors on traffic performance, including speed and capacity, and introduced a new term, “Friction Index” (FRIC), to account for the combined influence of all SF variables. Biswas et al. [4] further investigated the effects of SF on the capacity of undivided streets in metropolitan regions, finding a capacity reduction of approximately 60.73% due to SF, which included on-street parking, pedestrian activities, and NMVs.
Munawar [6] compared the values provided in the IHCM (2023) with observed data in Indonesian fields, noting significant changes in capacity trends at high SF levels. Aderamo and Atomode [7] utilized the VISSIM simulation program to assess the impact of SF on traffic performance, finding that SF caused delays on road segments. Bak and Kiec [8] also built a simulation model to assess the impact of street parking on traffic flow effectiveness, indicating a 35% reduction in capacity.
Yusuf [9] developed a new mathematical model to analyze the relationship between parking intensity and free flow speed (FFS). However, the study failed to explain the initial speed increase observed up to 29 parked vehicles. Furthermore, Kadali et al. [10] and Kuttam et al. [11] studied the effect of pedestrian crossing volumes on urban road capacity. Kadali et al. [10] observed a 30–37% reduction in capacity due to high pedestrian crossing volumes, while Kutaam et al. [11] reported a reduction of about 32%.
Pu et al. [12] developed a delay model that indicated an increase in delay by 33 s per kilometer with the introduction of about 1,000 bicycles into the traffic flow. It is important to note that SF parameters often occur in combinations on urban streets, leading to a cumulative effect on traffic flow rather than individual impacts. While many studies have considered multiple SF factors in developing speed models, none have comprehensively examined the combined effects on the capacity of urban streets, both undivided and divided.
Witt [13] investigates the effect of roadside friction on traffic flow and the LOS on urban arterial roads in Pokhara. The study highlights how pedestrian movements and parked vehicles contribute to reduced road capacity and increased congestion. Through empirical data gathered from field surveys, the research demonstrates a direct correlation between elevated SF and decreased levels of service. These insights are valuable for enhancing traffic management and urban planning strategies aimed at minimizing the impact of roadside friction and improving road efficiency and safety.
Jereb et al. [14] conducted a detailed simulation study to determine the required number of electric vehicles charging stations along German motorways to manage peak traffic efficiently. The research emphasizes the need for extensive planning to handle peak demands, ensuring minimal waiting times and preventing congestion.
Bhattarai and Bastola [15] conducted a comprehensive study to evaluate the impact of traffic flow management on fuel consumption and CO2 emissions at a major urban intersection in Celje, Slovenia. The research meticulously quantified emissions under different traffic conditions by considering variables such as vehicle type, traffic light intervals, and velocity. Their findings indicate that most CO2 emissions occur during idle and acceleration phases in front of traffic lights, with significantly less fuel consumed during steady driving. This study highlights the importance of effective traffic management strategies in reducing environmental impacts and improving urban air quality. It adds to the body of literature by providing a methodological framework for assessing the environmental implications of traffic flow interventions, which aligns with the objectives of other research efforts aiming to mitigate CO2 emissions and enhance sustainability in urban transport systems.
Meegoda and Wen [16] provide a detailed analysis of the effects of roadside friction on traffic flow parameters and the LOS in urban arterials within Pokhara Metropolitan City. The research identifies various SF elements, such as pedestrian crossings, parked vehicles, and slow-moving traffic, and quantifies their impact on the operational efficiency of urban roads.
Leong et al. [17] observed that the presence of motorcycles significantly affects the saturation flow rates at signalized intersections in Malaysia. The research highlighted the unique travel behaviors of motorcyclists, such as weaving between lanes and forming groups in front of stop lines, which can alter traffic dynamics.
4 Methodology
The methodology of this study was meticulously designed to assess the impact of SF elements on traffic flow dynamics in selected urban roads of Al-Hilla City. This research adopted a comprehensive data collection approach, combining empirical observations with advanced analytical techniques to quantify the influence of static and dynamic SF elements on traffic performance.
Study area and data collection: The study focused on four strategically selected urban roads in Al-Hilla City, each characterized by distinct traffic conditions and varying levels of SF activities. The selected roads include 60th Street, 40th Street, Al-Atbaaba Street, and Al-Mahkamh Street. These roads were chosen due to their high traffic volume and diverse SF elements such as parked vehicles, pedestrian crossings, and vehicular entry–exit maneuvers. Data collection was conducted using elevated video cameras installed at predetermined locations along these roads. The cameras recorded detailed information on traffic volume, vehicle speed, and SF events on specific days (Sunday, Monday, and Wednesday) during both morning and evening periods, ensuring a comprehensive capture of traffic conditions across peak and off-peak hours.
Classification of SF elements: SF elements were classified into two categories: static and dynamic. Static elements included parked vehicles along the roadside, while dynamic elements encompassed activities such as pedestrians crossing the road and vehicles entering or exiting the traffic flow. Each SF event was meticulously recorded, and its frequency and nature were analyzed to assess its impact on traffic flow parameters, including speed and density.
Analytical framework: An analytical framework was developed to quantify the impact of SF on traffic dynamics. This framework included the calculation of the RSFI and the FRIC unit. The RSFI was determined by considering the number of SF elements and their respective weights, which reflect their severity in affecting traffic conditions. The FRIC unit, on the other hand, was derived from various independent variables such as pedestrian activity, parked vehicles, and other non-motorized elements.
Model development: To understand the relationship between SF and traffic flow, regression models were developed. These models incorporated a comprehensive dataset that included variables like traffic volume, speed, and the frequency of SF incidents. The regression analysis aimed to predict changes in traffic dynamics due to SF elements. This predictive modeling approach was essential for identifying key factors that significantly impact traffic performance.
Model validation: The accuracy and reliability of the developed models were validated using a subset of the collected data. A sensitivity analysis was also performed to evaluate the robustness of the models under different conditions. This analysis helped identify critical SF elements that have the most significant impact on traffic flow, providing valuable insights for traffic management and urban planning.
Impact assessment and policy implications: The results from the model provided a detailed understanding of the complex interactions between SF elements and traffic dynamics. The study found that high levels of SF significantly reduce road capacity and vehicle speeds, leading to increased congestion, especially during peak hours. These findings underscore the importance of integrating SF considerations into traffic management and urban planning policies to enhance road safety and efficiency.
Recommendations for future research: Future studies should consider expanding the scope to include additional urban settings and a broader range of SF elements, such as street vendors and construction activities. Incorporating real-time data analytics and advanced traffic simulation models could further refine our understanding of the dynamic interactions between traffic flow and SF. This comprehensive approach is crucial for developing sustainable traffic management strategies that can accommodate the challenges of rapid urbanization and increased motorization.
This methodology provides a robust framework for analyzing the impact of SF on urban traffic flow, offering valuable insights for urban planners and policymakers in developing effective traffic management strategies.
4.1 Study area and data collection
Babil Governorate is strategically positioned in the heart of Iraq, approximately 85 km south of Baghdad, the nation’s capital. The governorate is bordered by Baghdad to the north, Wasit to the east, Al-Qadisiyyah to the south, and Karbala to the west. The location of selected streets is indicated in Figure 1.

Hillah Governorate (Location of the selected data point).
To gather traffic data, four urban roads within the city of Hilla were selected and sectioned based on distinctive characteristics. Notably, 60th Street, a divided roadway in the central business district, exhibits a pronounced commercial presence. Similarly, 40th Street, characterized by numerous educational and commercial establishments, experiences significant traffic, particularly during peak hours. Additionally, Al-Atbaaba Street, known for its concentration of medical clinics and pharmacies, becomes notably congested in the evenings. Lastly, Al-Mahkamh Street in Hilla, identified for its high traffic density, also displays pronounced side friction (SF) behaviors. For this study, the pedestrian movements, stopped vehicles, entry and exit movements, and wrong movement of vehicles are identified, and the frequency of each event type is noted.
Traffic assessments were conducted on selected days (Sunday, Monday, and Wednesday) during both morning and evening periods. Elevated video cameras were strategically installed alongside the roads to capture comprehensive data on traffic volume and SF behaviors. Specific segments of the road, extending 200 m, were designated for detailed observations to classify the types and volumes of vehicles using a fixed reference point within the monitoring sections.
Throughout the extended surveillance of these highways, frequent SF incidents were noted and systematically documented. Every 5 min, the recorded footage was analyzed to quantify traffic volume, vehicle speed, and the nature of SF incidents. The outcomes of these analyses are summarized in Table 1 and illustrated in Figure 1, which details the methodologies and field sections employed in this study.
The urban road selected in this study
| Section | Name of the road | Divided/undivided | Classes | Service flow(veh/h) | FFS (km/h) |
|---|---|---|---|---|---|
| 1 | Abo Khamra Street | Divided | Ⅱ | 2,736 | 68.41 |
| 2 | Al-Atbaaba Street | Undivided | Ⅱ | 616 | 64.82 |
| 3 | 60 Street Adam | Divided | Ⅰ | 3,260 | 80.37 |
| 4 | Al-Mahkamh Street | Divided | Ⅰ | 3,807 | 58.41 |
5 SF analysis
The combined analysis of Figure 1 through 4 provides a comprehensive overview of SF events and their impact on traffic flow across various street segments during different time periods. Each figure represents a specific road segment, capturing SF elements such as pedestrian activity, parked vehicles, entry–exit maneuvers, and wrong vehicle movements, all of which are critical factors affecting vehicular speed and flow efficiency.
Figure 2 illustrates the temporal variation of SF events on Abo Khamra Street throughout the day. Pedestrian activity (blue line) shows a gradual increase in the morning, peaking around 10:00 AM, and then stabilizes in the afternoon. Parking vehicle events (orange line) maintain a steady pattern in the early morning, followed by a sharp decline around 11:00 AM, indicating that most parking activities occur during the early hours. Entry–exit vehicle events (gray line) demonstrate a consistent rise from morning until midday, reflecting high levels of entry and exit traffic during working hours. Wrong movement vehicles (yellow line) display a stable and low pattern throughout the day, suggesting that they are not a major contributor to congestion on this street. This analysis indicates distinct peaks and patterns in SF activities, which are crucial for understanding and managing traffic flow on this urban street segment.

SF events overtime on 40 Abo Khamra Street.
Figure 3 presents the SF events over time on Al-Atbaaba Street, ranging from Bab Al-Hussein Bridge to Al-Ray Street. The graph illustrates three key categories: pedestrian activities, parking vehicles, and wrong-movement vehicles. Pedestrian events (blue line) demonstrate a gradual increase throughout the day, peaking significantly around 16:20–16:25, indicating high foot traffic during this period. Parking vehicle activities (orange line) remain relatively stable and low throughout the day, showing minimal impact on SF compared to pedestrian activities. Wrong-movement vehicles (gray line) show a consistent, low frequency throughout the day, suggesting a lesser influence on overall traffic flow. The sharp increase in pedestrian activities in the late afternoon points to potential congestion and safety concerns that may require targeted interventions such as improved pedestrian facilities or traffic calming measures to enhance road safety and efficiency in this area.

SF events over time on Al-Atbaaba Street from Bab Al-Hussein Bridge to Al-Ray Street.
Figure 4 illustrates the SF events over time on Al-Mahkamh Street, spanning from Bab Al-Hussein Bridge to Al-Hunud Bridge. The graph represents three main types of SF activities: pedestrian movements (blue line), parking vehicles (orange line), and entry–exit vehicle activities (gray line). Pedestrian activities show a steady increase, reaching their peak between 10:20 and 14:15, followed by a gradual decline toward the evening, indicating significant pedestrian movement during midday hours. The parking vehicles’ trend remains relatively stable and low throughout the day, suggesting minimal disruption from static vehicles.

SF events over time on Al-Mahkamh Street from Bab Al-Hussein Bridge to Al-Hunud Bridge.
In contrast, the entry–exit vehicle activities exhibit substantial fluctuations, peaking around 14:00 and remaining elevated until 16:00. This indicates high vehicular movement in and out of access points along this street during these hours, likely contributing to traffic flow interruptions and increased congestion. The sharp decline in pedestrian and entry–exit activities after 16:15 suggests a reduction in overall traffic interactions. The data highlights the need for targeted traffic management strategies during peak hours, especially for pedestrian and entry–exit interactions, to improve overall traffic flow and safety on Al-Mahkamh Street.
Figure 5 illustrates the SF events over time on 60 Street Adam, spanning from AL-Thawruh Bridge to Nadir Bridge. The graph depicts three categories of SF activities: pedestrian movements (blue line), parking vehicles (orange line), and entry–exit vehicle activities (gray line). Pedestrian activities show a gradual increase throughout the day, peaking significantly after 15:00 and reaching their highest point around 16:20, indicating increased pedestrian flow during late afternoon hours. Parking vehicle activity remains consistently low and stable across the day, suggesting minimal impact from static vehicles on the traffic flow.

SF events over time on 60 Street Adam from AL-Thawruh Bridge to Nadir Bridge.
Conversely, the entry–exit vehicle activities maintain a moderate level until around 14:15, after which a noticeable rise is observed, peaking slightly before 16:30. This indicates a substantial increase in vehicular access interactions during the late afternoon, which could potentially contribute to congestion during these hours. The sharp rise in pedestrian and entry–exit activities towards the end of the observed period highlights the critical need for managing these interactions to prevent traffic disruptions. These observations underline the importance of implementing effective traffic management measures, particularly during peak afternoon hours, to mitigate the impact of SF on traffic flow efficiency along 60 Street Adam.
The analysis across all figures clearly demonstrates that SF activities, especially pedestrian movements and vehicle entry–exit maneuvers, exert a substantial influence on traffic flow during peak morning and afternoon hours. Notably, the afternoon peak exhibits a more pronounced effect, with a higher frequency of SF occurrences, indicating greater interactions and potential congestion during this time. While parked vehicles remain relatively static and contribute less to congestion, dynamic activities such as pedestrian crossings and vehicular movements play a more significant role. These observations underscore the necessity for focused traffic management strategies to mitigate the adverse effects of SF, particularly during critical peak periods, as outlined in Table 2.
Analysis of maximum hourly flow rates for pedestrian activity, parking events, entry–exit movements, and traffic violations on Urban Streets in Al-Hilla City
| Section | Name of the road | Street width (m) | Pedestrian max. flow events (h) | Parked vehicles max. flow events (h) | Entry–exit max. flow events (h) | Wrong movement max. flow events (h) |
|---|---|---|---|---|---|---|
| 1 | Abo Khamra Street | 10 | 756 | 240 | 504 | 36 |
| 2 | Al-Atbaaba Street | 9 | 228 | 108 | NA | 12 |
| 3 | 60 Street Adam | 10 | 732 | 144 | 504 | NA |
| 4 | Al-Mahkamh Street | 8 | 108 | 156 | 432 | NA |
6 Results and discussion
In this study, the SF measurement methodology proposed by Pal and Roy [18] was adopted. This approach utilizes the concept of pedestrian influencing area as a standard parameter to quantify the impact of SF events, converting various activities into pedestrian equivalent units (PEU). Specifically, stationary vehicles were converted into PEUs to standardize the static SF activity, ensuring a consistent and reliable assessment of SF impacts on traffic flow. The conversion values used in this study are shown in Table 3.
Projected area and pedestrian equivalent units (PEU) for different modes of transportation [18]
| Mode | Projected area (m2) | PEU |
|---|---|---|
| Pedestrian | 0.5 | 1 |
| 2W | 1.2 | 2.5 |
| 3W | 3.9 | 7.8 |
| Car | 7.3 | 14.5 |
| Bus | 31.2 | 62.4 |
| LCV | 5.4 | 10.7 |
| Bicycle | 1.1 | 2.2 |
The static SF activities, such as the presence of pedestrians and parked vehicles, are combined to measure the total static SF. A procedure suggested by various studies is followed to estimate this friction, where PEU are calculated for each type of parked vehicle within the influencing area [11,18–30]. The expression for converting parked vehicle types into an equivalent number of pedestrian units is given in Equation (1)
where PEUi is the pedestrain equivalent units of the parked vehicle type, PAi is the projected area of the parked vehicle type, and PAp is the projected area of the pedestrian.
Further, PEU of vehicle type is multiplied by the frequency of parked/stopped vehicle types to achieve uniformity in the measurement of static SF. The PEU values estimate the frequency of static SF by combining pedestrian and parked vehicles. The expression for finding the static SF is given in Equation (2) in terms of PSPU (Pedestrian and Stopped/Parked Units) (events/h), i.e. pedestrians and stopped/parked vehicles in terms of pedestrian units
where NPSPU is the frequency of pedestrians and stopped/parked vehicles in pedestrian units, N P is the frequency of pedestrians, PEUi is the pedestrian equivalent unit of the parked/stopped vehicle, N i is the frequency of the parked/stopped vehicle.
Chiguma [2] utilized a regression method to estimate standardized coefficients and weighting factors, employing average stream speed as the primary performance measure variable. This methodology effectively quantified the influence of various roadside activities on traffic performance. In the current study, a similar approach is adopted to ascertain the relative impact of different SF elements on traffic flow. By using stream speed as the key performance indicator, this analysis aims to provide a comprehensive assessment of the contribution of each roadside activity to overall traffic dynamics, thereby enabling more precise traffic management and planning strategies, as illustrated in Equation (3):
where SF is the side friction,
To quantitatively evaluate the impact of side friction elements on traffic flow speed, the current study adopts the equation developed by Gulivindala and Mehar [31] to systematically analyze and predict the influence of each SF component on traffic performance under varying conditions. This equation, originally used in a different context, has been adapted for the unique traffic conditions of Hilla City to provide a comprehensive understanding of the cumulative effects of both static and dynamic SF elements. By employing this approach, the study aims to address the identified research gap related to the cumulative effects of both static and dynamic SF elements on urban traffic flow. This analysis offers valuable insights into traffic management and urban planning strategies in rapidly urbanizing cities.
To determine the unit (SF), weighted standard coefficients were added to the independent individual variables that have a negative relationship with the standard variable (dependent variable). Regression analysis was performed for these individual coefficients, as this analysis included the flow parameter and the elements of SF and made them independent variables in the equation. The speed parameter was taken as a response variable.
The relative weights of SF elements for Abu Khmrah Street, Al-Atbaaba Street, 60th Street Adam, and Al-Mahkamh Street, as presented in Table 4, demonstrate their significant influence on vehicular speed. The analysis indicates that these elements, such as PSPU and entry/exit maneuvers, are negatively correlated with the dependent variable, leading to a reduction in vehicle speed as their frequency increases. This pattern suggests that higher levels of SF substantially disrupt traffic flow, reducing speed and efficiency across these urban streets. Notably, the ANOVA test was employed to validate the statistical significance of these relationships, confirming that increased SF elements, particularly on Abu Khmrah Street and 60th Street Adam, result in a marked decline in vehicular speed. The relative weights highlight the varying impact of different SF elements, with PSPU consistently having the most pronounced effect across all observed streets.
Regression analysis and SF equations highlighting the impact of SF elements on vehicle speed across selected streets
| Street | Regression coefficients | t-Value | p-Value | Relative weights coefficient | SF equation | |
|---|---|---|---|---|---|---|
| Abo_Kharam | (Constant) | 68.905 | 53.251 | <0.001 | SF = (
|
|
| PSPU | ‒0.942 | ‒15.248 | <0.001 | 1 | ||
| Entry_Exit
|
‒0.043 | ‒0.689 | 0.496 | 0.046 | ||
| Opposite NWN | 0.048 | 1.441 | 0.159 | 0.051 | ||
| Altabba | (Constant) | 75.210 | 79.033 | <0.001 | SF =
|
|
| PSPU | ‒0.990 | ‒42.441 | <0.001 | 1 | ||
| Opposite NWN | 0.017 | 0.748 | 0.460 | 0.017 | ||
| Almahkama | (Constant) | 61.181 | 51.762 | <0.001 | SF =
|
|
| PSPU | ‒0.678 | ‒6.438 | <0.001 | 1 | ||
| Entry_Exit
|
‒0.309 | ‒2.932 | 0.006 | 0.456 | ||
| Adam | (Constant) | 99.897 | 11.865 | <0.001 | SF =
|
|
| PSPU | ‒0.665 | ‒5.317 | <0.001 | 1 | ||
| Entry_Exit
|
‒0.269 | ‒2.152 | 0.039 | 0.405 |
Table 5 provides data on various SF elements observed during the evening hours on 40 Abo Khamra Street, specifically between 8:00 and 10:00 PM. The data is recorded in 5-min intervals and includes observations of pedestrian movements, parking vehicles, entry and exit vehicle activities, and wrong vehicle movements, all measured as events per hour. The number of pedestrian movements shows a significant increase throughout the observation period, peaking towards the end of the recording time. Similarly, the frequency of parking vehicle events rises gradually, indicating a higher demand for on-street parking during the later hours. The entry and exit vehicle activities exhibit notable fluctuations, reflecting varying traffic patterns. Instances of wrong vehicle movements, such as illegal turns or improper lane changes, are also documented, contributing to the overall complexity of traffic conditions. The SF values, representing the cumulative impact of all these elements, demonstrate an upward trend, highlighting increased traffic complexity as the evening progresses.
Data of SF elements during the evening period (7:00 to 10:00 PM) for 40 Abo Khamra Street
| Time | Pedestrian (N p) event (h) | Parking vehicle (N i) event (h) | PSPU = PEUi × N i + passenger | Entry–exit vehicles event (h) | Wrong movement vehicles event (h) | SF event (h) |
|---|---|---|---|---|---|---|
| 07:00–07:05 | 24 | 12 | 198.336 | 48 | 0 | 200.544 |
| 07:05–07:10 | 60 | 24 | 408.672 | 96 | 0 | 413.7 |
| 07:10–07:15 | 96 | 36 | 619.008 | 144 | 0 | 625.632 |
| 07:15–07:20 | 72 | 24 | 420.672 | 60 | 0 | 423.432 |
| 07:20–07:25 | 36 | 36 | 559.008 | 132 | 24 | 566.304 |
| 07:25–07:30 | 48 | 72 | 1094.016 | 192 | 0 | 1102.848 |
| 07:30–07:35 | 96 | 60 | 967.68 | 156 | 0 | 974.856 |
| 07:35–07:40 | 72 | 72 | 1118.016 | 216 | 0 | 1127.952 |
| 07:40–07:45 | 108 | 60 | 979.68 | 204 | 0 | 990.288 |
| 07:45–07:50 | 96 | 96 | 1490.688 | 156 | 0 | 1497.864 |
| 07:50–07:55 | 96 | 72 | 1142.016 | 204 | 0 | 1151.4 |
| 07:55–08:00 | 108 | 96 | 1502.688 | 240 | 0 | 1513.728 |
| 08:00–08:05 | 324 | 144 | 2416.032 | 216 | 12 | 2426.58 |
| 08:05–08:10 | 240 | 144 | 2332.032 | 264 | 0 | 2344.176 |
| 08:10–08:15 | 336 | 120 | 2079.36 | 240 | 0 | 2090.4 |
| 08:15–08:20 | 312 | 144 | 2404.032 | 312 | 0 | 2418.384 |
| 08:20–08:25 | 276 | 120 | 2019.36 | 288 | 0 | 2033.22 |
| 08:25–08:30 | 252 | 144 | 2344.032 | 360 | 0 | 2360.592 |
| 08:30–08:35 | 312 | 192 | 3101.376 | 336 | 0 | 3116.832 |
| 08:35–08:40 | 312 | 144 | 2404.032 | 276 | 0 | 2416.728 |
| 08:40–08:45 | 276 | 192 | 3065.376 | 336 | 0 | 3080.832 |
| 08:45–08:50 | 240 | 144 | 2332.032 | 384 | 0 | 2350.92 |
| 08:50–08:55 | 384 | 196 | 3231.488 | 408 | 0 | 3250.256 |
| 08:55–09:00 | 348 | 120 | 2091.36 | 372 | 0 | 2108.472 |
| 09:00–09:05 | 408 | 144 | 2500.032 | 432 | 36 | 2521.74 |
| 09:05–09:10 | 384 | 192 | 3173.376 | 384 | 0 | 3191.04 |
| 09:10–09:15 | 420 | 192 | 3209.376 | 504 | 0 | 3232.56 |
| 09:15–09:20 | 432 | 240 | 3918.72 | 420 | 0 | 3938.04 |
| 09:20–09:25 | 468 | 192 | 3257.376 | 408 | 0 | 3276.144 |
| 09:25–09:30 | 516 | 228 | 3828.384 | 432 | 0 | 3848.868 |
| 09:30–09:35 | 552 | 196 | 3399.488 | 384 | 0 | 3417.152 |
| 09:35–09:40 | 624 | 144 | 2716.032 | 420 | 0 | 2735.352 |
| 09:40–09:45 | 684 | 96 | 2078.688 | 372 | 12 | 2096.412 |
| 09:45–09:50 | 756 | 72 | 1802.016 | 408 | 0 | 1820.784 |
| 09:50–09:55 | 708 | 72 | 1754.016 | 396 | 0 | 1772.232 |
| 09:55–10:00 | 732 | 72 | 1778.016 | 408 | 0 | 1796.784 |
Figure 6 illustrates a significant inverse relationship between vehicle speed and the frequency of SF events per hour across four different streets. The data indicates that an increase in SF events leads to a considerable reduction in vehicle speeds, as demonstrated by the high coefficient of determination (R²) values, which range from 0.71 to 0.86. This suggests that SF events account for a substantial portion of the variance in speed. The findings highlight the importance of managing SF factors to improve traffic flow efficiency and ensure road safety on urban streets.

Speed and SF relation in streets: (a) SF events overtime on 40 Abo Khamra Street, (b) SF events over time on Al-Atbaaba Street, (c) SF events over time on Al-Mahkamh Street, and (d) SF events overtime on 60 Street Adam.
Table 6 provides an in-depth analysis of the relationship between SF events per hour and their impact on average stream speed as well as the percentage reduction in speed across various urban streets in Hillah City. The table categorizes SF events into four distinct levels: low (0–500 events/h), medium (500–1,000 events/h), high (1,000–2,000 events/h), and very high (>2,000 events/h). It demonstrates a clear inverse relationship between the frequency of SF events and average stream speed.
Impact levels of SF on average stream speed in urban roads
| SF (Events/h) | Level of SF | Average stream speed (km/h) | Percentage reduction in average speed |
|---|---|---|---|
| 0–500 | Low | 55 | — |
| 500–1,000 | Medium | 48 | 13% |
| 1,000–2,000 | High | 39 | 29% |
| >2,000 | Very high | 28 | 49% |
As the number of SF events increases, the average stream speed of traffic decreases significantly. For instance, when SF is low, the average speed remains relatively high at 55 km/h. However, as the level of SF escalates to very high (>2,000 events/h), the average stream speed drops dramatically to 28 km/h, indicating a significant reduction of 49%. This substantial decrease highlights the disruptive effect of SF elements such as pedestrian movements, on-street parking, and vehicle entry–exit maneuvers on traffic flow.
A traffic speed prediction model was developed using traffic flow and SF as key predictor variables. In addition, the street width was incorporated as an influencing variable along with flow and SF to better understand their combined impact on traffic speed. The model was generated using approximately 70% of the data collected across all sections, with the stream speed serving as the dependent variable. The ANOVA test results, as presented in Table 7, indicate that the model is statistically significant at the 95% confidence level, confirming the robustness of the model in predicting traffic speed under varying conditions. The t-test results in Table 8 further reveal that all variables are statistically significant, except for the traffic flow variable, which does not exhibit individual statistical significance. However, when considered in conjunction with other variables, traffic flow demonstrates a significant influence on the model, underlining the importance of interaction effects in understanding the factors impacting traffic speed. This comprehensive analysis underscores the effectiveness of the developed model in capturing the nuances of urban traffic behavior and provides a reliable tool for traffic management and planning.
where SF represent the side friction (events/h), F traffic flow (veh/h), W street width (m).
ANOVA test speed prediction model
| ANOVA | ||||||
|---|---|---|---|---|---|---|
| Model | Sum of squares | df | Mean square | F | Sig. | |
| Speeda | Regression | 22317.446 | 3 | 7439.149 | 111.445 | <0.001 |
| Residual | 10947.324 | 164 | 66.752 | |||
| Total | 33264.770 | 167 | ||||
aDependent variable: speed km/h.
Speed prediction model coefficients
| Coefficients | |||||||||||||
|---|---|---|---|---|---|---|---|---|---|---|---|---|---|
| Unstandardized coefficients | Standardized coefficients | t | Sig. | 95.0% confidence interval for B | Correlations | Collinearity statistics | |||||||
| Model | B | Std. error | Beta | Lower bound | Upper bound | Zero-order | Partial | Part | Tolerance | VIF | |||
| Speeda | (Constant) | 13.677 | 22.567 | 0.606 | 0.545 | −30.883 | 58.237 | ||||||
| SF | −0.014 | 0.001 | −1.007 | −15.369 | 0.000 | −0.016 | −0.012 | −0.748 | −0.768 | −0.688 | 0.468 | 2.138 | |
| Flow | 0.005 | 0.002 | 0.282 | 2.541 | 0.012 | 0.001 | 0.008 | −0.270 | 0.195 | 0.114 | 0.163 | 6.120 | |
| Width | 4.424 | 2.566 | 0.156 | 1.725 | 0.086 | −0.641 | 9.490 | −0.041 | 0.133 | 0.077 | 0.247 | 4.057 | |
aDependent variable: speed km/h.
To validate the predicted stream speed model, 30% of the collected data were used. Levene’s test and t-test were conducted to evaluate whether there is a significant difference between the observed and predicted speeds. The results demonstrated that the model is statistically significant at a 95% confidence interval, indicating that there is no significant difference between the modeled and observed average speeds of the vehicular traffic stream. This supports the null hypothesis, as illustrated in Tables 9 and 10.
Validation of the multiple linear regression model
| Diff | N | Mean | Std. deviation | Std. error mean | |
|---|---|---|---|---|---|
| Group statistics t-Test | |||||
| Speed km/h | Observed | 72 | 44.5963 | 15.85927 | 1.86903 |
| Predicted | 72 | 44.5790 | 14.99142 | 1.76676 | |
Results of the independent samples test
| Independent samples test | |||||||||||
|---|---|---|---|---|---|---|---|---|---|---|---|
| Levene’s test for equality of variances | t-Test for equality of means | ||||||||||
| F | Sig. | t | df | Significance | Mean difference | Std. error difference | 95% Confidence interval of the difference | ||||
| One-sided p | Two-sided p | Lower | Upper | ||||||||
| Speed km/h | Equal variances assumed | 0.190 | 0.663 | 0.007 | 142 | 0.497 | 0.995 | 0.01726 | 2.57191 | −5.06692 | 5.10144 |
| Equal variances | 0.007 | 141.553 | 0.497 | 0.995 | 0.01726 | 2.57191 | −5.06705 | 5.10157 | |||
The validation plot, depicted in Figure 7, shows a high correlation between the predicted and observed speeds, with an R-square value of 88.5%, signifying a strong predictive capability of the model. Group statistics indicate that the mean observed speed was 44.5963 km/h with a standard deviation of 15.85927, while the mean predicted speed was 44.5790 km/h with a standard deviation of 14.99142.
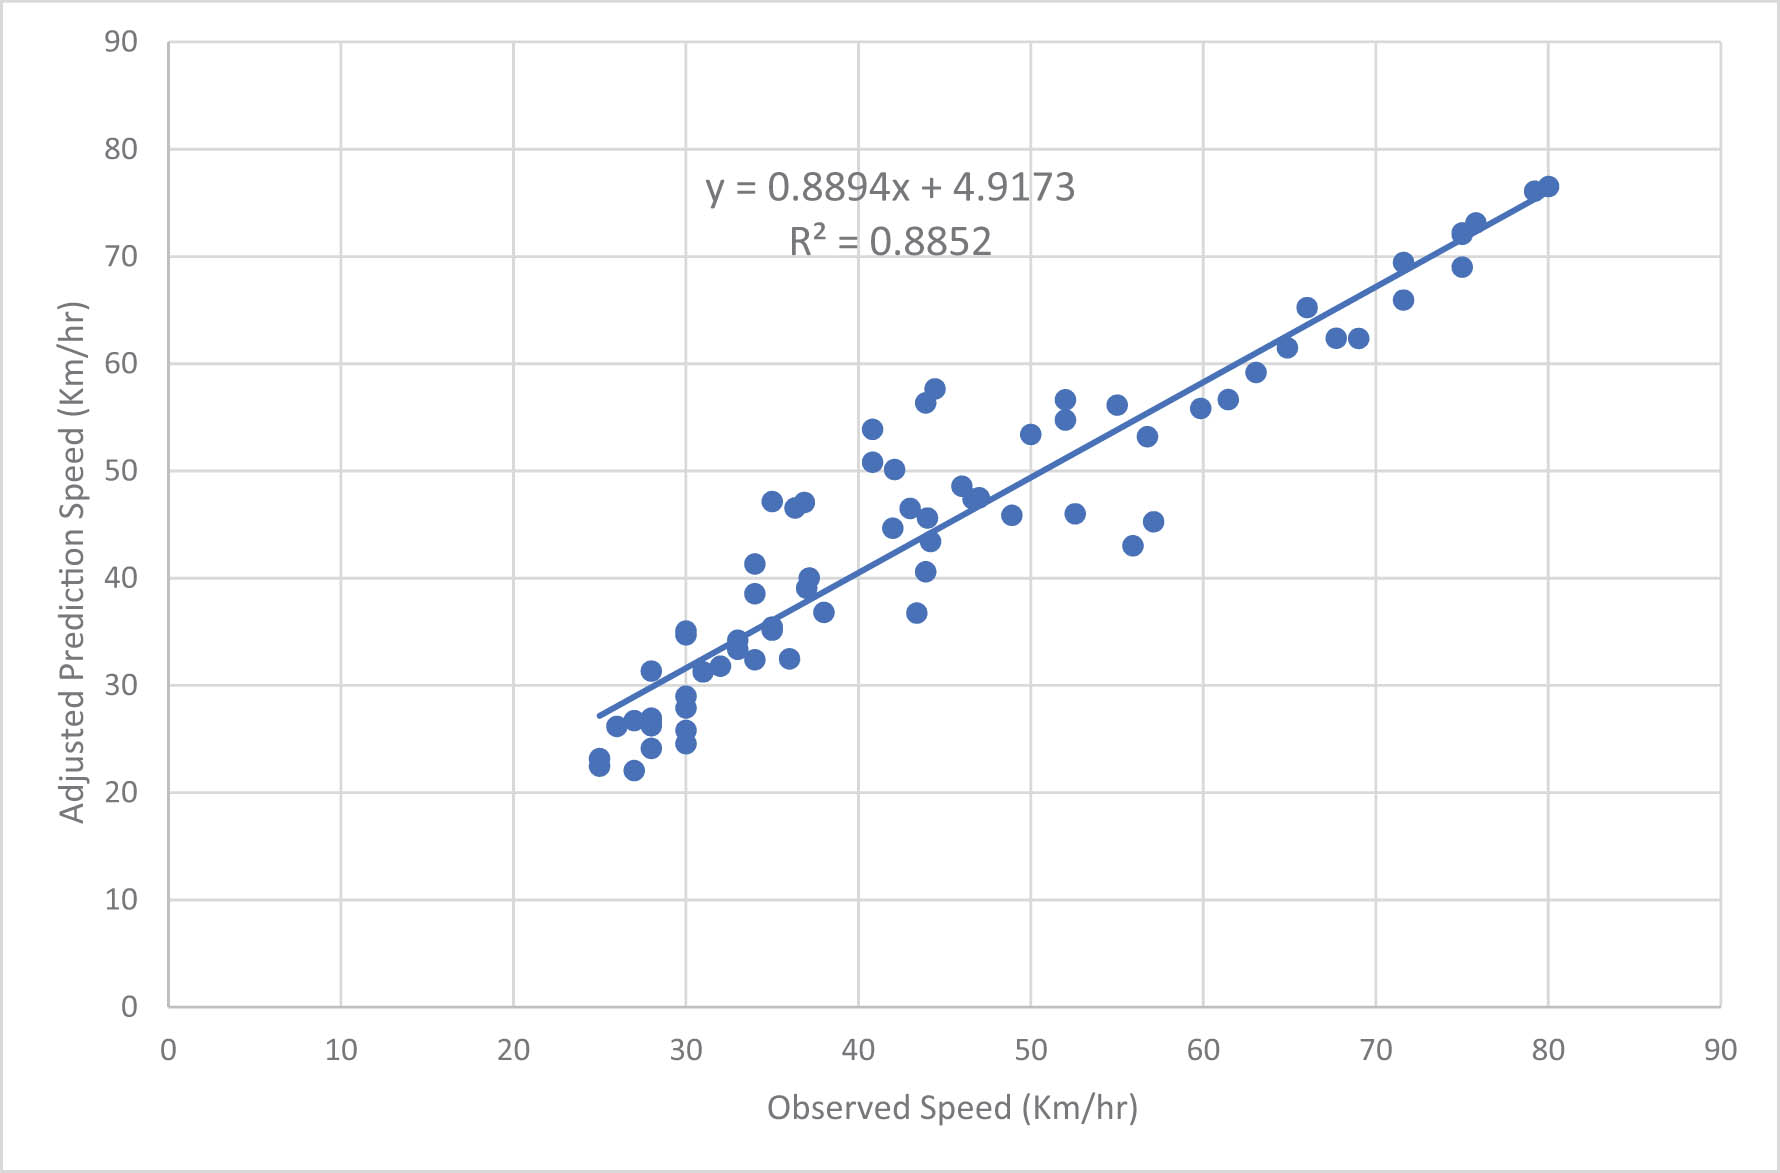
Correlation analysis between observed speeds and adjusted predicted speeds with linear regression.
Levene’s test for equality of variances yielded a non-significant F-value of 0.190 with a p-value of 0.663, confirming homogeneity of variances. The t-test for Equality of Means resulted in a t-value of 0.007 with a p-value of 0.995, further confirming that the difference between observed and predicted means is not statistically significant. The 95% confidence interval for the mean difference ranged from −5.06692 to 5.10144, reinforcing the conclusion that the model accurately predicts the average speed of the vehicular traffic stream.
Table 11 provides a detailed comparison between observed speeds and adjusted predictions, alongside the calculation of squared errors for each observation. The aim of this analysis is to evaluate the accuracy of the developed regression model in predicting vehicle speeds under different traffic conditions influenced by SF elements. The table lists 72 different observed speed values, and for each one, the corresponding adjusted prediction by the model is provided. The “Error SQRT” column represents the square root of the error between the observed and predicted values, effectively quantifying the deviation between the actual and modeled speeds. The root means square error (RMSE) value, calculated as 5.3511, serves as a summary statistic that represents the standard deviation of prediction errors. This value indicates the model’s precision; a lower RMSE suggests better predictive capability and a stronger fit to the observed data. Additionally, the high correlation between observed and predicted speeds, as demonstrated in the validation plots, reinforces the robustness of the model in understanding the complex relationship between SF elements and traffic speed.
Comparison of actual speeds and adjusted predictions with squared error
| Number | Observed speed | Adj. prediction | Error SQRT |
|---|---|---|---|
| 1 | 28.1 | 26.7024 | 1.953286 |
| 2 | 32.35 | 31.78249 | 0.322068 |
| 3 | 31.6 | 31.24142 | 0.12858 |
| 4 | 30.39 | 27.88018 | 6.299196 |
| 5 | 25.64 | 23.17025 | 6.099665 |
| 6 | 28.47 | 31.32304 | 8.139837 |
| 7 | 27.29 | 26.70306 | 0.344499 |
| 8 | 28.55 | 26.23279 | 5.369462 |
| 9 | 27.29 | 22.03411 | 27.62438 |
| 10 | 35.47 | 35.41645 | 0.002868 |
| 11 | 30.28 | 35.0577 | 22.82642 |
| 12 | 28.62 | 26.88575 | 3.007623 |
| 13 | 25.83 | 22.46068 | 11.35232 |
| 14 | 28.27 | 26.93031 | 1.794769 |
| 15 | 30.62 | 28.99062 | 2.654879 |
| 16 | 28.44 | 24.10935 | 18.75453 |
| 17 | 30.1 | 25.7958 | 18.52614 |
| 18 | 28.49 | 26.55398 | 3.748173 |
| 19 | 35.58 | 35.13534 | 0.197723 |
| 20 | 37.43 | 39.06183 | 2.662869 |
| 21 | 34.71 | 32.39036 | 5.38073 |
| 22 | 38.27 | 36.78584 | 2.202731 |
| 23 | 26.29 | 26.16404 | 0.015866 |
| 24 | 33.5 | 33.35913 | 0.019844 |
| 25 | 33.1 | 34.2107 | 1.233654 |
| 26 | 46.47 | 48.56963 | 4.408446 |
| 27 | 30.51 | 24.54243 | 35.61189 |
| 28 | 30.8 | 34.69403 | 15.16347 |
| 29 | 36.29 | 32.46124 | 14.6594 |
| 30 | 47.7 | 47.48412 | 0.046604 |
| 31 | 34 | 38.53748 | 20.58872 |
| 32 | 44.9 | 45.59779 | 0.486911 |
| 33 | 52.7 | 56.61893 | 15.35801 |
| 34 | 50 | 53.39802 | 11.54654 |
| 35 | 42 | 44.65536 | 7.050937 |
| 36 | 52.3 | 54.73622 | 5.935168 |
| 37 | 80.01 | 76.5034 | 12.29624 |
| 38 | 79.2 | 76.07439 | 9.769438 |
| 39 | 75.8 | 73.11086 | 7.231474 |
| 40 | 75 | 72.18371 | 7.931489 |
| 41 | 71.6 | 69.42369 | 4.736325 |
| 42 | 75 | 72.04993 | 8.702913 |
| 43 | 71.6 | 65.91505 | 32.31866 |
| 44 | 75 | 68.99591 | 36.0491 |
| 45 | 67.7 | 62.35252 | 28.59554 |
| 46 | 69 | 62.3327 | 44.45289 |
| 47 | 66.02 | 65.22509 | 0.631882 |
| 48 | 63.05 | 59.17558 | 15.01113 |
| 49 | 64.87 | 61.47816 | 11.50458 |
| 50 | 59.85 | 55.80757 | 16.34124 |
| 51 | 61.45 | 56.64796 | 23.05959 |
| 52 | 35 | 47.1363 | 147.2898 |
| 53 | 57.11 | 45.25575 | 140.5232 |
| 54 | 43.9 | 56.34005 | 154.7548 |
| 55 | 42.1 | 50.11504 | 64.24087 |
| 56 | 55 | 56.12432 | 1.264095 |
| 57 | 46.64 | 47.36997 | 0.532856 |
| 58 | 55.92 | 43.00892 | 166.696 |
| 59 | 34 | 41.30531 | 53.36755 |
| 60 | 40.82 | 50.80173 | 99.63493 |
| 61 | 37.15 | 39.99743 | 8.107858 |
| 62 | 48.9 | 45.85576 | 9.267397 |
| 63 | 36.33 | 46.52736 | 103.9862 |
| 64 | 43.38 | 36.72269 | 44.31978 |
| 65 | 43.9 | 40.58644 | 10.97968 |
| 66 | 43 | 46.48848 | 12.16949 |
| 67 | 36.87 | 47.04707 | 103.5728 |
| 68 | 44.18 | 43.39557 | 0.61533 |
| 69 | 44.44 | 57.63101 | 174.0027 |
| 70 | 40.82 | 53.8652 | 170.1772 |
| 71 | 56.75 | 53.17303 | 12.79471 |
| 72 | 52.57 | 45.99049 | 43.28995 |
Sum error SQRT = 28.635, RMSE = 5.3511.
6.1 Practical applications
Formulation of traffic management policies: One key application of this research is the formulation of traffic management policies aimed at reducing high-impact SF activities in congested urban corridors. For example, stricter enforcement of parking regulations, including the establishment of designated parking zones and the removal of illegal on-street parking, can significantly decrease the frequency of disruptions caused by parked vehicles. This can lead to improved traffic flow and reduced congestion, particularly in areas with high commercial activity where parking violations are common. By implementing clear parking policies and providing sufficient off-street parking facilities, local authorities can alleviate the negative impact of on-street parking on traffic performance.
Infrastructure planning and design: Moreover, the research highlights the importance of incorporating SF considerations into urban infrastructure planning and design. Planners can use the study’s insights to develop comprehensive street design guidelines that accommodate the needs of all road users, including pedestrians and cyclists, without compromising vehicular traffic flow. For example, creating separate lanes for non-motorized traffic, adding dedicated pedestrian crossings at strategic locations, and improving the visibility of entry and exit points can help reduce conflicts and improve overall road safety.
Intelligent transport systems (ITS) and smart city initiatives: Another practical application of the research findings is the enhancement of Intelligent Transport Systems (ITS) and Smart City initiatives. By integrating real-time data on SF elements, such as pedestrian counts and parking violations, into ITS platforms, cities can develop adaptive traffic management systems that dynamically adjust signal timings and provide real-time alerts to enforcement personnel. This would enable a more responsive and efficient approach to managing urban traffic and mitigating the impacts of SF in real-time.
7 Conclusion
This study comprehensively examines the impact of SF elements on urban traffic flow in Hilla City, focusing on how various factors such as parked vehicles, pedestrian movements, and vehicular entry–exit maneuvers affect traffic performance. The findings highlight those high levels of SF led to significant reductions in vehicle speeds and road capacity, with some areas experiencing up to a 49% decrease in average speed during peak hours. These results underscore the necessity for targeted interventions to mitigate the adverse effects of SF and enhance traffic efficiency and safety in rapidly developing urban environments.
The study introduced key metrics, including the RSFI and Friction (FRIC) unit, which were instrumental in quantifying SF impacts. Regression models, such as those applied to Abo Khamra Street, revealed a strong negative correlation between SF elements and vehicle speeds, where the model predicted significant reductions in traffic flow due to increasing SF activities. The RMSE of 5.3511 validates the accuracy of the developed models, while the model’s R² value of 88.5% indicates strong predictive capability.
Recommendations include implementing stricter parking regulations, improving pedestrian infrastructure, and integrating SF data into ITS for real-time traffic management. Urban infrastructure design should account for both motorized and non-motorized traffic to ensure safety and efficiency.
Future research should extend to other cities to validate these models and incorporate advanced traffic simulation tools to enhance predictive capabilities. The practical outcomes of this research provide policymakers with essential strategies to reduce congestion and promote sustainable urban mobility.
Acknowledgements
The authors would like to acknowledge the School of Civil Engineering, Universiti Sains Malaysia and Civil Engineering Department, University of Kufa, for their support.
-
Funding information: The authors state no funding involved.
-
Author contributions: All authors have accepted responsibility for the entire content of this manuscript and consented to its submission to the journal, reviewed all the results, and approved the final version of the manuscript. HAAJ designed the experiments, ALHAY performed the analysis, and LVL assessed the work. HAAJ supervised the writing of the manuscript, and ALHAY prepared the original draft of the manuscript with contributions from all co-authors. LVL reviewed and edited the final version of the manuscript.
-
Conflict of interest: The authors state no conflict of interest.
-
Data availability statement: Most datasets generated and analyzed in this study are in this submitted manuscript. The other datasets are available on reasonable request from the corresponding author with the attached information.
References
[1] Bang KL (1995), Impact of side friction on speed-flow relationships for rural and urban highways (HDM 4 Project Report, pp. 1–27). SWEROAD Indonesia.Search in Google Scholar
[2] Chiguma ML (2007), Analysis of side friction impacts on urban roads: Case study Dar-es-Salaam (Doctoral dissertation, KTH).Search in Google Scholar
[3] Purohit S, Chattaraj U, Panda M. Experimental study of non-motorized vehicle characteristics and its effect on mixed traffic. Int J Traffic Transp Eng. 2014;4(4):425–36. 10.7708/ijtte.2014.4(4).06.Search in Google Scholar
[4] Biswas S, Chandra S, Ghosh I. Side friction parameters and their influences on capacity of Indian undivided urban streets. Int J Transp Sci Technol. 2021;10(1):1–19. 10.1016/j.ijtst.2020.03.007.Search in Google Scholar
[5] Rao AM, Velmurugan S, Lakshmi KMVN. Evaluation of influence of roadside frictions on the capacity of roads in Delhi, India. Transp Res Procedia. 2017;25:4771–82. 10.1016/j.trpro.2017.05.489.Search in Google Scholar
[6] Munawar A. Speed and capacity for urban roads, Indonesian experience. 6th International Symposium on Highway Capacity and Quality of Service. Stockholm, Sweden: 2011, 10.1016/j.sbspro.2011.04.459.Search in Google Scholar
[7] Aderamo AJ, Atomode TI. Traffic congestion at road intersections in Ilorin, Nigeria. Mediterr J Soc Sci. 2012;3(2):201–13. 10.5901/mjss.2012.v3n2.201.Search in Google Scholar
[8] Bak R, Kiec M. Influence of midblock pedestrian crossings on urban street capacity. Transp Res Rec. 2012;2316(1):76–83. 10.3141/2316-09.Search in Google Scholar
[9] Yusuf IT. The factors for free flow speed on urban arterials – empirical evidences from Nigeria. J Am Sci. 2010;6(12):1487–97.Search in Google Scholar
[10] Kadali BR, Chiranjeevi T, Rajesh R. Effect of pedestrians un-signalized mid-block crossing on vehicular speed. Int J Traffic Transp Eng. 2015;5(2):170–83. 10.3141/2581-17.Search in Google Scholar
[11] Kuttan MO, Babu S, Asaithambi G. Impact of pedestrian road crossing on capacity and level of service of urban undivided roads in Indian traffic conditions. 96th Annual Meeting of Transportation Research Board. Washington DC, US: 2017.Search in Google Scholar
[12] Pu Z, Li Z, Wang Y, Ye M, Fan WD. Evaluating the interference of bicycle traffic on vehicle operation on urban streets with bike lanes. J Adv Transp. 2017;2017:6973089. 10.1155/2017/6973089.Search in Google Scholar
[13] Witt A. Determination of the number of required charging stations on a German motorway based on real traffic data and discrete event-based simulation. Sci J Transp Logist. 2023;14(1):1–11. 10.2478/logi-2023-0011.Search in Google Scholar
[14] Jereb B, Stopka O, Skrúcaný T. Methodology for estimating the effect of traffic flow management on fuel consumption and CO2 production: A case study of Celje. Transp Res Procedia. 2021;55:50–7. 10.1016/j.trpro.2021.05.489.Search in Google Scholar
[15] Bhattarai A, Bastola PN. Effects of roadside friction on traffic flow parameters and level of service of urban arterials: A case study of Pokhara Metropolitan City. Case Stud Transp Policy. 2022;10(1):204–12. 10.1016/j.cstp.2022.01.009.Search in Google Scholar
[16] Meegoda JN, Wen H. Different impact of side friction condition on traffic flow along Yosodipuro Street Surakarta. AIP Conf. Proc. 2019;2117(1):050009. 10.1063/1.5065531.Search in Google Scholar
[17] Leong LV, Wan Ibrahim WH, Mohd AF. Effect of motorcycles travel behaviour on saturation flow rates at signalized intersections in Malaysia. Proc – Soc Behav Sci. 2008;16:382–7, https://eprints.usm.my/13524/.Search in Google Scholar
[18] Pal S, Roy SK. Impact of roadside friction on travel speed and LOS of rural highways in India. Transp Develop Econ. 2016;2(9):0012–9. 10.1007/s40890-016-0012-9.Search in Google Scholar
[19] Pal S, Roy SK. Impact of side friction on performance of rural highways in India. J Infrastruct Syst. 2019;25(2):04019006, https://www.researchgate.net/publication/330971492_Impact_of_Side_Friction_on_Performance_of_Rural_Highways_in_India.10.1061/(ASCE)IS.1943-555X.0000476Search in Google Scholar
[20] Rao AM, Velmurugan S, Lakshmi KMVN. Evaluation of influence of roadside frictions on the capacity of roads in Delhi, India. Transp Res Proc. 2017;25:4771–82. 10.1016/j.trpro.2017.05.489.Search in Google Scholar
[21] Salini S, Ashalatha R. Analysis of traffic characteristics of urban roads under the influence of roadside frictions. Case Stud Transp Policy. 2020;8(1):94–100. 10.1016/j.cstp.2020.01.004.Search in Google Scholar
[22] Srivastava K, Kumar A. The impact of roadside friction on the traffic flow of arterial roads in Varanasi. Eng Technol Appl Sci Res. 2023;13(4):11157–65. 10.48084/etasr.5897.Search in Google Scholar
[23] Srivastava K, Kumar A. Critical analysis of roadside friction on an urban arterial road. Eng Technol Appl Sci Res. 2023;13(2):10261–9. 10.48084/etasr.5603.Search in Google Scholar
[24] Bhagat A, Kumar A. A framework for sustainable urban street design. Eng, Technol Appl Sci Res. 2024;14(5):16511–8. 10.48084/etasr.8178.Search in Google Scholar
[25] Ünsal O. A GIS-based tool to assess the impact of unregulated parking on urban road capacity, Master’s thesis. Middle East Technical University, Ankara, Turkey, 2024, https://open.metu.edu.tr/handle/11511/109802.Search in Google Scholar
[26] Permana AA, Sari YA. Analysis of the impact of side obstacles on road performance: Case study of the Kadipaten traditional market of Majalengka. Civ Eng Archit J. 2024;2(1):604–11. 10.48084/etasr.5897.Search in Google Scholar
[27] Attari A, Abdi Kordani A, Hosseinian SM. Evaluating the effect of braking of run-off-the-road vehicles over downgrade foreslopes on side friction factor using vehicle dynamics modeling. Innov Infrastruct Solut. 2024;9(1):10. 10.1007/s41062-023-01307-2.Search in Google Scholar
[28] Al-Jameel HAE (2011). Developing a simulation model to evaluate the capacity of weaving sections (Doctoral dissertation, University of Salford). https://www.researchgate.net/publication/321972705_DEVELOPING_A_SIMULATION_MODEL_TO_EVALUATE_THE_CAPACITY_OF_WEAVING_SECTIONS.Search in Google Scholar
[29] Mansour AI, Al-Jameel HAE. Side-friction impacts on urban streets performance in divided and undivided streets. Pollack Periodica. 2023;18(3):147–53. 10.1556/606.2023.00627.Search in Google Scholar
[30] Islam MM, Al Razib MS, Hasan MM, Ali MS, Monir MO, Hasan M. Cause of reduction of effective roadway width due to side friction in Dhaka City. Am J Traffic Transp Eng. 2018;3(1):6–17. 10.11648/j.ajtte.20180301.12.Search in Google Scholar
[31] Gulivindala P, Mehar A. Analysis of side friction on urban arterials. Transp Telecommun. 2018;19(1):21–30. 10.2478/ttj-2018-0003.Search in Google Scholar
© 2025 the author(s), published by De Gruyter
This work is licensed under the Creative Commons Attribution 4.0 International License.
Articles in the same Issue
- Research Articles
- Modification of polymers to synthesize thermo-salt-resistant stabilizers of drilling fluids
- Study of the electronic stopping power of proton in different materials according to the Bohr and Bethe theories
- AI-driven UAV system for autonomous vehicle tracking and license plate recognition
- Enhancement of the output power of a small horizontal axis wind turbine based on the optimization approach
- Design of a vertically stacked double Luneburg lens-based beam-scanning antenna at 60 GHz
- Synergistic effect of nano-silica, steel slag, and waste glass on the microstructure, electrical resistivity, and strength of ultra-high-performance concrete
- Expert evaluation of attachments (caps) for orthopaedic equipment dedicated to pedestrian road users
- Performance and rheological characteristics of hot mix asphalt modified with melamine nanopowder polymer
- Second-order design of GNSS networks with different constraints using particle swarm optimization and genetic algorithms
- Impact of including a slab effect into a 2D RC frame on the seismic fragility assessment: A comparative study
- Analytical and numerical analysis of heat transfer from radial extended surface
- Comprehensive investigation of corrosion resistance of magnesium–titanium, aluminum, and aluminum–vanadium alloys in dilute electrolytes under zero-applied potential conditions
- Performance analysis of a novel design of an engine piston for a single cylinder
- Modeling performance of different sustainable self-compacting concrete pavement types utilizing various sample geometries
- The behavior of minors and road safety – case study of Poland
- The role of universities in efforts to increase the added value of recycled bucket tooth products through product design methods
- Adopting activated carbons on the PET depolymerization for purifying r-TPA
- Urban transportation challenges: Analysis and the mitigation strategies for road accidents, noise pollution and environmental impacts
- Enhancing the wear resistance and coefficient of friction of composite marine journal bearings utilizing nano-WC particles
- Sustainable bio-nanocomposite from lignocellulose nanofibers and HDPE for knee biomechanics: A tribological and mechanical properties study
- Effects of staggered transverse zigzag baffles and Al2O3–Cu hybrid nanofluid flow in a channel on thermofluid flow characteristics
- Mathematical modelling of Darcy–Forchheimer MHD Williamson nanofluid flow above a stretching/shrinking surface with slip conditions
- Energy efficiency and length modification of stilling basins with variable Baffle and chute block designs: A case study of the Fewa hydroelectric project
- Renewable-integrated power conversion architecture for urban heavy rail systems using bidirectional VSC and MPPT-controlled PV arrays as an auxiliary power source
- Exploitation of landfill gas vs refuse-derived fuel with landfill gas for electrical power generation in Basrah City/South of Iraq
- Two-phase numerical simulations of motile microorganisms in a 3D non-Newtonian nanofluid flow induced by chemical processes
- Sustainable cocoon waste epoxy composite solutions: Novel approach based on the deformation model using finite element analysis to determine Poisson’s ratio
- Impact and abrasion behavior of roller compacted concrete reinforced with different types of fibers
- Architectural design and its impact on daylighting in Gayo highland traditional mosques
- Structural and functional enhancement of Ni–Ti–Cu shape memory alloys via combined powder metallurgy techniques
- Design of an operational matrix method based on Haar wavelets and evolutionary algorithm for time-fractional advection–diffusion equations
- Design and optimization of a modified straight-tapered Vivaldi antenna using ANN for GPR system
- Analysis of operations of the antiresonance vibration mill of a circular trajectory of chamber vibrations
- Functions of changes in the mechanical properties of reinforcing steel under corrosive conditions
- Enhanced PAPR reduction in NOMA systems using modified SLM and PTS techniques for power-efficient 5G and beyond networks
- Hybrid mechanics-informed machine learning models for predicting mechanical failure in graphene sponge: a low-data strategy for mechanical engineering applications
- Design of shafts of a two-piece chain conveyor as a part of a modification of a mobile working machine
- Review Articles
- A modified adhesion evaluation method between asphalt and aggregate based on a pull off test and image processing
- Architectural practice process and artificial intelligence – an evolving practice
- 10.1515/eng-2025-0148
- Special Issue: 51st KKBN - Part II
- The influence of storing mineral wool on its thermal conductivity in an open space
- Use of nondestructive test methods to determine the thickness and compressive strength of unilaterally accessible concrete components of building
- Use of modeling, BIM technology, and virtual reality in nondestructive testing and inventory, using the example of the Trzonolinowiec
- Tunable terahertz metasurface based on a modified Jerusalem cross for thin dielectric film evaluation
- Integration of SEM and acoustic emission methods in non-destructive evaluation of fiber–cement boards exposed to high temperatures
- Non-destructive method of characterizing nitrided layers in the 42CrMo4 steel using the amplitude-frequency technique of eddy currents
- Evaluation of braze welded joints using the ultrasonic method
- Analysis of the potential use of the passive magnetic method for detecting defects in welded joints made of X2CrNiMo17-12-2 steel
- Analysis of the possibility of applying a residual magnetic field for lack of fusion detection in welded joints of S235JR steel
- Eddy current methodology in the non-direct measurement of martensite during plastic deformation of SS316L
- Methodology for diagnosing hydraulic oil in production machines with the additional use of microfiltration
- Special Issue: IETAS 2024 - Part II
- Enhancing communication with elderly and stroke patients based on sign-gesture translation via audio-visual avatars
- Optimizing wireless charging for electric vehicles via a novel coil design and artificial intelligence techniques
- Evaluation of moisture damage for warm mix asphalt (WMA) containing reclaimed asphalt pavement (RAP)
- Comparative CFD case study on forced convection: Analysis of constant vs variable air properties in channel flow
- Evaluating sustainable indicators for urban street network: Al-Najaf network as a case study
- Node failure in self-organized sensor networks
- Comprehensive assessment of side friction impacts on urban traffic flow: A case study of Hilla City, Iraq
- Design a system to transfer alternating electric current using six channels of laser as an embedding and transmitting source
- Security and surveillance application in 3D modeling of a smart city: Kirkuk city as a case study
- Modified biochar derived from sewage sludge for purification of lead-contaminated water
- The future of space colonisation: Architectural considerations
- Design of a Tri-band Reconfigurable Antenna Using Metamaterials for IoT Applications
- Special Issue: AESMT-7 - Part II
- Experimental study on behavior of hybrid columns by using SIFCON under eccentric load
- Special Issue: ICESTA-2024 and ICCEEAS-2024
- A selective recovery of zinc and manganese from the spent primary battery black mass as zinc hydroxide and manganese carbonate
- Special Issue: REMO 2025 and BUDIN 2025
- Predictive modeling coupled with wireless sensor networks for sustainable marine ecosystem management using real-time remote monitoring of water quality
- Management strategies for refurbishment projects: A case study of an industrial heritage building
- Structural evaluation of historical masonry walls utilizing non-destructive techniques – Comprehensive analysis