Exploitation of landfill gas vs refuse-derived fuel with landfill gas for electrical power generation in Basrah City/South of Iraq
-
Kifah M. Khudair
 ,
Ahmed S. Khudier
,
Ahmed S. Khudier

Abstract
Municipal solid waste (MSW) decomposition in a landfill produces what is called “landfill gas” (LFG). LFG contains methane besides other gases. It can be utilized for energy generation and, thus, reduce its emission into the atmosphere and its adverse impact on global climate. Exploitation of LFG is critical for Basrah city, Iraq (one of the hottest spots in the world) to reduce its demand for non-renewable fuels. This study aims to compare the electrical power generation potential from MSW in Basrah city adopting two scenarios: (1) LFG and (2) refuse-derived fuel (RDF) with LFG. In the first scenario, all MSW components are dumped into the landfill and the LFG is converted to energy. However, in the second scenario, only the organic wastes are dumped into the landfill and the RDF components are incinerated. Thus, energy will be produced from both the LFG and RDF. For both scenarios, LandGEM software was used for quantifying the LFG. The study results showed that the annual rates of electrical energy generation by the first and second scenarios for the period between 2022 and 2035 varied in the ranges of 4.3–9.1 MW and 26.4–36.1 MW, respectively. Therefore, the application of RDF with LFG is the better choice for electrical power generation from MSW in Basrah city.
1 Introduction
Globally, the annual quantity of generated municipal solid waste (MSW) is estimated to be 3.4 billion tons by the year 2050 [1]. This huge quantity of MSW needs to be managed properly; otherwise, its impact on the ecosystem can lead to serious problems. Improper MSW management can cause climate change and ocean pollution worldwide. Regionally, it can lead to water, air, and soil pollution and impact public health. Thus, the management of MSW is currently regarded as a significant environmental challenge, in addition to being an economic concern [2]. The difficulties associated with MSW management can be attributed to its highly diverse composition, the proximity of the waste generated to the residents, and the significant public attention it receives [3].
The generation rates of MSW have increased in developing countries due to the increase in population growth rates and urban expansion, in addition to the rise in living standards [4]. The disposal of MSW in these countries, such as Iraq, still forms an environmental problem since it is mainly done by dumping the waste into open or closed landfills without making beneficial use of this resource. This disposal method is continuously requiring more surface area for constructing the landfill sites and the adverse environmental impacts of these sites began to creep near the residential and industrial areas such as the case present in Basrah Governorate/southern Iraq.
A fraction of MSW is biodegradable organic wastes which include animal and vegetable wastes resulting from various activities like storage, preparation and sale, cooking, and serving. Organic wastes have long been considered useless materials and a source of environmental pollution. But, this view began to change toward a positive trend in recent years, after the success of converting it into a clean source of energy and producing fertilizers for soil fertilization, with expectations that in the future will form an important energy mine and an alternative source of natural raw materials in many economic sectors in light of depletion of natural resources.
A sustainable MSW system must include a complementary procedure to reduce the quantity of generated waste by following economic methods without harming the environment. This procedure may include the separation of waste at the source and/or disposal site for the sake of material recycling and energy recovery. The production of energy from MSW is one of the significant steps in achieving sustainable MSW management. It can be accomplished using different technologies such as [5] biological conversion technologies by which biogas is produced and then used for generating electricity or thermal energy and thermal conversion techniques such as mass burning incineration and gasification. Mass burning incineration of MSW is a widely used technology for the production of electricity and steam. Gasification converts organic materials in MSW into other forms of energy without actually burning them. In addition, the recovery of energy from MSW has many economic benefits as indicated intensively by U.S. EPA [6].
The anaerobic decomposition of organic matter in a sanitary landfill produces a gas usually called “landfill gas” (LFG) [7]. This gas contains methane at a percentage of 40–60%, besides carbon dioxide and other minor gases [8]. The mechanism of methane gas production by the decomposition of organic matter was described by Mixtli et al. [9]. Methane gas is a viable source for energy production, and at the same time it may lead to fires and explosions at landfill sites and subsequently may lead to loss of nearby lives and properties. Its use as a source of energy will reduce its emission into the atmosphere and thus its impact on the greenhouse phenomenon [10]. Besides that, although Iraq is the second-largest oil producer in OPEC and has the fifth largest oil reserves, its refining infrastructure is currently the bottleneck and needs to be upgraded to process much more crude oil. Thus, the investment of LFG as a resource for energy recovery will reduce both fossil fuel consumption and the bad environmental impact of releasing methane gas from landfill sites.
LFG can be produced by dumping unsorted MSW at the landfill, or by dumping only the organic components at the landfill, and the remaining inorganic components are extracted to be recycled (such as metals, glass, and aluminum) or used for the production of refuse-derived fuel (RDF). RDF includes MSW components capable of producing steady fuel that is ready for burning in power generation plants or fuel for thermoelectric plants [11]. Typically, the extracted amount of RDF can be 240 kg/ton of MSW [12]. The RDF consists of components of MSW that have high calorific fractions such as plastics, papers, wood, corrugates, and textiles. The use of RDF as fuel is dependent on the calorific value, ash content, water content, sulfur content, and chlorine content [13].
Basrah city is characterized as one of the hottest spots in the world. This meteorological status of the city increases its rate of electricity power demand. To the present day, non-renewable energy resources such as crude oil, natural gas, and light oil are used for operating all the electrical power generation plants in Basrah city. Thus, as the need for power increases, more non-renewable fuels will be exerted, and the financial and environmental consequences of crude oil extraction and processing will increase. The consumption of non-renewable fuels in Basrah city can be reduced by exploiting renewable energy resources such as LFG and RDF.
Concerning the management of MSW in Basrah city, two previous studies were conducted. Abbas et al. [14] investigated the composition and generation rate of MSW in Basrah city during the years 2008–2012. They pointed out that the per capita rate of MSW generation was 0.62 kg/day, and the percentages of food, plastic, and paper in Basrah MSW were 54.8, 25.2, and 7.0%, respectively, and recommended the use of incineration and recycling for reducing the quantities of dumped waste at the landfill. Abbas et al. [15] studied the potential of generating energy from MSW in the Basrah governorate using mass incineration (incineration of all MSW components) based on MSW characteristics during the years 2010–2014. They estimated the per capita rate of MSW generation to be 1.4 kg/day, and the percentage of food waste was 60.5%. They found that the electricity produced by mass incineration of waste may reach 270 MW in the year 2036.
Previous studies did not consider the exploitation of LFG (renewable natural gas) and/or RDF for electrical power generation in Basrah city. To fill this gap, this study aims to investigate the potential of electrical power generation from MSW collected in Basrah city by adopting two scenarios: (1) LFG and (2) RDF with LFG. In the first scenario, all the MSW components were proposed to be dumped at the landfill, and the resultant LFG (methane) will be used for electrical power generation. However, in the second scenario, only the highly decomposed MSW components (organic wastes) were proposed to be dumped at the landfill, and the RDF components were incinerated. Thus, energy will be produced from both LFG and RDF.
2 Methodology
2.1 Work program
The work program of this study was prepared by adopting the procedure illustrated by the block diagram shown in Figure 1. In the first step, the collected data about Basrah city included MSW management scheme, records of annual MSW production and city populations, and climatic conditions.

Procedure of the study work program.
2.2 MSW management in Basrah city
Basrah city is the largest city of Basrah governorate/southern Iraq (Figure 2) with respect to population. Basrah governorate is located within longitudes of (46°60′–48°60′)E and latitudes of (29°13′–31°29′)N. It is bordered by three Iraqi governorates (Maysan, DhiQar, and Al-Muthanna), Iran, Kuwait, and the Arabian Gulf. The climate of Basrah city is arid and hot. Concerning the subject of this study, rainfall is the most important meteorological factor that affects the production of LFG. Generally, the rainy season in Basrah city extends over 8 months (Oct–May). Al-Muhyi and Aleedani [16] studied the temporal variation of rainfall quantity in Basrah city for 50 years (1970–2019). They showed that 1 of 50 annual averaged rainfall values has exceeded 250 mm, which was in the year 1986. According to the data recorded at the Hi Al-Hussian Meteorological Station in Basrah city and obtained from the Iraqi Meteorological Organization and Seismology (IMOS), the monthly average relative humidity varies from 59% (in Jul) to 76% (in Nov–Jan) and averages 69% yearly. The monthly averaged temperature in Basrah city varies between 8˚C (in Jan) and 46˚C (in Aug). The prevailing wind direction in Basrah city is northeast during which the average wind speed is 2.7 m/s.

Profile of Basrah governorate: (modified following https://humanitarianatlas.org/iraq/atlasmaps/basraha.pdf).
MSW generated in Basrah city is managed by the Basrah Municipality Directorate. The management plan is based on dividing the city into six zones. Each zone is divided into several divisions, and each division is subdivided into partitions for the intent of MSW collection [14]. The waste is collected from the trash containers by vehicles of mobile mechanical waste compactor type. The vehicles transport the collected waste to a transfer station at which a simple waste sorting process is performed by poor people who collect plastic, ferrous, and aluminum wastes and seal them in a local recycling factory. Then, the waste is transported to the final disposal site in a sanitary landfill using dump tracks.
The sanitary landfill for Basrah city is located at Chwabedian area in AL-Berjesia zone/Zubair city (Figure 3). Its center is located at the latitude and longitude of 30°23.5′N and 47°31.25′E, respectively [17]. The landfill surface area is (400 × 600) m2, and its depth varied over the range 12–14 m [18]. The landfill operation was commenced in 2010, and it is expected to end in 2035, considering 80% of its area will be occupied by waste and the remaining 20% be left for services (roads, garages, etc.) [8].

Location of Basrah landfill.
A complete description of MSW management in Basrah was presented by the Japan International Cooperation Agency/Yachiyo Engineering Co., Ltd. in a field study funded by the Iraqi Ministry of Construction and Housing and Municipalities and Public Works in 2022 [18]. In this study, MSW management in Basrah governorate was described, intensively, including the details of Basrah landfill facilities. These facilities include the following: (1) storm water drainage system, (2) leachate collection system completed with a storage tank, (3) weighbridge, (4) waste disposal platform, (4) tire wash facility, and (5) control office, fence, and gate. The landfill site does not incorporate a gas collection system, and the waste cells are below the ground level. From the aforementioned description of the MSW management status in Basra city, it can be noticed that there is no beneficial use of this waste. Subsequently, the city lacks sustainable MSW management, and this issue highlights the necessity of this study for the decision-makers.
2.3 MSW sampling
For a specific city, the composition of MSW varies with place and time due to the variation of climatic conditions, income level, in-home management of food waste, and industrial production. Thus, the method of waste sample collection and the number of samples are very important in analyzing the composition of MSW. The composition of MSW generated in Basrah city was analyzed by taking waste samples from Hamdan transfer station (HTS) following the standard ASTM D5231-92 [19]. Adopting this standard, the recommended sample weight ranges from 90 to 120 kg. Therefore, a waste sample of 100 kg was collected. The composition of each sample was analyzed manually by adopting the following procedure:
A platform scale of 150 kg capacity and 0.02 kg accuracy has been put on a flat area in the HTS.
The scale was calibrated using a known weight of sand sample.
A trash vehicle was informed to unload its contents at a clean area in the HTS.
A pre-weighed plastic bag was put at the scale and filled randomly with MSW until the scale reading reached a value of 100 kg.
The weighted plastic bag contents were emptied on a clean plastic mat.
The waste sample was sorted, manually, considering the waste categories presented in Table 1.
Each waste category was put in a pre-weighed container and weighed.
Description of MSW categories
| Category | Description |
|---|---|
| Mixed paper | All papers (office, computer, magazines, glossy, waxed newspaper, and newsprint) |
| Corrugated | Corrugated (medium, box, carton, and cardboard) and brown paper bags |
| Wood | Lumber, wooden products, pallets, and furniture |
| Plastic | All plastics |
| Ferrous | All iron and steel fragments |
| Glass | All glass |
| Food waste | All food waste except bones |
| Nappies | All types of nappies |
| Aluminum | Aluminum (cans and foil) |
| Garden waste | Plant residues |
| Textile | Blankets, clothes, wool, and synthetic textiles |
| Others | Anything which does not fit into the above categories such as sand, ceramic, ash, dirt, etc. |
To analyze the waste composition, the necessary number of waste samples was determined based on sorting 14 primary collected waste samples. These samples were sorted into 12 categories listed in Table 1. The number of final collected waste samples (n) was determined as follows [19]:
where
2.4 Determination of MSW composition and generation rates
After the manual sorting of waste samples, the wet weight of each waste category was taken, then a subsample was taken from each category waste and put into a plastic bag. The subsamples of all the waste categories were transported to the laboratory within a time duration not exceeding 4 h for analyzing both their wet and dry mass values. Each of these subsamples was weighed using an analytical balance and then dried in an oven at a temperature of 105°C for a duration of 24 h. Then, the subsample was cooled to room temperature, and the dried weight was measured for the intent of moisture content determination.
The annual rate of MSW generation in Basrah city (ton/capita/year) was estimated using recorded populations and annual quantities of MSW for the period 2014–2019. Population records were obtained from the Iraqi Ministry of Planning/Central Statistical Organization. The future population was predicted by best fitting the population records for the years 2010–2019 (Figure 4), and the developed equation is as follows:
where n y is the years’ number measured from the base year 2010. Using Equation (2), the population data were extrapolated until the year 2035, which is the proposed year of closing the existing landfill.

Population records of Basrah city during the period 2010–2019.
2.5 Estimation of methane gas emission
In this study, LandGEM (Landfill Gas Emissions Model) software, version 3.02, was used to estimate methane gas emission from the landfill of Basrah city. LandGEM was developed by USEPA in 2005, assuming that the biodegradable waste is decomposed following a first-order equation. It can be applied to estimate the emission rates of different gases from landfills including methane and carbon dioxide [21]. In this study, LandGEM software was chosen because it is freely available and presents a simple methodology for predicting the LFG emissions. Besides, it includes default parameters based on field data collected from existing landfills in the USA and depends on International landfill regulations [22]. LandGEM was developed using Excel software. It includes nine Excel spreadsheets. The function of each spreadsheet is illustrated in Table 2.
Details of LandGEM Excel spreadsheets
| Sheet no. | Function |
|---|---|
| 1 | Model description and application |
| 2 | Input of data related to the landfill life time, model parameters, simulated gases, and MSW dumping rates |
| 3 | Adjustment of the default gas characteristics and addition of new gases |
| 4 | Review and print of input data |
| 5 | Estimation of methane emission |
| 6 | Presentation of yearly gas emission results for up to four gases in a tabulated form |
| 7 | Presentation of yearly gas emission results for up to four gases in a graphical form |
| 8 | Presentation of all the gases emission results in a specific year in a tabulated form |
| 9 | Presentation of the final report summarizing all the input and output data in a tabulated form |
Although the LandGEM model is based on waste specifications and climatic conditions for the areas of the USA, it can be applied to other areas around the world by implementing field data for determining the model parameters instead of the default ones [22,23]. In this model, both the production percentages of carbon dioxide and methane gases were assumed to be 50% of total gas emission [22]. The LandGEM model was used for estimating the gaseous emission in many previous studies [4,10,23,24,25,26,27]. By adopting this model, the annual generation rate of methane gas is estimated as follows [21]:
where Q meth is the annual generation rate of methane (m3/year); i and j are time increments of 1 year and 0.1 year, respectively; m is the time duration (year) from the start of waste dumped at the landfill and the considered year; k is the methane generation rate constant (1/year); L O is the capacity of methane generation potential (m3/Mg); M i is the mass of waste dumped in the ith year (Mg); and t ij is the age of the jth section of waste mass dumped in the ith year (decimal years).
2.5.1 Methane generation rate constant
Methane generation rate constant (k) represents the rate of methane gas production by anaerobic waste decomposition. Its value varies according to waste temperature and pH, moisture content, availability of nutrients for bacteria, and waste composition [28]. The typical values of k, as used by the U.S. EPA, were 0.02 and 0.07 for arid and wet sites, respectively [29]. The k dependency on moisture content is defined in terms of precipitation (average annual rainfall, P, in mm) using the following equation [30,31,32];
The k dependency on both waste composition and annual rainfall is shown in Table 3. In this study, methane generation rate constant (k) was calculated as the average value of the typical one obtained using equation (4), where the P-value was determined using meteorological data of rainfall in Basrah city for the period 2009–2021, which was equal to 92.2 mm, and that obtained using the data presented in Table 3.
k values versus annual rainfall and biodegradation rate [7]
| Annual rainfall (mm) | k values (year−1) at the indicated biodegradation rate | ||
|---|---|---|---|
| Slow | Moderate | Rapid | |
| <250 | 0.01 | 0.02 | 0.03 |
| (250–500) | 0.01 | 0.03 | 0.05 |
| (500–1,000) | 0.02 | 0.05 | 0.08 |
| <1,000 | 0.02 | 0.06 | 0.09 |
2.5.2 Methane generation potential capacity
The amount of methane generated per cubic meters per mega gram (Mg) of waste decomposed (which is called the capacity of methane generation potential, L O ) depends mainly on the composition and biodegradability of MSW. According to the Clean Air Act, the typical L O value for arid areas (such as Basrah city) is 170 m3/Mg [33]. However, if data regarding MSW composition are available, Table 4 can be used to determine L O. In addition, L O value was specified to be 132.8, 14.8, 62.6, 72, and 300.7 m3/Mg for paper, textile, wood, garden waste, and food waste, respectively [24,34]. In this study, L O was specified by taking the average value of typical values for arid areas (Table 4), and that obtained from the aforementioned references.
L O values for different waste categories [6]
| Waste category | L O (m3/mg) | |
|---|---|---|
| Value range | Average | |
| Slowly biodegradable waste | 5–25 | 15 |
| Moderately biodegradable waste | 140–200 | 170 |
| Highly biodegradable waste | 225–300 | 262.5 |
2.6 Estimation of electrical energy production potential
2.6.1 LFG scenario
The use of methane emission for electrical energy generation can reduce air pollution and concurrently minimize the fossil fuel demand to generate electricity. The annual production of electrical energy using methane gas as a fuel can be calculated as follows [5,25,26]:
where
2.6.2 RDF with LFG scenario
The annual electrical energy generated by RDF incineration can be calculated as follows [25]:
where EERDF is the annual electrical energy generated by RDF incineration (kW h), M RDF is the dry mass of RDF (ton/year), LHVRDF is the low heat value (or energy content) of RDF (kJ/kg), and η is the conversion efficiency which is equal to 0.18 for RDF incineration [4].
The LHV of each RDF component is presented in Table 5 in relation to the dry weight of that component. Thus, to find the LHVRDF value, the average dry weight of each RDF component is required.
LHV of different waste types [8]
| Waste types | Energy content (kJ/kg) |
|---|---|
| Mixed paper | 16,747 |
| Corrugated | 16,282 |
| Wood | 18,608 |
| Plastic | 32,564 |
| Textile | 17,445 |
The total electrical energy produced by RDF with LFG (EET) is obtained as follows:
3 Results and discussion
3.1 MSW composition
After categorization of each MSW sample, the recorded weight of each waste category is entered in an Excel worksheet. Then, for specific waste category, the mean and standard deviation of the weight values recorded for a number of waste samples were obtained and divided by 100, since the sample weight was 100 kg, as stated in Section 2.3. The mean and standard deviation for the weight fraction (weight of a specific waste category divided by 100) of all the 12 MSW categories are shown in Table 6. If wood is selected as the governing component, then s = 0.008 and
Standard deviations and mean values for MSW category weight fractions
| Category | Standard deviation | Mean |
|---|---|---|
| Food waste | 0.021 | 0.489 |
| Mixed paper | 0.007 | 0.076 |
| Corrugated | 0.005 | 0.074 |
| Wood | 0.008 | 0.029 |
| Plastic | 0.014 | 0.129 |
| Ferrous | 0.005 | 0.019 |
| Glass | 0.008 | 0.015 |
| Nappies | 0.009 | 0.077 |
| Aluminum | 0.004 | 0.011 |
| Garden waste | 0.003 | 0.005 |
| Textile | 0.006 | 0.065 |
| Others | 0.004 | 0.011 |
| Sum = 1.00 |
After the manual sorting of each of the 96 waste samples, MSW composition in Basrah city for 4 months (Nov and Dec in 2022 and Jan and Feb in 2023) is presented in Table 7, along with the average composition of the 4 months. From this table, it can be shown that the biodegradable organic components (food and garden waste) comprised about 50.52% of MSW, while the RDF components comprised 36.09% of the MSW.
Components of MSW in Basrah
| Category | Composition (%) | ||||
|---|---|---|---|---|---|
| Nov 2022 | Dec 2022 | Jan 2023 | Feb 2023 | Average | |
| Food waste | 48.88 | 48.64 | 51.25 | 50.86 | 49.91 |
| Mixed paper | 7.61 | 6.58 | 6.75 | 7.15 | 7.02 |
| Corrugated | 7.4 | 8.56 | 5.99 | 6.48 | 7.11 |
| Wood | 2.88 | 3.12 | 2.25 | 1.58 | 2.46 |
| Plastic | 12.94 | 13.58 | 13.88 | 14.25 | 13.66 |
| Ferrous | 1.92 | 1.25 | 0.95 | 1.25 | 1.34 |
| Glass | 1.47 | 1.45 | 0.88 | 1.56 | 1.34 |
| Nappies | 7.68 | 8.56 | 7.88 | 8.58 | 8.17 |
| Aluminum | 1.11 | 1.01 | 1.58 | 0.89 | 1.15 |
| Garden waste | 0.48 | 0.54 | 0.56 | 0.87 | 0.61 |
| Textile | 6.46 | 5.56 | 6.45 | 4.88 | 5.84 |
| Others | 1.17 | 1.15 | 1.58 | 1.65 | 1.39 |
3.2 Temporal variation of MSW composition
The temporal variation of daily MSW composition in Basrah city is shown in Figure 5 considering 13 daily samples during the period 15th–27th Nov 2022. The figure reveals some daily variations in waste composition. However, food waste is the main component of MSW in Basrah city and has the maximum percentage. It is followed, in sequence, by plastic (mainly empty bottled water), mixed paper, corrugated, textile, nappies, ferrous, aluminum, and garden waste. This sequence of MSW categories matches the findings of Bhat et al. [35], who showed that vegetable and food wastes form the major part of the MSW followed by plastic and other waste categories.

Daily variation of MSW composition.
Figure 6 shows the temporal variation of monthly averaged MSW composition. It can be shown from this figure that the variation in monthly averaged MSW composition is insignificant. This can be attributed to the meteorological condition during the study period, which was relatively cold months.

Temporal variation of monthly averaged MSW composition.
3.3 MSW generation rate
The records of annual MSW quantities produced in Basrah city were obtained from the Municipality Directorate of Basrah city. These records along with their corresponding population records during the period 2014–2019 were used to estimate the rate of MSW generation in Basrah city. The results of MSW generation rates are presented in Table 8. Based on these results, the average MSW generation rate was estimated to be 0.982 kg/capita/day (or 0.358 ton/capita/year). This generation rate was located within the recent MSW generation rate range in other Iraqi cities, 0.673–1.27 kg/capita/day, as presented in Table 9. However, it is less than that obtained for Basrah city during the years 2011–2014, which was varied over the range 1.05–1.97 kg/capita/day [15]. By using the average rate of MSW generation, the yearly production of MSW generation is estimated as follows:
where MSWt and P t are the MSW quantity (ton) and population of Basrah city in the year t, respectively.
MSW generation rates in Basrah city during the period 2014–2019
| Year | Population | MSW generation rate | ||
|---|---|---|---|---|
| (ton/year) | (ton/capita/year) | (kg/capita/day) | ||
| 2014 | 1,112,664 | 432,054 | 0.388 | 1.064 |
| 2015 | 1,140,830 | 436,640 | 0.383 | 1.049 |
| 2016 | 1,168,996 | 387,575 | 0.332 | 0.908 |
| 2017 | 1,197,162 | 415,784 | 0.347 | 0.952 |
| 2018 | 1,225,328 | 417,340 | 0.341 | 0.933 |
| 2019 | 1,253,494 | 451,077 | 0.360 | 0.986 |
| Average | 0.358 | 0.982 | ||
3.4 Low heat value of RDF
The results of average wet and dry weights of all MSW categories, including the RDF components, in a wet sample of 100 kg are presented in Table 10. The dry weight for each category was determined based on its moisture content and wet weight. By multiplying the wet percentage of each RDF component (as obtained from Table 10) by its LHV value (as obtained from Table 4), the unit energy content was calculated to be 2,296,952 kJ/100 kg of wet weight (Table 11). The moisture content of the RDF was 12.6%, then on a dry basis, the LHV of RDF was 26,281 kJ/kg.
Average wet and dry weights for MSW categories
| Category | Wet weight (kg) | Dry weight (kg) |
|---|---|---|
| Food waste | 49.91 | 13.98 |
| Mixed paper | 7.02 | 6.18 |
| Corrugated* | 7.67 | 6.29 |
| Wood | 2.46 | 1.77 |
| Plastic* | 14.38 | 13.52 |
| Ferrous | 1.34 | 1.31 |
| Glass | 1.34 | 1.31 |
| Aluminum | 1.15 | 1.12 |
| Garden waste | 0.61 | 0.57 |
| Textile | 5.84 | 4.91 |
| Others* | 1.43 | 0.79 |
*Nappy waste consists (by weight) of 83.8 % human waste, 6.86 % cellulose pulp, 8.87% plastic products, and 0.47% other waste [40]. In calculating the lower heat value (LHV), the human waste percentage (0.838 × 8.17 = 6.85%) is usually neglected [40]. Other fractions of nappy waste are added to their corresponding waste. Thus the wet weight values of corrugate, plastic, and the remaining were increased by 0.56 (0.686 × 8.17), 0.72 (0.887 × 8.17), and 0.04 (0.0047 × 8.170.04)%, respectively.
Calculation results of LHVRDF
| Category | Wet weight | Dry weight (kg) | LHV (kJ/kg) | Total LHV (kJ/kg) | |
|---|---|---|---|---|---|
| kg | (%) | ||||
| Mixed paper | 7.02 | 18.79 | 6.18 | 16,747 | 314,676 |
| Corrugated | 7.67 | 20.52 | 6.29 | 16,282 | 334,107 |
| Wood | 2.46 | 6.58 | 1.77 | 18,608 | 122,441 |
| Plastic | 14.38 | 38.48 | 13.52 | 32,564 | 1,253,063 |
| Textile | 5.84 | 15.63 | 4.91 | 17,445 | 272,665 |
| RDF (total) | 37.37 | 100 | 32.661 | 2,296,952 | |
3.5 Methane gas quantity
To estimate methane gas emissions from Basrah sanitary landfill using the LandGEM model, the annual MSW quantities must be specified as input data, along with the years of landfill open and close and the model parameters k and L O. The annual MSW quantities were obtained using equation (8), and the results are shown in Figure 7. The years of landfill open and close were specified to be 2010 and 2035, respectively. While the model parameters L O and k were specified as described below.
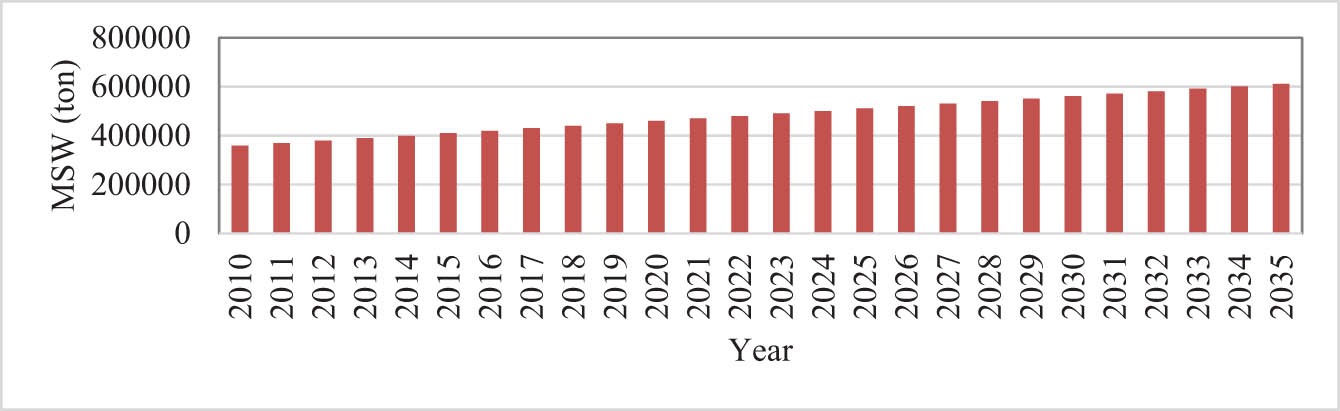
Recorded and estimated MSW generation rates in Basra city for the period 2010–2035.
According to the data of Table 3 and by using the MSW composition data presented in Table 7, the calculated k values for the first and second proposed scenarios (LFG and RDF with LFG) are shown in Tables 12 and 13, respectively. In the LFG scenario, all the MSW components are dumped at the landfill, and in the RDF with LFG scenario, the MSW is segregated at first into recycled wastes (metals, glass, and aluminum), RDF (plastics, papers, wood, corrugates, and textiles), and organic wastes (food and garden waste). Thus, the three values of k obtained for the LFG scenario were 0.02 year−1 (typical value), 0.013 year−1 (Equation (4)), and 0.024 year−1 (Table 12). While for RDF with LFG, the obtained k values were 0.02 year−1 (typical value), 0.013 year−1 (Equation (4)), and 0.03 year−1 (Table 13) year−1. LandGEM was run to estimate the methane production rate by LFG and RDF with LFG scenarios applying the averages of the three k values for the first and second scenarios, which are 0.019 and 0.021 year−1, respectively.
k calculation based on MSW decomposition: LFG scenario
| Waste | Percentage | Biodegradability | ||
|---|---|---|---|---|
| Slow | Moderate | Rapid | ||
| Organic and garden waste | 50.52 | — | — | 50.52 |
| Paper and corrugate | 14.13 | 7.11 | 7.02 | — |
| Textile | 5.84 | — | 5.84 | — |
| Wood | 2.46 | 2.46 | — | — |
| Nappies | 8.17 | 8.17 | — | — |
| Others (non-biodegradable) | 18.88 | — | — | — |
| Total | 100 | 17.74 | 12.86 | 50.52 |
| The total of each waste group multiplied by k value as obtained from Table 6 for an annual rainfall of 92.2 mm (<250 mm) | 0.1774 | 0.2572 | 1.5156 | |
| k value | Weighted average | 0.024 (year−1) | ||
k calculation based on MSW decomposition: RDF with LFG scenario
| Waste | Percent | Biodegradability | ||
|---|---|---|---|---|
| Slow | Moderate | Rapid | ||
| Organic and garden waste | 50.52 | — | — | 50.52 |
| Others (RDF and recycled waste) | 49.48 | — | — | — |
| Total | 100 | — | — | 50.52 |
| The total of each waste group multiplied by the k value as obtained from Table 6 for an annual rainfall of 92.2 mm (<250 mm) | — | — | 1.5156 | |
| k value | — | 0.03 (year−1) | ||
The average L O values given in Table 4 were used for L O calculation. In the LFG scenario, the percentages of slowly, moderate, and highly biodegradable wastes were 17.74, 12.86, and 50.52% (Table 7), thus the calculated L O value was 194 m3/mg. However, for the RDF and LFG scenario, there is only highly degradable waste at a percentage of 50.52%, thus the calculated L O value was 262.5m3/mg. In addition, the L O value was specified to be 132.8, 14.8, 62.6, 72, and 300.7 m3/mg for paper, textile, wood, garden waste, and food waste, respectively [22,32]. Based on these values and by applying the MSW composition for Basrah city (Table 6), L O was calculated to be 171.7 and 297.9 for LFG and RDF with LFG scenarios, respectively. By taking the average of the three L O values, LandGEM was run applying L O values of 178.6 and 243.5 m3/Mg for LFG and RDF with LFG, respectively.
The results of applying LandGEM software to Basrah landfill (quantities of CO2, CH4, and total LFG) considering the first and second scenarios (LFG and RDF with LFG) are shown in Figures 8 and 9, respectively. From these figures, it can be noticed that the peak amount of methane emissions during the first and second scenarios are 23056.5 and 17189.2 Mg/year, respectively. Both these peak values will be generated in the year 2036, and after that the LFG production will continue along with the decay of biodegradable waste at a decreasing rate for more than 110 years.

Annual LFG mass production for Basrah landfill: LFG scenario.

Annual LFG mass production for Basrah landfill: RDF with LFG scenario.
Calculation of the annual production of electrical energy using methane gas as a fuel requires the annual flowrate of methane gas. Figure 10 presents the obtained annual flowrates of methane gas applying both LFG and RDF with LFG scenarios. It depicts the peak annual methane flowrate during the first and second scenarios, which are 34,559,772 and 25,765,183 m3/year, respectively. Thus, the produced methane emission adopting the first scenario is greater than that of the second. This is because during the first scenario all the MSW components are dumped at the landfill, whereas during the second scenario only the organic wastes are dumped at the landfill.

Comparison of methane gas annual flowrates adopting LFG and RDF with LFG scenarios.
3.6 Sensitivity analysis of LandGEM results
The estimation of methane emissions from MSW landfills using LandGEM is based on two main parameters: methane generation rate constant (k) and methane generation potential capacity (L O). The sensitivity of model results to the variation of k and L O was investigated by fixing one of the parameters and varying the value of the other parameter to be within the value range obtained in Section 3.5. The sensitivity analysis results for k and L O are depicted in Figures 11 and 12, respectively. Figure 11 shows that during the landfill lifetime (2010–2035) the rate of methane gas emission increases with the increase of k. However, after certain years of landfill closure, k increase will reduce the gas emission. Figure 12 shows a positive correlation between the gas emission and L O, and this trend continues until complete anaerobic decomposition of the dumped biodegradable organics. Generally, the sensitivity of LandGEM results to k variation is more than its sensitivity to L O variation. Thus, great attention must be given when specifying the k value through inclusion of landfill site-specific characteristics.

Sensitivity of LandGEM results to the variation of methane generation rate constant (k in year−1) at an L O of 178.6 m3/Mg.

Sensitivity of LandGEM results to the variation of methane generation potential capacity (L O in Mg/m3) at a k of 0.02 year−1.
3.7 Electrical energy recovery potential
After determining the annual flowrates of methane gas production, the values of electrical energy produced by adopting the first and second scenarios were calculated using equations (5) and (7), respectively. Figure 12 shows a comparison of electrical energy generation potential by adopting LFG and RDF with LFG scenarios till the year 2035 (landfill close year). Starting from the present year (2022) till the year 2035, Figure 13 shows that the annual electrical power generated varied in the ranges 4.3–9.1 MW and 26.4–36.1 MW by adopting the first and second scenarios, respectively. Therefore, the application of RDF with LFG is the better choice for making beneficial use of MSW collected in Basrah landfill. Although the generated rate of electricity is relatively low, it can solve to some degree the problem of electricity shortage in Basrah city along with the reduction of pollution consequences as a result of gas emissions.

Comparison of electrical energy recovery potential using LFG and RDF with LFG.
It is important to mention here that each part of the world has its own characteristics (meteorological, waste management scheme, economics, social habits, etc.). To find whether another part of the world can take advantage of the study findings is a hard task. However, the concept of selecting the best way of converting waste to energy is important to be considered before deciding to follow a specific approach which in this study through the use of RDF with LFG.
3.8 Applicability of RDF with LFG scenario
Considering the quantity of generated energy, it is indicated in Section 3.7 that RDF with LFG waste-to-energy scenario is the better choice for generating electrical energy from the collected MSW in Basrah landfill. If this scenario is implemented successfully, it can reduce LFG emissions, provide new job opportunities, and decrease the need for fossil fuels like crude oil and natural gas. The applicability of this scenario depends on the composition and generation rate of MSW and landfill site proximity to the destination point of waste-to-energy conversion, where RDF preparation and combustion equipment are located. In addition to the economic feasibility of applying the RDF with LFG scenario, it also depends on the capital and operating costs of RDF and LFG processing, as well as the income gain by reducing fossil fuel consumption [41].
The composition and generation rate of MSW are dependent on the habits of MSW producers and their living standards, and these two factors cannot be controlled with a lack of awareness in developing countries such as Iraq. Thus, this study focused on the landfill proximity to the destination point of waste-to-energy conversion. It was assumed that the end user of the produced fuel would be one of the existing power generation stations within the area of the landfill site.
The area where Basrah landfill is located includes four power generation stations: Zubair Field, Shatt Al-Basra, North Rumila, and North Rumila power stations (Figure 14). The capacity, applied technology of power generation, used fuel type, and the location coordinated of each of these stations are presented in Table 14. From this table, it can be noticed that the generation capacity of these stations is much greater than the energy that could be produced by implementing the RDF with LFG scenario (36.1 MW/year).

Existing power stations near the Basrah landfill location with indication of access roads.
Characteristics of existing power generation stations nearby the Basrah landfill location
| Station | Capacity (MW) | Applied technology | Fuel type | Location coordinates | |
|---|---|---|---|---|---|
| Latitude | Longitude | ||||
| Zubair Field Power Station1 | 740 | Gas turbine technology | Natural gas | 30.405654° | 47.589106° |
| Shatt Al-Basra Power Station2 | 1,900 | Combined cycle and gas turbine technologies | Natural gas and crude oil | 30.477545° | 47.734033° |
| North Rumila Power Station3 | 1,606 | Gas turbine technology | Natural gas | 30.554475° | 47.387955° |
| New Rumila Power Station4 | 2,670 | Combined cycle, gas turbine, and steam turbine technologies | Natural gas | 30.548806° | 47.406037° |
The access distance from the landfill location to each of the existing power stations is presented in Table 15. This table shows that the nearest power generation station to the landfill location is at a distance of 9.6 km. The cost of RDF material and LFG transportation to this station cannot balance the benefits gained from implementing the RDF with scenario. Thus, it is not feasible from economical and practical points of view to use the generated renewable fuel as a complementary source of fuel for any of the existing power stations.
Access distances between the Basrah landfill and nearby power stations
| Station | Access distance to the landfill site (km) |
|---|---|
| Zubair Field Power Station | 9.6 |
| Shatt Al-Basra Power Station | 29.3 |
| North Rumila Power Station | 27.5 |
| New Rumila Power Station | 26.0 |
Based on the above results and to make best use of the produced energy and since the landfill site needs electrical energy for its management, it is recommended to install the needed equipment for sorting, shredding, combusting the MSW, and gas filtering at the site of Basrah landfill.
4 Conclusions
In this study, two scenarios were compared for converting waste to energy in Basrah city: LFG and RDF with LFG. A comparison was made considering many factors such as MSW composition and generation rate, meteorological conditions, and landfill lifetime. The study results revealed that the peak amount of methane emissions during the first and second scenarios is 23056.5 and 17189.2 Mg/year (34,559,772 and 25,765,183 m3/year), respectively. They also showed that the annual rates of electrical energy generation by adopting the LFG scenario for the period 2022–2035 varied in the range 4.3–9.1 MW. However, the annual rates of electrical energy generation by adopting RDF with LFG scenario for the same period varied in the range 26.4–36.1 MW. Thus, the dumping of organic wastes only at the landfill and incineration of RDF is a better choice than dumping all the MSW at the landfill for electrical energy generation using the MSW of Basrah city. However, the applicability of this scenario is restricted to generating the energy for managing the site of Basrah landfill.
To make use of the study findings, it is important that all the stakeholders, including the community, industry, and government, must participate in putting together a comprehensive plan for converting waste to energy and reducing the consumption of non-renewable energy resources. Their responsibility will be in selecting the locations of power generation stations to be near the landfill site and the importance of upgrading Basrah landfill by constructing a gas collection system to enable the conversion of LFG to energy feasible. Finally, it is important to conduct an economic feasibility analysis of the suggested waste-to-energy conversion system, considering its total cost and the financial and environmental conservation gain.
The best scheme for electrical energy generation (RDF with LFG) can be implemented in other cities around the world if the generated MSW in these cities has a composition similar to that of Basrah city and can be segregated into organic waste, recycled waste, and RDF. Additionally, the landfill used for disposing of organic waste must be equipped with an efficient biogas collection system.
-
Funding information: The authors state no funding involved.
-
Author contributions: All authors are responsible for the entire content of this manuscript and agreed its submission to the journal, reviewed all the results and approved the final version of the manuscript. Kifah M. Khudair and Ahmed S. Khudier have performed the field work and data collection and analysis, in addition to writing and revising the manuscript. Mohammed H. Al-Tofan have participated in gathering the extra field data required by the reviewers, in addition in validating the final output of the manuscript.
-
Conflict of interest: The authors state no conflict of interest.
-
Data availability statement: The data are available upon reasonable request.
References
[1] Kaza S, Yao L, Bhada-Tata P, Van Woerden F. What a waste 2.0. A global snapshot of solid waste management to 2050. Washington, D.C.: World Bank Group, Urban Development Series; 2018.10.1596/978-1-4648-1329-0Suche in Google Scholar
[2] Salama Y, Chennaoui M. Solid waste management challenges and solutions: The case of the city of Khouribga (Morocco). J Civ Eng Environ Sci. 2024;10(1):11–20. 10.17352/2455-488X.000078.Suche in Google Scholar
[3] Santos SM, Nobre C, Brito P, Gonçalves M. Brief overview of refuse-derived fuel production and energetic valorization: Applied technology and main challenges. Sustainability. 2023;15:10342. 10.3390/su151310342.Suche in Google Scholar
[4] Ouda OKM, Raza SA, Al-Waked R, Jawad F, Al-Asad JF, Nizami A-S. Waste-to-energy potential in the Western Province of Saudi Arabia. J King Saud Univ– Eng Sci. 2017;29:212–20. 10.1016/j.jksues.2015.02.002.Suche in Google Scholar
[5] Alzate S, Restrepo-Cuestas B, Jaramillo-Duque A. Municipal solid waste as a source of electric power generation in Colombia: A techno-economic evaluation under different scenarios. J Resour. 2019;8(51):1–16. 10.3390/resources8010051.Suche in Google Scholar
[6] U.S. Environmental Protection Agency. LFG energy project development handbook. Landfill methane outreach program. Unites States; 2024. https://www.epa.gov/system/files/documents/2024-01/pdh_full.pdf.Suche in Google Scholar
[7] Rezaee R, Nasseri S, Mahvi AH, Jafari A, Mazloomi S, Gavami A, et al. Estimation of gas emission released from a municipal solid waste landfill site through a modeling approach: A case study (Sanandaj City, Iran). J Adv Environ Health Res. 2014;2(1):1–9.Suche in Google Scholar
[8] Hayat S, Sheikh SH. Municipal solid waste: Engineering principles and management. 2nd edn. Pakistan: The Urban Unit Publ; 2016.Suche in Google Scholar
[9] Mixtli JTS, Juan GCM, Lourdes ES, Daniel MF, Leonardo RS, María EGC, et al. Methane, a renewable biofuel: from organic waste to bioenergy. Biofuels. 2021;13(7):907–17. 10.1080/17597269.2021.2016105.Suche in Google Scholar
[10] Santosa IFS, Gonçalvesb ATT, Borgesc PB, Barrosd RM, Limae RS. Combined use of biogas from sanitary landfill and wastewater treatment plants for distributed energy generation in Brazil. Resour Conserv Recycl. 2018;136:376–88.10.1016/j.resconrec.2018.05.011Suche in Google Scholar
[11] Themelis NJ, Kim YH, Brady MH. Energy recovery from New York City solid wastes. ISWA J: Waste Manag Res. 2002;20:223–33.10.1177/0734242X0202000303Suche in Google Scholar PubMed
[12] Shapoori M, Moghimi OH. Refuse derived fuel (RDF) production from municipal wastes (case study: Babol city). Environ Energy Econ Res. 2018;2(2):137–44.Suche in Google Scholar
[13] Central Public Health and Environmental Engineering Organization (CPHEEO). Municipal solid waste management manual. India: Ministry of Urban Development, Government of India; 2016.Suche in Google Scholar
[14] Abbas AA, Al-Rekabi WS, Yousif YT. Integrated solid waste management for urban area in Basrah City. J Babylon Univ/Eng Sci. 2016;24(24):666–75.Suche in Google Scholar
[15] Abbas AA, Al-Rekabi WS, Hamdan AN. Prediction of potential electrical energy generation from MSW of Basrah government. 5th International Conference on Waste Management, Ecology and Biological Sciences (WMEBS-2017), Istanbul (Turkey). 2017.Suche in Google Scholar
[16] Al-Muhyi AHA, Aleedani YFKh. Impacts of global climate change on temperature and precipitation in Basra City, Iraq. Basrah J Sci. 2022;40(1):215–30. 10.29072/basjs.20220113.Suche in Google Scholar
[17] Ramdhan WA, Thamir MS, Hamza AF, Sultan AA, Katea AG. A selection study for sanitary landfill site at Basra City, South of Iraq. J Life Sci. 2016;10:198–202.10.17265/1934-7391/2016.04.005Suche in Google Scholar
[18] Japan International Cooperation Agency/Yachiyo Engineering Co., Ltd. Data collection study on solid waste management in Iraq. Technical report. Iraq: Ministry of Construction and Housing and Municipalities and Public Works; 2022. https://openjicareport.jica.go.jp/pdf/12367256.pdf.Suche in Google Scholar
[19] ASTM International. Standard test method for determination of the composition of unprocessed municipal solid waste. USA: ASTM D5231-92; 2015.Suche in Google Scholar
[20] DeCoursey WJ. Statistics and probability for engineering applications with Microsoft EXCEL. USA: Elsevier Science; 2003.10.1016/B978-075067618-2/50004-4Suche in Google Scholar
[21] Alexander A, Burklin C, Singleton A. Landfill gas emissions model (LandGEM) version 3.02 user’s guide. Washington, DC: U.S. Environmental Protection Agency; 2005. EPA/600/R-05/047 (NTIS PB2006-102386).Suche in Google Scholar
[22] U.S. Environmental Protection Agency. USA: International best practice guide for landfill gas energy projects. 2012. https://www.globalmethane.org/documents/toolsres_lfg_ibpgcomplete.pdf.Suche in Google Scholar
[23] Fallahizadeh S, Rahmatinia M, Mohammadi Z, Vaezzadeh M, Tajamiri A, Soleimani H. Estimation of methane gas by LandGEM model from Yasuj municipal solid waste landfill, Iran. MethodsX. 2019;6:391–8. 10.1016/j.mex.2019.02.013.Suche in Google Scholar PubMed PubMed Central
[24] Kumar A, Sharma MP. Estimation of GHG emission and energy recovery potential from MSW landfill sites. Sustain Energy Technol Assess. 2014;5:50–61. 10.1016/j.seta.2013.11.004.Suche in Google Scholar
[25] Dos Santosa RE, Dos Santosb IFS, Barrosb RM, Bernalc AP, Filhob GLT, Da Silvaa FDB. Generating electrical energy through urban solid waste in Brazil: An economic and energy comparative analysis. J Environ Manag. 2019;231:198–206. 10.1016/j.jenvman.2018.10.015.Suche in Google Scholar PubMed
[26] Joseph LP, Prasad R. Assessing the sustainable municipal solid waste (MSW) to electricity generation potentials in selected Pacific Small Island Developing States (PSIDS). J Clean Prod. 2019;248:119222. 10.1016/j.jclepro.2019.119222.Suche in Google Scholar
[27] Alam A, Chaudhry MN, Ahmad SR, Ullah R, Batool SA, Butt T, et al. Application of LandGEM mathematical model for the estimation of gas emissions from contaminated sites. A case study of a dumping site in Lahore, Pakistan. Environ Prot Eng. 2022;48(1):69–81. 10.29072/basjs.20220113.Suche in Google Scholar
[28] Conestoga-Rovers & Associates. Handbook for the preparation of landfill gas to energy projects in Latin America and the Caribbean. Energy Sector Management Assistance Program paper series. Washington, DC: World Bank; 2004. http://documents.worldbank.org/curated/en/954761468011430611/Handbook-for-the- preparation-of-landfill-gas-to-energy-projects-in-Latin-America-and-the-Caribbean.Suche in Google Scholar
[29] Rafiq A, Rasheed A, Arslan C, Tallat U, Siddique M. Estimation of greenhouse gas emissions from Muhammad Wala opendumping site of Faisalabad, Pakistan. Geol Ecol Landsc. 2018;2(1):45–50. 10.1080/24749508.2018.1452463.Suche in Google Scholar
[30] Chalvatzaki E, Lazaridis M. Estimation of greenhouse gas emissions from landfills: Application to the Akrotiri landfill site (Chania, Greece). Glob NEST J. 2010;12(1):108–16.10.30955/gnj.000681Suche in Google Scholar
[31] Mahful R, Managi S. Estimating methane emission from solid waste landfill using various different methods. Conf Ser: Mater Sci Eng. 2018;403:012005. 1–6.10.1088/1757-899X/403/1/012005Suche in Google Scholar
[32] Hosseini SS, Yaghmaeian K, Yousefi N, Mahvi AH. Estimation of landfill gas generation in a municipal solid waste disposal site by LandGEM mathematical model. Glob J Environ Sci Manage. 2018;4(4):493–506. 10.22034/gjesm.2018.04.009.Suche in Google Scholar
[33] Mustafa SS, Mustafa SS, Mutlag AH. Kirkuk municipal waste to electrical energy. Electr Power Energy Syst. 2013;44:506–13. 10.1016/j.ijepes.2012.07.053.Suche in Google Scholar
[34] Staley BF, Barlaz MA. Composition of municipal solid waste in the United States and implications for carbon sequestration and methane yield. J Environ Eng. 2009;135(10):901–9. 10.1061/_ASCE_EE.1943-7870.0000032.Suche in Google Scholar
[35] Bhat A, Alam P, Rather NA, Islam SU. Characterization and statistical analysis of municipal solid waste for recognizing suitable waste management approach: A case study in the semi-urban region of Thanamandi, J&K, India. Res Sq. 2023;1–18. 10.21203/rs.3.rs-3559449/v1.Suche in Google Scholar
[36] Al-Ameen JA, Al-Hamdany MA. Babylon governorate municipal solid waste generation rate. J Eng. 2018;24(9):64–77.10.31026/j.eng.2018.09.05Suche in Google Scholar
[37] Attia NH, Ahmed SA. Evaluation of solid waste management in Tikrit city. J Al-Frahedis Arts. 2019;1(37):300–26.Suche in Google Scholar
[38] Aziz SQ, Ismail SO, Omar IA. Recyclable solid waste materials management in Erbil city- Iraq. Int J Eng Invent. 2019;8(1):57–62.Suche in Google Scholar
[39] Alkaradaghi K, Ali SS, Al-Ansari N, Ali T, Laue J. Quantitative estimation of municipal solid waste in Sulaimaniyah Governorate, Iraq. Recent advances in environmental science from the Euro-Mediterranean and Surrounding Regions. 2nd edn. Environmental Science and Engineering. Proceedings of Euro-Mediterranean Conference for Environmental Integration (EMCEI-1), Tunisia, 2021. 10.1007/978-3-030-51210-1_44.Suche in Google Scholar
[40] Dixhoorn FV. Evaluation of the potential of diaper recycling within AEB Amsterdam. Internship of the Master Sustainable Energy Technology Amsterdam, The Netherlands, from 24 Aug–18 Dec. 2015.Suche in Google Scholar
[41] JV Dornier – Suntrace – Synergy Consulting. Desk study on the potential and technical requirements for utilization of refuse-derived fuel technologies & RDF off-takers in Indonesia: volume 1: Framework analysis for RDF deployment and findings. Indonesia; 2023.Suche in Google Scholar
© 2025 the author(s), published by De Gruyter
This work is licensed under the Creative Commons Attribution 4.0 International License.
Artikel in diesem Heft
- Research Articles
- Modification of polymers to synthesize thermo-salt-resistant stabilizers of drilling fluids
- Study of the electronic stopping power of proton in different materials according to the Bohr and Bethe theories
- AI-driven UAV system for autonomous vehicle tracking and license plate recognition
- Enhancement of the output power of a small horizontal axis wind turbine based on the optimization approach
- Design of a vertically stacked double Luneburg lens-based beam-scanning antenna at 60 GHz
- Synergistic effect of nano-silica, steel slag, and waste glass on the microstructure, electrical resistivity, and strength of ultra-high-performance concrete
- Expert evaluation of attachments (caps) for orthopaedic equipment dedicated to pedestrian road users
- Performance and rheological characteristics of hot mix asphalt modified with melamine nanopowder polymer
- Second-order design of GNSS networks with different constraints using particle swarm optimization and genetic algorithms
- Impact of including a slab effect into a 2D RC frame on the seismic fragility assessment: A comparative study
- Analytical and numerical analysis of heat transfer from radial extended surface
- Comprehensive investigation of corrosion resistance of magnesium–titanium, aluminum, and aluminum–vanadium alloys in dilute electrolytes under zero-applied potential conditions
- Performance analysis of a novel design of an engine piston for a single cylinder
- Modeling performance of different sustainable self-compacting concrete pavement types utilizing various sample geometries
- The behavior of minors and road safety – case study of Poland
- The role of universities in efforts to increase the added value of recycled bucket tooth products through product design methods
- Adopting activated carbons on the PET depolymerization for purifying r-TPA
- Urban transportation challenges: Analysis and the mitigation strategies for road accidents, noise pollution and environmental impacts
- Enhancing the wear resistance and coefficient of friction of composite marine journal bearings utilizing nano-WC particles
- Sustainable bio-nanocomposite from lignocellulose nanofibers and HDPE for knee biomechanics: A tribological and mechanical properties study
- Effects of staggered transverse zigzag baffles and Al2O3–Cu hybrid nanofluid flow in a channel on thermofluid flow characteristics
- Mathematical modelling of Darcy–Forchheimer MHD Williamson nanofluid flow above a stretching/shrinking surface with slip conditions
- Energy efficiency and length modification of stilling basins with variable Baffle and chute block designs: A case study of the Fewa hydroelectric project
- Renewable-integrated power conversion architecture for urban heavy rail systems using bidirectional VSC and MPPT-controlled PV arrays as an auxiliary power source
- Exploitation of landfill gas vs refuse-derived fuel with landfill gas for electrical power generation in Basrah City/South of Iraq
- Two-phase numerical simulations of motile microorganisms in a 3D non-Newtonian nanofluid flow induced by chemical processes
- Sustainable cocoon waste epoxy composite solutions: Novel approach based on the deformation model using finite element analysis to determine Poisson’s ratio
- Impact and abrasion behavior of roller compacted concrete reinforced with different types of fibers
- Architectural design and its impact on daylighting in Gayo highland traditional mosques
- Structural and functional enhancement of Ni–Ti–Cu shape memory alloys via combined powder metallurgy techniques
- Design of an operational matrix method based on Haar wavelets and evolutionary algorithm for time-fractional advection–diffusion equations
- Design and optimization of a modified straight-tapered Vivaldi antenna using ANN for GPR system
- Analysis of operations of the antiresonance vibration mill of a circular trajectory of chamber vibrations
- Functions of changes in the mechanical properties of reinforcing steel under corrosive conditions
- 10.1515/eng-2025-0153
- Review Articles
- A modified adhesion evaluation method between asphalt and aggregate based on a pull off test and image processing
- Architectural practice process and artificial intelligence – an evolving practice
- Enhanced RRT motion planning for autonomous vehicles: a review on safety testing applications
- Special Issue: 51st KKBN - Part II
- The influence of storing mineral wool on its thermal conductivity in an open space
- Use of nondestructive test methods to determine the thickness and compressive strength of unilaterally accessible concrete components of building
- Use of modeling, BIM technology, and virtual reality in nondestructive testing and inventory, using the example of the Trzonolinowiec
- Tunable terahertz metasurface based on a modified Jerusalem cross for thin dielectric film evaluation
- Integration of SEM and acoustic emission methods in non-destructive evaluation of fiber–cement boards exposed to high temperatures
- Non-destructive method of characterizing nitrided layers in the 42CrMo4 steel using the amplitude-frequency technique of eddy currents
- Evaluation of braze welded joints using the ultrasonic method
- Analysis of the potential use of the passive magnetic method for detecting defects in welded joints made of X2CrNiMo17-12-2 steel
- Analysis of the possibility of applying a residual magnetic field for lack of fusion detection in welded joints of S235JR steel
- Eddy current methodology in the non-direct measurement of martensite during plastic deformation of SS316L
- Methodology for diagnosing hydraulic oil in production machines with the additional use of microfiltration
- Special Issue: IETAS 2024 - Part II
- Enhancing communication with elderly and stroke patients based on sign-gesture translation via audio-visual avatars
- Optimizing wireless charging for electric vehicles via a novel coil design and artificial intelligence techniques
- Evaluation of moisture damage for warm mix asphalt (WMA) containing reclaimed asphalt pavement (RAP)
- Comparative CFD case study on forced convection: Analysis of constant vs variable air properties in channel flow
- Evaluating sustainable indicators for urban street network: Al-Najaf network as a case study
- Node failure in self-organized sensor networks
- Comprehensive assessment of side friction impacts on urban traffic flow: A case study of Hilla City, Iraq
- Design a system to transfer alternating electric current using six channels of laser as an embedding and transmitting source
- Security and surveillance application in 3D modeling of a smart city: Kirkuk city as a case study
- Modified biochar derived from sewage sludge for purification of lead-contaminated water
- The future of space colonisation: Architectural considerations
- Design of a Tri-band Reconfigurable Antenna Using Metamaterials for IoT Applications
- Special Issue: AESMT-7 - Part II
- Experimental study on behavior of hybrid columns by using SIFCON under eccentric load
- Special Issue: ICESTA-2024 and ICCEEAS-2024
- A selective recovery of zinc and manganese from the spent primary battery black mass as zinc hydroxide and manganese carbonate
- Special Issue: REMO 2025 and BUDIN 2025
- Predictive modeling coupled with wireless sensor networks for sustainable marine ecosystem management using real-time remote monitoring of water quality
- Management strategies for refurbishment projects: A case study of an industrial heritage building
- Structural evaluation of historical masonry walls utilizing non-destructive techniques – Comprehensive analysis