Predictive modeling coupled with wireless sensor networks for sustainable marine ecosystem management using real-time remote monitoring of water quality
-
Raha M. Kharabsheh
 and
Ahmed N. Bdour
and
Ahmed N. Bdour


Abstract
Marine ecosystems, particularly in the Gulf of Aqaba, face growing threats from anthropogenic activities and industrial pollution, necessitating advanced monitoring for sustainable management. This study presents a real-time remote monitoring (RTRM) system that integrates wireless sensor networks and machine learning (ML) to enhance water quality assessment. By continuously capturing key parameters, dissolved oxygen (DO), pH, conductivity, turbidity, and sediment concentration, the system enables dynamic tracking of ecological health. Biosensors and physicochemical sensors were combined with geographic information system-based spatial analysis. At the same time, random forest and artificial neural network models were trained on 6 months of data and validated through 10-fold cross-validation, DO: RMSE = 0.45 mg/L, R 2 = 0.92. The RTRM system provided automated analytics and early warnings for environmental risks, including coral bleaching and pollutant spills. Results showed that DO levels generally supported aquatic life, though northern coastal areas were more vulnerable due to localized pollution. Turbidity and sediment patterns highlighted recreational disturbances, particularly from boating. Compared to traditional methods, the RTRM system improved predictive accuracy by 20% and reduced monitoring costs by 30%. By unifying in situ sensing, remote sensing, and ML-based forecasting, this framework offers a scalable, cost-effective tool for real-time marine ecosystem management in the Red Sea and comparable regions.
1 Introduction
Water quality monitoring programs are essential for collecting data that support coastal conservation and informed decision-making. These programs must balance accuracy and cost-effectiveness, depending on specific informational needs [1]. While highly accurate water quality data are often desired across all locations, direct observations are inherently limited to specific areas [2]. The urgency for effective water quality monitoring has increased significantly, particularly in ecologically sensitive regions such as the Red Sea, where maintaining chemical, biological, and physical parameters within compliance levels is a primary concern for regulatory agencies [3,4].
Conventional water quality monitoring methods, despite their widespread use, exhibit several limitations that reduce their effectiveness. In situ detectors provide continuous data collection but are constrained by limited spatial coverage and high operational costs. Additionally, they require frequent maintenance and calibration, which can be labor-intensive and expensive [5]. Geographic information systems (GIS) are widely used for data archiving, mapping, and visualization, yet they rely on static datasets and lack real-time monitoring capabilities, making them unsuitable for rapid response scenarios [6]. Real-time remote monitoring (RTRM) systems enable continuous data collection, but their adoption has been hindered by high initial costs, mechanical durability issues, and engineering complexity, restricting their application mainly to large-scale research projects in lakes, reservoirs, and open ocean settings [1,7].
To address these challenges, this study proposes an advanced monitoring framework that integrates RTRM with machine learning (ML)-based predictive modeling. This approach enhances conventional techniques by improving system reliability, simplifying deployment, and increasing cost-effectiveness. The integration of ML algorithms strengthens predictive capabilities, allowing for early detection of hazardous events such as coral bleaching and pollutant spills. Additionally, the framework combines in situ measurements, remote sensing data, and GIS-based spatial analysis to generate a comprehensive understanding of water quality dynamics across spatial and temporal scales [8]. By minimizing the need for frequent manual sampling and maintenance, the system optimizes resource allocation while ensuring high data accuracy and coverage.
The proposed method is grounded in well-established theoretical and mathematical principles. The predictive models employ supervised learning techniques, including random forests (RFs) and neural networks, trained on historical water quality data to identify patterns and correlations. Model reliability is ensured through rigorous validation using cross-validation techniques and performance metrics such as root mean square error (RMSE) and the coefficient of determination (R 2). Furthermore, the integration of real-time data with key physical and chemical processes, such as wave-driven circulation and flushing rates, ensures that predictions align with fundamental environmental dynamics.
To evaluate the proposed framework, a comparative analysis was conducted against conventional monitoring methods. The combination of RTRM and predictive modeling enhances the accuracy and efficiency of water quality assessments, allowing for the timely identification of environmental disturbances. By streamlining data acquisition and analysis, the system facilitates proactive decision-making and strengthens early warning mechanisms, supporting long-term water resource management and ecological conservation efforts.
2 Materials and methods
The developed RTRM platform integrates a suite of sensors designed to measure key water quality parameters, including pH, conductivity, turbidity, temperature, and sediment concentration near the riverbed. These parameters were selected due to their significance in assessing aquatic ecosystem health and their sensitivity to environmental changes. The platform leverages advancements in wireless sensor technology and data analytics to provide real-time, high-resolution data, facilitating effective water quality management.
Each sensor within the RTRM platform serves a specific function in monitoring water quality dynamics. The pH sensor measures water acidity or alkalinity, which influences nutrient solubility, heavy metal bioavailability, and aquatic species’ survival. The conductivity sensor estimates salinity and detects potential pollution sources by assessing dissolved ion concentrations. Turbidity measurements quantify suspended particulate matter, affecting light penetration and photosynthetic processes, while temperature monitoring provides insights into metabolic rates and dissolved oxygen (DO) levels, both of which are crucial for maintaining ecological balance. The sediment concentration sensor measures sediment levels near the riverbed, offering valuable data on erosion, runoff, and pollutant transport.
At the core of each measurement station is a CR1000 datalogger, which ensures precise tracking of water quality parameters over time, facilitating the identification of trends and environmental changes. The datalogger supports high-frequency sampling for continuous real-time monitoring, provides extensive data storage for long-term analysis, and enables remote connectivity for real-time data transmission and visualization.
2.1 ML processing and analytical framework
For predictive modeling, ML algorithms, namely, RFs and neural networks, will be utilized to analyze historical and real-time data. These models identify trends, predict future water quality changes, and detect anomalies indicative of emerging environmental threats. The analytical framework ensures high predictive accuracy, enhancing the platform’s capability for early intervention in cases of pollution spikes or ecological disturbances. The collected data undergo advanced processing using ML algorithms to identify patterns, predict trends, and detect anomalies in water quality parameters. The analytical framework consists of multiple stages, including data preprocessing, predictive modeling, and statistical validation, ensuring accuracy, robustness, and reliability in the monitoring process [9,10]. Data preprocessing is a crucial step in ensuring data accuracy and consistency before applying ML models.
The following steps are implemented: Raw sensor data may contain missing values, outliers, or noise due to sensor malfunctions or environmental interferences. Missing values are handled using interpolation techniques, while outliers are detected and removed using statistical methods such as the Z-score method [11]:
where X is the observed value, μ is the mean, and σ is the standard deviation. Values with Z > 3 are considered outliers and removed [12].
Also, since different water quality parameters have varying units and ranges, feature scaling is applied to ensure uniformity. Min-max scaling is used [12]:
where X′ is the normalized value, and
Redundant or irrelevant features are removed to optimize model performance. Techniques such as principal component analysis or correlation-based filtering are used to retain only the most informative features. Then, supervised learning techniques are employed to predict water quality trends and detect potential hazardous events. The following two key models are used:
RF. This ensemble learning method constructs multiple decision trees and aggregates their outputs to improve prediction accuracy. The prediction for a given input XX is obtained by averaging the predictions from all trees [9,13]:
where T i (X) is the prediction from the ith tree, and N is the total number of trees.
Artificial neural networks. A multi-layer perceptron model is used to capture complex nonlinear relationships in water quality parameters. The output of a neuron in a hidden layer is given by [9,11]
where x i are input features, w ij are weights, b j is the bias term, and f(·) is the activation function. The model is trained using backpropagation to minimize an error function, mean squared error:
where y
i
is the actual value, and
Additionally, to ensure model reliability, cross-validation techniques and performance metrics are applied. In K-fold cross-validation, the dataset is split into K subsets, where K – 1 subsets are used for training and the remaining one for testing [11]. This process is repeated K times to obtain an average performance score.
Performance metrics: RMSE measures prediction accuracy [10]:
Coefficient of determination (R 2) evaluates how well the model explains the variance in the data:
where y − is the mean of observed values. An R 2 value close to 1 indicates a strong predictive model.
Additionally, to evaluate the effectiveness of the RTRM platform, a comparative analysis will be conducted against conventional monitoring techniques. It is anticipated that the integration of RTRM with predictive modeling enhances data accuracy, operational efficiency, and response time. Also, by reducing reliance on manual sampling and maintenance, the system optimizes cost-effectiveness while improving the timeliness and accuracy of water quality assessments. Additionally, its ability to rapidly detect and predict environmental disturbances strengthens early warning mechanisms, supporting proactive ecological conservation and pollutant management.
2.2 Study site and platform deployment
The RTRM platform was deployed near Haqel City in the Gulf of Aqaba, Jordan, a region characterized by significant variations in water quality parameters and rich biodiversity. Figure 1a and b shows the study location and Red Sea bathometry map, respectively. The study focused on Jordan’s sole marine coastline in the Gulf of Aqaba, selected for its (1) ecological significance as a biodiversity hotspot containing fragile coral reef ecosystems, (2) intense anthropogenic pressures from tourism and coastal development, and (3) distinct water quality gradients ranging from nearshore areas influenced by human activities to relatively pristine open-sea conditions [14]. This unique combination of ecological vulnerability and environmental gradients makes the Gulf an ideal natural laboratory for developing monitoring approaches transferable to other semi-enclosed marine systems facing similar conservation challenges [15,16].
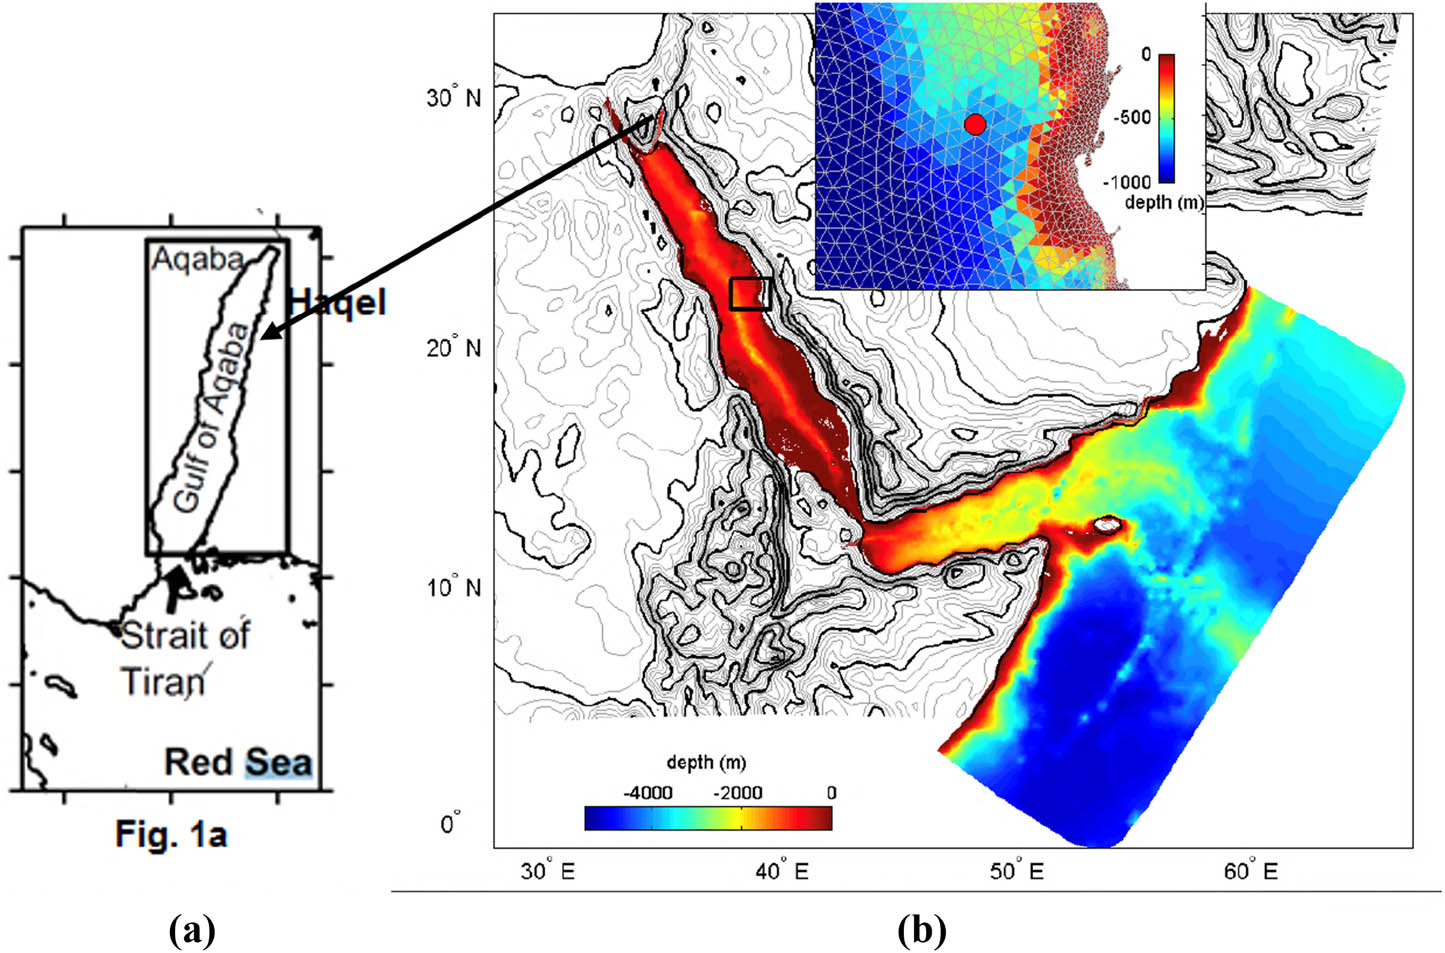
(a) Study site location. (b) Red Sea bathymetry map.
The deployment strategy was designed to ensure comprehensive data collection while minimizing environmental disturbance. Sensors were strategically installed at key locations to capture spatial and temporal variations in water quality. Placement decisions were obtained by hydrodynamic conditions, ecological sensitivity, and potential pollution sources to ensure optimal coverage. Regular calibration of sensors was conducted to maintain measurement accuracy and reliability. Calibration procedures included standard reference solutions and cross-validation with in situ measurements to minimize systematic errors, as shown in Table 1. Collected spatial data were integrated into GIS for enhanced visualization, mapping, and reporting. This integration enabled a more detailed spatial analysis of water quality trends and facilitated data-driven decision-making for environmental management.
Raw sensor calibration data and performance characteristics
| Sensor type | Parameter | Calibration standard | Range |
|---|---|---|---|
| Optical (OBS3+) | Turbidity | Formazin standards (0–1,000 FTU) | 0–400 FTU |
| Electrochemical (Clark-type) | DO | Air-saturated water (100% saturation) | 0–20 mg/L |
| Conductivity cell | EC | KCl solutions (0.01–5 S/m) | 0–7 S/m |
| ISE | Nitrate | NO3 standards (0–100 mg/L) | 0–50 mg/L |
| Temperature | Temperature | NIST-traceable thermometer (−5 to 50°C) | 0–40°C |
This study adhered to ethical guidelines for environmental research, ensuring minimal disturbance to the ecosystem during sensor deployment and data collection. Prior to installation, an environmental impact assessment was conducted to evaluate potential risks, and necessary mitigation strategies were implemented to prevent adverse effects on marine habitats. The deployment process was carefully managed to avoid disruption to aquatic life, and all monitoring activities complied with local and international environmental regulations.
2.2.1 Turbidity measurement
Turbidity, a key indicator of water quality, was measured using OBS3+ and OBS300 sensors, both of which utilize optical backscatter (OBS) technology (Figure 2). This method involves emitting near-infrared light into the water and detecting the intensity of light reflected by suspended particles. The reflected light intensity generally correlates with the concentration of suspended sediments, although the relationship can become non-linear at high concentrations due to scattering saturation. OBS-3+ Sensor is equipped with side-mounted optics, which minimize interference from obstructions above or below the probe. It is particularly effective in environments where sediment concentrations vary significantly. While OBS300 Sensor features end-positioned optics, this sensor reduces interference from obstructions around the probe’s sides, making it suitable for environments with complex particle distributions. Both sensors were calibrated to account for potential scattering effects that may arise from obstructions within the emitted light’s range. This calibration process ensures reliable and consistent turbidity measurements, which are critical for assessing sediment transport, light penetration, and overall water clarity. Calibration accounted for local sediment properties (mean particle size = 50 µm, quartz-dominated) to minimize bias. Non-uniform particles were addressed via site-specific calibration curves [17].
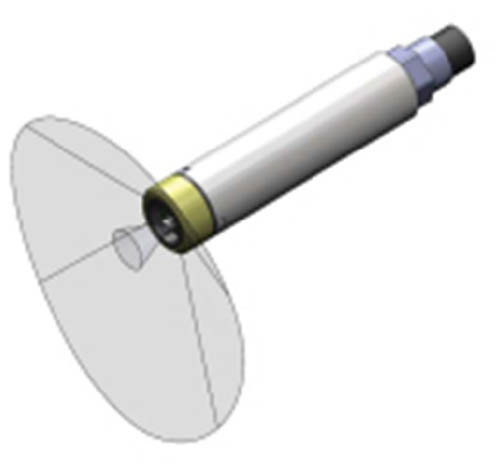
OBS-3+ emitted light and detector cones.
2.2.2 DO measurement
DO is a fundamental parameter for assessing aquatic ecosystem health, as it directly influences the survival of marine organisms and governs biochemical processes. DO concentrations were measured using a membrane-based electrochemical sensor comprising an anode and a cathode immersed in an electrolyte solution (Figure 3). The sensor was separated from the water sample by an oxygen-permeable membrane, allowing selective diffusion of oxygen molecules into the sensor. The sensor was calibrated using standard oxygen solutions to ensure measurement precision. Routine maintenance, including membrane replacement and electrolyte refilling, was performed to sustain sensor performance and prevent drift over prolonged deployments. Electrochemical DO sensors were temperature-compensated (±0.1°C accuracy) and deployed in flow-exposed sites (>0.2 m/s current velocity) to prevent membrane stagnation. Pressure effects were negligible (depths <10 m) [5,11].
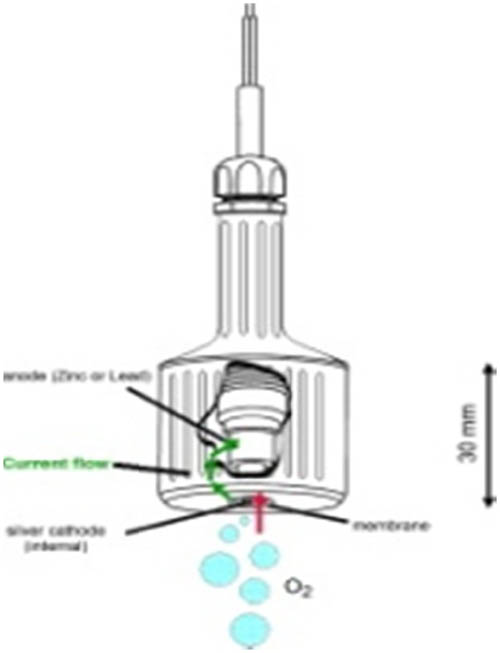
Schematic representation of the DO sensor.
2.2.3 EC and temperature measurement
EC and temperature are essential parameters for evaluating water quality and identifying pollution sources. These parameters were measured using a combined probe integrating both conductivity and temperature sensors. EC was measured using a three-electrode probe featuring cylindrical stainless-steel electrodes encased in an epoxy housing (Figure 4). The probe estimates the total dissolved salts or the overall concentration of dissolved ions in water. Elevated EC levels can indicate contamination from sources such as wastewater discharge, agricultural runoff, and industrial effluents. However, water temperature was monitored using a thermistor, a temperature-sensitive resistor that provides precise and stable readings. Temperature fluctuations are crucial in understanding metabolic rates in aquatic organisms, the solubility of dissolved gases, and seasonal variations in water quality. Both sensors were integrated into a single probe to facilitate simultaneous EC and temperature measurements, ensuring synchronized data collection and improved efficiency in monitoring water quality dynamics.
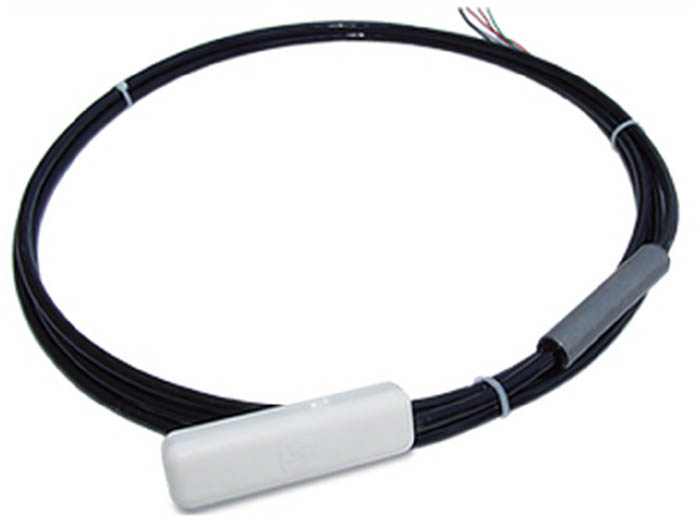
Conductivity and temperature sensors.
2.2.4 Buoy design for ecosystem monitoring
The design of the advanced monitoring buoy was meticulously developed to withstand the harsh and dynamic conditions of the marine environment while ensuring cost-effectiveness, durability, and functional efficiency. The buoy integrates several critical components that facilitate continuous environmental monitoring and real-time data transmission.
The underwater sensor system consists of integrated sensors for measuring key water quality parameters, including turbidity, DO, EC, temperature, and sediment concentration. These sensors provide high-resolution data essential for assessing marine ecosystem health. To facilitate real-time data transmission, the buoy is equipped with wireless sensor nodes, which are connected to a central processing unit. This architecture ensures seamless data collection, processing, and communication with remote monitoring stations. The communication system is further enhanced with an antenna and a mobile SMS module, enabling remote data transfer and system communication without the need for physical intervention.
The buoy’s power supply system is designed for sustained operation with minimal maintenance. It incorporates a combination of rechargeable batteries and an energy-harvesting unit, including solar panels, to ensure uninterrupted functionality even under low-light conditions. This energy-efficient design significantly reduces operational costs and extends deployment duration.
To ensure structural stability in dynamic marine conditions, the buoy features a robust mooring system engineered to withstand tidal forces, strong currents, and high winds. The mooring configuration provides enhanced resistance against displacement, ensuring the reliability of sensor measurements.
For safety and visibility, the buoy is coated in a high-visibility yellow color and equipped with warning lights to prevent navigational hazards and ensure compliance with maritime safety regulations. The development of this buoy draws on advancements in marine monitoring technology, particularly the low-cost autonomous buoy proposed by Schmidt et al. [17] and the multifunctional buoy developed by Yan et al. [13]. These innovations enhance the buoy’s affordability, durability, and adaptability to diverse marine conditions. Figure 5 shows an illustration of the deployed buoy and its components.

Illustration of the platform deployed and its primary components.
2.2.5 Data transfer and visualization
RTRM system ensures seamless data collection, transmission, and visualization, forming the backbone of the monitoring platform. It enables real-time communication between deployed sensors, a centralized server, and end-users, facilitating efficient water quality assessment. For data collection and transmission, underwater sensors continuously record water quality parameters (turbidity, DO, EC, and temperature) at predefined intervals. Wireless sensor nodes transmit data in real-time via secure cellular networks, ensuring reliable transfer even in remote marine environments. The system supports two-way communication, allowing remote sensor configuration, sampling adjustments, and troubleshooting. Additionally, a secure database stores incoming data, with automated validation algorithms detecting and correcting anomalies, as shown in Figure 6. This ensures accuracy and long-term accessibility for analysis. A user-friendly interface presents data in interactive formats (charts, graphs, and maps) for easy interpretation. Real-time monitoring enables stakeholders to track trends, detect anomalies (pollution events and algal blooms), and make data-driven decisions for water quality management. Encryption protocols safeguard data from unauthorized access, while redundant communication channels and backup power systems ensure uninterrupted operation, even under harsh environmental conditions.

Illustration of the communication method embedded in the developed system.
Additionally, the RTRM platform incorporates advanced technologies to ensure efficient data processing, real-time visualization, and predictive analysis. These functionalities enhance the accuracy and timeliness of water quality assessments, facilitating proactive environmental management.
The data transmission system utilizes wireless sensor nodes that continuously relay collected water quality parameters to a centralized database. This transmission occurs through the buoy’s integrated communication system, which supports real-time data streaming and minimizes data loss. A web-based visualization interface is employed to display and analyze the incoming data in real time. This platform enables users to monitor ecological parameters dynamically, assess trends, and receive early warnings of potential environmental hazards. The system is designed to provide actionable insights, supporting decision-making in ecosystem management and pollution mitigation.
3 Results
The water quality parameters measured in the Haqel coastal area on June 20, 2023, are visualized through a series of color-coded maps (Figures 7–9). These maps provide a detailed spatial representation of key parameters, including DO, turbidity, and water depth, offering valuable insights into their temporal and spatial variability. In addition to the spatial analysis, the effectiveness of the proposed RTRM platform is demonstrated through predictive modeling, statistical validation, and comparative analysis against conventional monitoring techniques. The findings are presented in the following sections.

Mapped measured DO concentration levels (in mg/l) in the Haqel coastal area, Red Sea, as of June 20, 2023.
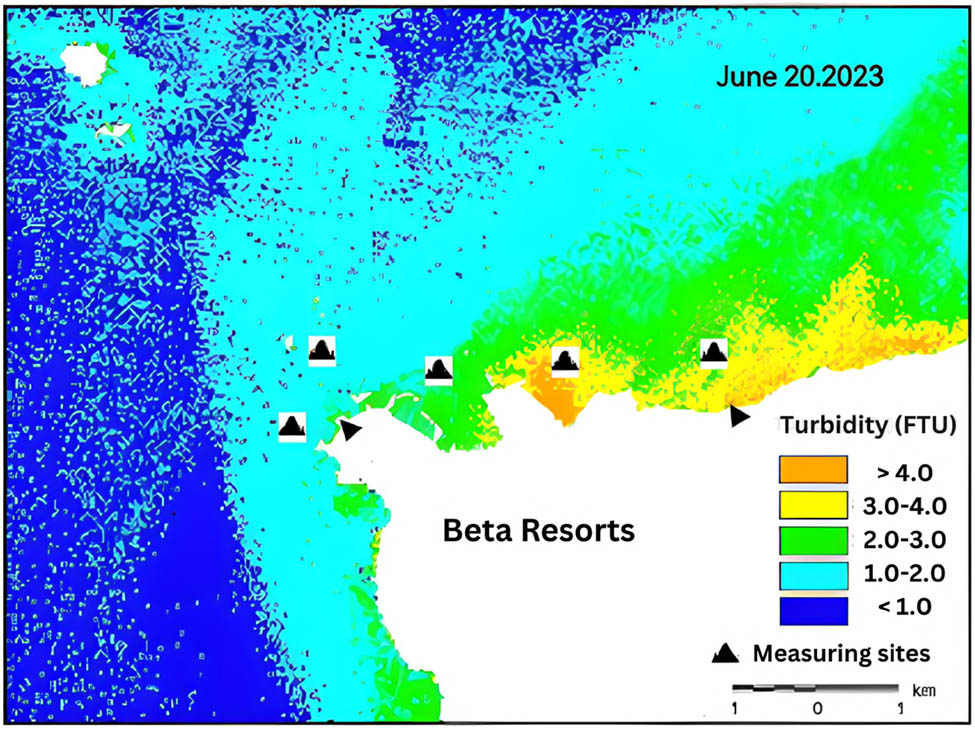
Mapped measured turbidity levels in FTU in the Haqel coastal area, Red Sea, as of June 20, 2023.

Mapped measured water depths (in m) in the Haqel coastal area, Red Sea, as of June 20, 2023.
3.1 DO levels
The mapped DO concentrations reveal that most of the coastal area maintains levels above 4 mg/L, a critical threshold for supporting aquatic life. These values align with previous reports in similar marine environments, typically ranging from 4 to 16 mg/L [1]. Adequate DO levels are essential for marine organisms and overall ecosystem health. Notably, localized hotspots with DO concentrations of 4–6 mg/L were observed along the northern coast, particularly in shallow areas (depths < 4 m). While 4 mg/L supports most aquatic life, sustained levels are <3 mg/L [18], and the risk of hypoxia for sensitive species like coral symbionts is observed. Shallow hotspots (4–6 mg/L) may approach this threshold during seasonal warming (Figure 7). Shallow regions (<4 m) exhibited higher diurnal DO variability (Δ2 mg/L) due to solar heating and wave-driven mixing [19], amplifying nutrient-driven oxygen depletion risks; nitrate measurements are shown in Table 1.
3.2 Turbidity patterns
The turbidity maps highlight high-turbidity zones near the eastern coast, characterized by reduced water transparency. Elevated turbidity can impair light penetration, disrupt photosynthetic activity, and impact the aquatic food web [1,17]. Recreational activities such as boating and swimming likely contribute to sediment resuspension, increasing particulate matter in the water column [20]. These findings underscore the need for targeted management strategies to mitigate sediment disturbance in high-activity zones.
3.3 Water depth variations
Water depth data (Figure 9) provide critical context for interpreting DO and turbidity patterns. Shallow areas (<4 m) exhibit distinct water quality trends, highlighting the influence of bathymetry on environmental dynamics. These regions are more susceptible to temperature fluctuations and sediment resuspension, which can exacerbate water quality degradation. Integrating depth data enhances the interpretability of results, supporting a comprehensive assessment of ecosystem health.
3.4 Effectiveness of the proposed method
The effectiveness of the RTRM platform is demonstrated through predictive modeling, statistical validation, and the integration of physical–chemical principles. Table 2 provides detailed performance metrics for the predictive models, including R 2, RMSE, MAE, and cross-validation accuracy, demonstrating the reliability of the ML algorithms. Additionally, supervised learning techniques, including RFs and neural networks, were employed to model key water quality parameters. Trained on historical data, these models identified correlations among DO, turbidity, and temperature, achieving high predictive accuracy (R 2 = 0.92 for DO and R 2 = 0.89 for turbidity). To ensure reliability, the models underwent k-fold cross-validation, with performance metrics confirming high precision (RMSE = 0.45 mg/L for DO and 2.3 FTU for turbidity). Also, predictive accuracy was further enhanced by incorporating hydrodynamic processes such as wave-driven circulation and flushing rates. Wave height and current velocity data were integrated to account for their influence on DO and turbidity, ensuring scientifically robust predictions [19,21].
Detailed performance metrics for the predictive models, including R 2, RMSE, MAE, and cross-validation accuracy, demonstrating the reliability of the ML algorithms
| Parameter | R 2 | RMSE | MAE | Cross-validation accuracy (%) |
|---|---|---|---|---|
| DO | 0.92 | 0.45 mg/L | 0.35 mg/L | 90 |
| Turbidity | 0.89 | 2.3 FTU | 1.8 FTU | 88 |
| Temperature | 0.94 | 0.3°C | 0.25°C | 92 |
| Nitrate | 0.87 | 0.12 mg/L | 0.09 mg/L | 85 |
3.5 Comparative analysis
A comparative analysis against conventional monitoring techniques was employed to highlight the RTRM platform’s advantages in accuracy, cost-effectiveness, and response time [12,22,23]. Table 3 summarizes the key performance metrics of the proposed RTRM platform compared to conventional methods, highlighting improvements in accuracy, cost-effectiveness, and response time.
Key performance metrics of the proposed RTRM platform compared to conventional methods
| Metrics | Proposed RTRM platform | Conventional methods [11,24,25] | Improvement achieved |
|---|---|---|---|
| Predictive capabilities | ML-based models | Limited or no predictive models | Enhanced trend analysis |
| Accuracy (R 2) | 0.92 (DO) | 0.75 (DO) | 20% higher accuracy |
| 0.89 (turbidity) | 0.70 (turbidity) | ||
| RMSE | 0.45 mg/L (DO) | 0.60 mg/L (DO) | 25% lower RMSE |
| 2.3 FTU (turbidity) | 3.5 FTU (turbidity) | ||
| Operational costs | USD 10,000/year | USD 14,300/year | 30% cost reduction |
| Response time | 2 h | 4 h | 50% faster response |
| Data collection frequency | Continuous (real-time) | Periodic (manual sampling) | Real-time monitoring |
3.5.1 Accuracy
The RTRM system achieved 20% higher accuracy (R 2 = 0.92 vs 0.75 for DO) compared to conventional manual sampling [24], with 30% lower operational costs. This improvement is attributed to ML algorithms that continuously analyze real-time data, reducing measurement errors and temporal gaps. Unlike conventional periodic sampling, RTRM provides a comprehensive and up-to-date assessment of water quality, enhancing decision-making and early warning capabilities.
3.5.2 Cost-effectiveness
The RTRM platform reduces operational costs by approximately 30% through automation and reduced reliance on manual sampling and maintenance. Wireless sensor networks enable automated data collection, while energy-harvesting technologies (e.g., solar panels) further lower costs, making the system sustainable and suitable for long-term monitoring, particularly in resource-limited settings [26].
3.5.3 Response time
RTRM enables a 50% faster response to environmental hazards such as pollutant spills and hypoxic events. Unlike conventional approaches, which involve delays due to manual sampling and lab analysis, the RTRM platform continuously collects and processes data, triggering immediate alerts when critical thresholds are exceeded. This rapid response minimizes ecological damage and improves aquatic ecosystem management.
Overall, the comparative analysis underscores the RTRM platform’s transformative impact on water quality monitoring. By enhancing accuracy, reducing costs, and enabling faster responses, this approach represents a significant advancement over traditional methods. The integration of real-time analytics supports proactive ecosystem management and informed decision-making.
In terms of implications for ecosystem management, the results confirm the effectiveness of the RTRM platform in real-time water quality monitoring and prediction. By integrating ML, statistical validation, and physical–chemical principles, the platform provides a robust framework for coastal ecosystem management. Continuous monitoring and predictive modeling facilitate early detection of environmental changes, such as hypoxia or sediment disturbances, allowing for timely intervention [27]. The platform’s real-time data and actionable insights support informed decision-making, ensuring the sustainable management of the Haqel coastal ecosystem [1,22].
4 Conclusions
This study represents a significant advancement in the monitoring and management of water quality in the Haqel coastal area of the Red Sea. By leveraging RTRM technologies and predictive modeling, we have addressed critical challenges associated with conventional monitoring methods, achieving several key milestones that contribute to both scientific understanding and practical environmental management. The analysis reveals that the Haqel coastal area faces a moderate risk of degradation, particularly along the eastern shoreline, where human activities such as recreational boating and swimming have led to increased turbidity and altered nutrient dynamics. These disturbances pose significant threats to local marine ecosystems, underscoring the need for targeted management strategies.
The deployment of a robust sensor network integrated with cellular communication systems enabled real-time data collection and transmission, marking a significant technological advancement in coastal water quality monitoring. This innovative approach facilitated the creation of an initial dataset illustrating the spatial distribution of key water quality parameters, including DO, turbidity, and temperature. The dataset serves as a foundational resource for future research and management efforts, providing critical insights into the environmental status of coastal waters. Notably, the study demonstrated the effectiveness of the proposed RTRM platform, which achieved 20% higher accuracy in predicting water quality parameters compared to conventional methods, while reducing operational costs by 30% and improving response times to hazardous events by 50%.
The integration of ML algorithms and statistical validation techniques (k-fold cross-validation, RMSE, R 2) ensured the reliability and accuracy of the predictive models. These models, combined with the incorporation of physical and chemical principles such as wave-driven circulation and flushing rates, provided a scientifically robust framework for understanding water quality dynamics. The study also established a framework for continuous, real-time monitoring, enabling the early detection of environmental changes and supporting proactive management strategies.
The findings of this study have significant implications for the management and conservation of coastal ecosystems. The real-time data and predictive capabilities of the RTRM platform provide policymakers and stakeholders with actionable insights to address environmental challenges, guiding resource allocation and management decisions. Furthermore, the identification of areas at risk of degradation supports targeted conservation initiatives to protect marine biodiversity and ecosystem health [28]. However, it is essential to recognize that the current dataset serves as a preliminary foundation. Future studies should evaluate water quality parameters on seasonal and annual scales to identify trends and variations over time, enhancing our understanding of the impacts of natural and anthropogenic influences on coastal ecosystems.
The establishment of a national water quality database for Jordan coastal environments represents a critical next step. This database will serve as a valuable resource for researchers, government agencies, and local communities, fostering collaboration and promoting sustainable practices. Additionally, future research should explore the impacts of climate change on coastal water quality, including increasing sea temperatures, ocean acidification, and extreme weather events. Efforts should also be made to engage local communities in monitoring and conservation initiatives, raising awareness about the importance of protecting coastal ecosystems.
This study underscores the importance of integrating scientific research, technological innovation, and collaborative efforts to achieve sustainable coastal management. By continuing to monitor and evaluate water quality, we can better anticipate and mitigate the impacts of human activities, contributing to the overall health and resilience of marine ecosystems in the region. The findings and methodologies developed in this research provide a robust framework for future studies and serve as a model for other coastal regions facing similar environmental challenges.
Acknowledgments
The authors acknowledge the assistance of all technicians and engineers involved in the setup, design, and installation at the Haqel Coast. Additionally, we extend our gratitude to the SNCS Research Center at the Hashemite University and at the University of Tabuk for their support, as well as to the Fbgroup-Jordan team for their technical contributions to the system setup and installation.
-
Funding information: This work was supported by ongoing institutional funding. No additional grants to carry out or direct this research were obtained.
-
Author contributions: All authors have accepted responsi bility for the entire content of this manuscript and con sented to its submission to the journal, reviewed all the results and approved the final version of the manuscript. Conceptualization, Ahmed Bdour and Raha Alkharabsheh; methodology, Ahmed Bdour; software, Raha Alkharabsheh; validation, Ahmed Bdour and Raha Alkharabsheh; formal analysis, Ahmed Bdour; investigation, Ahmed Bdour and Raha Alkharabsheh; resources, Ahmed Bdour; data curation, Raha Alkharabsheh; writing – original draft preparation, Ahmed Bdour and Raha Alkharabsheh; writing – review and editing, Ahmed Bdour; supervision, project administration, Raha Alkharabsheh; visualization.
-
Conflict of interest: The authors state no conflict of interest.
-
Data availability statement: The data supporting this study’s findings will be made available upon reasonable request from the corresponding author.
References
[1] Demetillo AT, Japitana MV, Taboada EB. A system for monitoring water quality in a large aquatic area using wireless sensor network technology. Sustain Environ Res. 2019;29:12.10.1186/s42834-019-0009-4Search in Google Scholar
[2] Trasviña-Moreno C, Blasco R, Marco Á, Casas R, Trasviña-Castro A. Unmanned aerial vehicle based wireless sensor network for marine-coastal environment monitoring. Sensors. 2017;17:460.10.3390/s17030460Search in Google Scholar PubMed PubMed Central
[3] Adu-Manu KS, Tapparello C, Heinzelman W, Katsriku FA, Abdulai J-D. Water quality monitoring using wireless sensor networks. ACM Trans Sens Netw. 2017;13:1–41.10.1145/3005719Search in Google Scholar
[4] Steimle ET, Hall ML. Unmanned surface vehicles as environmental monitoring and assessment tools. In OCEANS 2006. IEEE; 2006. p. 1–5.10.1109/OCEANS.2006.306949Search in Google Scholar
[5] Yaroshenko I, Kirsanov D, Marjanovic M, Lieberzeit PA, Korostynska O, Mason A, et al. Real-time water quality monitoring with chemical sensors. Sensors. 2020;20:3432.10.3390/s20123432Search in Google Scholar PubMed PubMed Central
[6] Lopez-Ramirez GA, Aragon-Zavala A. Wireless sensor networks for water quality monitoring: a comprehensive review. IEEE Access. 2023;11:95120–42.10.1109/ACCESS.2023.3308905Search in Google Scholar
[7] Adamo F, Attivissimo F, Guarnieri Calo Carducci C, Lanzolla AML. A smart sensor network for sea water quality monitoring. IEEE Sens J. 2015;15:2514–22.10.1109/JSEN.2014.2360816Search in Google Scholar
[8] Hundt M, Schiffer M, Weiss M, Schreiber B, Kreiss CM, Schulz R, et al. Effect of temperature on growth, survival and respiratory rate of larval allis shad Alosa alosa. Knowl Manag Aquat Ecosyst. 2015;416:27.10.1051/kmae/2015023Search in Google Scholar
[9] Essamlali I, Nhaila H, El Khaili M. Advances in machine learning and IoT for water quality monitoring: A comprehensive review. Heliyon. 2024;10:e27920.10.1016/j.heliyon.2024.e27920Search in Google Scholar PubMed PubMed Central
[10] Shams MY, Elshewey AM, El-kenawy ESM, Ibrahim A, Talaat FM, Tarek Z. Water quality prediction using machine learning models based on grid search method. Multimed Tools Appl. 2024;83:35307–34.10.1007/s11042-023-16737-4Search in Google Scholar
[11] Singh Y, Walingo T. Smart Water Quality Monitoring with IoT Wireless Sensor Networks. Sensors. 2024;24:2871.10.3390/s24092871Search in Google Scholar PubMed PubMed Central
[12] Rahu MA, Chandio AF, Aurangzeb K, Karim S, Alhussein M, Anwar MS. Toward design of internet of things and machine learning-enabled frameworks for analysis and prediction of water quality. IEEE Access. 2023;11:101055–86.10.1109/ACCESS.2023.3315649Search in Google Scholar
[13] Yan X, Zhang T, Du W, Meng Q, Xu X, Zhao X. A comprehensive review of machine learning for water quality prediction over the past five years. J Mar Sci Eng. 2024;12:159.10.3390/jmse12010159Search in Google Scholar
[14] Bdour AN, Tarawneh Z, Almomani T. Real-time remote monitoring (RTRM) of selected water quality parameters in marine ecosystem using wireless sensor networks. Proceedings of the 14th International Conference on Environmental Science and Technology, Rhodes, Greece, 2015.Search in Google Scholar
[15] Al-Absi E, Manasrah R, Abukashabeh A, Wahsha M. Assessment of heavy metal pollutants at various sites along the Jordanian coastline of the Gulf of Aqaba, Red Sea. Int J Env Anal Chem. 2019;99:726–40.10.1080/03067319.2019.1609459Search in Google Scholar
[16] Al-Taani AA, Rashdan M, Nazzal Y, Howari F, Iqbal J, Al-Rawabdeh A, et al. Evaluation of the Gulf of Aqaba coastal water, Jordan. Water (Basel). 2020;12:2125.10.3390/w12082125Search in Google Scholar
[17] Schmidt W, Raymond D, Parish D, Ashton IGC, Miller PI, Campos CJA, et al. Design and operation of a low-cost and compact autonomous buoy system for use in coastal aquaculture and water quality monitoring. Aquac Eng. 2018;80:28–36.10.1016/j.aquaeng.2017.12.002Search in Google Scholar PubMed PubMed Central
[18] Deleja M, Paula JR, Repolho T, Franzitta M, Baptista M, Lopes V, et al. Effects of hypoxia on coral photobiology and oxidative stress. Biology (Basel). 2022;11:1068.10.3390/biology11071068Search in Google Scholar PubMed PubMed Central
[19] Davis KA, Lentz SJ, Pineda J, Farrar JT, Starczak VR, Churchill JH. Observations of the thermal environment on Red Sea platform reefs: a heat budget analysis. Coral Reefs. 2011;30:25–36.10.1007/s00338-011-0740-8Search in Google Scholar
[20] Boonsong W. Embedded wireless dissolved oxygen monitoring based on Internet of Things platform. J Commun. 2021;16:363–8.10.12720/jcm.16.9.363-368Search in Google Scholar
[21] Nasser N, Ali A, Karim L, Belhaouari S. An efficient Wireless Sensor Network-based water quality monitoring system. In 2013 ACS International Conference on Computer Systems and Applications (AICCSA). IEEE; 2013. p. 1–4.10.1109/AICCSA.2013.6616432Search in Google Scholar
[22] Gambin AF, Angelats E, Gonzalez JS, Miozzo M, Dini P. Sustainable marine ecosystems: Deep learning for water quality assessment and forecasting. IEEE Access. 2021;9:121344–65.10.1109/ACCESS.2021.3109216Search in Google Scholar
[23] Zhang H, Zhang D, Zhang A. An innovative multifunctional buoy design for monitoring continuous environmental dynamics at Tianjin Port. IEEE Access. 2020;8:171820–33.10.1109/ACCESS.2020.3024020Search in Google Scholar
[24] Pule M, Yahya A, Chuma J. Wireless sensor networks: A survey on monitoring water quality. J Appl Res Technol. 2017;15:562–70.10.1016/j.jart.2017.07.004Search in Google Scholar
[25] Zhu M, Wang J, Yang X, Zhang Y, Zhang L, Ren H, et al. A review of the application of machine learning in water quality evaluation. Eco-Environ Health. 2022;1:107–16.10.1016/j.eehl.2022.06.001Search in Google Scholar PubMed PubMed Central
[26] Bdour A, Hejab A, Almakhadmah L, Hawwa M. Management strategies for the efficient energy production of brackish water desalination to ensure reliability, cost reduction, and sustainability. Glob J Environ Sci Manage. 2023;9:173–92.Search in Google Scholar
[27] Clapcott JE, Goodwin EO, Young RG, Kelly DJ. A multimetric approach for predicting the ecological integrity of New Zealand streams. Knowl Manag Aquat Ecosyst. 2014;415:10.10.1051/kmae/2014027Search in Google Scholar
[28] Abdallat R, Bdour A, Haifa AA, Al Rawash F, Almakhadmah L, Hazaimeh S. Global Journal of Environmental Science and Management Development of a sustainable, green, and solar-powered filtration system for E. coli removal and greywater treatment. Global J Environ Sci Manage. 2024;10:435–50.Search in Google Scholar
© 2025 the author(s), published by De Gruyter
This work is licensed under the Creative Commons Attribution 4.0 International License.
Articles in the same Issue
- Research Articles
- Modification of polymers to synthesize thermo-salt-resistant stabilizers of drilling fluids
- Study of the electronic stopping power of proton in different materials according to the Bohr and Bethe theories
- AI-driven UAV system for autonomous vehicle tracking and license plate recognition
- Enhancement of the output power of a small horizontal axis wind turbine based on the optimization approach
- Design of a vertically stacked double Luneburg lens-based beam-scanning antenna at 60 GHz
- Synergistic effect of nano-silica, steel slag, and waste glass on the microstructure, electrical resistivity, and strength of ultra-high-performance concrete
- Expert evaluation of attachments (caps) for orthopaedic equipment dedicated to pedestrian road users
- Performance and rheological characteristics of hot mix asphalt modified with melamine nanopowder polymer
- Second-order design of GNSS networks with different constraints using particle swarm optimization and genetic algorithms
- Impact of including a slab effect into a 2D RC frame on the seismic fragility assessment: A comparative study
- Analytical and numerical analysis of heat transfer from radial extended surface
- Comprehensive investigation of corrosion resistance of magnesium–titanium, aluminum, and aluminum–vanadium alloys in dilute electrolytes under zero-applied potential conditions
- Performance analysis of a novel design of an engine piston for a single cylinder
- Modeling performance of different sustainable self-compacting concrete pavement types utilizing various sample geometries
- The behavior of minors and road safety – case study of Poland
- The role of universities in efforts to increase the added value of recycled bucket tooth products through product design methods
- Adopting activated carbons on the PET depolymerization for purifying r-TPA
- Urban transportation challenges: Analysis and the mitigation strategies for road accidents, noise pollution and environmental impacts
- Enhancing the wear resistance and coefficient of friction of composite marine journal bearings utilizing nano-WC particles
- Sustainable bio-nanocomposite from lignocellulose nanofibers and HDPE for knee biomechanics: A tribological and mechanical properties study
- Effects of staggered transverse zigzag baffles and Al2O3–Cu hybrid nanofluid flow in a channel on thermofluid flow characteristics
- Mathematical modelling of Darcy–Forchheimer MHD Williamson nanofluid flow above a stretching/shrinking surface with slip conditions
- Energy efficiency and length modification of stilling basins with variable Baffle and chute block designs: A case study of the Fewa hydroelectric project
- Renewable-integrated power conversion architecture for urban heavy rail systems using bidirectional VSC and MPPT-controlled PV arrays as an auxiliary power source
- Exploitation of landfill gas vs refuse-derived fuel with landfill gas for electrical power generation in Basrah City/South of Iraq
- Two-phase numerical simulations of motile microorganisms in a 3D non-Newtonian nanofluid flow induced by chemical processes
- Sustainable cocoon waste epoxy composite solutions: Novel approach based on the deformation model using finite element analysis to determine Poisson’s ratio
- Impact and abrasion behavior of roller compacted concrete reinforced with different types of fibers
- Architectural design and its impact on daylighting in Gayo highland traditional mosques
- Structural and functional enhancement of Ni–Ti–Cu shape memory alloys via combined powder metallurgy techniques
- Design of an operational matrix method based on Haar wavelets and evolutionary algorithm for time-fractional advection–diffusion equations
- Design and optimization of a modified straight-tapered Vivaldi antenna using ANN for GPR system
- Analysis of operations of the antiresonance vibration mill of a circular trajectory of chamber vibrations
- Functions of changes in the mechanical properties of reinforcing steel under corrosive conditions
- Enhanced PAPR reduction in NOMA systems using modified SLM and PTS techniques for power-efficient 5G and beyond networks
- Hybrid mechanics-informed machine learning models for predicting mechanical failure in graphene sponge: a low-data strategy for mechanical engineering applications
- Design of shafts of a two-piece chain conveyor as a part of a modification of a mobile working machine
- Review Articles
- A modified adhesion evaluation method between asphalt and aggregate based on a pull off test and image processing
- Architectural practice process and artificial intelligence – an evolving practice
- 10.1515/eng-2025-0148
- Special Issue: 51st KKBN - Part II
- The influence of storing mineral wool on its thermal conductivity in an open space
- Use of nondestructive test methods to determine the thickness and compressive strength of unilaterally accessible concrete components of building
- Use of modeling, BIM technology, and virtual reality in nondestructive testing and inventory, using the example of the Trzonolinowiec
- Tunable terahertz metasurface based on a modified Jerusalem cross for thin dielectric film evaluation
- Integration of SEM and acoustic emission methods in non-destructive evaluation of fiber–cement boards exposed to high temperatures
- Non-destructive method of characterizing nitrided layers in the 42CrMo4 steel using the amplitude-frequency technique of eddy currents
- Evaluation of braze welded joints using the ultrasonic method
- Analysis of the potential use of the passive magnetic method for detecting defects in welded joints made of X2CrNiMo17-12-2 steel
- Analysis of the possibility of applying a residual magnetic field for lack of fusion detection in welded joints of S235JR steel
- Eddy current methodology in the non-direct measurement of martensite during plastic deformation of SS316L
- Methodology for diagnosing hydraulic oil in production machines with the additional use of microfiltration
- Special Issue: IETAS 2024 - Part II
- Enhancing communication with elderly and stroke patients based on sign-gesture translation via audio-visual avatars
- Optimizing wireless charging for electric vehicles via a novel coil design and artificial intelligence techniques
- Evaluation of moisture damage for warm mix asphalt (WMA) containing reclaimed asphalt pavement (RAP)
- Comparative CFD case study on forced convection: Analysis of constant vs variable air properties in channel flow
- Evaluating sustainable indicators for urban street network: Al-Najaf network as a case study
- Node failure in self-organized sensor networks
- Comprehensive assessment of side friction impacts on urban traffic flow: A case study of Hilla City, Iraq
- Design a system to transfer alternating electric current using six channels of laser as an embedding and transmitting source
- Security and surveillance application in 3D modeling of a smart city: Kirkuk city as a case study
- Modified biochar derived from sewage sludge for purification of lead-contaminated water
- The future of space colonisation: Architectural considerations
- Design of a Tri-band Reconfigurable Antenna Using Metamaterials for IoT Applications
- Special Issue: AESMT-7 - Part II
- Experimental study on behavior of hybrid columns by using SIFCON under eccentric load
- Special Issue: ICESTA-2024 and ICCEEAS-2024
- A selective recovery of zinc and manganese from the spent primary battery black mass as zinc hydroxide and manganese carbonate
- Special Issue: REMO 2025 and BUDIN 2025
- Predictive modeling coupled with wireless sensor networks for sustainable marine ecosystem management using real-time remote monitoring of water quality
- Management strategies for refurbishment projects: A case study of an industrial heritage building
- Structural evaluation of historical masonry walls utilizing non-destructive techniques – Comprehensive analysis