Functions of changes in the mechanical properties of reinforcing steel under corrosive conditions
-
Faustyn Recha

 ,
Katarzyna Łuczak
,
Katarzyna Łuczak

Abstract
Corrosion of internal steel reinforcement is one of the main reasons causing reinforced concrete (RC) structure degradation. In order to safely use and extend the durability of the structure, it is important to understand the corrosion mechanism of steel and its influence on the RC structure. Presented research in this article covers a study on the durability of reinforcing steel in strong aggressive environments condition, induced by different concentrations of chloride ions. The main aim of the research was to determine the course of changes in the mechanical properties of reinforcing steel exposed to different environmental conditions as well as its treatments (i.e., simulate the concrete cover). A current experimental investigation was carried out for reinforcing steel with an initial yield strength of 500 MPa, as such steel is currently commonly used in RC structures. The study demonstrated that changes in steel bar parameters depended on the concentration of the aggressive agent (Cl − ions) and the presence of concrete cover. The largest changes in yield strength (over 28 %) and reduction in tensile strength (over 32 %) were obtained in an environment with a 6 % NaCl concentration for samples without concrete cover. For the same environment, a reduction in Young’s modulus of over 10 % of the initial value was observed. Furthermore, functions representing the relationship between the concentration of chloride ions on the surface of the tested reinforcement samples and the mechanical parameters of the steel were evaluated. The presented empirical functions are an original element of this article, not published so far. Thanks to this, it is possible to estimate changes in the properties of reinforcing steel based on the reading of chloride ion concentration in RC structures. Additionally, the structure of the material subject to corrosion processes was analyzed using scanning electron microscopy (SEM) to assess the degradation and corrosion progress of tested steel bars. The obtained experimental results highlighted the corrosion influence of steel bars for RC structures.
Nomenclature
- m0.i
-
initial mass of rebar
- mt
-
final mass of rebar
- Δm
-
mass loss
- Δmavg
-
average mass loss
- Δmp
-
percentage mass loss
- α corr
-
corrosion degree
- P
-
ultimate force
- σ
-
ultimate stress
-
-
average ultimate stress
- fy
-
yielding strength
- fy,avg
-
average yielding strength
- Δfy,avg
-
average differences of yielding strength between specimens investigated in control and tested environments
-
-
percentage difference of Δfy,avg
- fm
-
ultimate strength
- fm,avg
-
average ultimate strength
- Δfm,avg
-
average differences of ultimate strength between specimens investigated in control and tested environments
-
-
percentage difference of Δfm,avg
- εy
-
yielding strains
- ε y,avg
-
average yielding strains
- Δεy,avg
-
average differences of yielding strains between specimens investigated in control and tested environments
-
-
percentage difference of Δεy,avg.
- Es
-
elastic module
- Es,avg
-
average elastic module
- ΔEs,avg
-
average differences of elastic module between specimens investigated in control and tested environments
-
-
percentage difference of ΔEs,avg,i.
- ky,3
-
steel yield strength ratios of samples without and with concrete cover for a concentration of 3 % chloride ions
- ky,6
-
steel yield strength ratios of samples without and with concrete cover for a concentration of 6 % chloride ions
- km,3
-
steel ultimate strength ratios of samples without and with concrete cover for a concentration of 3 % chloride ions
- km,6
-
steel ultimate strength ratios of samples without and with concrete cover for a concentration of 6 % chloride ions
- cCl
-
concentration of chloride ions
- x i
-
i-th value of variable x (e.g. for fy, f m , ε y)
1 Introduction
The problems of corrosion caused by the release of chloride ions into the concrete cover of reinforced concrete (RC) structures are the subject of many publications [1], [2], [3], [4], [5], [6], and scientific monographs [7], 8]. The effect of the chloride-induced corrosion process for case the steel reinforcement, apart from the degradation of the reinforcing bars affecting the load-bearing capacity of the structural elements, is also cracking of the concrete cover [9], [10], [11], [12], [13] which leads to the reduction of adhesion at the interface of steel-concrete [14], [15], [16], [17] and degradation of the basic mechanical parameters of steel bars itself [18], [19], [20], [21], [22]. RC structures affected by the corrosion of the internal steel reinforcement are subjected to the decrease of designed load-bearing capacity which influences the durability of the structural elements [23], 24], as well as leads to abnormal deflections [25], [26], [27], [28]. Additionally, corrosion of internal steel reinforcement significantly increases the maintenance cost of the structure [29], 30].
Among available research on the assessment of the chloride impact on the mechanical parameters of steel, studies conducted by Moreno et al. [20] and Zhu et al. [31] provide important insights on reducing the yield strength of steel caused by chloride corrosion. Moreno et al. [20] in his research, presented the formulation of a mathematical model, describing the relationship between the mechanical properties of certain corrosion of steel and its reduction in bar diameter. While Zhu et al. [31] article presents a detailed analysis of the impact of the corrosion degree and its morphology in terms of the long corrosion exposure process, reaching 26–28 years. Both works are based on the analysis of the degree of corrosion represented by the loss of reinforcement mass, which is problematic when analyzing existing structures without invasive tests. The methodology proposed in this paper is based on the dependencies of changes in the mechanical parameters of steel as a function of the concentration of chloride ions in concrete and in corroded areas, the measurement of which is a much simpler test.
Analyzing the available publications, it can be noticed that a relatively small group of research [32], 33]concerns the assessment of the chloride ions influence on the evolution of the elastic modulus as a function of the intensity of corrosion processes and time. The research in this field presented in [32] was performed for steel with an initial yield strength not exceeding 400 MPa. Currently, steels with higher material parameters are commonly used in RC structures, which indicates the need to conduct further investigation for steel with an initial yield strength of 500 MPa and higher.
Based on the above background, current work presents extensive research on the impact of an aggressive environment characterized by variable chloride ion concentration on the evolution of the mechanical properties of reinforcing steel. The tests were performed for reinforcing steel with an initial yield strength of 500 MPa (currently commonly used in RC structures), which fulfills the current knowledge gaps in this field. Furthermore, this research presents the formulation of analytical relationships between the concentration of chloride ions on the surface of the tested reinforcement samples and the mechanical properties of the steel. As part of the research carried out, scanning electron microscopy (SEM) allowed to evaluate the surfaces properties of tested samples on which corrosion processes were forced. Conducted analyses were carried out by comparing the results obtained for analogous specimens of reinforcing bars performed in a neutral (i.e., control) environment.
2 Experimental tests program
The test program consisted of 23 ribbed steel bars made of B500SP steel, which the chemical composition is given in Table 1. The nominal diameter of samples was Ø8 mm and its a length of 200 mm (scenarios A-D) and 250 mm (scenarios E and F). Six different variants of environmental impact were adopted in the current study. Series A serves as a control group corresponding to the air-dry conditions and consists of three rebars. The air-dry samples were stored in laboratory conditions (inside a closed room) where they had no access to external conditions. Under these conditions, the impact of corrosion was assumed to be negligible, so no changes were noted in Table 2. Another four bars were immersed in tap water (scenario B), and the next two series of four bars each were immersed in a solution of 3 % and 6 % sodium chloride NaCl, respectively (scenarios C and D). The last two series were embedded in concrete (i.e., to simulate concrete cover) to which an aqueous solution of chloride ions Cl− was added at the stage of preparing the concrete mixture, also with a concentration of 3 % and 6 %, respectively (scenarios E and F). These samples were encased in concrete with a diameter of approximately 60 mm, thus ensuring a reinforcement cover of approximately 25 mm. The concrete section covered the center of the reinforcing bars at a length of 80 mm, as presented in Figure 1. The proposed method of simulating the corrosion process was aimed at maximally reflecting the course of natural corrosion, and in the case of samples E and F, omitting the time necessary for chloride ion dissipation. A detailed summary of the test samples with the gravimetric analysis results for all variants of environmental aggression are presented in Table 2.
Chemical composition of B500SP reinforcing steel as declared by the manufacturer.
| Assay | Maximum content of elements (%) | C eq.max (%) | ||||||
|---|---|---|---|---|---|---|---|---|
| C | Mn | Si | P | S | Cu | N | ||
| Steel smelting | 0.220 | 1,600 | 0.550 | 0.050 | 0.050 | 0.800 | 0.012 | 0.500 |
| Finished product | 0.240 | 1,650 | 0.600 | 0.055 | 0.055 | 0.850 | 0.013 | 0.520 |
-
C – carbon, Mn – manganese, Si – silicon, P – phosphorus, S – sulfur, Cu – copper, N – nitrogen, C eq.max – carbon equivalent, according to [1].
Summary of tested samples, treatments, and gravimetric results.
| Scenario | Treatment condition | Sample | m 0,i (g) | m t,i (g) | Δm i (g) | S i (−) | Δm avg,i (g) | Δm p,i (%) | α corr,i (%) |
| A | Air-dry (control) | P 1 | 77.13 | 77.13 | 0.00 | 0.000 | 0.00 | 0.00 | 0.00 |
| P 2 | 78.36 | 78.36 | 0.00 | 0.00 | |||||
| P 3 | 78.66 | 78.66 | 0.00 | 0.00 | |||||
| B | Tap water | P 4 | 77.76 | 76.29 | 1.47 | 0.4187 | 1.04 | 1.89 | 1.33 |
| P 5 | 77.74 | 76.77 | 0.97 | 1.25 | |||||
| P 6 | 79.62 | 78.29 | 1.33 | 1.68 | |||||
| P 7 | 78.11 | 77.72 | 0.39 | 0.50 | |||||
| C | 3 % NaCl water solution | P 8 | 78.05 | 76.70 | 1.35 | 0.1565 | 1.24 | 1.73 | 1.61 |
| P 9 | 77.39 | 76.38 | 1.01 | 1.30 | |||||
| P 10 | 75.20 | 73.79 | 1.41 | 1.88 | |||||
| P 11 | 76.24 | 75.06 | 1.18 | 1.55 | |||||
| D | 6 % NaCl water solution | P 12 | 78.12 | 76.89 | 1.23 | 0.2765 | 1.54 | 1.58 | 1.96 |
| P 13 | 77.70 | 76.13 | 1.57 | 2.0 | |||||
| P 14 | 79.05 | 77.67 | 1.38 | 1.75 | |||||
| P 15 | 79.13 | 77.16 | 1.97 | 2.49 | |||||
| E | Concrete cover and 3 % NaCl water solution | P 16 | 97.56 | 96.96 | 0.60 | 0.1194 | 0.74 | 0.61 | 0.76 |
| P 17 | 96.71 | 96.01 | 0.70 | 0.73 | |||||
| P 18 | 96.19 | 95.26 | 0.93 | 0.97 | |||||
| P 19 | 98.00 | 97.26 | 0.74 | 0.75 | |||||
| F | Concrete cover and 6 % NaCl water solution | P 20 | 99.13 | 98.00 | 1.13 | 0.1600 | 1.30 | 1.14 | 1.34 |
| P 21 | 98.38 | 97.19 | 1.19 | 1.21 | |||||
| P 22 | 97.14 | 95.60 | 1.54 | 1.58 | |||||
| P 23 | 95.52 | 94.15 | 1.37 | 1.43 |
-
m 0.i is the initial mass of rebar; m t.i is final mass of rebar; Δm i is mass loss; s i is population standard deviation Δm avg.i is average mass loss; Δm p.i is percentage mass loss; α corr.i – corrosion degree.
Samples before testing: a) Scenario B, b) scenario C, c) scenario D; after testing: d) Scenario E, e) scenario F).
The concrete used in this study were made with sand of fraction 0–2 mm, washed aggregate with granulation of 2–8 mm, and Portland cement CEM I, 42.5 N. The concrete was mixed with the ratio of 0.54/1.00/1.23/4.92, corresponding to water/cement/sand/aggregate. Table 3 summaries the properties of concrete used as a cover for steel bars in scenarios E and F. Based on the Eurocode standard [34], the used concrete can be classified as C40/50. For each research variant, four identical samples were prepared and then subjected to uniaxial compression in the Cyber-Plus Evolution testing machine. After 24 h from casting the concrete, samples of E and F scenarios were placed in the same solutions of chloride ions concentrations as during the preparation of the concrete mixture, thus the chloride ions were not extracted. All concrete specimens were cured over 28 days before any testing was conducted.
Mechanical properties of concrete used as a cover for steel rebars.
| Scenario | Sample | Dimension (mm) | P i (kN) | σ i (MPa) |
|
|---|---|---|---|---|---|
| E (3 % NaCl) | C E,1 | 150 × 150 | 1143.43 | 50.82 | 51.40 |
| C E,2 | 1140.63 | 50.69 | |||
| C E,3 | 1191.91 | 52.97 | |||
| C E,4 | 1150.02 | 51.11 | |||
| F (6 % NaCl) | C F,1 | 150 × 150 | 1182.56 | 52.56 | 51.05 |
| C F,2 | 1153.02 | 51.25 | |||
| C F,3 | 1088.27 | 48.37 | |||
| C F,4 | 1170.36 | 52.02 |
-
P i is the ultimate force; σ i is ultimate stress;
The total duration of presented study for all variants was 12 months. After this time, the samples were removed from the solutions (scenarios B, C, and D), the concrete covers were split (in the case of scenarios E and F) and a gravimetric analysis was performed again, separately for each bar. The weight loss of the bars was determined based on the difference between the initial mass m 0 and the mass m t weighed after de-rusting the bars in phosphoric acid and mechanical cleaning. The difference in Δm measurements was the actual loss of reinforcement mass (Eq. (2)), which was also converted into a percentage loss of Δm p and the degree of corrosion α corr , based on the following equations accordingly [3], 4]:
where Δm i is a real loss of reinforcement mass, Δm p,i is the percentage loss of reinforcement mass, m 0,i is the initial mass (before starting the test), m t,i is the final mass (after the test), Δm avg,i is the ratio of the average loss of reinforcement mass for each tested environment to the average initial mass in the analyzed environment m 0,avg,i .
The corroded bars from different scenarios were subjected to a static tensile test in a Quasar testing machine under laboratory conditions. After curing in a salt solution, the concrete cover was split (scenario E and F) and only the sections within the concrete cover were tested. The remaining reinforcement was cut off before testing in a tensile testing machine. Figure 2 presents the corroded bars and testing machine.
Stages of steel rebars during the study: a) Immersed in the solution (scenario C), b) dried out after immersion period (scenario C), c) steel rebar after removing concrete cover (scenario E) d) tensile testing machine.
Based on the conducted static tensile tests of reinforcing steel samples, the results of the actual yield strength f y,i , ultimate tensile strength f m,i and strain (measured through strain gauges attached to rebar) at the moment of yielding ε y,i were obtained separately for each tested sample. Measurements of individual sample elongations, which served as the basis for determining bar deformations, were automatically measured using a measuring system implemented in the testing machine. The rate of increase in crosshead elongation was adopted in accordance with Method A of the ISO 6892 standard [35], minimizing measurement uncertainty of the test results. Then, for each corrosion environment (test variants A-E), the average values of the actual yield strength f y,avg , ultimate tensile strength f m,avg and strain at the moment of plasticization ε y,avg were determined. Exceptionally, for variant B (samples placed in tap water), the average value was determined for three samples P4, P5, P7. Sample P6 was not included, due to the significant deviation of this sample compared to obtained stress values from other samples in this group, which could distort the result of the entire study in this series.
The obtained average values f y,avg , f m,avg , ε y,avg for each variant of environmental aggression were compared with the average result obtained for the control samples in the absence of any corrosion aggression, respectively f y,avg,A , f m,avg,A , ε y,avg,A . For comparison purposes, absolute differences of the analyzed parameters (i.e., Δf y,avg,i , Δf m,avg,i , Δε y,avg,i ) were determined based on the following equations [5], [6], [7]:
The percentage share of the resulting changes
Table 4 detailed summarized the test result for each tested bar, with the minus (−) sign corresponding to a decrease in a given parameter, and the plus (+) sign corresponding to its increase.
Yielding, ultimate strengths, and corresponding strains of all tested samples.
| Scenario | Treatment condition | Sample | f y,i | f y,avg | Δf y,avg |
|
f m,i | f m,avg | Δf m,avg |
|
ε y,i | ε y,avg | Δε y,avg |
|
|---|---|---|---|---|---|---|---|---|---|---|---|---|---|---|
| (MPa) | (MPa) | (MPa) | (%) | (MPa) | (MPa) | (MPa) | (%) | (10−3) | (10−3) | (10−3) | (%) | |||
| A | Air-dry (control) | P 1 | 550.65 | 540.52 | 0.00 | 0.00 | 638.93 | 617.54 | 0.00 | 0.00 | 3.40 | 3.17 | 0.00 | 0.00 |
| P 2 | 532.64 | 605.13 | 3.00 | |||||||||||
| P 3 | 538.26 | 608.56 | 3.10 | |||||||||||
| B | Tap water | P 4 | 521.89 | 517.26 | −23.26 | −4.30 | 621.22 | 614.24 | −3.30 | −0.53 | 3.10 | 2.90 | −0.27 | −8.52 |
| P 5 | 517.12 | 618.00 | 2.80 | |||||||||||
| P 6 | 352.61 | 446.28 | 1.10 | |||||||||||
| P 7 | 512.77 | 603.50 | 2.80 | |||||||||||
| C | 3 % NaCl water solution | P 8 | 508.34 | 485.49 | −55.03 | −10.18 | 503.34 | 499.37 | −118.17 | −19.14 | 3.10 | 2.75 | −0.42 | −13.25 |
| P 9 | 513.82 | 512.79 | 2.80 | |||||||||||
| P 10 | 398.14 | 461.92 | 2.50 | |||||||||||
| P 11 | 521.67 | 519.43 | 2.60 | |||||||||||
| D | 6 % NaCl water solution | P 12 | 392.16 | 385.76 | −154.76 | −28.63 | 472.55 | 419.56 | −197.98 | −32.06 | 1.80 | 2.13 | −1.04 | −32.81 |
| P 13 | 341.86 | 332.11 | 1.80 | |||||||||||
| P 14 | 346.24 | 389.63 | 1.70 | |||||||||||
| P 15 | 462.76 | 483.96 | 3.20 | |||||||||||
| E | Concrete and 3 % NaCl solution | P 16 | 517.67 | 519.95 | −20.57 | −3.81 | 550.18 | 584.62 | −32.92 | −5.33 | 3.20 | 3.23 | 0.60 | 1.89 |
| P 17 | 515.31 | 548.93 | 3.00 | |||||||||||
| P 18 | 468.15 | 591.54 | 3.40 | |||||||||||
| P 19 | 578.66 | 647.82 | 3.30 | |||||||||||
| F | Concrete and 6 % NaCl solution | P 20 | 503.10 | 500.19 | −40.33 | −7.46 | 593.47 | 572.83 | −44.71 | −7.24 | 3.40 | 3.58 | 0.41 | 12.93 |
| P 21 | 508.62 | 591.32 | 3.60 | |||||||||||
| P 22 | 499.63 | 568.24 | 3.80 | |||||||||||
| P 23 | 489.39 | 538.29 | 3.50 |
Recorded stress and corresponding strain measurements during the tensile tests on corroded samples allowed for the generation of stress-strain (σi − εi) graphs for each tested sample. Figures 3 and 4 present stress-strain graphs for each steel bar in groups A, B, C, and D, E, and F, respectively. In most cases, very similar, nearly identical stress values were obtained for the individual test scenarios, confirming the accuracy of the conducted study. The assumed initial values oscillated around 150 MPa and were referred to the strain at a stress of 450 MPa. In individual cases, other values were selected to be appropriate for the elastic range. By knowing the adequate stress-strain relationship, it was possible to determine the actual elastic modulus (E s.i ), as the ratio of differences in stresses Δσ 21.i and corresponding strains Δε 21.i from the elastic part of table 4 (Eq. (11)):
where σ 1.i ,σ 2.i and ε 1.i ,ε 2.i are the values of stresses and strains representative of the elastic phase, respectively. Figure 5 graphically represents the concept of evaluating the elastic modulus from conducted tensile tests.

Stress-strains relationships for testes samples – scenarios A, B, C.
Stress-strains relationships for all tested samples – scenarios D, E, F.

Schematic procedure for obtaining the elastic modulus of tested steel bars on the example of sample P 1.
Same as in the case of the bar’s yielding/ultimate strength, the average values of elastic modulus E s,avg was determined separately for each bar of every scenario. Furthermore, the change in the average elastic modulus for different scenarios (i.e., environmental conditions), represented by the absolute value (ΔE s,avg,i ), were determined by the difference between the average elastic modulus of control scenario A (i.e., air-dry condition) and the average elastic modulus of the corresponding group according to the equation [12]:
Then, the percentage decrease in the elastic modulus
The same analogy of labeling as in case of yielding/ultimate tensile strength was applied to the analysis of elastic modulus results, which assumed that the minus (−) sign corresponds to a decrease in the parameter and at the same time no positive results were obtained that would indicate an increase in the analyzed parameter. As a consequence of the unrepresentative result of the tensile strength test, sample P 6 was also rejected (more than 65 % deviation from the average of the remaining results in the B scenario studies). A list of representative values defining the elastic range of the tested samples in accordance with the equation [11] and the values of the reduced elastic modulus obtained for each variant of environmental aggression are summarized in Table 5.
Stresses, corresponding strains, and elastic modulus of all tested samples.
| Treatment condition | Sample | σ 1,i | σ 2,i | ε 1,i | ε 2,i | Δσ ,i | Δε ,i | E s,i | E s,avg,i | ΔE s,avg,i |
|
|---|---|---|---|---|---|---|---|---|---|---|---|
| (MPa) | (MPa) | (10−3) | (10−3) | (MPa) | (10−3) | (GPa) | (GPa) | (GPa) | (%) | ||
| Air-dry (control) | P 1 | 149.54 | 500.34 | 1.39 | 3.13 | 350.80 | 1.74 | 201.91 | 202.89 | 0.00 | 0.00 |
| P 2 | 150.04 | 500.77 | 1.11 | 2.86 | 350.74 | 1.75 | 200.02 | ||||
| P 3 | 150.66 | 500.91 | 1.35 | 3.04 | 350.25 | 1.69 | 206.75 | ||||
| Tap water | P 4 | 150.76 | 499.59 | 1.14 | 2.97 | 348.83 | 1.83 | 190.96 | 195.17 | −7.72 | −3.81 |
| P 5 | 149.40 | 499.18 | 1.04 | 2.81 | 349.78 | 1.78 | 196.70 | ||||
| P 6 | 149.40 | 300.65 | 0.54 | 1.00 | 151.25 | 0.46 | 326.91 | ||||
| P 7 | 150.70 | 501.24 | 1.12 | 2.90 | 350.54 | 1.77 | 197.85 | ||||
| 3 % NaCl water solution | P 8 | 149.93 | 500.12 | 1.13 | 3.04 | 350.20 | 1.92 | 182.77 | 187.30 | −15.60 | −7.69 |
| P 9 | 150.10 | 500.86 | 1.10 | 2.91 | 350.76 | 1.81 | 194.11 | ||||
| P 10 | 150.89 | 350.74 | 1.23 | 2.34 | 199.84 | 1.11 | 180.36 | ||||
| P 11 | 149.76 | 501.02 | 1.18 | 3.01 | 351.26 | 1.83 | 191.95 | ||||
| 6 % NaCl water solution | P 12 | 150.87 | 349.55 | 0.84 | 1.87 | 198.69 | 1.03 | 192.95 | 181.05 | −21.85 | −10.77 |
| P 13 | 150.32 | 300.15 | 0.95 | 1.75 | 149.84 | 0.80 | 187.44 | ||||
| P 14 | 149.95 | 300.83 | 0.98 | 1.78 | 150.88 | 0.80 | 188.18 | ||||
| P 15 | 150.29 | 400.55 | 1.41 | 3.02 | 250.26 | 1.61 | 155.61 | ||||
| Concrete and 3 % NaCl solution | P 16 | 150.62 | 499.83 | 1.26 | 3.04 | 349.21 | 2.00 | 195.65 | 192.57 | −10.32 | −5.09 |
| P 17 | 149.87 | 500.23 | 1.32 | 3.12 | 350.36 | 2.00 | 194.64 | ||||
| P 18 | 149.32 | 499.16 | 1.36 | 3.24 | 349.84 | 2.00 | 186.09 | ||||
| P 19 | 150.75 | 501.99 | 1.43 | 3.24 | 351.25 | 2.00 | 193.91 | ||||
| Concrete and 6 % NaCl solution | P 20 | 299.42 | 501.99 | 2.14 | 3.18 | 202.58 | 1.00 | 193.50 | 184.74 | −18.16 | −8.95 |
| P 21 | 150.20 | 501.21 | 1.40 | 3.26 | 351.01 | 2.00 | 188.26 | ||||
| P 22 | 149.85 | 499.36 | 1.31 | 3.28 | 349.51 | 2.00 | 177.42 | ||||
| P 23 | 149.66 | 500.21 | 1.31 | 3.26 | 350.55 | 2.00 | 179.77 |
-
σ 1,i, σ 2,i – stresses at two consecutive reference points; ε 1,i, ε 2,i – strains at two consecutive reference points. Δσ,i – increment’s stress, Δε,i – increment’s strains, Es,i – Young’s module, Es,avg.i – average Young’s module, ΔEs,avg.i – average differences of Young’s module between specimens investigated in control and tested environments,
3 Microscopic analysis
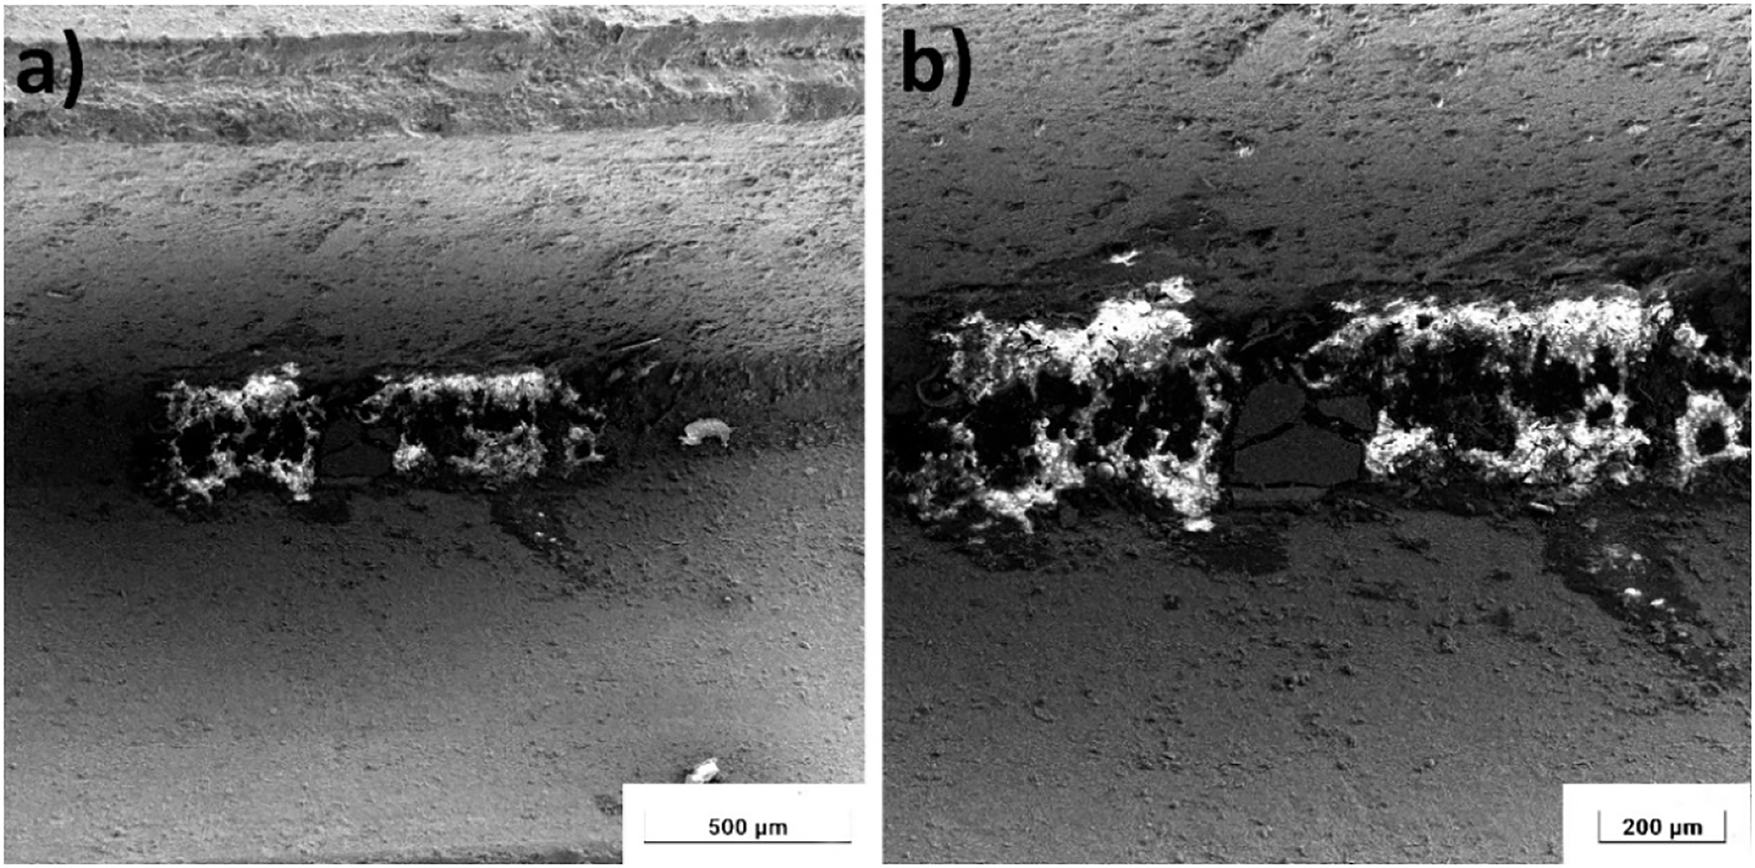
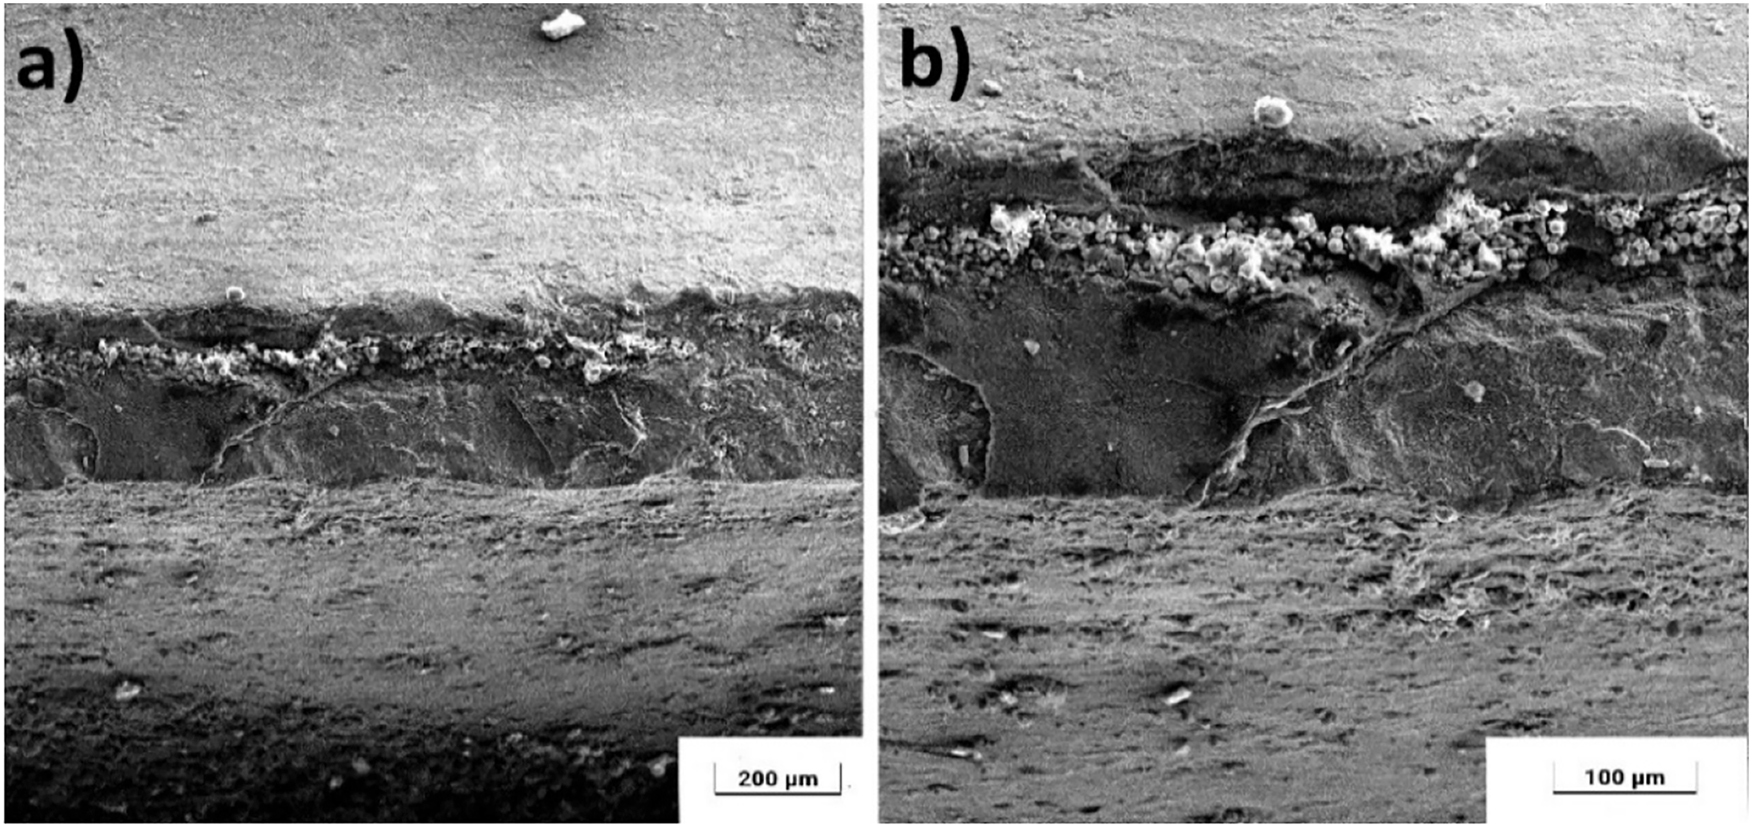
To accurately assess damage caused by chloride ions, the side surfaces of corroded test specimens placed in aggressive environments were subjected to structural analysis. Observations of the surfaces of the elements were carried out using a scanning electron microscope (SEM). Structural observations confirmed the presence of damage on the steel surface exposed to the direct action of chloride ions Cl −. Figure 6 clearly shows the surface damage of several hundred μm, around which corrosion products were accumulated in the form of a mixture of iron chlorides FeCl 2 and hydroxides Fe(OH)2 and Fe(OH)3. Moreover, there were small micro-damages and larger pits on the bar’s surface, as shown in Figure 7. These damages are particularly visible in a solution with a higher concentration of chloride ions simulated with an aqueous solution of 6 % sodium chloride NaCl (series F). These pits are local and concentrated in single places. The propagation of damage and the resulting corrosion pits take the form of oval depressions and are arranged along the reinforcement axis, which confirms the analyses presented in the work [36].
SEM analysis of sample P9 after immersion in 3 % NaCl solution: a) Corrosion products accumulation, b) surface defects.
Corrosion pit area on the surface of rebar after immersion in 6 % NaCl solution: a) a pattern of pits along the rebar’s axis at 160x magnification, b) a single corrosion pit at 300x magnification.
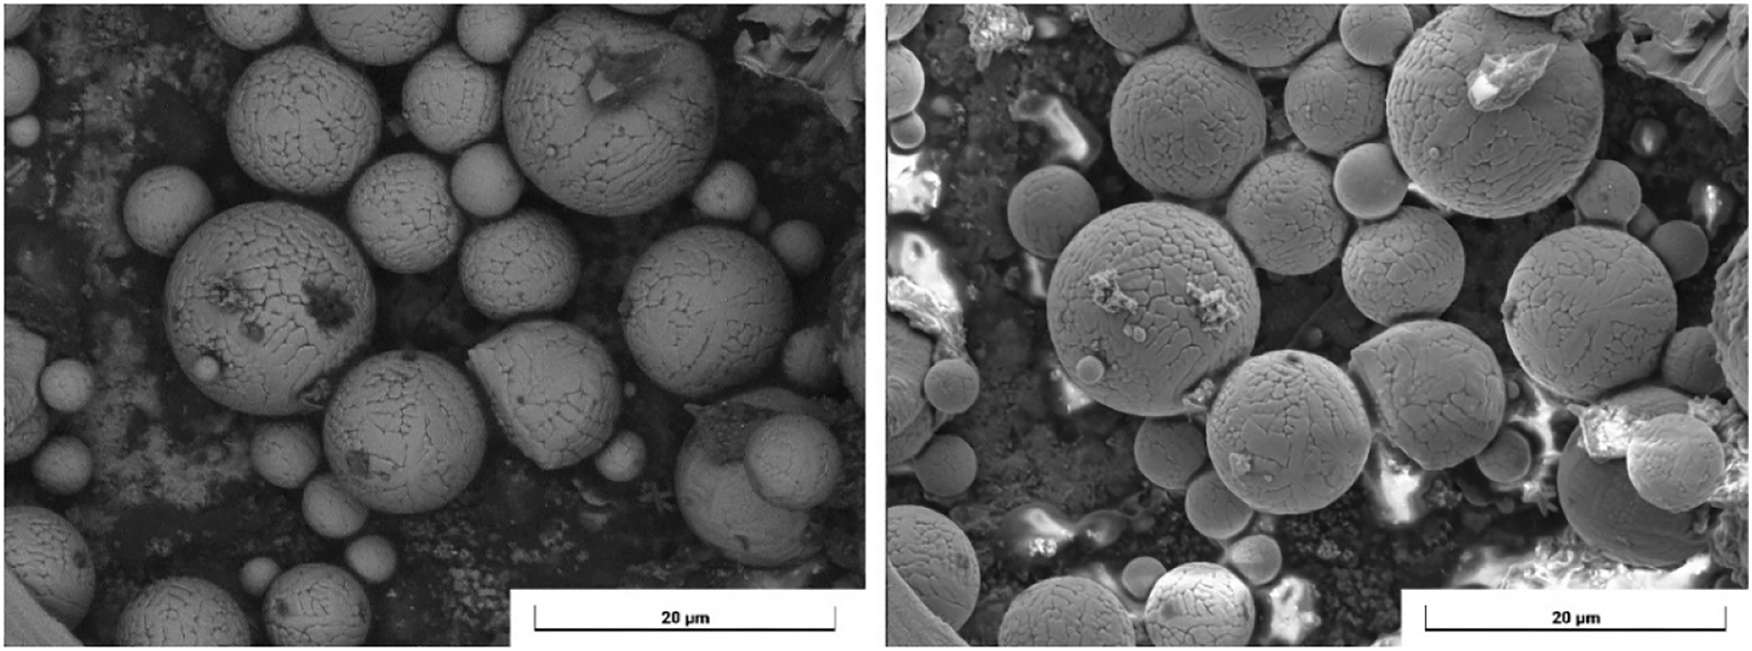
During the scanning analysis, local clusters of small damages to the passive layer were found in the vicinity of the steel ribs. This is related to the higher concentration of chloride ions in this area, which results in the accumulation of damage as shown in Figure 8. The local accumulation of chloride ions Cl − causes damage to the passive layer of iron trioxide γ-Fe 2 O 3 and their migration deep into the material structure. The morphology of the steel surface made using the Back Scattered Electron (BSE) signal technique is shown in Figure 9. Chloride ions Cl − are visible, breaking the continuity of the passive layer and penetrating into it, causing individual damage to the iron particles.
The surface of the rod within the ribs of steel in aqueous solutions: a) 3 % NaCl, b) 6 % NaCl.
The structure of the rod surface at the atomic level.
4 Parameters’ evolution of steel B500SP
Changes in elastic modulus strongly depend on the impact and intensity of external environment aggression. For the samples that remained in the neutral state, the average elastic modulus was determined to be 202.89 GPa. In the case of samples immersed only in clean tap water, an average elastic modulus of 195.17 GPa was obtained (a decrease of 3.81 % compared to the control value). For test specimens immersed in aqueous solutions of three and 6 % NaCl, a mean elastic modulus of 187.30 and 181.05 GPa were obtained, respectively, corresponding to a reduction of 7.69 and 10.77 %. For the steel bars from scenarios E and F, in which environmental aggression was simulated by placing chlorides in the concrete cover at concentrations of 3 and 6 %, the average values of elastic moduli were 192.57 and 184.74 GPa, respectively. The value of elastic modulus for those samples noted a reduction of 5.09 and 8.95 % compared to the initial value in the neutral state. All the details regarding properties of the steel bars after testing are summarized in Table 3. Based on the conducted analysis, it is observed a positive impact of concrete cover on the change in steel reinforcement parameters. For each analyzed variant of the mechanical properties, the concrete cover reduces the rate of change of a given parameter over time.
In the case of environmental aggression simulated only by completely immersing the test samples in water, a slight decrease in the yield strength was obtained, reaching an average of 4.30 %, while the reduction in ultimate strength was almost unchanged compared to the results obtained for the control samples (0.53 % decrease). However, two remaining scenarios C and D showed a strong influence of chloride ions simulated by aqueous NaCl solutions with concentrations of 3 and 6 % on the obtained results. In the case of scenario C (3 % NaCl), the decrease in the steel yield strength was 10.18 %, while the reduction in the ultimate tensile strength of steel was reduced by 19.14 %. A similar situation was observed for 6 % NaCl concentrations, for which the reduction in the yield strength was 28.63 %, and the ultimate tensile strength was reduced by 32.06 % compared to the specimens from group A (see Table 2). Analyzing the above changes and the shape of the graphs (see Figure 5), it can be seen that increasing the concentration of chloride ions in contact with the reinforcing steel results in a decrease in the material strength/durability, which occurs after achieving the plastic stage. There is usually a situation in which the stress at the yield point is close to the stress responsible for the tensile failure of the steel. Consequently, the reinforcement does not have a plastic reserve, and the failure occurs suddenly, as a result of a brittle crack without visible narrowing.
The experimental outcome of the specimens from scenarios E and F, demonstrate a significant influence of the concrete cover on the change in the mechanical properties of steel bars subjected to a corrosive environment. In the case of samples with a concrete cover, changes in both the yield and ultimate tensile strength were analogous to those in the case of bars without a cover. A decrease in the yield strength of reinforcing steel was observed here by 3.81 % for the environmental aggression scenario E (3 % NaCl in the concrete cover) and 7.46 % for the environmental aggression simulated in scenario F (6 % NaCl in the concrete cover). The reduction in ultimate tensile strength for these variants was reduced by 5.33 and 7.24 %, respectively, compared to the initial value determined in the air-dry condition. It is worth noting that, the reduction in the mechanical properties of tested steel bars with concrete cover was proportionally smaller than that in the case of samples without cover. The concrete cover significantly impacts the mechanical behavior of steel reinforcement. This can be clearly demonstrated by comparing the ratio of yield and ultimate strength of samples without cover to those with concrete cover, under the same environment’s treatments and the same chloride ion concentrations according to the equations [14], [15], [16], [17]:
where k y,3, k y,6 are the ratios of the steel yield strength of samples without and with concrete cover for the environments respectively three and 6 % NaCl concentrations. Parameters k m,3, k m,6 are steel tensile strength ratios in samples without and with concrete cover for respectively three and 6 % concentrations of chloride ions. In the case of a concentration of 3 % chloride ions, the k y,3 ratio reaches 2.67, while the k y,6 increases to 3.84. Even more significant changes are observed when analyzing the ultimate tensile strength of steel. The ratio of ultimate tensile strength for samples without and with a concrete cover, k m,3 reaches 3.59 at a 3 % NaCl concentration, and k m,6 is 4.43 at a 6 % NaCl concentration. Therefore, it is necessary to ensure a tight concrete cover even in the event of ongoing and developing corrosion processes on the steel reinforcement surface. Based on the above analysis, it is possible to obtain the relationship between changes in the mechanical properties of reinforcement steel with electrode processes occurring on its surface, which strongly depends on the concentration of chloride ions in this area. In order to determine the functional relationships between the increase in the concentration of Cl − ions and the evolution of individual material parameters, linear trend functions were determined showing the course of parameter changes for each analyzed environment. The trend functions are graphically presented in Figure 10.
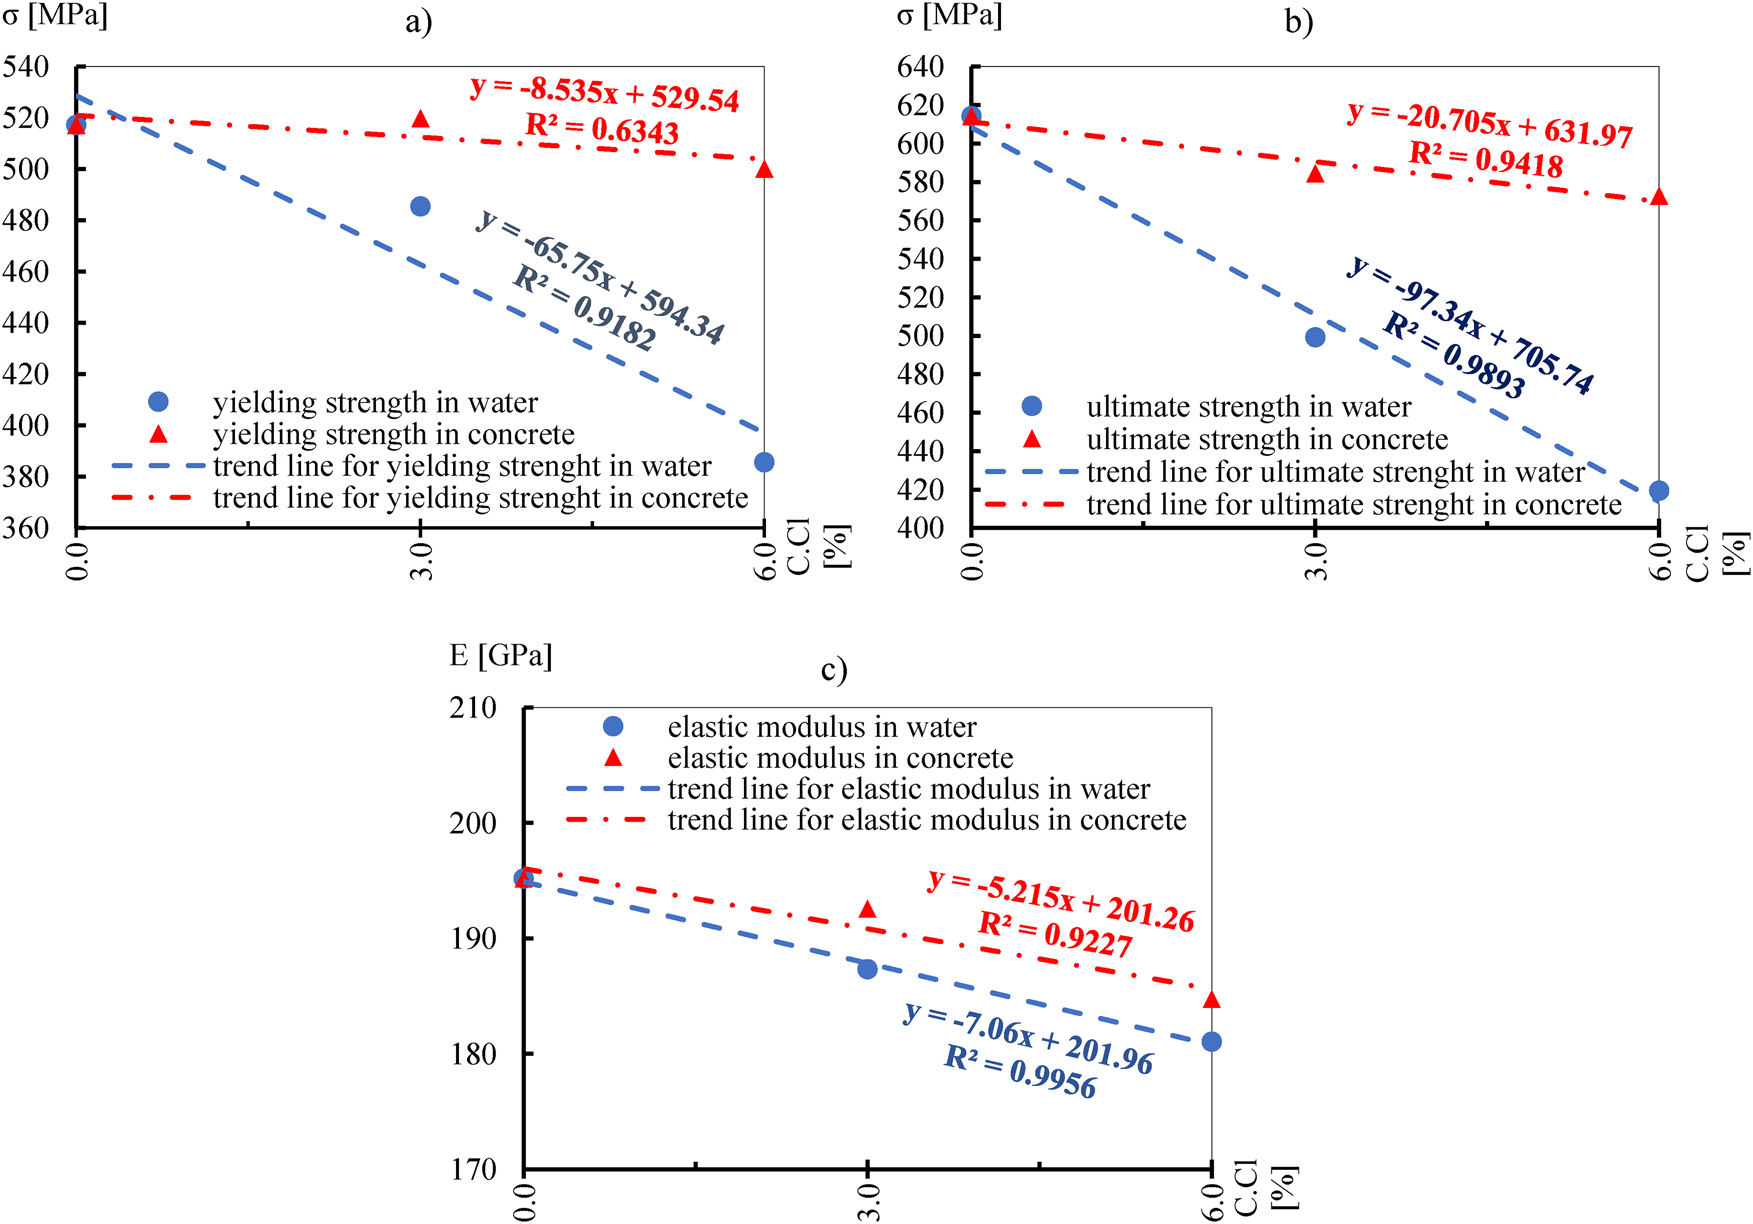
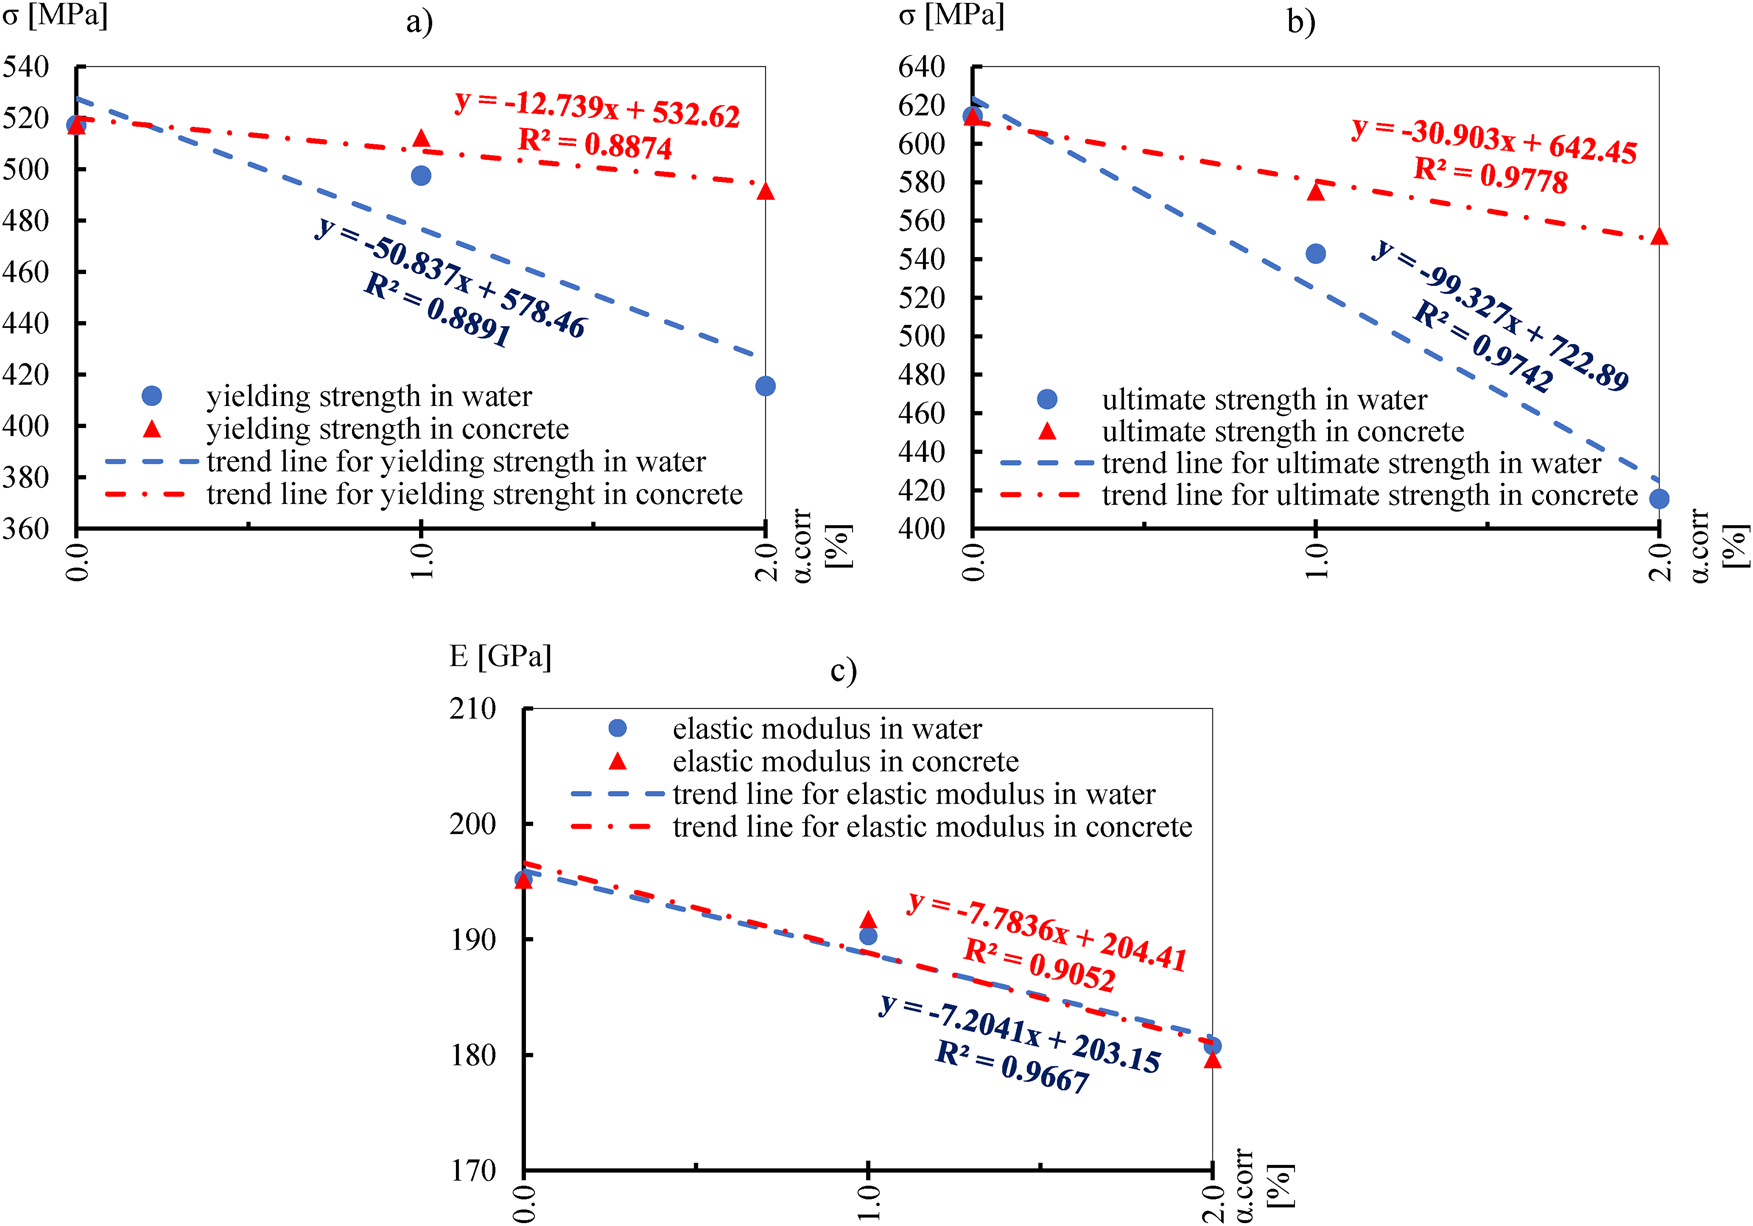
Graphic representation of correlations between mechanical properties of steel rebars and chloride ions for a) yielding strength, b) ultimate strength, and c) elastic modulus.
The functions describing the course of the trend line can be directly adapted as an approximate relationship for the change of steel parameters depending on the aggression of the interacting environment. The function describing the relationships of the yield strength, ultimate strength, elastic modulus of the steel reinforcement, and concentrations of chloride ions are presented in Table 6.
Correlations between the mechanical properties of steel rebars and chloride ions (c Cl ) concentration.
| Parameter | Environment | Correlation | Coefficient of determination |
|---|---|---|---|
| Yielding strength f y,i (c Cl ) | Concrete | f y,c (c Cl ) = −8.535c Cl +529.54 MPa | R 2 = 0.6343 |
| Water | f y,w (c Cl ) = −65.75c Cl +594.34 MPa | R 2 = 0.9182 | |
| Ultimate strength f m,i (c Cl ) | Concrete | f m,c (c Cl ) = −20.705c Cl +631.97 MPa | R 2 = 0.9418 |
| Water | f m,w (c Cl ) = −97.34c Cl +705.74 MPa | R 2 = 0.9893 | |
| Elastic modulus E s,i (c Cl ) |
Concrete | E s,c (c Cl ) = −5.215c Cl +201.26 GPa | R 2 = 0.9227 |
| Water | E s,w (c Cl ) = −7.06c Cl +201.96 GPa | R 2 = 0.9956 |
In the relationship presented in Table 5, the concentration of c Cl ions should be given as a percentage. According to the trend line graphs, these values decrease with increasing chloride ion concentration, as evidenced by the negative value of the slope coefficient of the function. For all determined functions, the coefficient of determination R 2 is greater than 0.91. The exception is the function describing the change in the yield strength of steel in the area of the concrete environment, for which this coefficient R 2 is equal to 0.63. Despite the large dispersion of the obtained results, this is the best fit of the linear function in this range. In order to compare the outcome of presented functions with the works presented in [17], 32] the above results of changes in the mechanical properties of the steel reinforcement were included as a function of the corrosion degree α corr . The corrosion degree was determined based on the gravimetric analysis carried out in accordance with the equation [4]. During corrosion processes, not only does the bar lose mass, but also changes its elastic properties, represented by Young’s modulus, determined based on stresses and strains, which was the main subject of the study. Finally, these two relationships (reinforcement mass loss, represented by the α corr coefficient, with physical properties) were linked and presented as linear dependence functions in the graphs in Figure 11.
Graphic representation of correlations between mechanical properties of steel rebars and corrosion degree for a) yielding strength, b) ultimate strength, and c) elastic modulus.
Similarly to the analysis of changes in steel parameters depending on the degree of chloride ion concentration c Cl , it is also possible to determine the relationship describing the process of parameter evolution as a result of the corrosion development for the generalized corrosion degree α corr , as presented in Table 7.
Correlations between the mechanical properties of steel rebars and corrosion degree (α corr )
| Parameter | Environment | Correlation | Coefficient of determination |
|---|---|---|---|
| Yielding strength f y.i (α corr ) | Concrete | f y.c (α corr ) = −12.739α corr +532.62 MPa | R 2 = 0.8874 |
| Water | f y.w (α corr ) = −50.837α corr +578.46 MPa | R 2 = 0.8891 | |
| Ultimate strength f m.i (α corr ) | Concrete | f m.c (α corr ) = −30.903α corr +642.45 MPa | R 2 = 0.9778 |
| Water | f m.w (α corr ) = −99.327α corr +722.89 MPa | R 2 = 0.9742 | |
| Elastic modulus E s.i (α corr ) |
Concrete | E s.c (α corr ) = −7.7836α corr +204.41 GPa | R 2 = 0.9052 |
| Water | E s.w (α corr ) = −7.2041α corr +203.15 GPa | R 2 = 0.9667 |
Functions describing the changes in the steel yield strength f y (α corr ) and the steel ultimate tensile strength f m.i (α corr ) take forms very similar to the changes in the function of the concentration of chloride ions c Cl , f y.i (c Cl ) and f m (c Cl ) respectively. Changes in the value of elastic modulus determined as a function of the generalized corrosion degree E s.i (α corr ) are very similar to each other regardless of the corrosion environment. It can be explained by the fact that the elastic modulus is directly influenced by corrosion aggression initiated and then propagated by Cl − ions. To evaluate the actual corrosion degree of internal steel reinforcement, it is necessary to remove the concrete cover and then cut the rebar for the gravimetric analysis. Such measurements can significantly affect structural stability, creating a risk of collapse or permanent damage. A proper relationship between the changes in mechanical parameters of steel reinforcement and chloride ions provides estimation information of the mechanical parameters of the internal steel through non-invasive tests. It could be done by measuring the chloride ions concentration within the surface of the internal steel reinforcement, without cutting the reinforcing bars. Please note that this is only an estimate procedure and it requires further investigations, including experimental verification using advanced methods.
5 Conclusions
The current study presents the investigation of five different corrosion-related environments that affected the properties of internal steel reinforcement. One environmental aggression (scenario B) was simulated by tap water, and another two (highly acidic environments), were simulated by the 3 and 6 percent sodium chloride NaCl solutions (scenarios C and D, respectively). The last two scenarios included a concrete cover environment with a simulation of full chloride ion diffusion, which was performed by adding chlorides to the mixing water of concrete to obtain concentrations of three and 6 % NaCl. Then, after appropriate preparation of all samples, a static uniaxial tensile test and microscopic analysis were performed. The obtained results were compared with the results of tensile strength of control samples that were not exposed to any environmental aggression (they remained in an air-dry state). The conducted experiments and detailed analysis of the results gave rise to the following conclusions:
Changes in the reinforcement surface and the atomic structure of the passive layer cause local and high-intensity damage (pitting corrosion), which confirms the results obtained in the work [36]. The microscopic analysis clearly showed the degradation of the passive oxide layer on the reinforcement surface as a result of its breakdown by chloride ions which confirming the results in work [37], [38], [39], [40], [41]. The research confirmed that changes in the mechanical properties of the reinforcement result directly from the interaction of choride ions, which penetrate the passive layer.
Increasing the concentration of chloride ions in contact with the reinforcing steel results in the decreasing of material durability responsible for the post-yielding behavior. There is usually a situation in which the stress level at the yield point is close to the stress corresponding to the ultimate tensile strength of the steel. The reinforcement does not have a plastic reserve, and the failure occurs suddenly, as a result of a brittle crack without visible narrowing. Corroded steel becomes brittle because the corrosion process weakens its internal structure, creating cracks and fissures, as confirmed by microscopic scanning (SEM). Furthermore, the presence of non-metallic inclusions, such as oxides formed during corrosion processes, causes cracks, further increasing the brittleness of the steel.
The results obtained in the conducted research confirm the findings from [17], 20], 32]. In these publications, the decreases in material parameters were given depending on the percentage of corrosion, and not as a function of ion concentration, which is not practical for the structure diagnostics. The introduced functions for changes in the mechanical parameters of the internal steel reinforcement based on the concentration of chloride ions c Cl , are a much more convenient form of estimating material degradation. Furthermore, the proposed linear trend lines are to be replaced in future studies with much more accurate non-linear models, which is the next stage of research and development of the proposed methodology. Direct measurement of chloride ion concentration, followed by reference to the proposed dependence functions (Figure 10), can be particularly helpful when estimating element stiffness (e.g., for the analysis of deflections or structural deformations). Similar behavior is assumed for steels of other diameters, but direct translation of results to other diameters without further testing is not recommended.
Changes in the parameters of the steel bars depend on the concentration of the aggressive factor (Cl − ions) and the presence of concrete cover. In the case of changes in the yield strength, the maximum decrease (28.63 %) was obtained in an environment with a concentration of 6 % NaCl for elements without cover. Similarly, for the same conditions, a reduction in the ultimate tensile strength of 32.06 % was achieved. Elastic modulus also strongly depends on the concentration of chloride ions and the presence of concrete cover. The maximum reduction in elastic modulus was obtained for samples without concrete cover in a 6 % chlorine ion concentration and reached up to 10.77 % of the initial value. The resulting changes were caused by the breakdown of the passive oxide layer, which protects the reinforcement surface from initiating corrosion processes. The obtained test results confirm the proportional relationship between the increase in aggressive factors and the reduction in the protective properties of the concrete cover, and the progressive damage and changes in the mechanical parameters of the reinforcement.
Presented research confirms the significant impact of concrete cover for the internal steel reinforcement, which prevents the progress of the mechanical properties degradation due to limited access of oxygen and moisture. Consequently, limiting the development of electrode processes on the surface of the steel reinforcement. The test results showed that, in the absence of a concrete cover, changes in the yield strength of the steel bars are much greater than in the case when the bars are protected with a tight layer of concrete cover. Otherwise, it is therefore necessary to use other tight means of protection against the inflow of chloride ions e.g. [42], [43], [44].
Acknowledgments
The authors are grateful for the financial support received from the Academy of Silesia in Katowice (Poland).
-
Data Availability Statement: All data, models, and code generated or used during the study appear in the submitted article.
-
Conflict of interest: No conflict of interest exits in the submission of this manuscript, which is approved by all authors for publication.
-
Author contributions statement: conceptualization, F.R.; data curation, F.R. and K.Ł.; formal analysis, F.R.; funding acquisition, F.R. and K.Ł.; investigation, F.R.; methodology, F.R.; project administration, F.R.; resources, F.R, M.J.J. and T.K.; software, F.R.; supervision, F.R., and T.K.; validation, F.R., K.Ł., M.J.J. and T.K.; visualization, F.R.; writing—original draft preparation, F.R, K.Ł.; writing—review and editing, M.J.J. and T.K. All authors have read and agreed to the published version of the manuscript.
-
Funding information: This research received no external funding.
References
1. Arredondo-Rea, SP, Corral-Higuera, R, Gómez-Soberón, JM, Gámez-García, DC, Bernal-Camacho, JM, Rosas-Casarez, CA, et al.. Durability parameters of reinforced recycled aggregate concrete: case study. Appl Sci 2019;9:617. https://doi.org/10.3390/app9040617.Search in Google Scholar
2. Bazant, ZP. Physical model for steel corrosion in concrete sea structures—theory. J Struct Div 1979;105:1137–53. https://doi.org/10.1061/jsdeag.0005168. ASCE.Search in Google Scholar
3. Xi, Y, Bazant, ZP. Modeling chloride penetration in saturated concrete. J Mater Civ Eng 1999;11:58–65. https://doi.org/10.1061/(asce)0899-1561(1999)11:1(58).10.1061/(ASCE)0899-1561(1999)11:1(58)Search in Google Scholar
4. Tang Bui, H, Maekawa, K, Hai Tan, K. Analytical model of corrosion-induced cracks in concrete considering time-varying deformations of layers, mechanical properties of rust. Constr Build Mater 2022;316:125883. https://doi.org/10.1016/j.conbuildmat.2021.125883.Search in Google Scholar
5. Maekawa, K, Ishida, T, Kishi, T. Multi-scale modeling of concrete performance. J Adv Concr Technol 2003;1:91–126. https://doi.org/10.3151/jact.1.91.Search in Google Scholar
6. Nicolás, AF, Menchaca Campos, EC, Nicolás, MF, Gonzalez Noriega, OA, García Peréz, CA, Chavarín, JU. Corrosion resistance of reinforcing steel in concrete using natural fibers treated with used engine oil. Civ Eng J (Iran) 2024;10:1012–33. https://doi.org/10.28991/cej-2024-010-04-02.Search in Google Scholar
7. Černý, R, Rovnaníková, P. Transport processes in concrete. London; New York: CRC Press; 2002:275–332 pp.10.1201/9781482289107-9Search in Google Scholar
8. Caijun, S, Qiang, Y, Fuqiang, H, Xiang, H. Transport and interactions of chlorides in cement-based materials. London: CRC Press; 2019.10.1201/9780429466557Search in Google Scholar
9. Michel, A, Pease, BJ, Peterová, A, Geiker, MR, Stang, H, Thybo, AEA. Penetration of corrosion products and corrosion-induced cracking in reinforced cementitious materials: experimental investigations and numerical simulations. Cem Concr Compos [Internet] 2014;47:75–86. Available from: https://doi.org/10.1016/j.cemconcomp.2013.04.011.Search in Google Scholar
10. Krykowski, T, Jaśniok, T, Recha, F, Karolak, M. A cracking model for reinforced concrete cover, taking account of the accumulation of corrosion products in the ITZ layer, and including computational and experimental verification. Materials 2020;13:5375. https://doi.org/10.3390/ma13235375.Search in Google Scholar PubMed PubMed Central
11. Šavija, B, Luković, M, Pacheco, J, Schlangen, E. Cracking of the concrete cover due to reinforcement corrosion: a two-dimensional lattice model study. Constr Build Mater 2013;44:626–38. https://doi.org/10.1016/j.conbuildmat.2013.03.063.Search in Google Scholar
12. Jamshidi, F, Dehestani, M. Time to cracking in concrete cover length due to reinforcement corrosion via a simplified fracture mechanics approach. Constr Build Mater [Internet] 2020;258:119588. Available from: https://doi.org/10.1016/j.conbuildmat.2020.119588.Search in Google Scholar
13. Chen, J, Zhang, W, Tang, Z, Huang, Q. Experimental and numerical investigation of chloride-induced reinforcement corrosion and mortar cover cracking. Cem Concr Compos [Internet] 2020;111:103620. Available from: https://doi.org/10.1016/j.cemconcomp.2020.103620.Search in Google Scholar
14. Capozucca, R. Damage to reinforced concrete due to reinforcement corrosion. Constr Build Mater 1995;9:295–303. https://doi.org/10.1016/0950-0618(95)00033-c.Search in Google Scholar
15. Fischer, C. Auswirkungen der Bewehrungskorrosion auf den Verbund zwischen Stahl und Beton. Stuttgart, Germany: Institut für Werkstoffe im Bauwesen der Universität Stuttgart; 2012.Search in Google Scholar
16. El, AE, Fekak, FE, Garibaldi, L, Moustabchir, H, Elkhalfi, A, Scutaru, ML, et al.. Numerical study of the bond strength evolution of corroded reinforcement in concrete in pull‐out tests. Appl Sci 2022;12:654. https://doi.org/10.3390/app12020654.Search in Google Scholar
17. Lee, HS, Noguchi, T, Tomosawa, F. Evaluation of the bond properties between concrete and reinforcement as a function of the degree of reinforcement corrosion. Cement Concr Res 2002;32:1313–8. https://doi.org/10.1016/s0008-8846(02)00783-4.Search in Google Scholar
18. Almusallam, AA. Effect of degree of corrosion on the properties of reinforcing steel bars. Constr Build Mater 2001;15:361–8. https://doi.org/10.1016/s0950-0618(01)00009-5.Search in Google Scholar
19. Zhou, B, Sun, X, Zou, D, Wang, H. Evaluation of corrosion morphology on mechanical properties of reinforcing steel bars using numerical simulation and simplified analytical model. J Build Eng [Internet] 2022;52:104380. Available from: https://doi.org/10.1016/j.jobe.2022.104380.Search in Google Scholar
20. Moreno, E, Cobo, A, Palomo, G, González, MN. Mathematical models to predict the mechanical behavior of reinforcements depending on their degree of corrosion and the diameter of the rebars. Construct Build Mater [Internet] 2014;61:156–63. Available from: https://doi.org/10.1016/j.conbuildmat.2014.03.003.Search in Google Scholar
21. Andrade, C. Some historical notes on the research in corrosion of reinforcement. Hormigón y Acero 2018;69:21–8. https://doi.org/10.1016/j.hya.2018.12.002.Search in Google Scholar
22. Benjamin, I, Kennedy, C, Wurah, IF. Effects of corrosion on mechanical properties of reinforcing steel residual flexural strength. Abbreviated key title. Sch Int J Chem Mater Sci [Internet] 2021;4:158–73. Available from: http://saudijournals.com.Search in Google Scholar
23. Negrutiu, C, Sosa, IP, Constantinescu, H, Heghes, B. Crack analysis of reinforced high strength concrete elements in simulated aggressive environments. Proced Technol [Internet] 2016;22:4–12. Available from: https://doi.org/10.1016/j.protcy.2016.01.002.Search in Google Scholar
24. Shen, J, Gao, X, Li, B, Du, K, Jin, R, Chen, W, et al.. Damage evolution of RC beams under simultaneous reinforcement corrosion and sustained load. Materials 2019;12:1–16. https://doi.org/10.3390/ma12040627.Search in Google Scholar PubMed PubMed Central
25. Recha, F. Estimation method of corrosion current density of RC elements. Open Eng 2023;13:20220430. https://doi.org/10.1515/eng-2022-0430.Search in Google Scholar
26. Grandić, D, Bjegović, D, IŠ, G. Deflection of reinforced concrete beams simultaneously subjected to sustained load and reinforcement corrosion. In: Structural Engineers World Congress 2011. Como, Italy: SEWC; 2011.Search in Google Scholar
27. Jin, X, Tong, J, Tian, Y, Jin, N. Time-varying relative displacement field on the surface of concrete cover caused by reinforcement corrosion based on DIC measurement. Construct Build Mater [Internet] 2018;159:695–703. Available from: https://doi.org/10.1016/j.conbuildmat.2017.10.119.Search in Google Scholar
28. Ye, H, Fu, C, Jin, N, Jin, X. Performance of reinforced concrete beams corroded under sustained service loads: a comparative study of two accelerated corrosion techniques. Construct Build Mater [Internet] 2018;162:286–97. Available from: https://doi.org/10.1016/j.conbuildmat.2017.10.108.Search in Google Scholar
29. De Sitter. CEB-RILEM Workshop Report. Durability of concrete structures. CEB-Bulletin. Kopenhaga; 1983:1983 p.Search in Google Scholar
30. Li, L, Mahmoodian, M, Khaloo, A, Sun, Z. Risk-cost optimized maintenance strategy for steel bridge subjected to deterioration. Sustainability 2022;14:436. https://doi.org/10.3390/su14010436.Search in Google Scholar
31. Zhu, W, François, R, Poon, CS, Dai, JG. Influences of corrosion degree and corrosion morphology on the ductility of steel reinforcement. Constr Build Mater 2017;148:297–306. https://doi.org/10.1016/j.conbuildmat.2017.05.079.Search in Google Scholar
32. Lee, HS, Cho, YS. Evaluation of the mechanical properties of steel reinforcement embedded in concrete specimen as a function of the degree of reinforcement corrosion. Int J Fract 2009;157:81–8. https://doi.org/10.1007/s10704-009-9334-7.Search in Google Scholar
33. Chen, Z, Nie, S, Han, W, Tang, M, Yang, B, Elchalakani, M. A study on static properties of high-performance steel after corrosion damage. J Constr Steel Res [Internet] 2023;207:107970. Available from: https://doi.org/10.1016/j.jcsr.2023.107970.Search in Google Scholar
34. Polish Committee of Normalization. Norm PN-EN 1992-1-1 eurocode 2: design of concrete structures. Part 1-1: general rules and regulations for buildings. Warsaw: Polish Committee of Normalization; 2008.Search in Google Scholar
35. PN-EN ISO 6892 Metals. Tensile test. In: Room temperature test method. Warsaw: Polish Committee of Normalization; 2010.Search in Google Scholar
36. Chen, E, Berrocal, CG, Fernandez, I, Löfgren, I, Lundgren, K. Assessment of the mechanical behaviour of reinforcement bars with localised pitting corrosion by digital image correlation. Eng Struct [Internet] 2020;219:110936. Available from: https://doi.org/10.1016/j.engstruct.2020.110936.Search in Google Scholar
37. Tutti, K. Corrosion of steel in concrete. Stockholm: Swedish Cement and Concrete Research Institute; 1982.Search in Google Scholar
38. Yu, L, François, R, Dang, VH, L’Hostis, V, Gagné, R. Distribution of corrosion and pitting factor of steel in corroded RC beams. Construct Build Mater [Internet] 2015;95:384–92. Available from: https://doi.org/10.1016/j.conbuildmat.2015.07.119.Search in Google Scholar
39. Stewart, MG, Al-Harthy, A. Pitting corrosion and structural reliability of corroding RC structures: experimental data and probabilistic analysis. Reliab Eng Syst Saf 2008;93:373–82. https://doi.org/10.1016/j.ress.2006.12.013.Search in Google Scholar
40. Val, DV, Trapper, PA. Probabilistic evaluation of initiation time of chloride-induced corrosion. Reliab Eng Syst Saf 2008;93:364–72. https://doi.org/10.1016/j.ress.2006.12.010.Search in Google Scholar
41. Castaneda, H, Okeil, AM. Technology O of the AS for R and, (Tran-SET) TC of S-CS. Corros Manag Syst Regional Reinf Concr (RC) Bridges 2020;19:97p.Search in Google Scholar
42. Hsissou, R, Benzidia, B, Hajjaji, N, Elharfi, A. Elaboration and electrochemical studies of the coating behavior of a new pentafunctional epoxy polymer (pentaglycidyl ether pentabisphenol phosphorus) on E24 carbon steel in 3.5 % NaCl. J Chem Technol Metall 2018;53:898–905.10.4152/pea.201804259Search in Google Scholar
43. Molhi, A, Hsissou, R, Damej, M, Berisha, A, Bamaarouf, M, Seydou, M, et al.. Performance of two epoxy compounds against corrosion of C38 steel in 1 M HCl: electrochemical, thermodynamic and theoretical assessment. Int J Corros Scale Inhib 2021;10:812–37.10.17675/2305-6894-2021-10-2-21Search in Google Scholar
44. Hsissou, R, Lachhab, R, El Magri, A, Echihi, S, Vanaei, HR, Galai, M, et al.. Synthesis characterization and highly protective efficiency of tetraglycidyloxy pentanal epoxy prepolymer as a potential corrosion inhibitor for mild steel in 1 M HCl medium. Polymers 2022;14:1–14. https://doi.org/10.3390/polym14153100.Search in Google Scholar PubMed PubMed Central
© 2025 the author(s), published by De Gruyter, Berlin/Boston
This work is licensed under the Creative Commons Attribution 4.0 International License.
Articles in the same Issue
- Research Articles
- Modification of polymers to synthesize thermo-salt-resistant stabilizers of drilling fluids
- Study of the electronic stopping power of proton in different materials according to the Bohr and Bethe theories
- AI-driven UAV system for autonomous vehicle tracking and license plate recognition
- Enhancement of the output power of a small horizontal axis wind turbine based on the optimization approach
- Design of a vertically stacked double Luneburg lens-based beam-scanning antenna at 60 GHz
- Synergistic effect of nano-silica, steel slag, and waste glass on the microstructure, electrical resistivity, and strength of ultra-high-performance concrete
- Expert evaluation of attachments (caps) for orthopaedic equipment dedicated to pedestrian road users
- Performance and rheological characteristics of hot mix asphalt modified with melamine nanopowder polymer
- Second-order design of GNSS networks with different constraints using particle swarm optimization and genetic algorithms
- Impact of including a slab effect into a 2D RC frame on the seismic fragility assessment: A comparative study
- Analytical and numerical analysis of heat transfer from radial extended surface
- Comprehensive investigation of corrosion resistance of magnesium–titanium, aluminum, and aluminum–vanadium alloys in dilute electrolytes under zero-applied potential conditions
- Performance analysis of a novel design of an engine piston for a single cylinder
- Modeling performance of different sustainable self-compacting concrete pavement types utilizing various sample geometries
- The behavior of minors and road safety – case study of Poland
- The role of universities in efforts to increase the added value of recycled bucket tooth products through product design methods
- Adopting activated carbons on the PET depolymerization for purifying r-TPA
- Urban transportation challenges: Analysis and the mitigation strategies for road accidents, noise pollution and environmental impacts
- Enhancing the wear resistance and coefficient of friction of composite marine journal bearings utilizing nano-WC particles
- Sustainable bio-nanocomposite from lignocellulose nanofibers and HDPE for knee biomechanics: A tribological and mechanical properties study
- Effects of staggered transverse zigzag baffles and Al2O3–Cu hybrid nanofluid flow in a channel on thermofluid flow characteristics
- Mathematical modelling of Darcy–Forchheimer MHD Williamson nanofluid flow above a stretching/shrinking surface with slip conditions
- Energy efficiency and length modification of stilling basins with variable Baffle and chute block designs: A case study of the Fewa hydroelectric project
- Renewable-integrated power conversion architecture for urban heavy rail systems using bidirectional VSC and MPPT-controlled PV arrays as an auxiliary power source
- Exploitation of landfill gas vs refuse-derived fuel with landfill gas for electrical power generation in Basrah City/South of Iraq
- Two-phase numerical simulations of motile microorganisms in a 3D non-Newtonian nanofluid flow induced by chemical processes
- Sustainable cocoon waste epoxy composite solutions: Novel approach based on the deformation model using finite element analysis to determine Poisson’s ratio
- Impact and abrasion behavior of roller compacted concrete reinforced with different types of fibers
- Architectural design and its impact on daylighting in Gayo highland traditional mosques
- Structural and functional enhancement of Ni–Ti–Cu shape memory alloys via combined powder metallurgy techniques
- Design of an operational matrix method based on Haar wavelets and evolutionary algorithm for time-fractional advection–diffusion equations
- Design and optimization of a modified straight-tapered Vivaldi antenna using ANN for GPR system
- Analysis of operations of the antiresonance vibration mill of a circular trajectory of chamber vibrations
- Functions of changes in the mechanical properties of reinforcing steel under corrosive conditions
- 10.1515/eng-2025-0153
- Review Articles
- A modified adhesion evaluation method between asphalt and aggregate based on a pull off test and image processing
- Architectural practice process and artificial intelligence – an evolving practice
- Enhanced RRT motion planning for autonomous vehicles: a review on safety testing applications
- Special Issue: 51st KKBN - Part II
- The influence of storing mineral wool on its thermal conductivity in an open space
- Use of nondestructive test methods to determine the thickness and compressive strength of unilaterally accessible concrete components of building
- Use of modeling, BIM technology, and virtual reality in nondestructive testing and inventory, using the example of the Trzonolinowiec
- Tunable terahertz metasurface based on a modified Jerusalem cross for thin dielectric film evaluation
- Integration of SEM and acoustic emission methods in non-destructive evaluation of fiber–cement boards exposed to high temperatures
- Non-destructive method of characterizing nitrided layers in the 42CrMo4 steel using the amplitude-frequency technique of eddy currents
- Evaluation of braze welded joints using the ultrasonic method
- Analysis of the potential use of the passive magnetic method for detecting defects in welded joints made of X2CrNiMo17-12-2 steel
- Analysis of the possibility of applying a residual magnetic field for lack of fusion detection in welded joints of S235JR steel
- Eddy current methodology in the non-direct measurement of martensite during plastic deformation of SS316L
- Methodology for diagnosing hydraulic oil in production machines with the additional use of microfiltration
- Special Issue: IETAS 2024 - Part II
- Enhancing communication with elderly and stroke patients based on sign-gesture translation via audio-visual avatars
- Optimizing wireless charging for electric vehicles via a novel coil design and artificial intelligence techniques
- Evaluation of moisture damage for warm mix asphalt (WMA) containing reclaimed asphalt pavement (RAP)
- Comparative CFD case study on forced convection: Analysis of constant vs variable air properties in channel flow
- Evaluating sustainable indicators for urban street network: Al-Najaf network as a case study
- Node failure in self-organized sensor networks
- Comprehensive assessment of side friction impacts on urban traffic flow: A case study of Hilla City, Iraq
- Design a system to transfer alternating electric current using six channels of laser as an embedding and transmitting source
- Security and surveillance application in 3D modeling of a smart city: Kirkuk city as a case study
- Modified biochar derived from sewage sludge for purification of lead-contaminated water
- The future of space colonisation: Architectural considerations
- Design of a Tri-band Reconfigurable Antenna Using Metamaterials for IoT Applications
- Special Issue: AESMT-7 - Part II
- Experimental study on behavior of hybrid columns by using SIFCON under eccentric load
- Special Issue: ICESTA-2024 and ICCEEAS-2024
- A selective recovery of zinc and manganese from the spent primary battery black mass as zinc hydroxide and manganese carbonate
- Special Issue: REMO 2025 and BUDIN 2025
- Predictive modeling coupled with wireless sensor networks for sustainable marine ecosystem management using real-time remote monitoring of water quality
- Management strategies for refurbishment projects: A case study of an industrial heritage building
- Structural evaluation of historical masonry walls utilizing non-destructive techniques – Comprehensive analysis