Validated thin-layer chromatographic method for alternative and simultaneous determination of two anti-gout agents in their fixed dose combinations
-
Abdel-Maaboud I. Mohamed
 und
Abobakr A. Mohamed
und
Abobakr A. Mohamed

Abstract
A rapid, simple and sensitive thin-layer chromatography (TLC) spectrodensitometric method was developed for the simultaneous determination of colchicine and probenecid in their binary mixtures. The two drugs were quantitatively separated using silica gel 60 F254 as stationary phase and toluene–ethyl acetate–methanol–ammonia (30:20:20:0.1, v/v/v/v) as mobile phase with UV detection at 248 nm for both drugs and at 354 nm for colchicine alone. Both drugs were efficiently separated with Rf values of 0.33±0.03 and 0.60±0.03 for probenecid and colchicine, respectively. The linearity was found to be 16–320 and 120–2400 (ng/band) with quantitation limits of 17.59 and 225.82 ng/band for colchicine and probenecid, respectively, at 248 nm. At 354 nm, the linearity range of colchicine was found 16–240 ng/band with a quantitation limit of 54.03 ng/band. The experimental determination ranges were greatly extended with lower quantitation limits (15.60 and 116.13 ng/band for colchicine and probenecid, respectively at 248 nm, and 13.20 for colchicine at 354 nm) and correlation coefficients were improved when polynomial regression analysis was used. The quadratic model was found to be the best fit for all responses. The method has been validated according to the International Conference on Harmonization (ICH) guidelines providing good correlation coefficients (0.9997-0.9999) for both drugs, and it has been successfully applied in the determination of both drugs in their commercial dosage form without interference from excipients.
Graphical Abstract
1 Introduction
Hyperuricemia is usually caused by either overproduction or under-excretion of urate. Crystals of monosodium urate monohydrate are formed and deposited in synovial fluid and various tissues leading to an inflammation in the affected joint.The ensuing exquisite pain, tenderness, erythema, and swelling constitute the clinical manifestations of acute inflammatory gouty arthritis. Treatements are devoted to alleviating the acute attack, preventing future attacks and lowering the concentration of urate in the plasma. Key therapeutic agents for gout include colchicine, allopurinol, and uricosuric agents, such as probenecid. Colchicine is one of the oldest available therapies for acute gout; the main indication for colchicine is in the prevention of recurrent gout, particularly in the early stages of antihyperuricemic therapy.
Uric acid is the only important endogenous compound whose excretion is known to be increased by probenecid [1]. Colchicine and probenecid (Figure 1) are officially listed in the Chinese, Japanese, British, United State and European Pharmacopoeias, which described several methods for their separate assay in bulk and dosage forms [2,3,4,5,6].
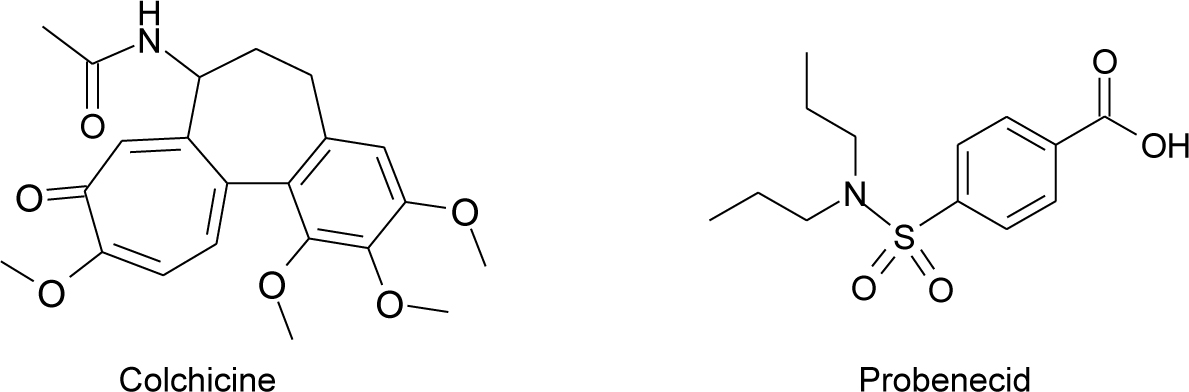
Chemical structures of the drugs under investigation.
Several analytical methods have been developed for determination of colchicine and probenecid, including HPLC [7,8,9,10,11,12,13,14,15,16,17,18,19,20,21,22], TLC [8,23,24,25], GC [26,27,28,29,30], spectrophotometric [8,31,32,33,34], capillary electrophoretic [35,36], voltammetric [37,38,39,40,41,42,43], and fluorimetric [44,45] methods. Notably, only one HPLC method has been published for simultaneous determination of colchicine and probenecid in solid dosage form [7]. This method suffers from some major drawbacks such as inadequate sensitivity, tedious extraction procedures and the need for sophisticated and expensive instrumentation.
To the best of the authors’ knowledge, no TLC-densitometric method has been presented for simultaneous determination of colchicine and probenecid in their co-formulated fixed dose tablets until now. The design of a new, rapid, simple and highly sensitive TLC-spectrodensitometric method for their simultaneous determination was imperative. The proposed method presents a number of merits, including rapidity, simplicity, improved sensitivity and low cost. Furthermore, the developed TLC-spectrodensitometric method has the advantage of being more sensitive than other reported TLC and spectrophotometric methods.Relative to HPLC methods, the proposed TLC method has a shorter analysis time, is less expensive, has a large sample capacity per run, and uses small amounts of solvents, and it does not require extensive cleanup [46] because a new plate is utilized for each run. Hence, the proposed method can be used instead of published HPLC methods that require pre-extraction steps.
2 Experimental
2.1 Instrumentation
Sample application was done under a nitrogen stream using a 100 μL precision syringe (Hamilton, Bonaduz, Switzerland) in the form of bands utilizing a Linomat-V auto sampler and a CAMAG TLC Scanner 4 operated in the reflectance–absorbance mode, with winCATS version 1.4.10 software (CAMAG, Muttenz, Switzerland), with slit dimensions of 3×0.45mm and scanning speed of20 mm/s. The plates were developed in a twin-trough chamber (Sigma-Aldrich, St Louis, MO, USA).
2.2 Materials and Reagents
Colchicine and probenecid were kindly provided by Kahira Pharmaceuticals and Chemical Industries Co. and October Pharma Co., Cairo, Egypt, respectively. Their purities were found to be 99.2 and 98.8 (%) for colchicine and probenecid, respectively as determined by reported methods [23,24]. Silica gel 60 F254 plates (E. Merck, Darmstadt, Germany) were used. All solvents were of HPLC grade; methanol, ethyl acetate, toluene and ammonia were purchased from Sigma Aldrich, Steinheim, Germany. Goutyless® tablets were obtained from a local Egyptian market. Each tablet contains 0.5 mg of colchicine and 500 mg of probenecid, B.N: B01560216.
2.3 Standard Solutions
2.3.1 Stock Standard Solutions
Masses equivalent to 10.0 mg of colchicine and 150.0 mg transferred separately into 50 mL volumetric flasks then dissolved in 30 mL of methanol with the aid of ultra-sonication for 5 min.The volume was then adjusted to 50.0 mL with methanol to obtain colchicine and probenecid concentrations of 0.2 and 3.0 mg mL–1, respectively. All solutions were kept in a refrigerator.
2.3.2 Working Standard Solutions
Mixed working solutions were obtained by further diluting of suitable volumes from each stock solution with methanol in separate 10.0 mL volumetric flasks to prepare concentrations in the range of 2.0–100.0 and 30.0–1500.0 (μg mL–1) for colchicine and probenecid, respectively.
2.4 Chromatographic Conditions
Firstly, the silica gel G 60 F254 TLC plates were cut into 200 × 100 mm and 100 × 100 mm pieces and washed with methanol. Then, the working standards or sample solutions were applied to the plates as separate compact bands 15 mm from the bottom and 15 mm from the side edges of the plates with 4 mm band width. Twenty milliliters of mobile phase composed of toluene–ethyl acetate–methanol–ammonia 33% (30:20:20:0.1, v/v/v/v) was passed to the developing chamber, allowing the atmosphere to saturate with the mobile phase for 30 min at room temperature (25 ± 2°C). The plates were developed over a distance of 70 mm in an ascending manner, attained within 10 min, and then air-dried for 5 min. and scanned a deuterium/wolfram lamp at 248 nm for both drugs and at 354 nm for colchicine alone.
2.5 Sample Solution
Ten Gouty less® tablets were weighed and finely powdered in a mortar. A weight equivalent to 1.0 mg of colchicine and 1000.0 mg of probenecid was transferred into a 100-mL volumetric flask. Then the powder was dissolved in 80-mL methanol with sonication for 15 min. The volume was adjusted to 100-mL with methanol, and the solution was filtered to obtain colchicine and probenecid concentrations of 10.0 and 10000.0 (μg mL–1), respectively (stock I). From stock I, aliquots of 4.0 mL were diluted to 10.0 mL with methanol to obtain colchicine and probenecid concentrations of 4.0 and 4000.0 (μg mL-1), respectively (stock II). Aliquots of 1.0 mL of stock I were further diluted to 10.0 mL with methanol to obtain colchicine and probenecid concentrations of 1.0 and 1000.0 (μg mL–1), respectively (stock III). From stock I, 1.0 mL was transferred quantitatively intoa 10.0 mLvolumetric flask, then 1.0 mL from the 250.0 μg mL–1 colchicine standard solution was added, and the volume was adjusted to 10.0 mL with the same solvent to obtain 26 μg mL–1(1.0 μg mL–1sample + 25.0 μg mL–1 standard) colchicine and 1000.0 μg mL–1 probenecid sample (stock IV). Then the procedure described under section 2.5 was applied.
Ethical approval: The conducted research is not related to either human or animals use.
3 Results and Discussion
3.1 Spectral Analysis
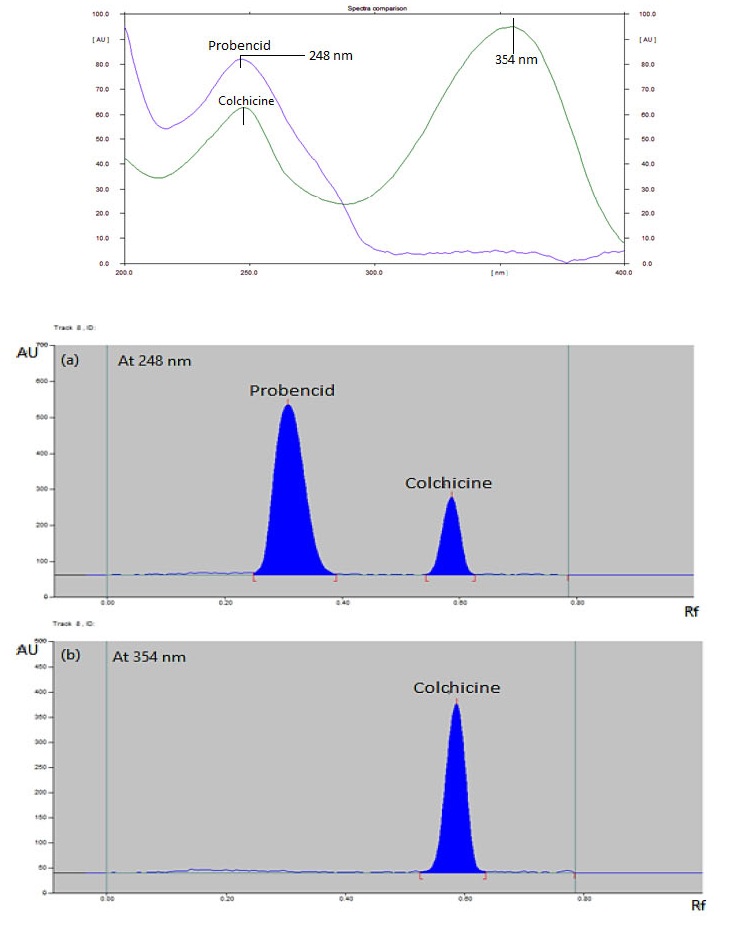
Analysis the UV-absorption spectra of the two drugs under investigation demonstrated that both drugs have maximum absorptions at 248 nm, which provides a suitable wavelength for their simultaneous determination, while colchicine has another important maximum absorption at 354 nm (Figure 2). It was obvious that the spectra of both drugs in their binary mixtures completely overlapped in the region from 200 to 300 nm. Consequently, using traditional spectrophotometric method for their simultaneous detection is not simple.
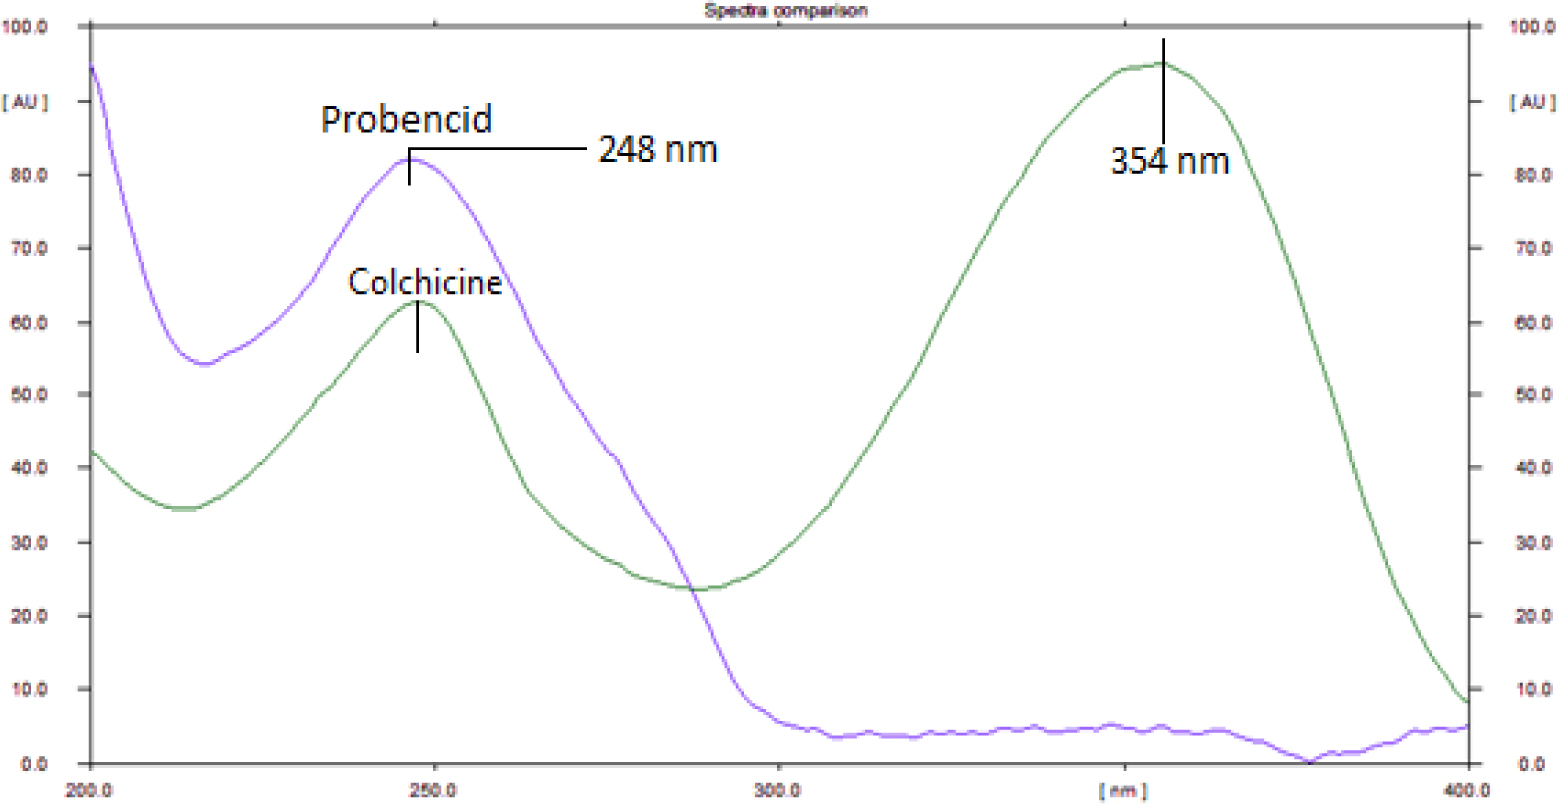
Comparison of spectra of colchicine (160 ng/band) and probenecid (600 ng/band).
The observation that at 354 nm probenecid has very little UV absorption, whilst colchicine has its maximum absorption at this wavelength, permits the solo detection of colchicine in the presence of probenecid with considerably good sensitivity. Hereinafter, an efficient separation was obtained by TLC, and each drug was detected at its specified Rf value either at 248 nm for both drugs or at 354 nm for colchicine only.
3.2 Optimization of Chromatographic Conditions
The mobile phase composition and the other parameters were optimized using the DOE approach. A tabulated Box–Behnken experimental design was built for efficient optimization of the experimental parameters (methanol and ammonia contents, saturation time and migration distance) and their obtained responses (peak areas and Rf values for both drugs) in 24 trial runs.
3.2.1 Mobile Phase Composition
Mobile phase selection was performed using controlled trial and error to obtain the most appropriate system. Several mobile phases of various compositions were tried, such as chloroform – methanol, toluene – methanol, chloroform– acetone and toluene – dichloromethane; in different proportions, these gave poor resolution or coelution with the solvent front. Upon using toluene– ethyl acetate (6:2, v/v), a slight enhancement was obtained, where probenecid had an Rf value of 0.28 while colchicine stayed on the origin. With increasing solvent polarity using methanol in different ratios, it was noted that colchicine started to move from the origin. Consequently, toluene–ethyl acetate–methanol mixtures in different ratios and in the absence or presence of weakly acidic (acetic acid) or basic (ammonia) compounds were tested (Table 1). Upon using different compositions of this solvent system (12 optimized runs), it was noted that methanol and ammonia were the most effective additions (Figure 3). Moreover, using a toluene – ethyl acetate – methanol – ammonia system, especially in the ratios of (30:20:20:0.1, v/v/v/v), gave well-separated peaks with high areas and better shaped and symmetric bands for both drugs (Figure 4).
Effects of mobile phase solvent systems on retention factors and peak areas of colchicine and probenecid.
| Mobile phase system | Rf Value | Peak area at 248 nm | Notes | ||
|---|---|---|---|---|---|
| Colchicine | Probenecid | Colchicine (80 ng/band) | Probenecid (1200 ng/band) | ||
| 1-Toluene–ethyl acetate–methanol (30:20:5, v/v) | 0.14 | 0.34 | 1908.89 | 9809.33 | Streaking with poor Rf value for colchicine. |
| 2-Toluene–ethyl acetate– methanol (30:20: 7, v/v) | 0.18 | 0.40 | 1970.55 | 10056.20 | Streaked bands for colchicine |
| 3-Toluene–ethyl acetate– methanol (20:20:10, v/v) | 0.50 | 0.40 | 2030.22 | 10100.07 | Poor resolution; small difference in Rf values. |
| 4-Toluene–ethyl acetate– methanol (30:20:20, v/v) | 0.35 | 0.54 | 2219.40 | 10180.20 | Broad bands and asymmetric peaks for both drugs. |
| 5-Toluene–ethyl acetate– methanol–Acetic acid (30:20:20:0.1, v/v) | 0.36 | 0.56 | 2110.30 | 10211.5 4 | Compact and sharp peaks for probenecid, but broad, tailed bands for colchicine. |
| 6-Toluene – ethyl acetate – methanol – ammonia (30:20:20:0.1, v/v) | 0.63 | 0.33 | 2273.70 | 10193.70 | Reversed order of elution with well-separated, better shaped and more symmetric peaks for both drugs |
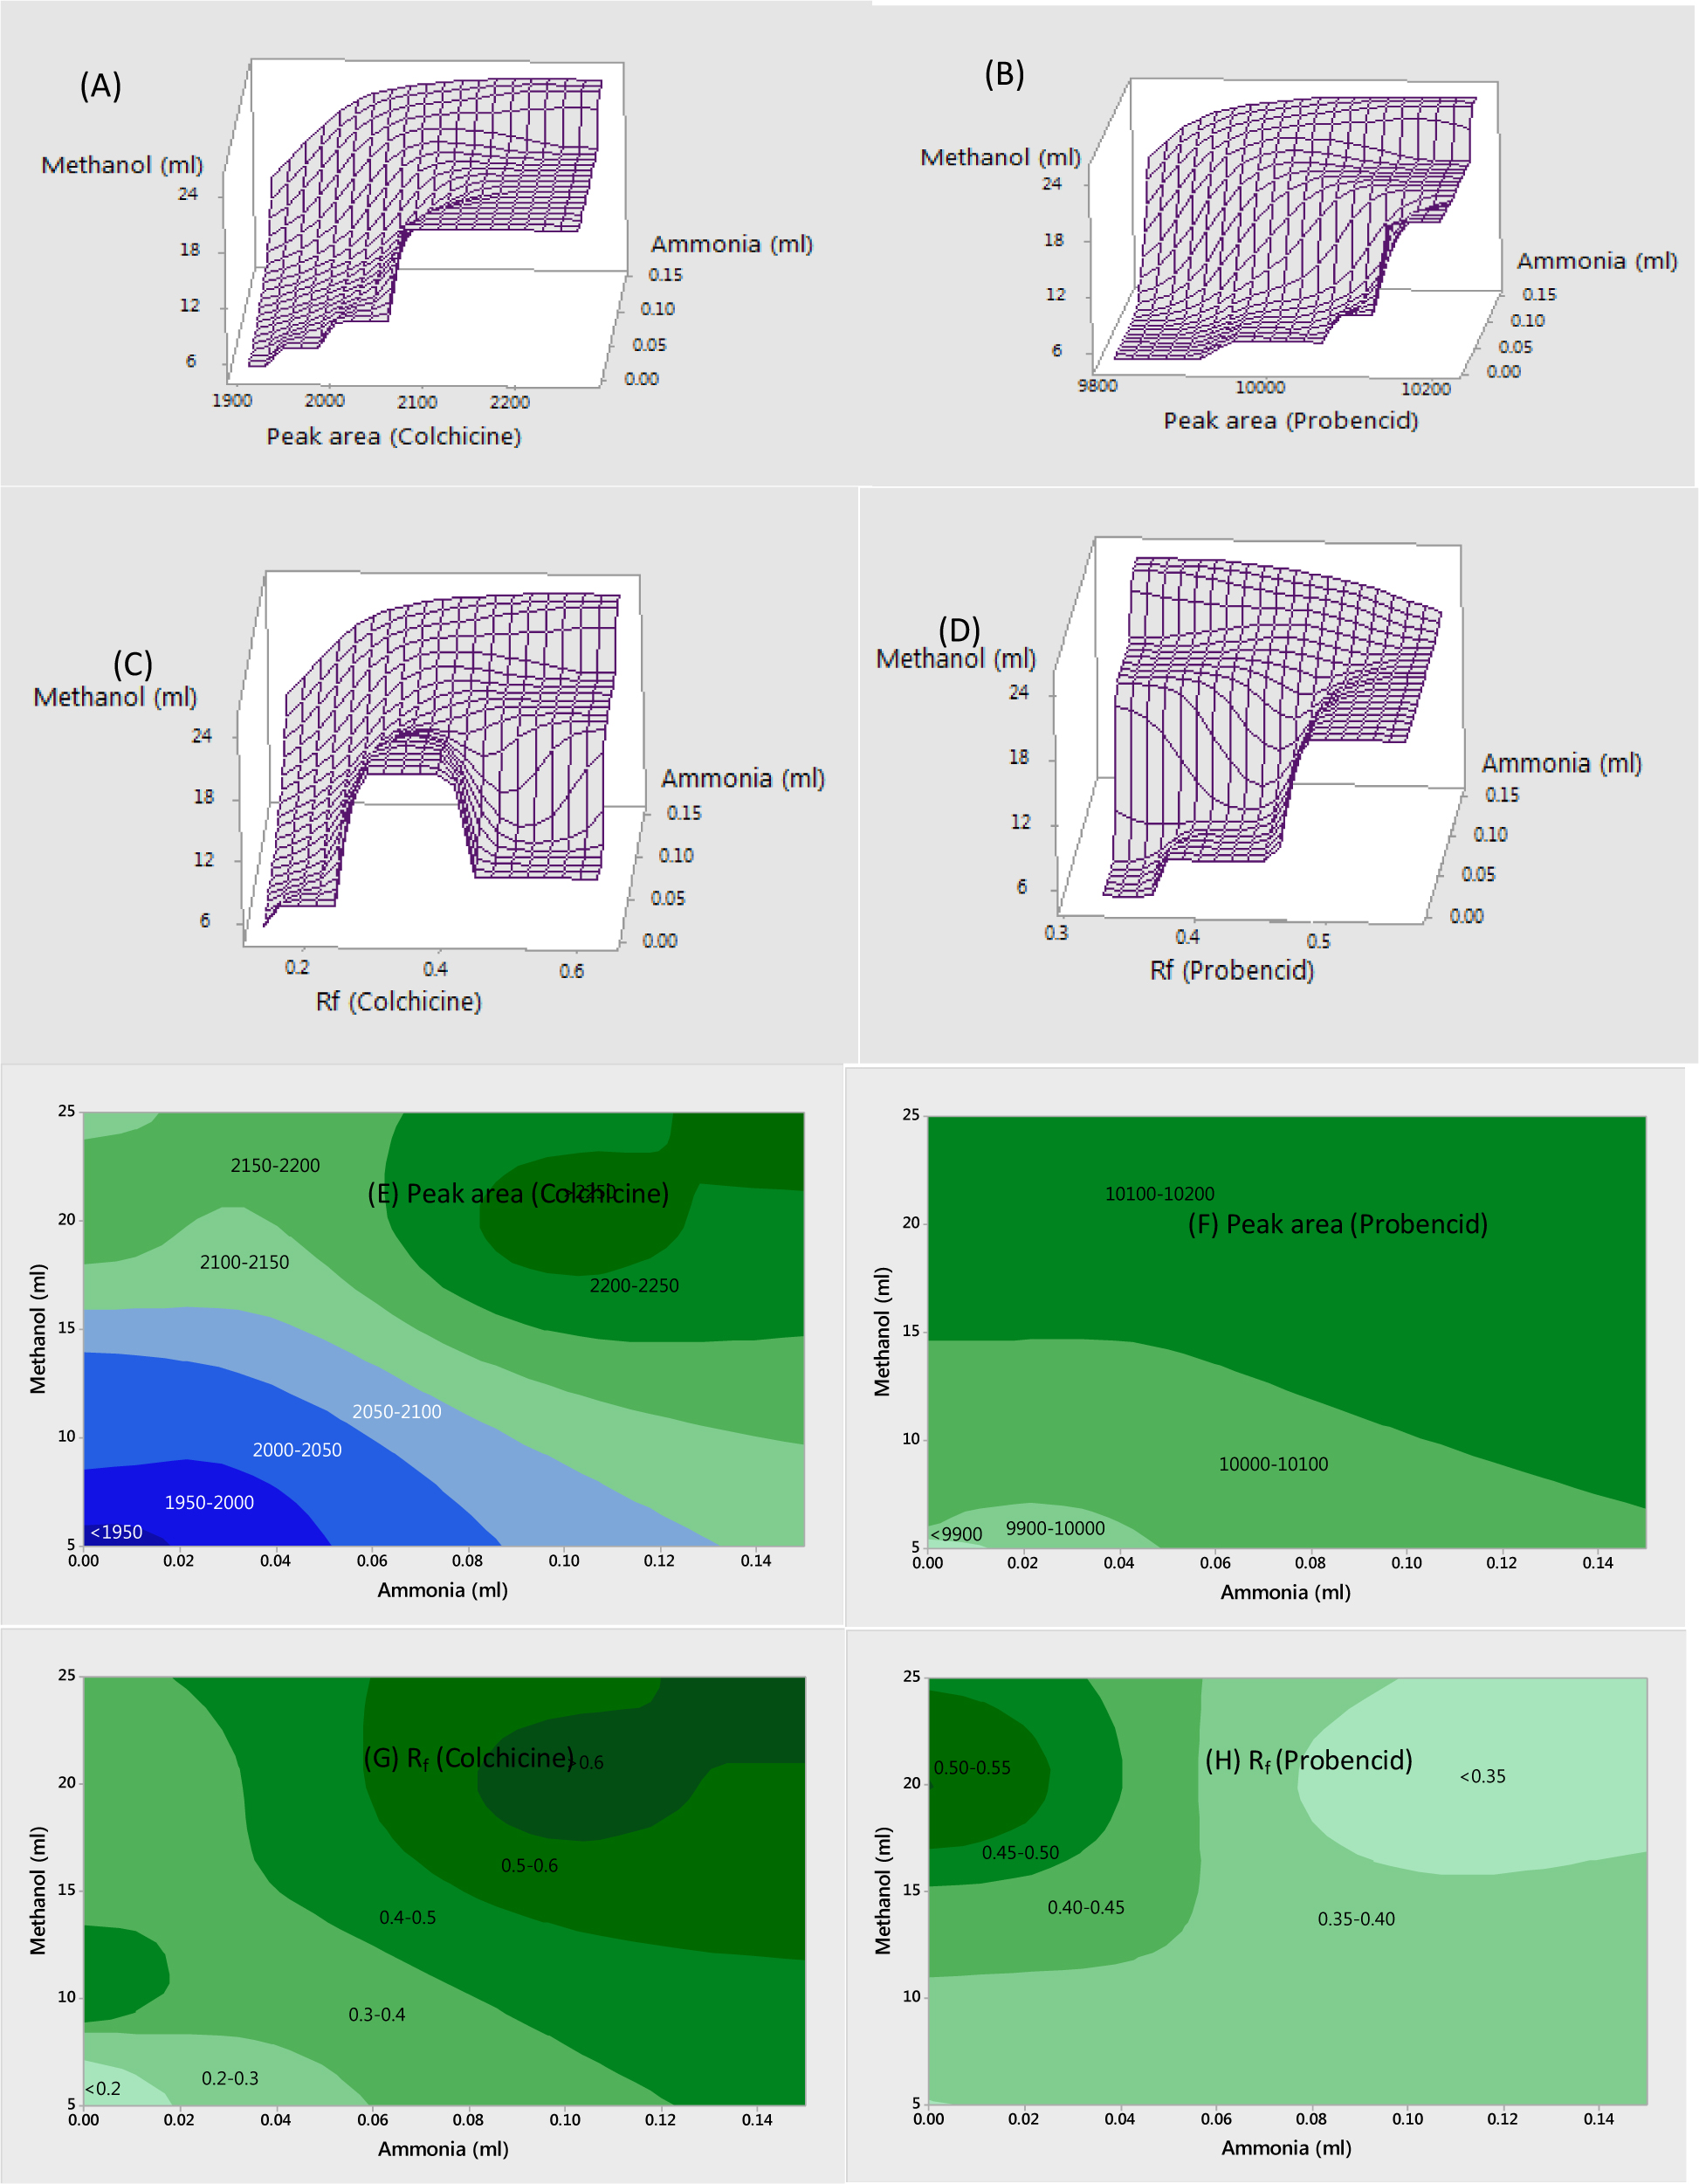
Surface and contour plots of peak area and Rf values for both colchicine and probenecid against methanol and ammonia contents of the solvent system.
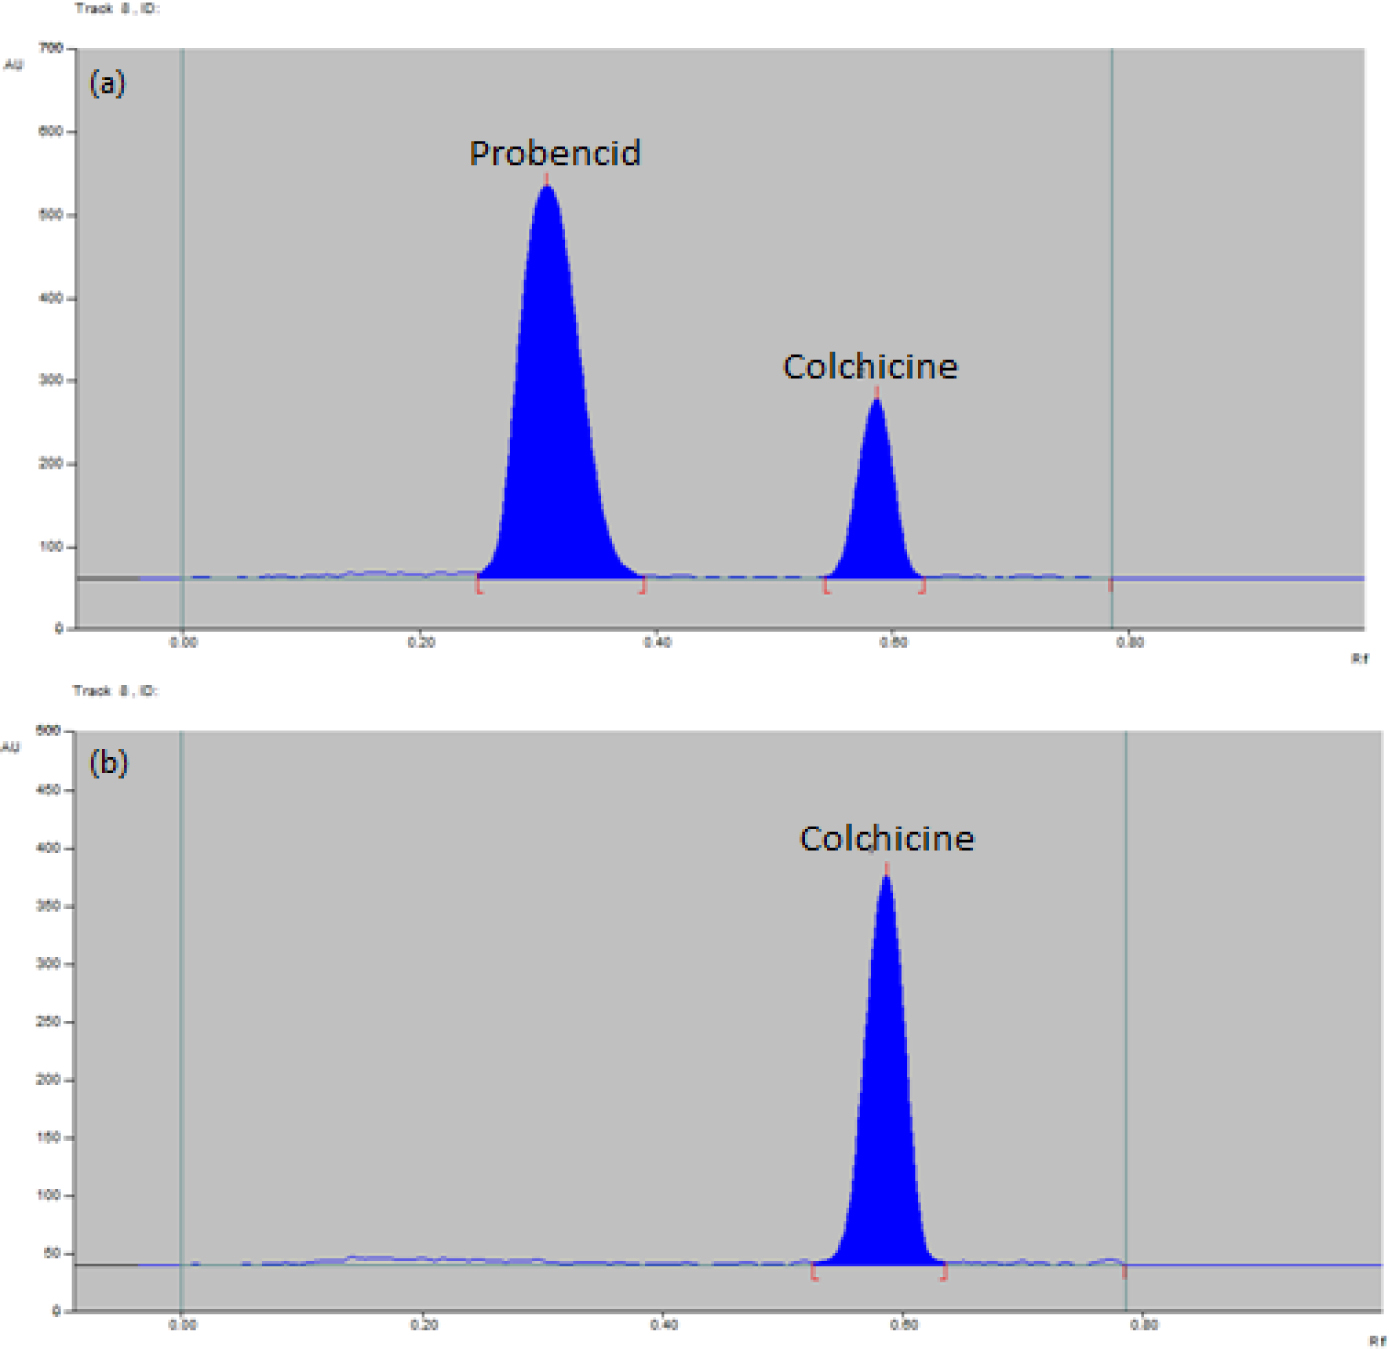
Two-dimensional TLC-densitogram of colchicine and probenecid at 160 and 2400ng/band, respectively, using the optimized solvent system (toluene – ethyl acetate – methanol – ammonia, (30:20:20:0.1, v/v/v/v)); (a) Measured at 248 nm and (b) measured at 354 nm.
3.2.2 Saturation Time
The degree of vapor saturation must be the same in all studies to attain reproducible results [47]; therefore, we systematically altered saturation times to determine the effect on replication.Upon varying saturation times from 10 to 40 min, it was noted that at 25 min, good results were obtained. Accordingly, to obtain the most robust results, 30 min was used as a saturation time (Figure 5).
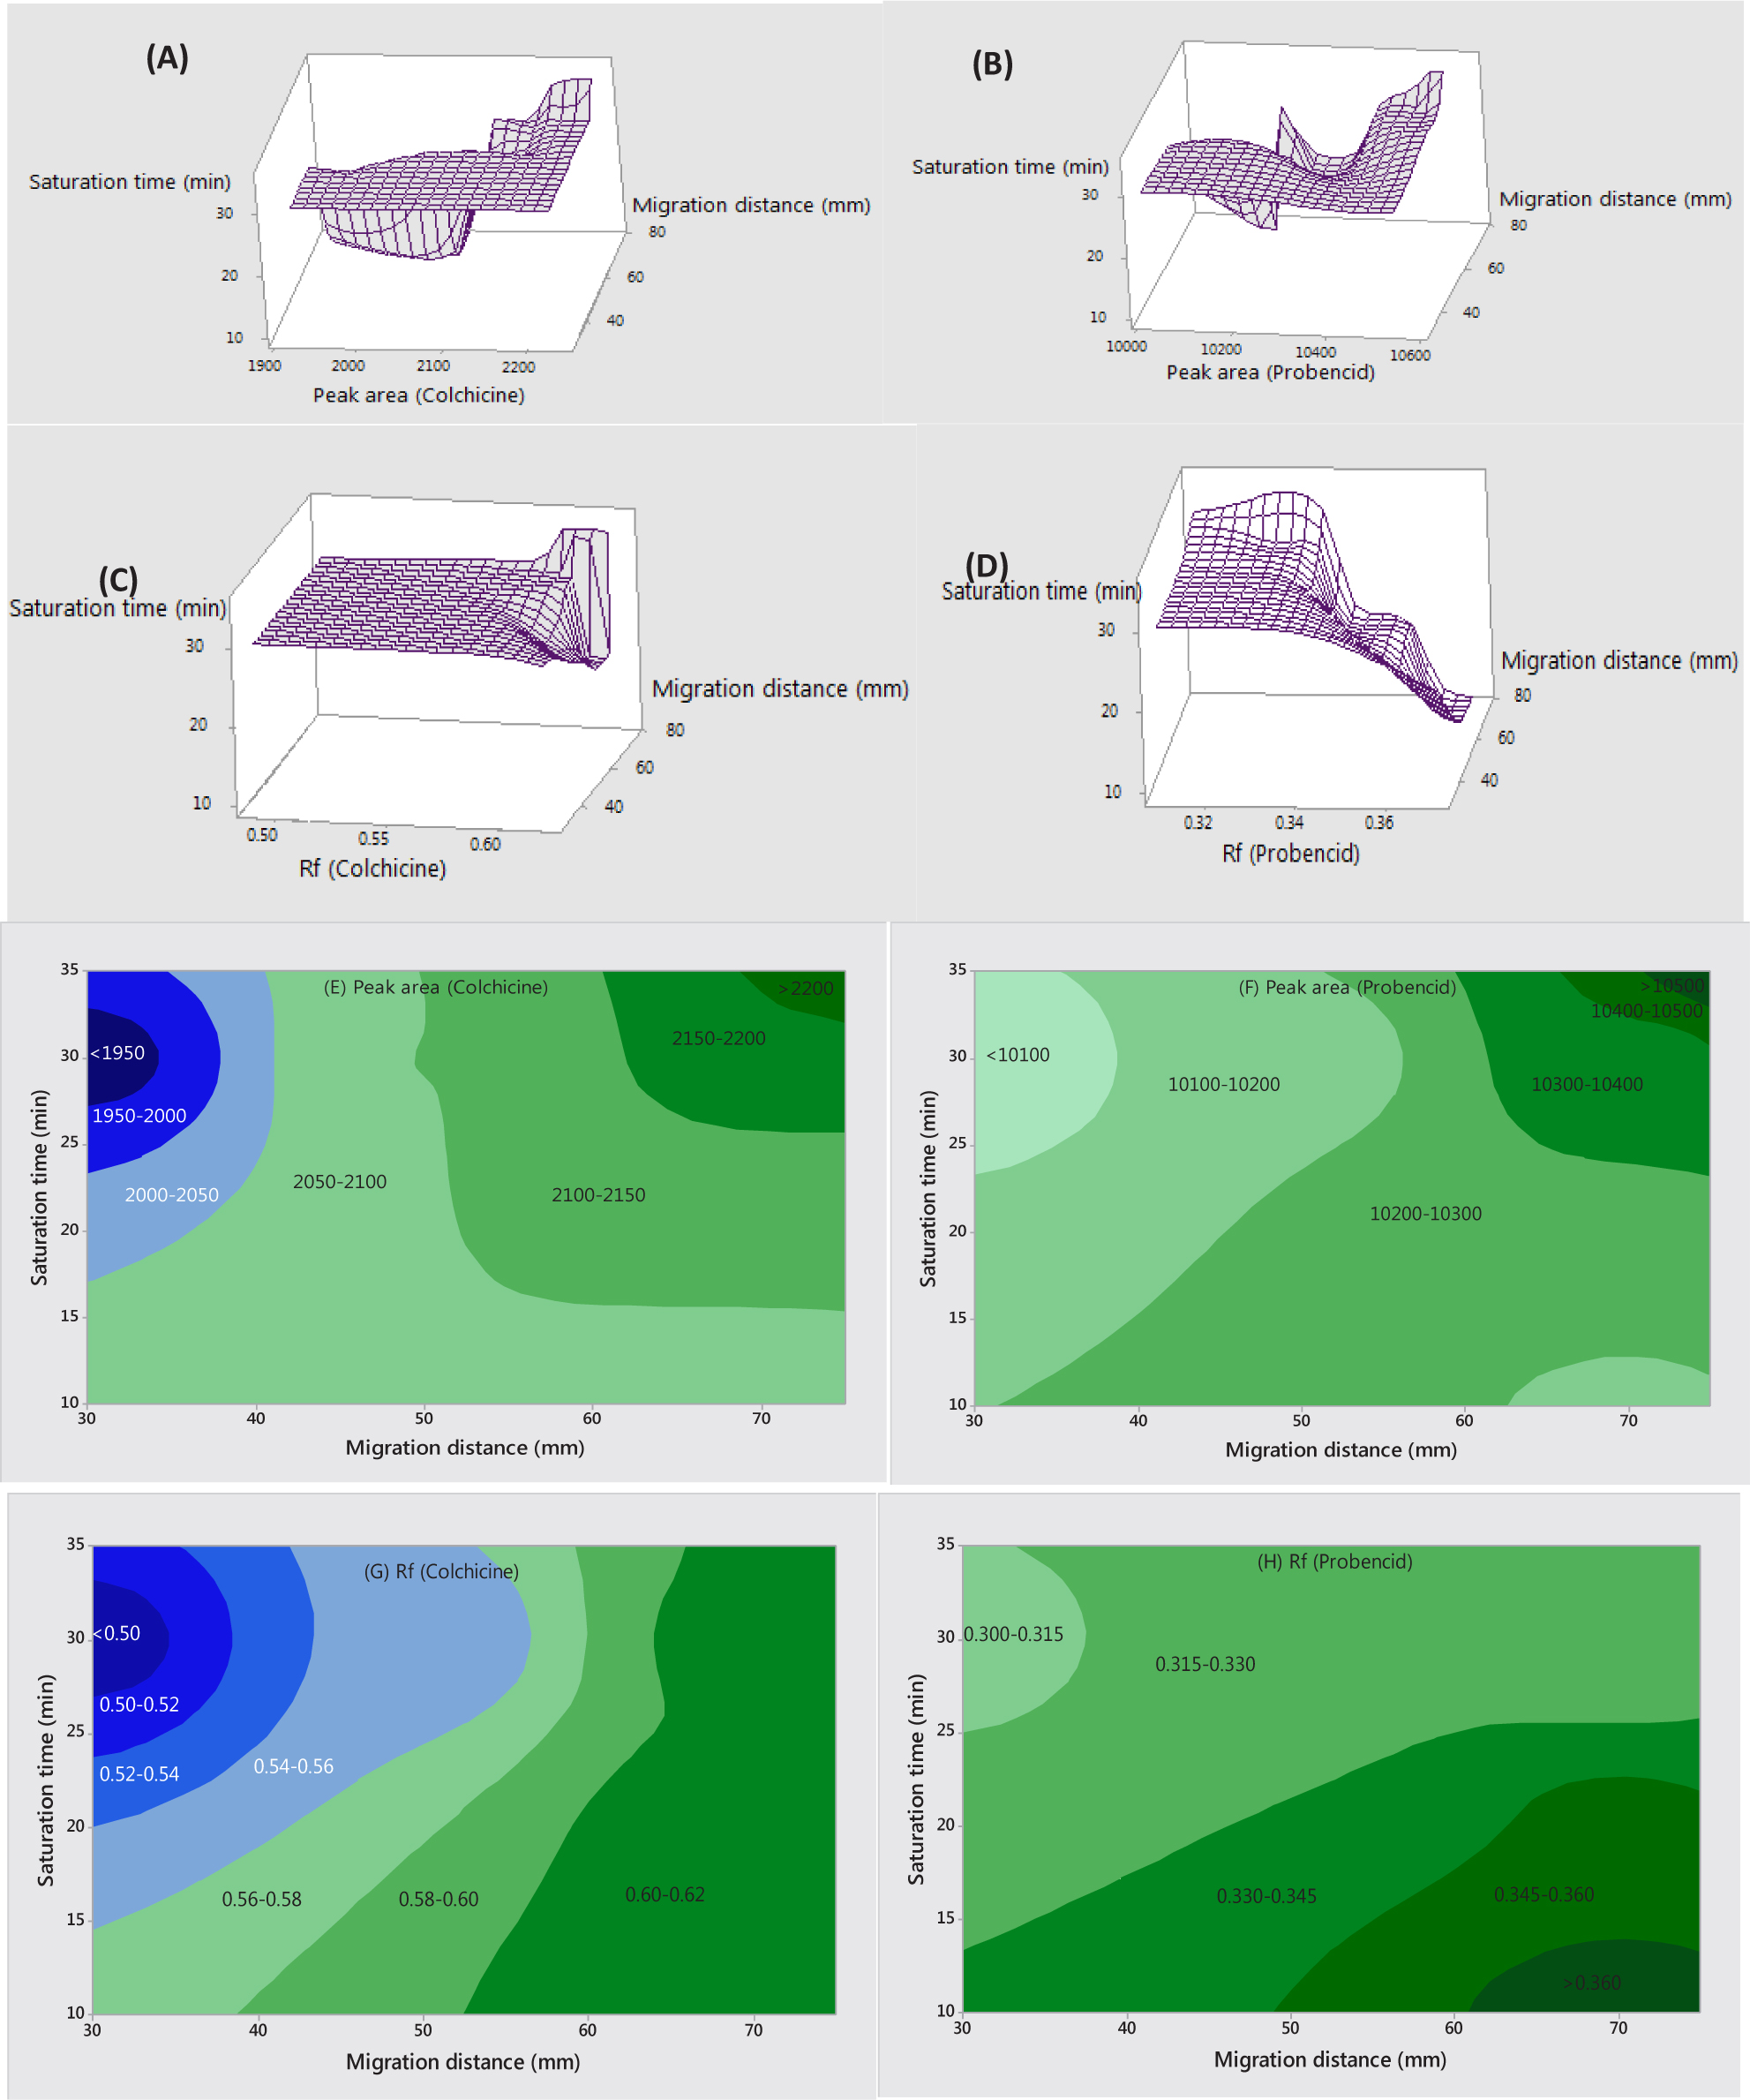
Surface and contour plots of peak area and Rf values for both colchicine and probenecid against saturation time and migration distance.
3.2.3 Migration Distance and Development Time
The migration distance throughout the study was standardized. To obtain efficient separation and good Rf values, therefore, 70 mm from the origin was selected as a migration distance for optimum separation of both drugs. This distance was attained within approximately 10 min (Figure 5).
After optimization of all variables that affect separation, it was noted that the best Rf values to quantify probenecid and colchicine were 0.33 ± 0.03 and 0.60 ± 0.03, respectively. The wavelength of 248 nm was found to be suitable for determination of both drugs simultaneously. While this wavelength is optimal for probenecid but not for colchicine, the wavelength of 354 nm is λmax for colchicine, and probenecid showed no absorption at this wavelength (spectra comparison, Figure 2). Herein, using of scanner four in the present work allowing the determination of the studied drugs at their optimal wavelengths (using dual wavelengths) simultaneously with higher sensitivity and saving efforts, time and cost. Three dimensional densitograms recorded in the multi-wavelengths were presented (Figure 1S, supplementary information).
3.3 Method Validation
The proposed method validation was performed in conformance with ICH guidelines [48]
3.3.1 Linearity and Range
Eight concentrations, with three replicates of each concentration, of colchicine and probenecid were selected to create the calibration graphs (Figures 1S and 2S). At 248 nm, the selected concentration ranges were 16–400 and 120–6000 ng/band for colchicine and probenecid, respectively (Figure 6). At 354 nm, a range of 16–400 ng/ band was selected for colchicine (Figure 7). For validation following ICH guidelines, determination of linearity ranges is required. Therefore, both linear and polynomial models were constructed. It was noted that the second order polynomial plot produced a much better fit and wider ranges (Table 2) than that of the linear model. Using the linear model, at 248 nm, r values of 0.9998 and 0.9989 were found for colchicine and probenecid, respectively, and r2 values were 0.9996 and 0.9978 for the two compounds.At 354 nm, an r value of 0.9962 and r2 value of 0.9924 were found for colchicine. Using the second order polynomial fit, at 248 nm, an r value of 0.9999 and r2 of 0.9998 were found for both compounds. At 354 nm using the polynomial fit, r was 0.9997 and r2 was 0.9994 for colchicine.Taken together, these values, as depicted in Table 2, indicate high correlation for the assay, especially in the case of the second-order polynomial fit.
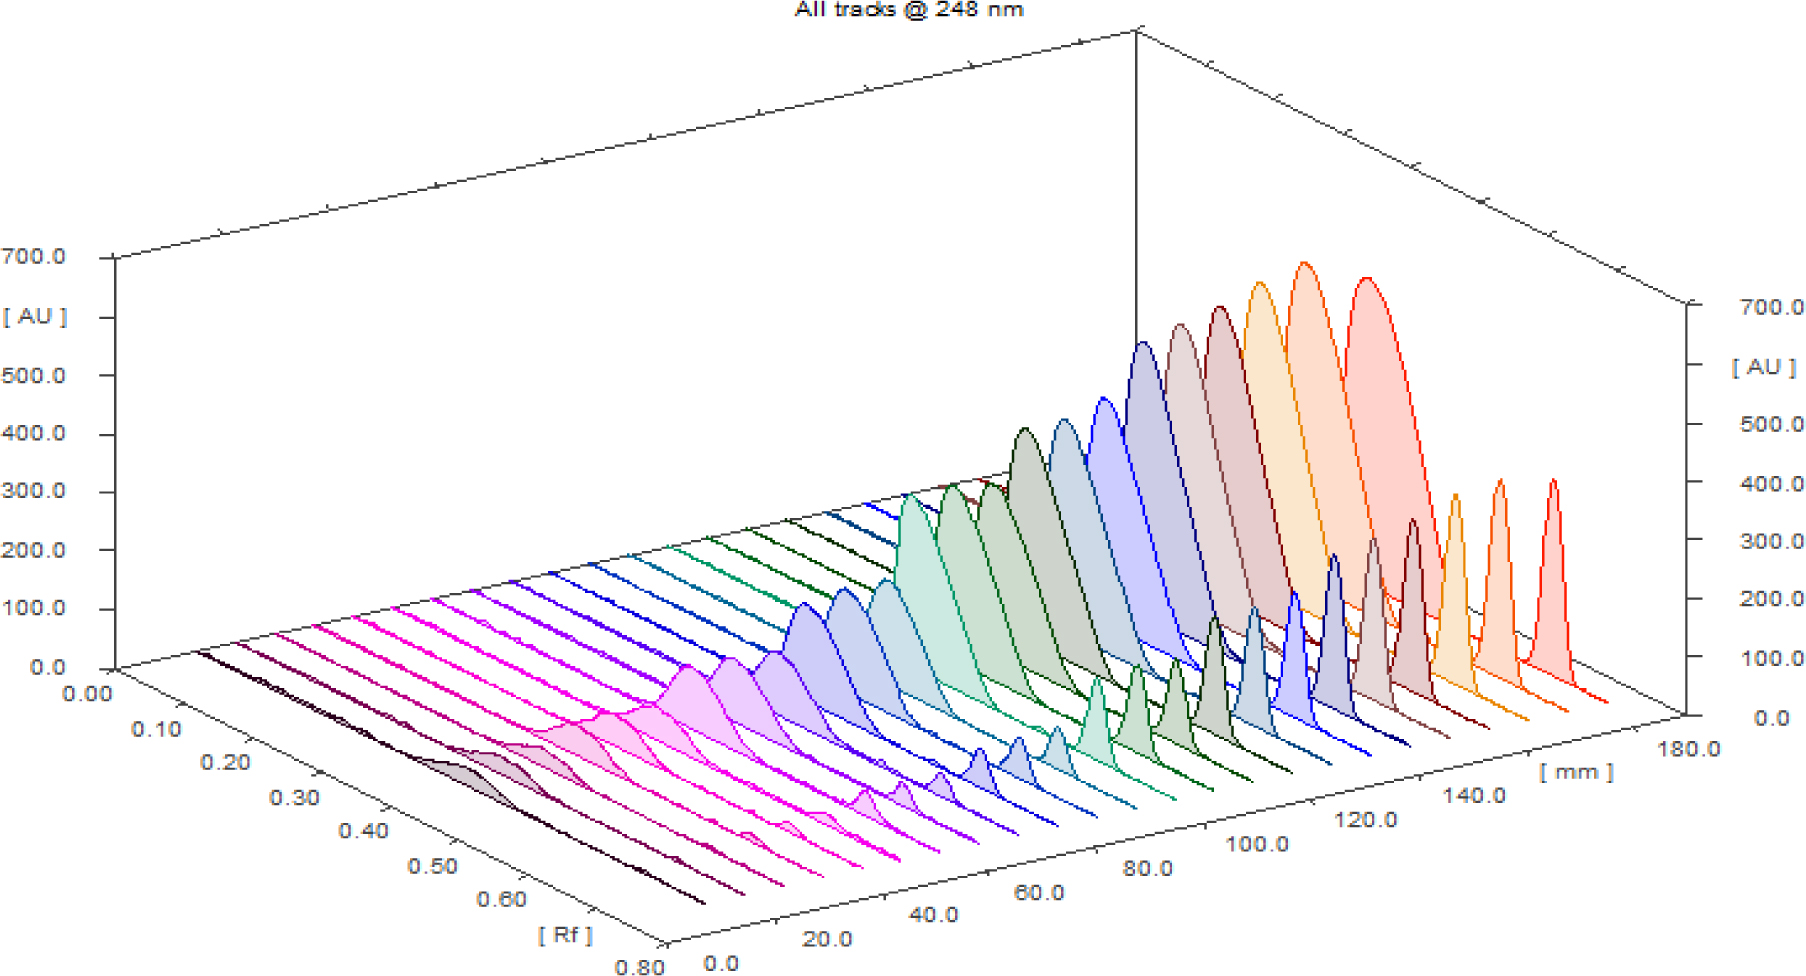
Three-dimensional chromatogram for calibrations of binary mixtures of colchicine and probenecid at concentrations ranging from 16 to 400 ng/band and from 120 to 6000 ng/band for colchicine and probenecid, respectively, at 248 nm.
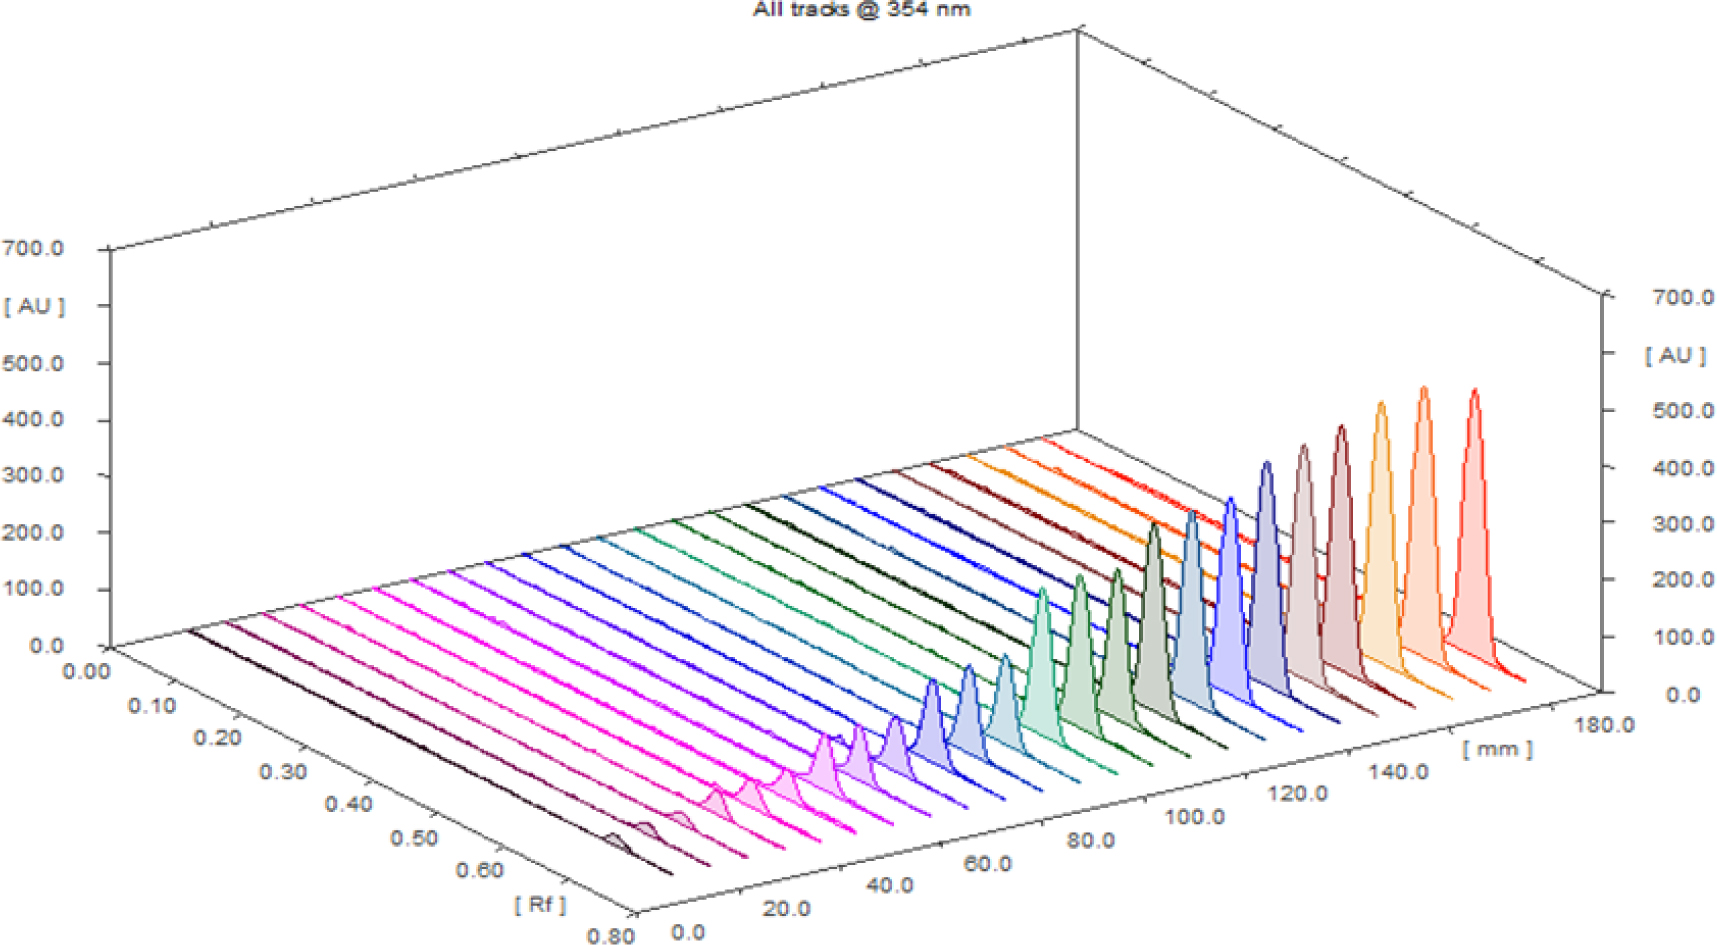
Three-dimensional chromatogram for calibration of colchicine ranging from 8 to 400 ng/ band at 354 nm.
Quantitative analytical parameters of linear and polynomial regression analysis for the studied drugs by the proposed TLC-spectrodensitometric method .[a]
| Parameter | Colchicine | Probenecid | |
|---|---|---|---|
| λmax(354 nm) | λmax(248 nm) | λmax(248 nm) | |
| Linear regression model | |||
| Experimental linearity range (ng/band) | 16 - 240 | 16 - 320 | 120 - 2400 |
| Slope (b)[a] ± SD[b] | 27.71±1.21 | 15.51±0.15 | 6.35±0.21 |
| Intercept (a)[a] ±SD[b] | 431.08±149.70 | 30.11±27.28 | 857.10±143.30 |
| Determination coefficient (r2) | 0.9924 | 0.9996 | 0.9978 |
| Correlation coefficient (r) | 0.9962 | 0.9998 | 0.9989 |
| LOD[b] (ng/band) | 17.83 | 5.81 | 74.52 |
| LOQ[b] (ng/band) | 54.03 | 17.59 | 225.82 |
| polynomial regression model | |||
| Full studied range (ng/band) | 16 - 400 | 16 - 320 | 120 - 6000 |
| Coefficient x ±SD[b] | 34.79±1.01 | 14.73±0.58 | 7.24±0.16 |
| Coefficient x2 ±SD[b] | -0.028±0.0025 | 0.0023±0.0016 | -0.0006±4.2005 |
| Intercept (a)[a] ±SD[b] | 225.91±45.82 | 64.47±22.99 | 657.12±84.08 |
| Determination coefficient (r2) | 0.9994 | 0.9998 | 0.9998 |
| Correlation coefficient (r) | 0.9997 | 0.9999 | 0.9999 |
| LOD[b] (ng/band) | 4.35 | 5.15 | 38.32 |
| LOQ[b] (ng/band) | 13.20 | 15.60 | 116.13 |
3.3.2 Detection and Quantification Limits (LOD and LOQ)
LOD and LOQ were calculated using 3.3 σ/S for LOD and 10 σ/S for LOQ. The results (Table 2) demonstrated that the method has good sensitivity for the determination of both drugs, especially when the polynomial fit is utilized. According to the results, and considering the very low concentrations of colchicine in comparison to probenecid in their fixed dose commercial combinations (probenecid is roughly 1000-fold more concentrated) [6], it became clear that the polynomial model results in optimal calculations, as it gives wider concentration ranges, higher r values and smaller LOQ values, which enables the simultaneous determination of both drugs in their fixed dose combinations. As a result of this analysis, polynomial equation data were found to be optimal for all calculations (Table 2).
3.3.3 Precision
Intra-day precision (repeatability) was determined by analyzing three concentrations in six replicates (80, 160 and 240 ng/band for colchicine and 1200, 2400 and 3600 ng/band for probenecid).Inter-day precision (intermediate precision) for both drugs was evaluated by analyzing the same three concentrations on three different days.The results (Table 3) demonstrated that RSD did not exceed 2.30%, which confirms high precision of the proposed method (Figures 3S and 4S).
Intra- and inter-day precision studies of the proposed TLC-spectrodensitometric method for the studied drugs.
| Concentration (ng/band) | Intraday precision | Interday precision | ||
|---|---|---|---|---|
| Mean area[a] | RSD[a] | Mean area[b] | RSD[b] | |
| Colchicine at 248 nm | ||||
| 80 | 2363.40 | 1.40 | 2382.90 | 2.19 |
| 160 | 4182.03 | 0.17 | 4155.20 | 0.93 |
| 240 | 5754.10 | 0.414 | 5714.50 | 2.21 |
| Colchicine at 354 nm | ||||
| 80 | 4445.50 | 0.72 | 4368.40 | 1.34 |
| 160 | 7357.01 | 0.46 | 7242.30 | 2.26 |
| 240 | 10193.90 | 0.58 | 10113.06 | 1.92 |
| Probenecid at 248 nm | ||||
| 1200 | 10184.87 | 1.73 | 10264.30 | 2.30 |
| 2400 | 14922.33 | 0.77 | 14930.78 | 0.72 |
| 3600 | 19777.80 | 1.33 | 19936.07 | 1.90 |
3.3.4 Accuracy
The accuracy of the developed method was evaluated by its application to a tablet containing both colchicine and probenecid, which was spiked with known amounts of standard colchicine and probenecid.Spiked amounts covered low, medium and high ranges of the calibration graphs. The results (Table 4) showed that the recovery ranged from 96.71±1.01% to 102.43±0.12%, which supports the high accuracy of the proposed method.
Recovery study of the proposed TLC-spectrodensitometric method for analysis of the investigated drugs.
| Claimed taker (ng/band) | Standard drug added (ng/band) | Percentage recovery ± SD[a] | RSD |
|---|---|---|---|
| Colchicine at 248 nm | |||
| 20 | 50 | 97.02±2.02 | 2.08 |
| 20 | 100 | 96.71±1.01 | 1.04 |
| 20 | 150 | 100.74±0.05 | 0.05 |
| Colchicine at 354 nm | |||
| 20 | 50 | 102.01±1.96 | 1.92 |
| 20 | 100 | 97.77±1.03 | 1.05 |
| 20 | 150 | 100.50±0.86 | 0.85 |
| Probenecid at 248 nm | |||
| 1000 | 500 | 101.89±2.13 | 2.09 |
| 1000 | 1000 | 102.43±0.12 | 0.11 |
| 1000 | 1500 | 96.88±0.03 | 0.03 |
3.3.5 Specificity and Selectivity
Upon comparison of the spectra of samples and standards for colchicine and probenecid at the peak start (s), peak apex (m) and peak end (e) positions of the band [49], the values were found to be very close to 1, as shown in Table 5, which indicates that all peaks from different peak sites were attributable to the investigated drugs. The recovery obtained upon dividing the response of samples by that of standards using the same concentration level 40 ng/band (colchicine) and 4000 ng/band (probenecid) for both sample and standard, were in the ranges of 97.78±1.37% to 98.29±2.86%, which indicates suitable peak purity and selectivity.
Peak purity and identity test for specificity evaluation of the proposed method for simultaneous determination of probenecid and colchicine.
| Solutions | Concentration (ng/band) | Wavelength (nm) | r (s, m)[a] | r (m, e)[b] |
|---|---|---|---|---|
| Colchicine standard solution | 40 | 354 | 0.9998 | 0.9999 |
| Colchicine sample solution | 40 | 354 | 0.9994 | 0.9998 |
| Colchicine standard solution | 104 | 248 | 0.9965 | 0.9999 |
| Colchicine sample solution | 104 | 248 | 0.9997 | 0.9950 |
| Probenecid standard solution | 4000 | 248 | 0.9985 | 0.9994 |
| Probenecid sample solution | 4000 | 248 | 0.9968 | 0.9989 |
Moreover, the percentage recoveries obtained by applying the standard addition method were good (96.71±1.01 to 102.43±0.12 %) (Table 4), confirming the efficiency of the proposed method for simultaneous analysis of both drugs in pure form and combined dosage form and proving the accuracy and selectivity of the developed method. Furthermore, the Rf values at the start, maximum and end of the peaks were 0.58, 0.62 and 0.66 for standard colchicine and 0.58, 0.61 and 0.66 for colchicine in its sample solutions; for probenecid, the Rf values were 0.25, 0.31 and 0.41 for its standard solutions and 0.25, 32 and 0.41 for its sample solutions (Figure 8). The obtained results therefore demonstrated no significant differences in the Rf values at a variety of positions between the compared peaks.
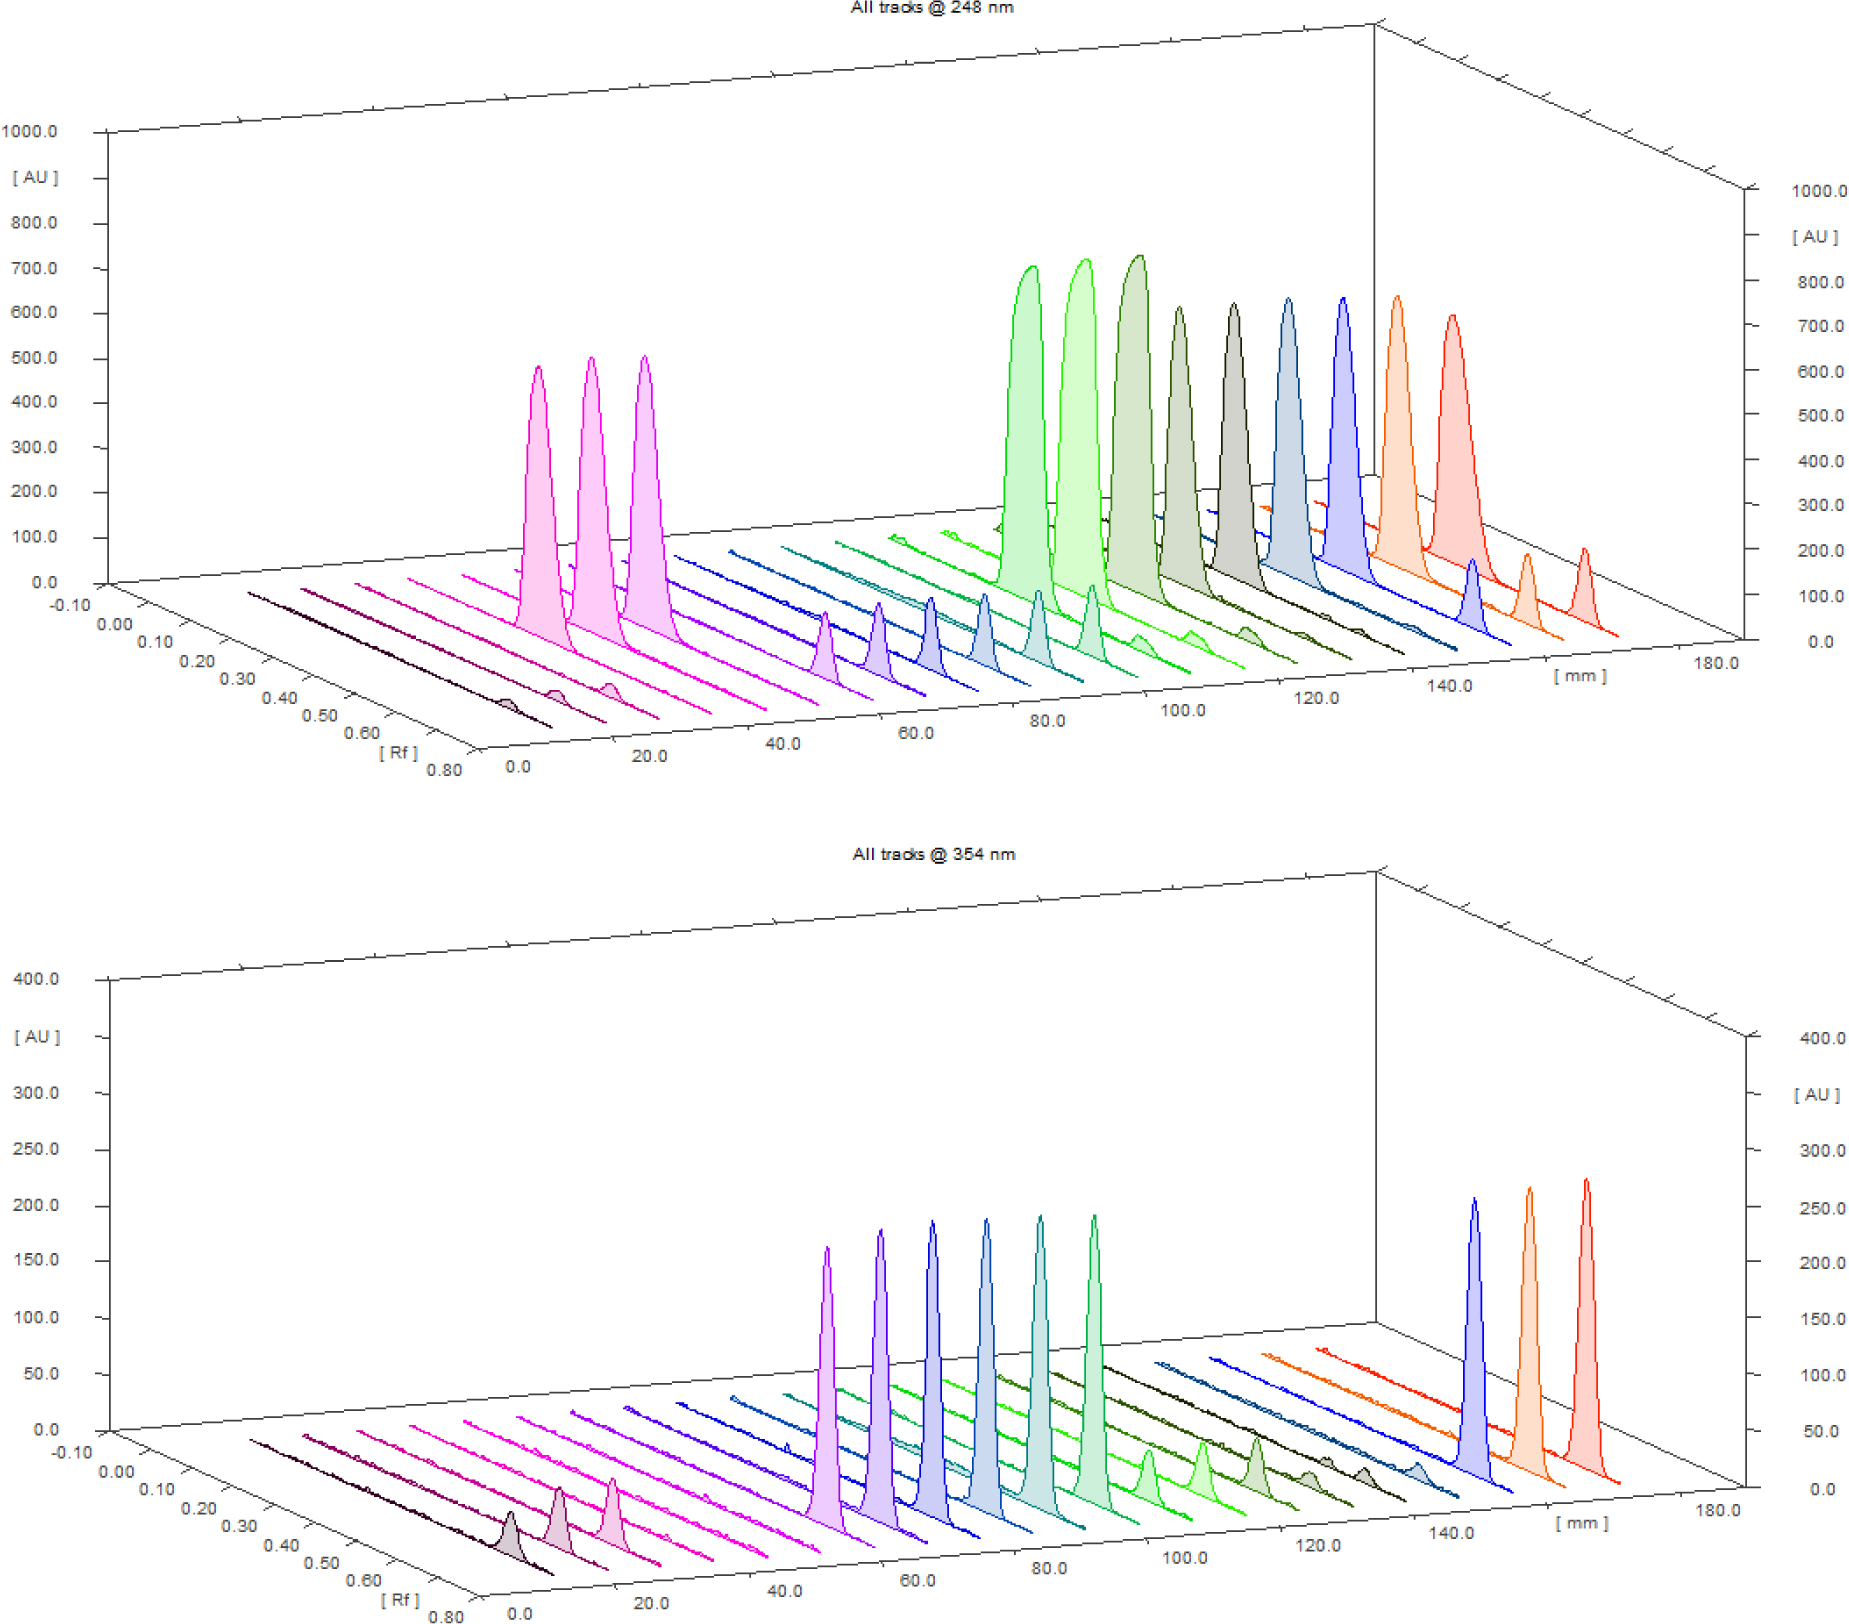
Three-dimensional TLC-densitograms to assess the application of colchicine and probenecid. Tracks 1-12 represent standard solutions, while tracks 13-21 represent the dosage form. Tracks 1, 2 and 3 include 16 ng/band standard colchicine; tracks 4, 5 and 6 include 4000 ng/band standard probenecid; tracks 7, 8 and 9 include 104 ng/band standard colchicine; tracks 10, 11 and 12 contain 100 ng/band standard colchicine; tracks 13, 14 and 15 contain 16 ng/band dosage form colchicine and 16000 ng/band dosage form probenecid; tracks 16, 17 and 18 contain 4 ng/band dosage form colchicine and 4000 ng/band dosage form probenecid; and tracks 19, 20 and 21 contain 104 ng/band colchicine (4.0 ng/band dosage form +100.0 ng/band standard) and 4000 ng/band dosage form probenecid. Measurements were taken at 248nm (top panel) and 354nm (bottom panel).
Finally, by comparing an overlay of the spectra of both standard and sample solutions for both colchicine and probenecid, it was observed that all spectra of samples and standards were superimposable, as shown in Figure 5S.
Together, all of the obtained results proved the specificity and selectivity of the developed method for the simultaneous analysis of colchicine and probenecid in their binary mixtures and commercial pharmaceutical formulations.
3.3.6 Robustness
The robustness of the method was evaluated by studying the effects of small changes in experimental variables, such as mobile phase composition, development time and saturation time, on the peak area and Rf values. Thus, slight (in the range of 10%) but deliberate changes were made in the aforementioned parameters. The small values of RSD of peak areas along with the nearly similar Rf values, together with the percentage of recovery, which ranges from 96.65±1.10 to 102.56±1.93%, all supported the robustness of the proposed method for analysis of both drugs in their co-formulation (Table 6).
Robustness of the proposed TLC-spectrodensitometric method for determination of the studied drugs.
| Parameters | Percentage recovery ± SD[a] | Rf | ||||
|---|---|---|---|---|---|---|
| Colchicine | Probenecid | Colchicine | Probenecid | |||
| At 354 nm | At 248 nm | At 248 nm | At 354 nm | At 248 nm | At 248 nm | |
| Mobile phase composition; | ||||||
| Toluene–ethyl acetate–methanol–ammonia | ||||||
| 33% (30:20:20:0.1, v/v/v/v) (Optimized) | ||||||
| (a) 33:22:22:0.1, v/v/v/v | 100.80 ±3.21 | 102.51±1.20 | 98.00±2.23 | 0.63 | 0.63 | 0.34 |
| (b) 27:18:18:0.1, v/v/v/v | 100.51±1.85 | 100.37±0.12 | 100.56±0.10 | 0.62 | 0.62 | 0.32 |
| Saturation time; 30 Min. (Optimized) | ||||||
| (a) 33 min. | 100.57±1.04 | 98.89±3.31 | 102.10±1.43 | 0.60 | 0.60 | 0.32 |
| (b) 27 min. | 100.97±2.97 | 101.10±2.23 | 101.64±2.32 | 0.63 | 0.63 | 0.34 |
| Migration distance;70 mm. (Optimized) | ||||||
| (a) 77 mm. | 102.40±1.71 | 102.56±1.93 | 99.23±0.89 | 0.63 | 0.63 | 0.33 |
| (b) 63 mm. | 96.65±1.10 | 97.80±1.14 | 100.38±2.34 | 0.60 | 0.60 | 0.32 |
3.3.7 Solution stability
To evaluate the stability of colchicine and probenecid before chromatographic development, samples of colchicine and probenecid, with concentrations of 80ng/band and 1200 ng/band, respectively, were prepared and stored at room temperature for 1, 2 and 24 h. Then, densitograms were analyzed for the appearance of any additional bands or changes in peak intensities or positions. Notably, neither were new bands observed nor did band positions change, which indicates the stability of the studied over the analysis times.
3.4 Pharmaceutical Sample Analysis
It was observed that in their fixed dose combination (Gouty less® tablets), colchicine and probenecid are found in a ratio of 1:1000, respectively. In other words, the concentration of colchicine is very low in comparison with probenecid, which makes simultaneous determination of both drugs potentially difficult. To determine if the challenges presented by the differences in amounts would negate the usefulness of the proposed method, several tests of the method were performed. Firstly, we used 4 μL from stock II to obtain 16 ng/band of colchicine and 4 μL from stock III to obtain 4000 ng/band of probenecid. By application of the standard addition method for determination of colchicine, we used 4 μL from stock IV to obtain 104 ng/band for colchicine (4.0 ng/band samples + 100.0 ng/band standard colchicine) and 4000 ng/ band for probenecid sample (Figure 8).The data obtained upon the analysis of colchicine and probenecid in either pure or pharmaceutical form (Gouty less® tablets) using the proposed TLC-spectrodensitometric method were compared with those results obtained by the reference methods (23,24).The calculated t- and F-values were lower for our method than for the tabulated results, indicating that there is no significant difference with reference to accuracy and precision (Table 7). Two dimensional TLC-densitograms of mixtures of colchicine and probenecid in fixed dosage forms are presented in Figure 9.
Determination of the studied drugs in their pharmaceutical dosage form using the proposed TLC-spectrodensitometric method.
| Pharmaceutical dosage form | Contents (mg/tablet) | Percentage recovery ± SD[a] | t-value[b] | F-value[b] | ||||
|---|---|---|---|---|---|---|---|---|
| Proposed method | Reference methods | |||||||
| Gouty less® | At 354 | At 248 | At 350 nm[24] | At 354 nm | At 248 nm | At 354 | At 248 | |
| tablets | nm | nm | & at 266 nm[23] | nm | nm | |||
| Colchicine (0.5) | 98.29±2.86 | 98.22±1.46 | 97.52±1.68[24] | 0.52 | 0.70 | 2.92 | 1.32 | |
| Probenecid (500) | - | 97.78±1.37 | 96.63±0.69[23] | - | 1.67 | - | 3.92 | |
![Figure 9 Two-dimentional TLC-densitogram of the dosage form extract containing colchicine [104 ng/band (4.0 ng/band dosage form+100.0 ng/band standard)] and probenecid (4000 ng/band), where (a) is measured at 248 nm and (b) at 354 nm.](/document/doi/10.1515/chem-2018-0050/asset/graphic/j_chem-2018-0050_fig_009.jpg)
Two-dimentional TLC-densitogram of the dosage form extract containing colchicine [104 ng/band (4.0 ng/band dosage form+100.0 ng/band standard)] and probenecid (4000 ng/band), where (a) is measured at 248 nm and (b) at 354 nm.
4 Conclusion
A novel, simple, selective and sensitive TLC-spectrodensitometric method has been developed for the simultaneous determination of colchicine and probenecid in their fixed dose combinations. The proposed method presented numerous advantages, such as enhanced sensitivity, better recovery, shorter analysis time, lower expense, larger sample capacities, need for lower amounts of solvents and simpler cleanup relative to other chromatographic methods. The developed method can be considered to be a facile alternative to existing HPLC methods that require pre-extraction steps.
Conflict of interest: Authors state no conflict of interest.
Supplemental Material: The online version of this article offers supplementary material (https://doi.org/10.1515/chem-2018-0050).
References
[1] Alison B., Martindale, The Complete Drug Reference, thirty eighth ed., London, 2014, 600-608.Suche in Google Scholar
[2] Pharmacopoeia Editorial Board of Ministry of Public Health of the People’s Republic of China, Pharmacopoeia of People’s Republic of China, vol. 2, Chemical Industry Press, Beijing, 2005, 411.Suche in Google Scholar
[3] Japanese Pharmacopoeia, Sixteenth ed. The MHLW Ministerial Notification No. 65, 2011, 675Suche in Google Scholar
[4] British Pharmacopoeia, HM Stationery Office: London, 2016, 638, 670.Suche in Google Scholar
[5] European Pharmacopoeia, sixth ed. Council of Europe: Strasbourg, 2008, 1612, 2754.Suche in Google Scholar
[6] United States Pharmacopeia 40. The National Formulary 35, US Pharmacopeial Convention: Washington, DC, 2017, 3552, 5834.Suche in Google Scholar
[7] Lo W., Krause G.M., Simultaneous Determination of Probenecid and Colchicine in Solid Dosage Form by Reversed Phase High Performance Liquid Chromatography, Drug Development and Industrial Pharm., 1987, 13, 57-66.10.3109/03639048709040155Suche in Google Scholar
[8] Sarg T.M., El-Domiaty M.M., Bishr M.M., Salama O.M., El-Gindy A.R., Thin-layer Chromatographic Scanner, Spectrophotometric and High-performance Liquid Chromatographic Methods for the Determination of Colchicine, Analyst, 1989, 114.10.1039/an9891400575Suche in Google Scholar
[9] Samanidou V.F., Sarantis G.A., Papadoyannis I.N., Development and validation of a rapid HPLC Method for the direct determination of Colchicine in pharmaceuticals and biological fluids, J. Liq. Chromatogr. Relat. Technol., 2006, 29, 1-13.10.1080/10826070500357755Suche in Google Scholar
[10] Nirmala K., Ramesh R.R., A novel method development for validation and detection of colchicine drug by RP-HPL, Rasayan J. Chem., 2012, 5, 106-111.Suche in Google Scholar
[11] Babu G.G., High-Performance liquid chromatographic determination of colchicine in pharmaceutical formulations and biological fluids, Int. J. Pharm. Pharm. Sci., 2014, 6,335-337.Suche in Google Scholar
[12] Maslarska V., Pencheva I., Determination of colchicine content in drug by RF-HPLC, Int. J. Adv.Pharm. Bio. Chem., 2014, 3, 116-119Suche in Google Scholar
[13] Harle R.K., Cowen T., Determination of Probenecid in Serum by High-performance Liquid Chromatography, Analyst, 1978, 103, 492-496.10.1039/an9780300492Suche in Google Scholar
[14] Hekman P., Porskamp P.A.T.W., Ketelaars H.C.J., Ginneken C.A.M.V., Rapid high-performance liquid chromatographic method for the determination of probenecid in biological fluids, J. Chromatogr. B, 1980, 182, 252-256.10.1016/S0378-4347(00)81632-1Suche in Google Scholar
[15] John Y.K.H., Kenneth L.D., Rapid liquid chromatographic determination of probenecid in human cerebrospinal fluid, J. Chromatogr. B, 1981, 225, 521-525.10.1016/S0378-4347(00)80307-2Suche in Google Scholar
[16] Van G.C., Brokerhof A.W., Van der Kaay M., Tjaden U.R., Mattie H., Determination of benzyl penicillin and probenecid in human body fluids by high-performance liquid chromatography, J. Chromatogr. B, 1986, 381, 65-372.10.1016/S0378-4347(00)83602-6Suche in Google Scholar
[17] Eugenia L.P., Fakhreddin J., Simultaneous determination of ketoprofen enantiomers and probenecid in plasma and urine by high-performance liquid chromatography, J. Chromatogr. B, 1991, 586,187-19610.1016/0378-4347(91)80352-DSuche in Google Scholar
[18] Campins-Falc P., Herrfiez-Hernfindez R., A. Sevillano-Cabeza, Sensitive Determination of Probenecid in Urine Samples by Reversed-Phase Liquid Chromatography and UV-Visible Detection Using Solid-Phase Extraction Techniques for Sample Clean-Up, Chromatographia, 1993, 35, 317-320.10.1007/BF02277517Suche in Google Scholar
[19] Sheng J., Song Y., Yang X., HPLC Determination of Ampicillin and Probenecid in Their Compound Capsules, Chin. J. Pharm. Anal., 2004, 24, 411-413.Suche in Google Scholar
[20] Zhao Y., He J., Liu S., Dai Q., Content Determination of Ampicillin and Probenecid in Ampicillin/Probenecid Capsules by HPLC, China Pharm., 2006, 3, 019.Suche in Google Scholar
[21] Zhao S., Huo Q., LI J., Jiang Z., Determination of ampicillin and probenecid in human serum by high performance liquid chromatography, J. Bengbu Medical College, 2011, 5, 038.Suche in Google Scholar
[22] Hiren J., Mayank B., Jigisha P., Reena P., Bhavik J., Development and validation of analytical method for simultaneous estimation of amoxycillin trihydrate and probenecid in combined dosage form, J. Chem. Pharm. Res., 2014, 6, 1212-1217.Suche in Google Scholar
[23] K.R. Sireesha, V.M. Deepali, S.S. Kadam, S.R. Dhaneshwar, Development and validation of a HPTLC method for the simultaneous estimation of Cefuroxime Axetil and Probencid, Indian J. Pharm. Sci., 2004, 66, 278-282.Suche in Google Scholar
[24] Fahim M., Mhaveer S., Kamal Y.T., Hayat M.M., Sayeed A., A high performance thin layer chromatographic method for the estimation of colchicine in different formulations, J. Pharm. Bio. Sci., 2015, 7, 260-263.10.4103/0975-7406.168021Suche in Google Scholar PubMed PubMed Central
[25] Bodoki E., Oprean R., Vlase L., Tamas M., Sandulescu R., Fast determination of colchicine by TLC-densitometry from pharmaceuticals and vegetal extracts, J. Pharm. Biomed. Anal., 2005, 37, 971-977.10.1016/j.jpba.2004.10.006Suche in Google Scholar
[26] Watson E., Wilk S., Determination of probenecid in small volumes of cerebrospinal fluid, J. Neurochem., 1973, 21, 1569–1571.10.1111/j.1471-4159.1973.tb06043.xSuche in Google Scholar
[27] Zacchei A.G., Weidner L., GLC determination of probenecid in biological Fluids, J. Pharm. Sci., 1973, 62, 1972–1974.10.1002/jps.2600621214Suche in Google Scholar
[28] Sabih K., Klaassen C.D., Sabih K., Combined GC and high resolution mass spectrometric determination of probenecid, J. pharm. Sci., 1971, 60, 745-748.10.1002/jps.2600600517Suche in Google Scholar
[29] Conway W.D., Melethil S., A gas chromatographic assay for probenecid and its metabolites in biological fluids, J. Chromatogr., 1975, 115, 222–227.10.1016/S0021-9673(00)89036-6Suche in Google Scholar
[30] Olga Z., Iuna T., Mykola I., Determination of 8 diuretics and probenecid in human urine by gas chromatography-mass. spectrometry: confirmation procedure, American J. Anal. Chem., 2012, 3, 320-327.10.4236/ajac.2012.34044Suche in Google Scholar
[31] Chaudhari S.V., Ashwini K., Anuradha A., Tandale R.S., Vavia P.R., Simultaneous UV spectrophotometric method for the estimation of cefuroxime axetil and probenecid from solid dosage forms, Indian J. Pharm. Sci., 2006, 68, 59-63.10.4103/0250-474X.22965Suche in Google Scholar
[32] Arpna P., Purnima V., Development of UV spectrophotometric method for estimation of colchicine in phosphate buffer saline pH 6.4, Int. Res. J. Pharm., 2013, 3, 87-89.Suche in Google Scholar
[33] Jain M.S., Bavaskar S.R., Barhate S.D., Fegade J.D., Simultaneous UV spectrophotometric methods for estimation of Cefadroxil and Probencid in tablet dosage form, Int.J. Drug Reg. Affairs, 2013, 1, 19-23.10.22270/ijdra.v1i3.116Suche in Google Scholar
[34] Maheta P.S., Patel P.R., Parmar R.R., Modasiya M.M.K., Shah D.A., Development and Validation of Derivative Spectroscopic Method for Simultaneous Estimation of Cefadroxil and Probenecid, Int. J. Pharm. Sci. Nanotechnol., 2014, 7, 2350-2355.10.37285/ijpsn.2014.7.1.6Suche in Google Scholar
[35] Bodoki E., Iacob B. C., Oprean R., Capillary electromigration techniques for the quantitativeanalysis of colchicine, Croat. Chem. Acta, 2011,84, 383–391.10.5562/cca1765Suche in Google Scholar
[36] Wu Y., Sun H., Effective separation and simultaneous determination of cefamandole and probenecid in body fluids by capillary zone electrophoresis with salicylic acid as an internal standard, Anal. Methods, 2013, 5, 6017–6022.10.1039/c3ay40956bSuche in Google Scholar
[37] Bishop E., W. Hussein W., Anodic voltammetry of colchicine, Analyst, 1984, 109, 623–625.10.1039/an9840900623Suche in Google Scholar
[38] Aboul Kasim E., Voltammetric behavior of the anti-inflammatory alkaloid colchicine at a glassy carbon electrode and hanging mercury electrode and its determination at PPB levels, Anal. Letters, 2002, 35, 1987-2004.10.1081/AL-120014288Suche in Google Scholar
[39] Zhang H., Electrochemistry and voltammetric determination of colchicine using an acetylene black-dihexadecyl hydrogen phosphate composite film modified glassy carbon electrode, Bioelectrochemistry, 2006, 68, 197–201.10.1016/j.bioelechem.2005.07.001Suche in Google Scholar PubMed
[40] Bodoki E., Sandulescu R. Roma L., Method validation in quantitative electrochemical analysis of colchicine using glassy carbon electrode, Central Eur. J. Chem., 2007, 5, 766–778.10.2478/s11532-007-0034-8Suche in Google Scholar
[41] E. Bodokia, S. Laschib, I. Palchettib, R. Sandulescua, M. Mascinib, Electrochemical behavior of colchicine using graphite-based screen-printedSuche in Google Scholar
[42] Wang F., Zhou J., Liu Y., Wu S., Song G., Ye B., Electrochemical oxidation behavior of colchicine on a graphene oxide-Nafion composite film modified glassy carbon electrode, Analyst, 2011, 136, 3943–394.10.1039/c1an15372bSuche in Google Scholar PubMed
[43] Stankovic D. M., Svorc L., Mariano J.F.M.L., Ortner A., Kalcher K., Electrochemical determination of natural drug colchicine in Pharmaceuticals and human serum Sample and its interaction with DNA, Electroanalysis, 2017, 29, 2276–2281.10.1002/elan.201700233Suche in Google Scholar
[44] Bhattacharyya B., Wolff J., Promotion of Fluorescence upon Binding of Colchicine to Tubulin, Proc. Nat. Acad. Sci. USA, 1974, 71, 2627–2631.10.1073/pnas.71.7.2627Suche in Google Scholar PubMed PubMed Central
[45] R. F. Cunningham, Z. H. Israili, P.G. Dayton, New spectrophotofluorometric assay for probenecid, J. Pharm. Sci. 67 (1978) 434–436.10.1002/jps.2600670351Suche in Google Scholar PubMed
[46] Mohamed A.I., Omar M.A., Hammad M.A., Mohamed A.A., Development and validation of TLC–densitometric method for simultaneous determination of two binary antihypertensive mixtures containing felodipine in fixed dose combinations, Biomed. Chromatogr., 2016, 30, 200-207.10.1002/bmc.3536Suche in Google Scholar PubMed
[47] Bernard F., Joseph S., Thin-Layer Chromatography, Techniques and Applications, third ed., Revised and Expanded, Marcel Dekker, Inc., New York, 1994, 183.Suche in Google Scholar
[48] ICH. Harmonized Tripartite Guide line, validation of Analytical Procedures: Text and Methodology, Q2 (R1). International Conference on Harmonization: Geneva, 2005.Suche in Google Scholar
[49] Renger B., Végh Z., Ferenczi-Fodor K., Validation of thin layer and high performance thin layer chromatographic methods, J. Chromatogr. A,2011, 1218.10.1016/j.chroma.2011.01.059Suche in Google Scholar PubMed
© 2018 Abdel-Maaboud I. Mohamed et al., published by De Gruyter
This work is licensed under the Creative Commons Attribution-NonCommercial-NoDerivatives 4.0 License.
Artikel in diesem Heft
- Regular Articles
- The effect of CuO modification for a TiO2 nanotube confined CeO2 catalyst on the catalytic combustion of butane
- The preparation and antibacterial activity of cellulose/ZnO composite: a review
- Linde Type A and nano magnetite/NaA zeolites: cytotoxicity and doxorubicin loading efficiency
- Performance and thermal decomposition analysis of foaming agent NPL-10 for use in heavy oil recovery by steam injection
- Spectroscopic (FT-IR, FT-Raman, UV, 1H and 13C NMR) insights, electronic profiling and DFT computations on ({(E)-[3-(1H-imidazol-1-yl)-1-phenylpropylidene] amino}oxy)(4-nitrophenyl)methanone, an imidazole-bearing anti-Candida agent
- A Simplistic Preliminary Assessment of Ginstling-Brounstein Model for Solid Spherical Particles in the Context of a Diffusion-Controlled Synthesis
- M-Polynomials And Topological Indices Of Zigzag And Rhombic Benzenoid Systems
- Photochemical Transformation of some 3-benzyloxy-2-(benzo[b]thiophen-2-yl)-4Hchromen-4-ones: A Remote Substituent Effect
- Dynamic Changes of Secondary Metabolites and Antioxidant Activity of Ligustrum lucidum During Fruit Growth
- Studies on the flammability of polypropylene/ammonium polyphosphate and montmorillonite by using the cone calorimeter test
- DSC, FT-IR, NIR, NIR-PCA and NIR-ANOVA for determination of chemical stability of diuretic drugs: impact of excipients
- Antioxidant and Hepatoprotective Effects of Methanolic Extracts of Zilla spinosa and Hammada elegans Against Carbon Tetrachlorideinduced Hepatotoxicity in Rats
- Prunus cerasifera Ehrh. fabricated ZnO nano falcates and its photocatalytic and dose dependent in vitro bio-activity
- Organic biocides hosted in layered double hydroxides: enhancing antimicrobial activity
- Experimental study on the regulation of the cholinergic pathway in renal macrophages by microRNA-132 to alleviate inflammatory response
- Synthesis, characterization, in-vitro antimicrobial properties, molecular docking and DFT studies of 3-{(E)-[(4,6-dimethylpyrimidin-2-yl)imino]methyl} naphthalen-2-ol and Heteroleptic Mn(II), Co(II), Ni(II) and Zn(II) complexes
- M-Polynomials and Topological Indices of Dominating David Derived Networks
- Human Health Risk Assessment of Trace Metals in Surface Water Due to Leachate from the Municipal Dumpsite by Pollution Index: A Case Study from Ndawuse River, Abuja, Nigeria
- Analysis of Bowel Diseases from Blood Serum by Autofluorescence and Atomic Force Microscopy Techniques
- Hydrographic parameters and distribution of dissolved Cu, Ni, Zn and nutrients near Jeddah desalination plant
- Relationships between diatoms and environmental variables in industrial water biotopes of Trzuskawica S.A. (Poland)
- Optimum Conversion of Major Ginsenoside Rb1 to Minor Ginsenoside Rg3(S) by Pulsed Electric Field-Assisted Acid Hydrolysis Treatment
- Antioxidant, Anti-microbial Properties and Chemical Composition of Cumin Essential Oils Extracted by Three Methods
- Regulatory mechanism of ulinastatin on autophagy of macrophages and renal tubular epithelial cells
- Investigation of the sustained-release mechanism of hydroxypropyl methyl cellulose skeleton type Acipimox tablets
- Bio-accumulation of Polycyclic Aromatic Hydrocarbons in the Grey Mangrove (Avicennia marina) along Arabian Gulf, Saudi Coast
- Dynamic Change of Secondary Metabolites and spectrum-effect relationship of Malus halliana Koehne flowers during blooming
- Lipids constituents from Gardenia aqualla Stapf & Hutch
- Effect of using microwaves for catalysts preparation on the catalytic acetalization of glycerol with furfural to obtain fuel additives
- Effect of Humic Acid on the Degradation of Methylene Blue by Peroxymonosulfate
- Serum containing drugs of Gua Lou Xie Bai decoction (GLXB-D) can inhibit TGF-β1-Induced Epithelial to Mesenchymal Transition (EMT) in A549 Cells
- Antiulcer Activity of Different Extracts of Anvillea garcinii and Isolation of Two New Secondary Metabolites
- Analysis of Metabolites in Cabernet Sauvignon and Shiraz Dry Red Wines from Shanxi by 1H NMR Spectroscopy Combined with Pattern Recognition Analysis
- Can water temperature impact litter decomposition under pollution of copper and zinc mixture
- Released from ZrO2/SiO2 coating resveratrol inhibits senescence and oxidative stress of human adipose-derived stem cells (ASC)
- Validated thin-layer chromatographic method for alternative and simultaneous determination of two anti-gout agents in their fixed dose combinations
- Fast removal of pollutants from vehicle emissions during cold-start stage
- Review Article
- Catalytic activities of heterogeneous catalysts obtained by copolymerization of metal-containing 2-(acetoacetoxy)ethyl methacrylate
- Antibiotic Residue in the Aquatic Environment: Status in Africa
- Regular Articles
- Mercury fractionation in gypsum using temperature desorption and mass spectrometric detection
- Phytosynthetic Ag doped ZnO nanoparticles: Semiconducting green remediators
- Epithelial–Mesenchymal Transition Induced by SMAD4 Activation in Invasive Growth Hormone-Secreting Adenomas
- Physicochemical properties of stabilized sewage sludge admixtures by modified steel slag
- In Vitro Cytotoxic and Antiproliferative Activity of Cydonia oblonga flower petals, leaf and fruit pellet ethanolic extracts. Docking simulation of the active flavonoids on anti-apoptotic protein Bcl-2
- Synthesis and Characterization of Pd exchanged MMT Clay for Mizoroki-Heck Reaction
- A new selective, and sensitive method for the determination of lixivaptan, a vasopressin 2 (V2)-receptor antagonist, in mouse plasma and its application in a pharmacokinetic study
- Anti-EGFL7 antibodies inhibit rat prolactinoma MMQ cells proliferation and PRL secretion
- Density functional theory calculations, vibration spectral analysis and molecular docking of the antimicrobial agent 6-(1,3-benzodioxol-5-ylmethyl)-5-ethyl-2-{[2-(morpholin-4-yl)ethyl] sulfanyl}pyrimidin-4(3H)-one
- Effect of Nano Zeolite on the Transformation of Cadmium Speciation and Its Uptake by Tobacco in Cadmium-contaminated Soil
- Effects and Mechanisms of Jinniu Capsule on Methamphetamine-Induced Conditioned Place Preference in Rats
- Calculating the Degree-based Topological Indices of Dendrimers
- Efficient optimization and mineralization of UV absorbers: A comparative investigation with Fenton and UV/H2O2
- Metabolites of Tryptophane and Phenylalanine as Markers of Small Bowel Ischemia-Reperfusion Injury
- Adsorption and determination of polycyclic aromatic hydrocarbons in water through the aggregation of graphene oxide
- The role of NR2C2 in the prolactinomas
- Chromium removal from industrial wastewater using Phyllostachys pubescens biomass loaded Cu-S nanospheres
- Hydrotalcite Anchored Ruthenium Catalyst for CO2 Hydrogenation Reaction
- Preparation of Calcium Fluoride using Phosphogypsum by Orthogonal Experiment
- The mechanism of antibacterial activity of corylifolinin against three clinical bacteria from Psoralen corylifolia L
- 2-formyl-3,6-bis(hydroxymethyl)phenyl benzoate in Electrochemical Dry Cell
- Electro-photocatalytic degradation of amoxicillin using calcium titanate
- Effect of Malus halliana Koehne Polysaccharides on Functional Constipation
- Structural Properties and Nonlinear Optical Responses of Halogenated Compounds: A DFT Investigation on Molecular Modelling
- DMFDMA catalyzed synthesis of 2-((Dimethylamino)methylene)-3,4-dihydro-9-arylacridin-1(2H)-ones and their derivatives: in-vitro antifungal, antibacterial and antioxidant evaluations
- Production of Methanol as a Fuel Energy from CO2 Present in Polluted Seawater - A Photocatalytic Outlook
- Study of different extraction methods on finger print and fatty acid of raw beef fat using fourier transform infrared and gas chromatography-mass spectrometry
- Determination of trace fluoroquinolones in water solutions and in medicinal preparations by conventional and synchronous fluorescence spectrometry
- Extraction and determination of flavonoids in Carthamus tinctorius
- Therapeutic Application of Zinc and Vanadium Complexes against Diabetes Mellitus a Coronary Disease: A review
- Study of calcined eggshell as potential catalyst for biodiesel formation using used cooking oil
- Manganese oxalates - structure-based Insights
- Topological Indices of H-Naphtalenic Nanosheet
- Long-Term Dissolution of Glass Fibers in Water Described by Dissolving Cylinder Zero-Order Kinetic Model: Mass Loss and Radius Reduction
- Topological study of the para-line graphs of certain pentacene via topological indices
- A brief insight into the prediction of water vapor transmissibility in highly impermeable hybrid nanocomposites based on bromobutyl/epichlorohydrin rubber blends
- Comparative sulfite assay by voltammetry using Pt electrodes, photometry and titrimetry: Application to cider, vinegar and sugar analysis
- MicroRNA delivery mediated by PEGylated polyethylenimine for prostate cancer therapy
- Reversible Fluorescent Turn-on Sensors for Fe3+ based on a Receptor Composed of Tri-oxygen Atoms of Amide Groups in Water
- Sonocatalytic degradation of methyl orange in aqueous solution using Fe-doped TiO2 nanoparticles under mechanical agitation
- Hydrotalcite Anchored Ruthenium Catalyst for CO2 Hydrogenation Reaction
- Production and Analysis of Recycled Ammonium Perrhenate from CMSX-4 superalloys
- Topical Issue on Agriculture
- New phosphorus biofertilizers from renewable raw materials in the aspect of cadmium and lead contents in soil and plants
- Survey of content of cadmium, calcium, chromium, copper, iron, lead, magnesium, manganese, mercury, sodium and zinc in chamomile and green tea leaves by electrothermal or flame atomizer atomic absorption spectrometry
- Biogas digestate – benefits and risks for soil fertility and crop quality – an evaluation of grain maize response
- A numerical analysis of heat transfer in a cross-current heat exchanger with controlled and newly designed air flows
- Freshwater green macroalgae as a biosorbent of Cr(III) ions
- The main influencing factors of soil mechanical characteristics of the gravity erosion environment in the dry-hot valley of Jinsha river
- Free amino acids in Viola tricolor in relation to different habitat conditions
- The influence of filler amount on selected properties of new experimental resin dental composite
- Effect of poultry wastewater irrigation on nitrogen, phosphorus and carbon contents in farmland soil
- Response of spring wheat to NPK and S fertilization. The content and uptake of macronutrients and the value of ionic ratios
- The Effect of Macroalgal Extracts and Near Infrared Radiation on Germination of Soybean Seedlings: Preliminary Research Results
- Content of Zn, Cd and Pb in purple moor-grass in soils heavily contaminated with heavy metals around a zinc and lead ore tailing landfill
- Topical Issue on Research for Natural Bioactive Products
- Synthesis of (±)-3,4-dimethoxybenzyl-4-methyloctanoate as a novel internal standard for capsinoid determination by HPLC-ESI-MS/MS(QTOF)
- Repellent activity of monoterpenoid esters with neurotransmitter amino acids against yellow fever mosquito, Aedes aegypti
- Effect of Flammulina velutipes (golden needle mushroom, eno-kitake) polysaccharides on constipation
- Bioassay-directed fractionation of a blood coagulation factor Xa inhibitor, betulinic acid from Lycopus lucidus
- Antifungal and repellent activities of the essential oils from three aromatic herbs from western Himalaya
- Chemical composition and microbiological evaluation of essential oil from Hyssopus officinalis L. with white and pink flowers
- Bioassay-guided isolation and identification of Aedes aegypti larvicidal and biting deterrent compounds from Veratrum lobelianum
- α-Terpineol, a natural monoterpene: A review of its biological properties
- Utility of essential oils for development of host-based lures for Xyleborus glabratus (Coleoptera: Curculionidae: Scolytinae), vector of laurel wilt
- Phenolic composition and antioxidant potential of different organs of Kazakh Crataegus almaatensis Pojark: A comparison with the European Crataegus oxyacantha L. flowers
- Isolation of eudesmane type sesquiterpene ketone from Prangos heyniae H.Duman & M.F.Watson essential oil and mosquitocidal activity of the essential oils
- Comparative analysis of the polyphenols profiles and the antioxidant and cytotoxicity properties of various blue honeysuckle varieties
- Special Issue on ICCESEN 2017
- Modelling world energy security data from multinomial distribution by generalized linear model under different cumulative link functions
- Pine Cone and Boron Compounds Effect as Reinforcement on Mechanical and Flammability Properties of Polyester Composites
- Artificial Neural Network Modelling for Prediction of SNR Effected by Probe Properties on Ultrasonic Inspection of Austenitic Stainless Steel Weldments
- Calculation and 3D analyses of ERR in the band crack front contained in a rectangular plate made of multilayered material
- Improvement of fuel properties of biodiesel with bioadditive ethyl levulinate
- Properties of AlSi9Cu3 metal matrix micro and nano composites produced via stir casting
- Investigation of Antibacterial Properties of Ag Doped TiO2 Nanofibers Prepared by Electrospinning Process
- Modeling of Total Phenolic contents in Various Tea samples by Experimental Design Methods
- Nickel doping effect on the structural and optical properties of indium sulfide thin films by SILAR
- The effect mechanism of Ginnalin A as a homeopathic agent on various cancer cell lines
- Excitation functions of proton induced reactions of some radioisotopes used in medicine
- Oxide ionic conductivity and microstructures of Pr and Sm co-doped CeO2-based systems
- Rapid Synthesis of Metallic Reinforced in Situ Intermetallic Composites in Ti-Al-Nb System via Resistive Sintering
- Oxidation Behavior of NiCr/YSZ Thermal Barrier Coatings (TBCs)
- Clustering Analysis of Normal Strength Concretes Produced with Different Aggregate Types
- Magnetic Nano-Sized Solid Acid Catalyst Bearing Sulfonic Acid Groups for Biodiesel Synthesis
- The biological activities of Arabis alpina L. subsp. brevifolia (DC.) Cullen against food pathogens
- Humidity properties of Schiff base polymers
- Free Vibration Analysis of Fiber Metal Laminated Straight Beam
- Comparative study of in vitro antioxidant, acetylcholinesterase and butyrylcholinesterase activity of alfalfa (Medicago sativa L.) collected during different growth stages
- Isothermal Oxidation Behavior of Gadolinium Zirconate (Gd2Zr2O7) Thermal Barrier Coatings (TBCs) produced by Electron Beam Physical Vapor Deposition (EB-PVD) technique
- Optimization of Adsorption Parameters for Ultra-Fine Calcite Using a Box-Behnken Experimental Design
- The Microstructural Investigation of Vermiculite-Infiltrated Electron Beam Physical Vapor Deposition Thermal Barrier Coatings
- Modelling Porosity Permeability of Ceramic Tiles using Fuzzy Taguchi Method
- Experimental and theoretical study of a novel naphthoquinone Schiff base
- Physicochemical properties of heat treated sille stone for ceramic industry
- Sand Dune Characterization for Preparing Metallurgical Grade Silicon
- Catalytic Applications of Large Pore Sulfonic Acid-Functionalized SBA-15 Mesoporous Silica for Esterification
- One-photon Absorption Characterizations, Dipole Polarizabilities and Second Hyperpolarizabilities of Chlorophyll a and Crocin
- The Optical and Crystallite Characterization of Bilayer TiO2 Films Coated on Different ITO layers
- Topical Issue on Bond Activation
- Metal-mediated reactions towards the synthesis of a novel deaminolysed bisurea, dicarbamolyamine
- The structure of ortho-(trifluoromethyl)phenol in comparison to its homologues – A combined experimental and theoretical study
- Heterogeneous catalysis with encapsulated haem and other synthetic porphyrins: Harnessing the power of porphyrins for oxidation reactions
- Recent Advances on Mechanistic Studies on C–H Activation Catalyzed by Base Metals
- Reactions of the organoplatinum complex [Pt(cod) (neoSi)Cl] (neoSi = trimethylsilylmethyl) with the non-coordinating anions SbF6– and BPh4–
- Erratum
- Investigation on Two Compounds of O, O’-dithiophosphate Derivatives as Corrosion Inhibitors for Q235 Steel in Hydrochloric Acid Solution